The big news earlier this year was the sale of HyperX which has been Kingston’s long time gaming lineup to HP. With that brand gone, they did need to make a new gaming brand for their memory and SSD product lines and they went with one of the model names of their past memory kits for something short and sweet, the new brand is called FURY. With that, they have slowly been introducing new products under the brand including their latest gaming-focused M.2 SSD that they are calling the Fury Renegade. The Renegade is a PCIe 4.0 based M.2 SSD based on the Phision E18 controller and today I’m going to check out what the new drive is all about testing it out on our recently updated Z690 test bench and test suite.
Product Name: Kingston FURY Renegade PCIe 4.0 NVMe M.2 SSD
Review Sample Provided by: Kingston
Written by: Wes Compton
Amazon Affiliate Link: HERE
|
Specifications |
|
|
Form Factor |
M.2 2280 |
|
Interface |
PCIe 4.0 NVMe |
|
Capacities |
500GB, 1TB, 2TB, 4TB |
|
Controller |
Phison E18 |
|
NAND |
3D TLC |
|
Sequential Read/Write |
500GB – 7,300/3,900MB/s 1TB – 7,300/6,000MB/s 2TB – 7,300/7,000MB/s 4TB – 7,300/7,000MB/s |
|
Random 4K Read/Write |
500GB – up to 450,000/900,000 IOPS 1TB – up to 900,000/1,000,000 IOPS 2TB – up to 1,000,000/1,000,000 IOPS 4TB – up to 1,000,000/1,000,000 IOPS |
|
Total Bytes Written (TBW) |
500GB – 500TBW 1TB – 1.0PBW 2TB – 2.0PBW 4TB – 4.0PBW |
|
Power Consumption |
500GB – 5mW Idle / 0.34W Avg / 2.7W (MAX) Read / 4.1W (MAX) Write 1TB – 5mW Idle / 0.33W Avg / 2.8W (MAX) Read / 6.3W (MAX) Write 2TB – 5mW Idle / 0.36W Avg / 2.8W (MAX) Read / 9.9W (MAX) Write 4TB – 5mW Idle / 0.36W Avg / 2.7W (MAX) Read / 10.2W (MAX) Write |
|
Storage Temperature |
-40°C~85°C |
|
Operating Temperature |
0°C~70°C |
|
Dimensions |
80mm x 22mm x 2.21mm (500GB-1TB) 80mm x 22mm x 3.5mm (2TB-4TB) |
|
Weight |
500GB-1TB – 7g 2TB-4TB – 9.7g |
|
Vibration Operating |
2.17G Peak (7-800Hz) |
|
Vibration Non-operating |
20G Peak (20-1000Hz) |
|
MTBF |
1,800,000 hours |
|
Warranty/Support |
Limited 5-year warranty with free technical support |
Photos and Features
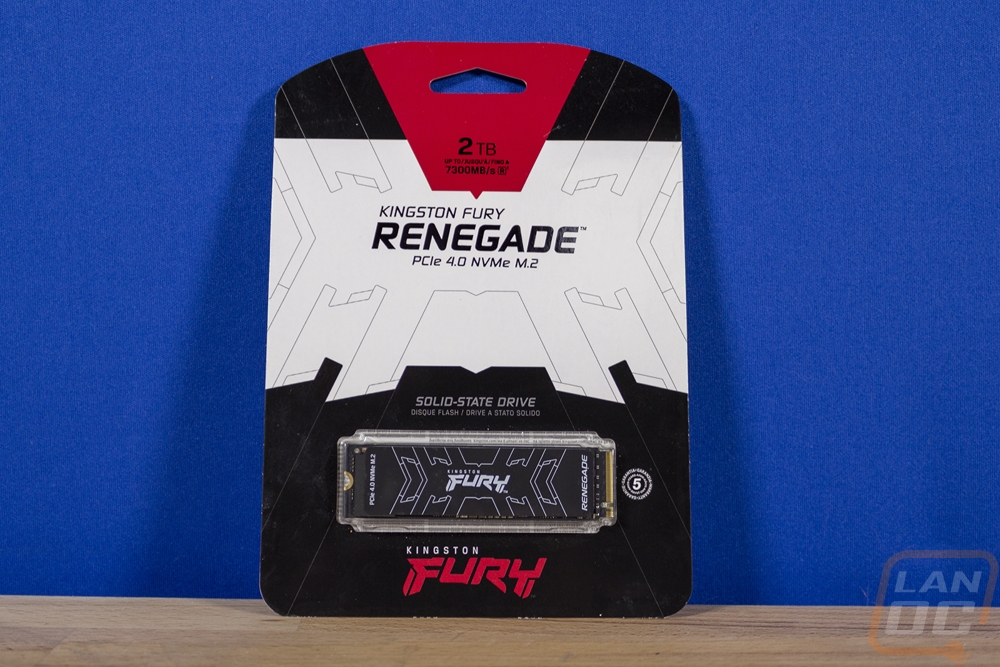
The packaging for the Fury Renegade is simple and to the point and perfect for retail. It is a hanger card with the drive itself fully visible behind plastic. The packaging has a black background with white and red on the top half. I like that the line drawings are the same design as on the drive itself. Then in the center, they have the full name including the Kingston branding and that includes information on the drive being a PCIe 4.0 NVMe M.2 drive as well. Down at the bottom they have the Kingston FURY branding repeated again with their logo and then up on top in the red they have the drive size and the estimated read speed listed. The back of the packaging is completely covered in small fine print as well as a bunch of the normally required certification logos. The barcode is on the back as well as a small window that lets you see the drive size and serial number on the sticker on the back of the drive.
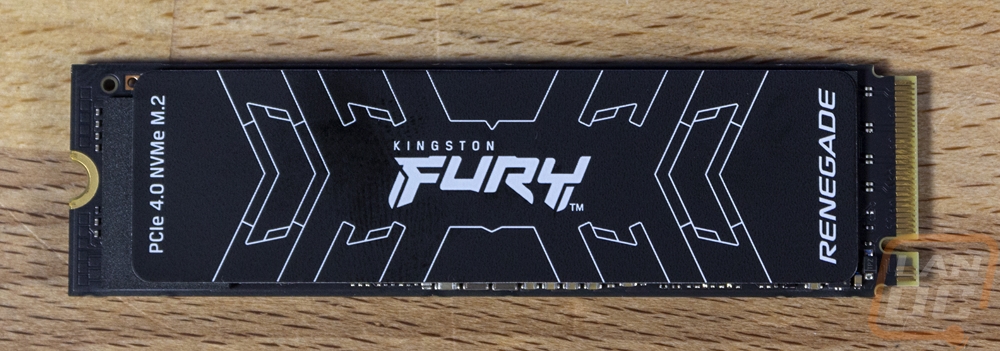
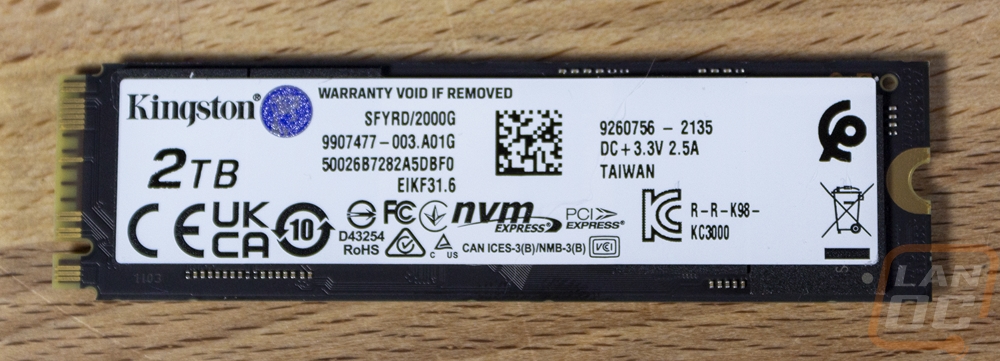
So the Fury Renegade is an M.2 2280 drive which is the standard M.2 length that you typically see. Kingston has utilized both sides of the drive on the 2TB model that they sent here. The top side has a black sticker with the Kingston Fury branding in the center along with a line design that we saw on the packaging and also a design that they have used on the top edge of the heatspreaders on past memory kits as well. This top sticker does have a metal base to it just like Sabrent drives have been doing. It isn’t a full heatsink, but the metal does function as a very thin heatspreader. The top lets you know that this is a PCIe 4.0 NVMe drive on the left side and that this is the Renegade on the right. Then on the back, they have a standard sticker type in white. The back sticker has the drive's capacity on it as well as information like the drive's serial number. About half of the sticker is also covered in the normal regulatory certification logos as well. Overall I like the black top sticker on the black PCB, ironically our test bench runs with the drives upside down so this sticker isn’t visible, but the test bench also normally has a built-in heatsink so none of this would be visible either way which is what a lot of the gaming-focused motherboard have been doing these days.
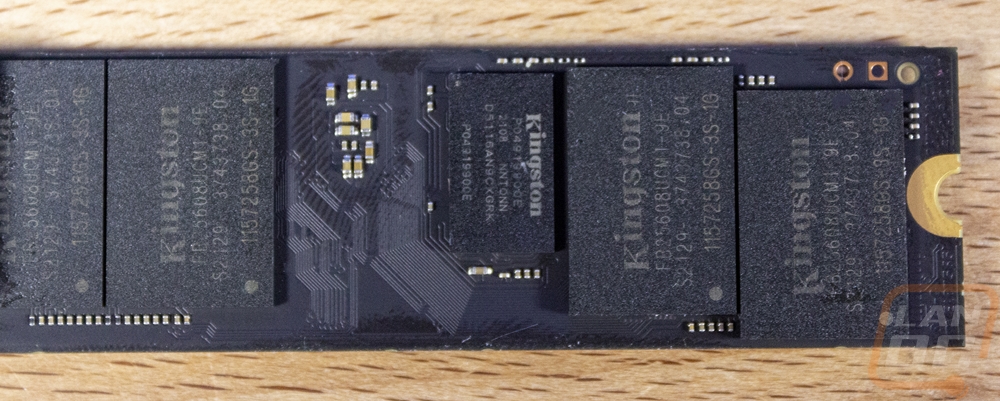
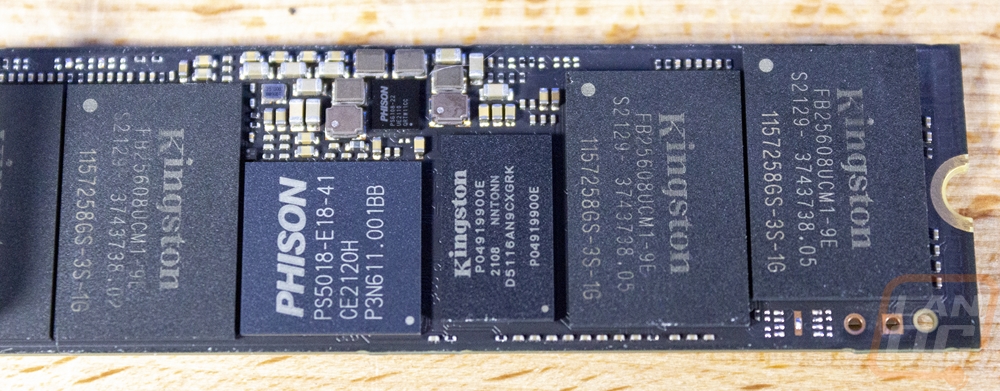
I pulled the metal-backed sticker up on the top and the regular sticker on the back so we could get a better look at the layout of the Fury Renegade as well as to see what components are used. I wouldn’t recommend taking these stickers off yourself because they never go back on the same, especially the metal one that bends. So the “top” of the drive has four NAND chips and then one memory chip in the center. The NAND are branded Kingston and have a model number of fb25608UCM1-9E listed on them. This is 176-Layer Micron 3D TLC B47R NAND even though they are branded Kingston. As the model number does hint at, each is a 256 GB chip which gives us 1TB per side of the drive. Then the memory in the center on the top side is also Kingston branded with the model number D5116AN9CXGRK. These are DDR4 running at 2666 and the drive has a total of 2GB of this cache with one on each side of the drive. The backside of the Renegade has the same four NAND chips and memory in the center in the same layout. But this side has a sixth chip which is the Phison controller sitting in the center next to the cache. Its model number is the PS5018-E18-41 which is the Phison E18 controller which is an 8 channel controller with PCIe 4.0 support and is the same controller I saw on the Rocket 4.0 Plus. Overall this is a solid combination with the E18, the Micron NAND, and having a 2GB cache.
Test Rig and Procedures
|
Testing Hardware |
Live Pricing |
|
|
Case |
Primochill Wetbench |
|
|
Motherboard |
Asus ROG Maximus Z690 Extreme |
|
|
CPUs |
Intel i9-12900K w/ PL2 set to 250W |
|
|
Ram |
Crucial 2x32GB 64GB Kit |
|
|
Power Supply |
Corsair AX1200w |
|
|
Thermal Paste |
Noctua NT-H2 |
|
|
SSD |
Sabrent Rocket Q4 2TB |
|
|
OS |
Windows 11 Pro |
|
|
Test Procedures |
|
|
CrystalDiskMark 8 |
Full CrystalDiskMark benchmark then also taking a look at the IOPS performance on both read and write RND4K Q32T1 |
|
AS SSD |
File Copy benchmark using ISO, Program, and Game settings |
|
Passmark Performance Test 10 |
Passmark storage benchmark is run using the provided score |
|
Anvil's Storage Utilities |
We run the whole SSD benchmark but only use the 4K QD16 IOPS for random read performance |
|
Queue Depth Testing |
This uses Anvil’s as well, but we run individual tests set to 4k file size at a queue depth from 1, 2, 4, 8, 16, 32, 64, and for read speeds 128 |
|
ATTO Disk Benchmark |
ATTO Disk Benchmark is run with a queue depth of 1 for both read and write file transfer speeds |
|
PCMark 10 |
PCMark 10 storage benchmarks for the Full System Drive benchmark and the Data Drive Benchmark |
|
Real World Test |
File transfer tests are done in Windows 11 using the default transfer tool. Tests are done with a folder filled with Word Documents, a folder filled with JPG and RAW photos, and a folder filled with movies |
Performance
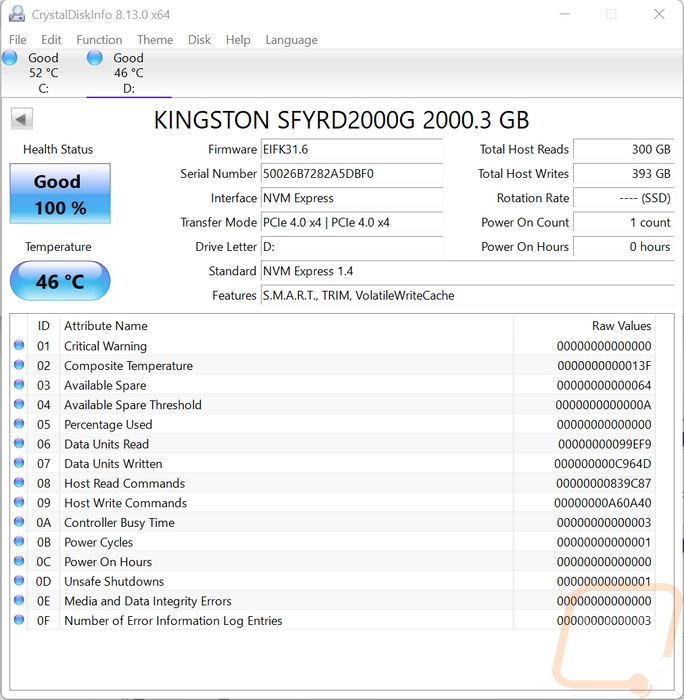
Before getting into my testing I did run CrystalDiskInfo to double check that the drive was connected at PCIe 4.0 x4 and it was. This also documents the firmware revision I am testing at as well for future reference.
Then my first round of tests were with Crystal Disk Mark 8. Here I am mostly interested in seeing the sequential read and write performance, but I did include the rest of the results. I have all of the PCIe 4.0 drives color-coded on this as orange and 3.0 drives in blue so they can be spotted and of course, the Fury Renegade I am taking a look at today is down at the bottom. The drive did well but did come in a little below the teased potential performance when testing on our new Z690 test bench running on Windows 11. The Renegade had a sequential read speed of 6592 MB/s and its write performance was much more impressive at 6899 MB/s. The read performance was right in line with the other E18 based drives that I tested but I was impressed that the write performance was WELL ahead of the other drives.
|
Crystal Disk Mark 8 - Read |
SEQ1M Q8T1 |
SEQ128K Q32T1 |
RND4K Q32T16 |
RND4K Q1T1 |
|
WD Blue SN550 1TB |
2444.53 |
2077.36 |
1075.88 |
57.88 |
|
Sabrent Rocket Q4 2TB |
4939.59 |
2871.47 |
1034.52 |
74.53 |
|
Corsair MP400 1TB |
3432.77 |
1889.56 |
713.28 |
61.42 |
|
Corsair Force MP600 2TB |
4828 |
1543.31 |
901.83 |
41.49 |
|
Sabrent Rocket 4.0 Plus 1TB |
6468.33 |
2712.53 |
455.24 |
54.68 |
|
Crucial P5 Plus 1TB |
6697.19 |
4358.63 |
1113.7 |
69.76 |
|
Kingston FURY Renegade 2TB |
6592.75 |
3093.11 |
1085.23 |
55.14 |
|
Crystal Disk Mark 8 - Write |
SEQ1M Q8T1 |
SEQ128K Q32T1 |
RND4K Q32T16 |
RND4K Q1T1 |
|
WD Blue SN550 1TB |
2007.63 |
2006.4 |
776.4 |
290.25 |
|
Sabrent Rocket Q4 2TB |
3633.71 |
2568.7 |
920.84 |
385.73 |
|
Corsair MP400 1TB |
2021.09 |
2017.63 |
1196.42 |
262.36 |
|
Corsair Force MP600 2TB |
992.38 |
982.78 |
996.22 |
276.26 |
|
Sabrent Rocket 4.0 Plus 1TB |
5241.89 |
5225.25 |
921.51 |
402.26 |
|
Crucial P5 Plus 1TB |
5025.83 |
4880.38 |
884.12 |
240.78 |
|
Kingston FURY Renegade 2TB |
6899.76 |
5831.06 |
1083.12 |
367.6 |
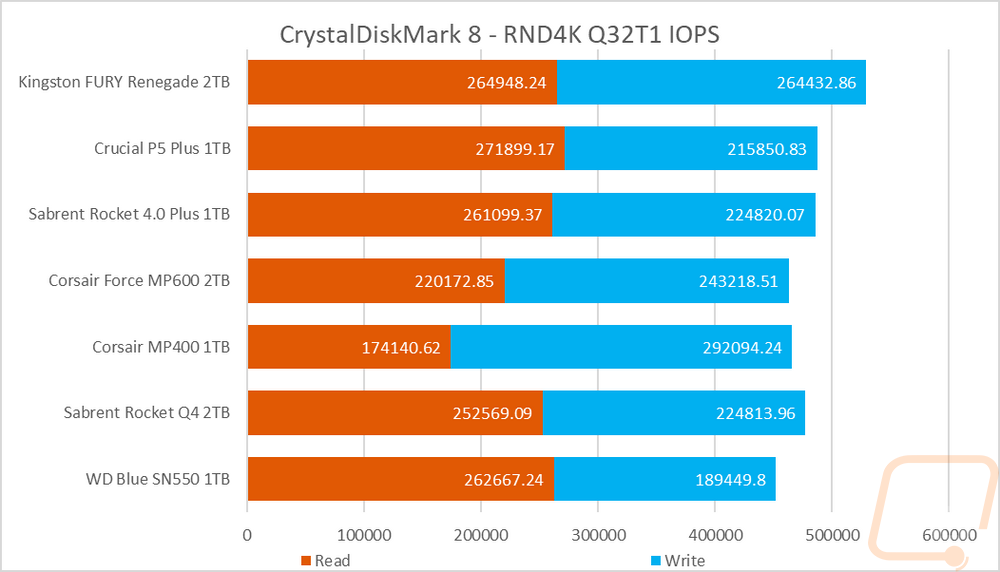
While testing in CrystalDiskMark 8 I did also check out the drive’s IOPS performance with the random 4k queue depth of 32 and 1 thread results. I stacked the read and write performance together here because I do believe that the overall drive performance is important, not just one result or the other. The Renegade came in a little behind the P5 Plus on the read side, just like in the standard CDM results but the write performance was the second highest of the drives tested. The combination of the two has the Fury Renegade out in front of the other drives.
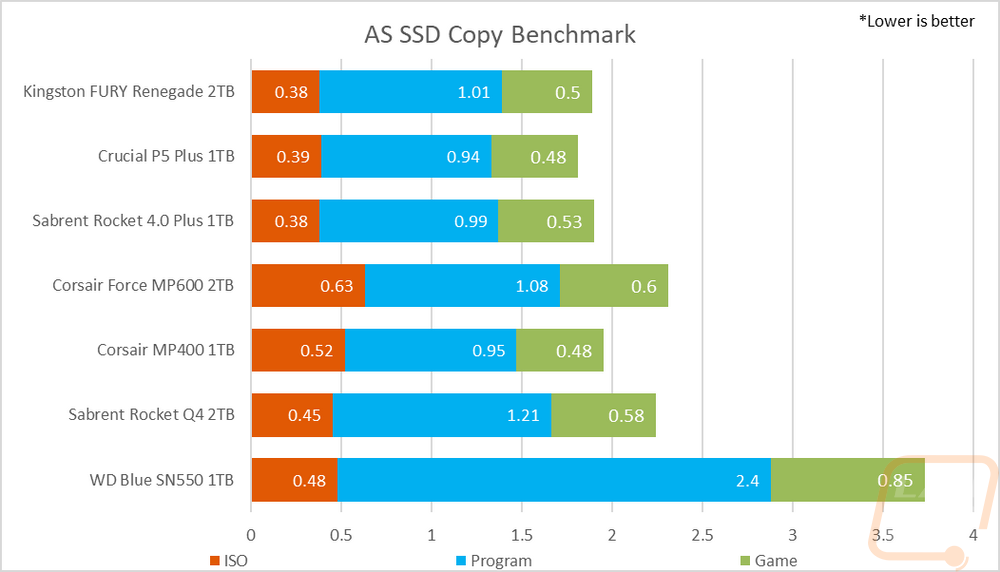
My next test was in AS SSD, but because the standard test in AS SSD is very similar to the CrystalDiskMark tests I prefer to check out one of its sub-tests, the copy benchmark. This moves three files, one that is an ISO, one that is a program, and then a game and times how long each takes. With these being timed, lower is better here. I have all three results stacked to see which drives are best overall. The Fury Renegade did well here but wasn’t the fastest of the PCIe 4.0 drives that I have tested. It was right in line with the ISO but a little slower on the program file putting it ahead of the Rocket 4.0 Plus but behind the Crucial P5 Plus.
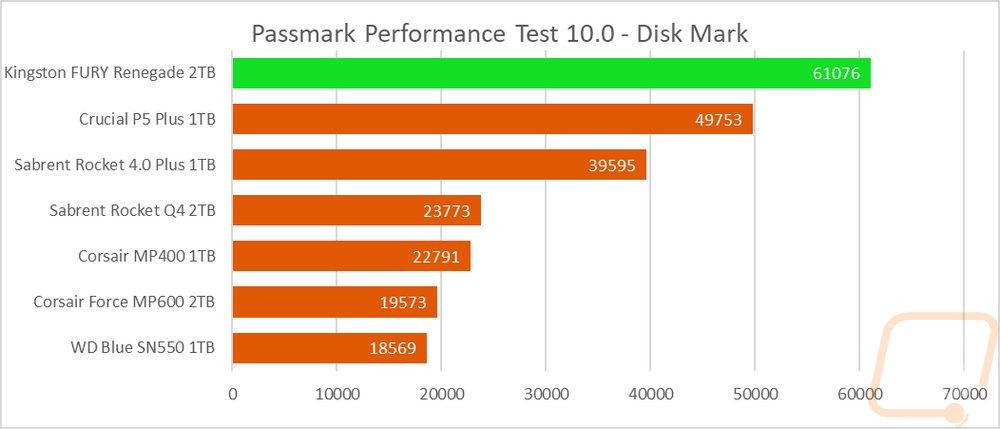
Next up with PassMark Performance Test 10 I ran their combined synthetic benchmark to get a look at their DiskMark rating. Here the Renegade topped the chart with the P5 plus and Rocket 4.0 Plus also out ahead of the crowd but the Renegade way out in front still.
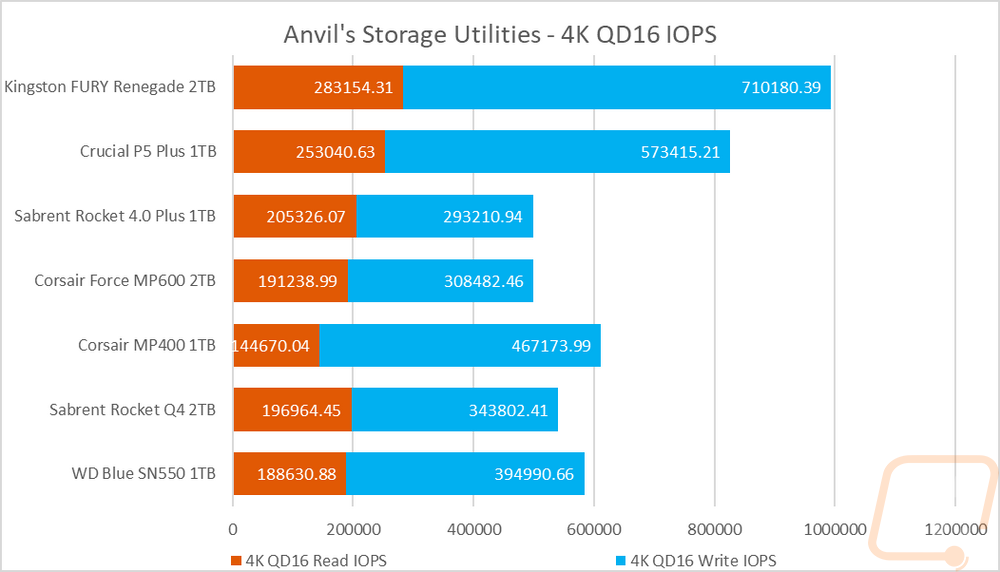
Next up I have another look at IOPS, this time though it is when testing with Anvil’s Storage Utilities. This time at 4k with a lower queue depth of 16. Here the Fury Renegade was the fastest tested in both the read and write tests. The read IOPS were 283154 which were 30K higher than the P5 Plus. But on the write IOPS, the renegade really stepped things up with 710180 IOPS.
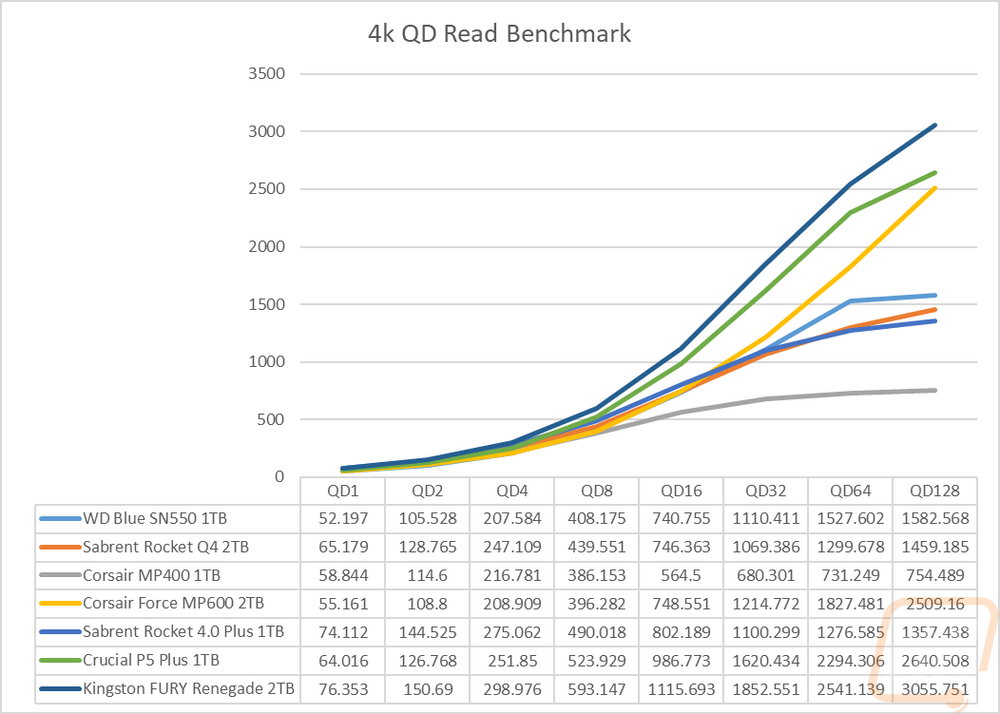
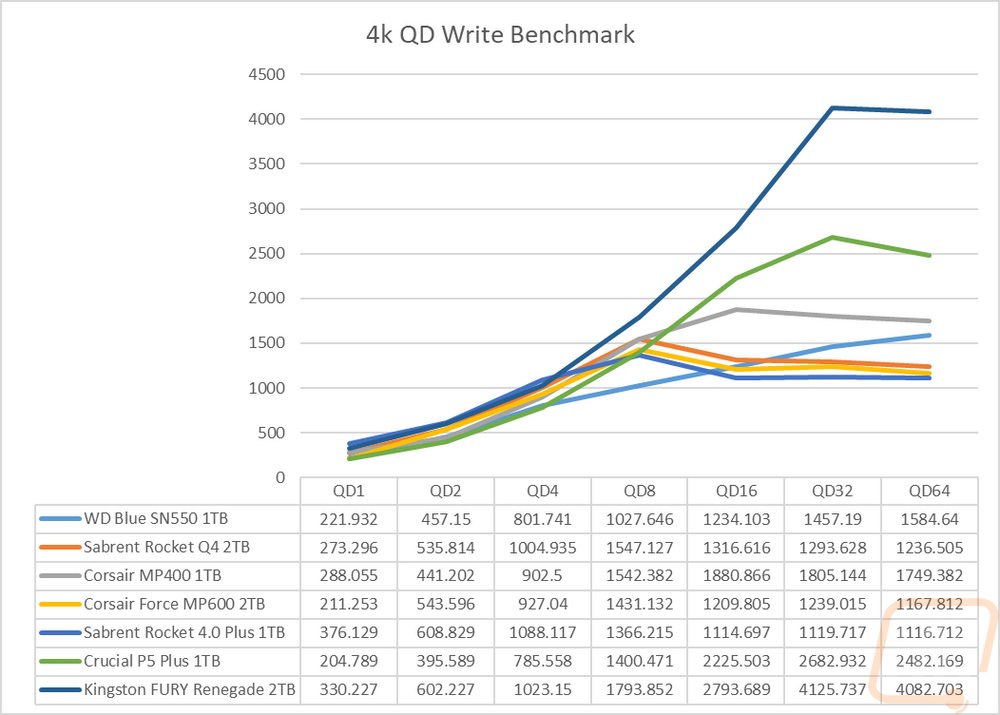
Sticking with Anvil’s Storage Utilities I did a few more tests. Here I wanted to check out how the drive would react to different queue depths so with the file size set to 4K I ran tests ramping up double each time starting at 1 and up to 128 for reads and 64 for writes. This lets us see if the controller gets overloaded. For the read queue depth tests the Renegade did well, being slightly faster at the lower end and ramping up consistently up to a queue depth of 16 then still improving but at a slower rate the rest of the way. The Renegade didn’t drop or level off however like a lot of the other drives. For the write tests, it ramped up doubling each time up until the 32 queue depth test and dropped slightly at a queue depth of 64 but as you can see the Renegade was so far ahead of the competition that they never got close.
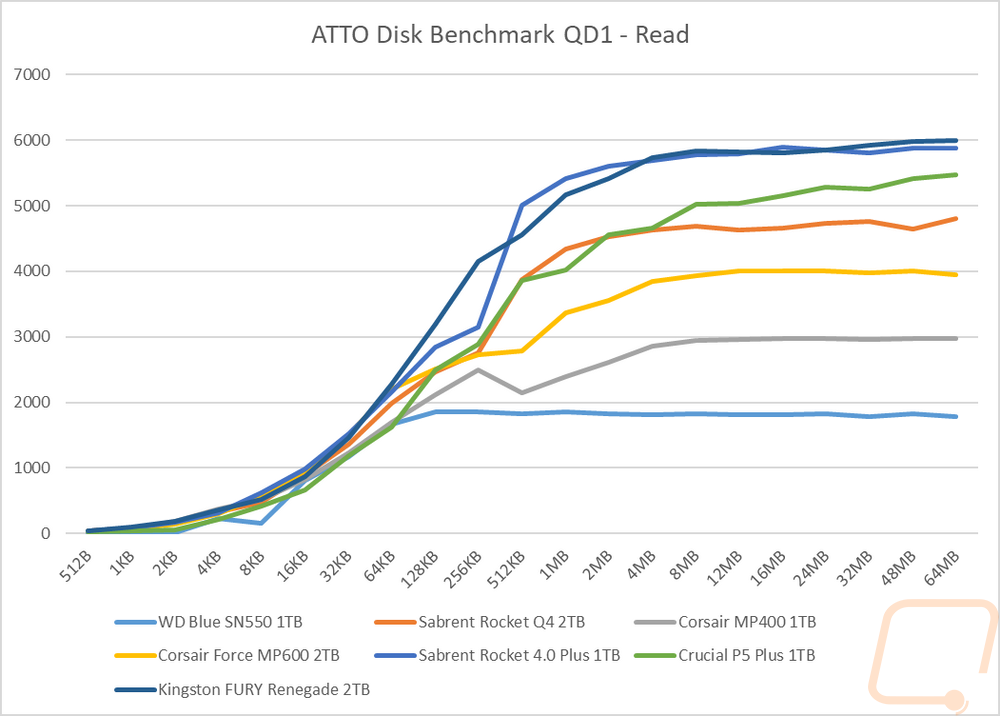
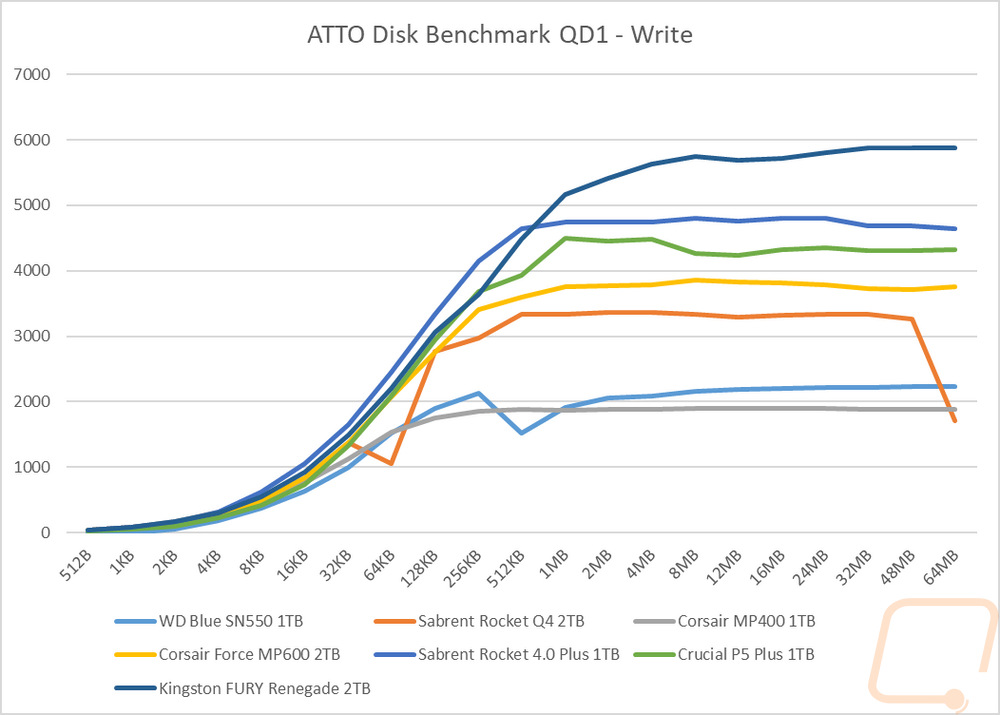
This next test is new in our test suite. I used ATTO Benchmark set to a queue depth of just 1 but ramped up the file size slowly to see how it would affect performance. Up until just before the halfway point at 256KB for the read tests the Renegade stayed out in front of the other drives but the Rocket 4.0 Plus did jump up ahead of it at 512KB and then they ran together from 4MB on. Up in the 6000 MB/s range. For the write results, it was the other way around. The Renegade was a little behind up until the mid way point where it jumps out in front of all of the other drives and is over 1000 MB/s faster than anything else from 1MB on up with the write results also being near 6000 MB/s.
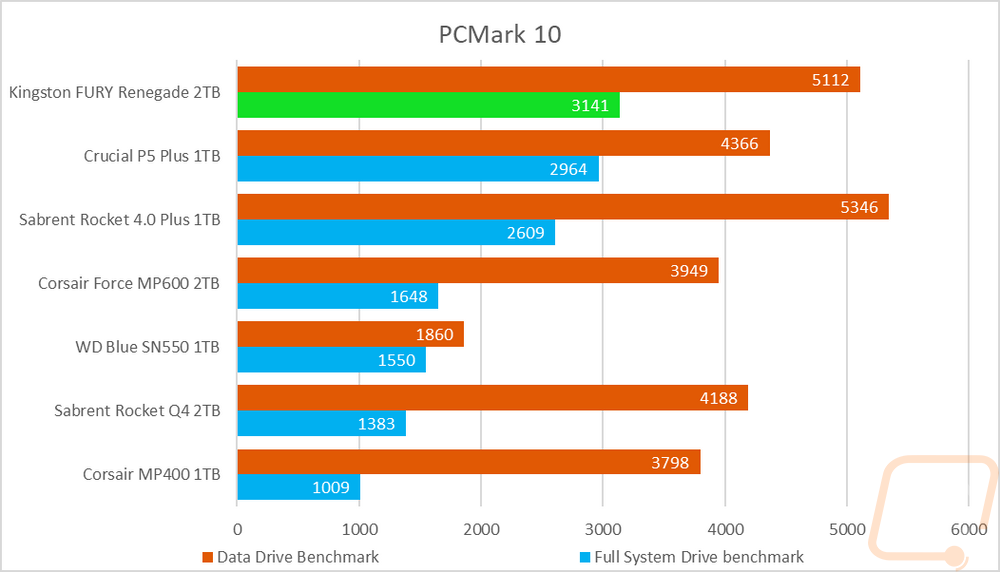
Next up I wanted to look at more real-world performance and for this, I started with PCMark 10 which has an overall full system benchmark for storage and then one focused on data storage drives. In the full system drive benchmark, the Renegade was at the top of the chart out ahead of the P5 Plus. But on the data drive benchmark the Rocket 4/0 Plus does pull ahead putting the Renegade in second.
Next, up for more real-world resting, I did our file transfer tests. You don’t get any more real-world than this. For each drive, I copied the folder filled with files to the drive tested and then back to the Rocket Q4 in our test bench. I used three file types, movies which are large single files, a folder filled with RAW and JPG photos, and then a folder filled with word documents. The Fury Renegade did well with the large movie files but was the second fastest drive tested. Moving them back to the PC on the other hand was at the top of the chart. For the mid-sized pictures, the P5 Plus and the Rocket 4.0 Plus were both a little faster than the Renegade but the drive did the best of the 4.0 drives when moving back to the PC. Then for the documents moving the files to the Renegade were slower, running closer to the 3.0 drives but again was fast moving the files back to the PC. Overall the Renegade was a little slower than expected in these tests, but when I say that I only mean in comparison to the other E18 drives. It is still a fast drive compared to the rest.
|
Windows 11 File Transfers |
Movies to Drive |
Movies to PC |
Pictures to Drive |
Pictures to PC |
Docs to Drive |
Docs to PC |
|
WD Blue SN550 1TB |
852 |
1360 |
937 |
1001 |
2.42 |
5.32 |
|
Sabrent Rocket Q4 2TB |
2720 |
2060 |
1140 |
1030 |
5.75 |
5.2 |
|
Corsair MP400 1TB |
2140 |
875 |
996 |
1410 |
2.57 |
5.98 |
|
Corsair Force MP600 2TB |
1250 |
1330 |
816 |
1320 |
2.83 |
5.48 |
|
Sabrent Rocket 4.0 Plus 1TB |
2120 |
2960 |
254 |
842 |
1.63 |
5.16 |
|
Crucial P5 Plus 1TB |
2060 |
2720 |
1030 |
1140 |
5.2 |
5.75 |
|
Kingston FURY Renegade 2TB |
2330 |
3220 |
857 |
1270 |
2.58 |
5.88 |
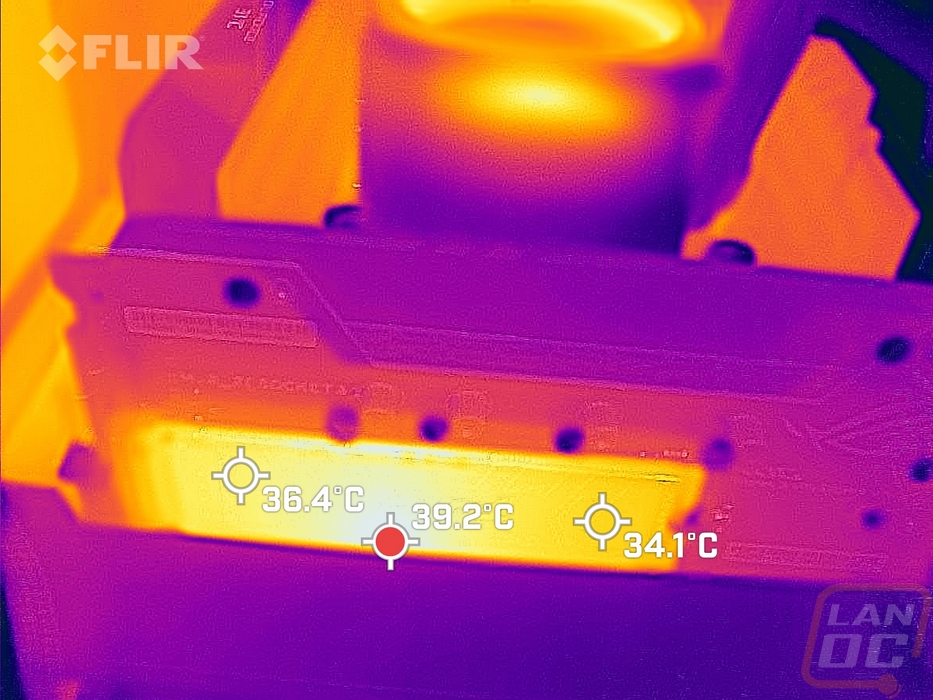
Last up I did take a look at the overall thermals of the Fury Renegade. For this I used out Flir and to heat things up I ran AIDA64’s disk benchmark with a linear read for 20 minutes. The metal backed sticker on the top of the drive does do a decent job of spreading the heat around as most of the drive has an even temperature. The hottest area is in the center of course near the controller but that is on the backside of the drive compared to this angle.
Overall and Final Verdict
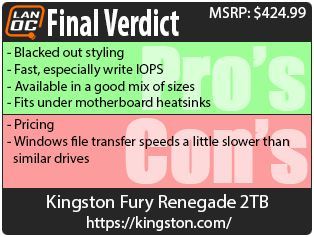
Well, I would say that Kingston has a solid introduction to their new Fury brand on the storage side with the Fury Renegade. The drive came in at the top of the charts on a majority of the tests I ran, outperforming multiple other Phison E18 based drives even. This was especially true when it comes to write performance and write IOPS where the drive really stands out. The only performance issues I ran into were when doing file transfers inside of Windows 11 and even then it was still fast, but just a little behind drives like the P5 Plus and Rocket 4.0 Plus at times. Kingston hasn’t lost their touch as far as styling goes, the all blacked out look is sharp and simple at the same time and they have kept the drive easy to install into most motherboards which now almost always have built-in heatsinks for their main M.2 slots by not going with built-in heatsinks beyond the thin metal backing to the front sticker. The Fury Renegade is available in drives as small as 500 GB and then at 1TB, 2TB, and 4TB. This covers most of what people will be interested in.
The Fury Renegade in the 2TB version that I tested here is currently $435 at Newegg and $424 on Amazon. But for comparison, the Crucial P5 Plus and Sabrent Rocket 4.0 Plus that I tested against it are both over $100 less currently which makes the pricing on the Renegade a little hard to swallow. Pricing, however, does change over time, so I will say that the Fury Renegade is a solid pickup, assuming it is pricing competitively which right now as of this review it isn’t. Kingston hasn’t missed a step however with the move from the sale of HyperX to the new gaming brand Fury.

Live Pricing: HERE
