Performance
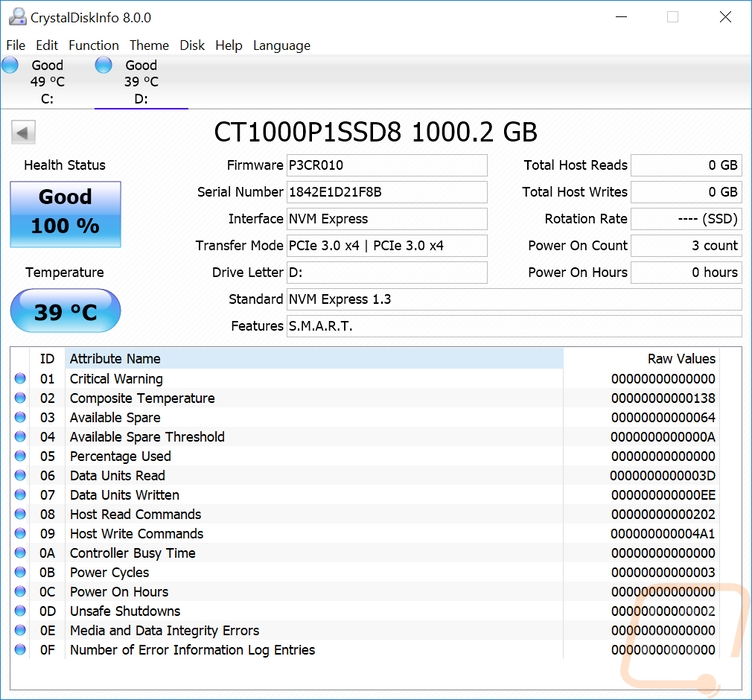
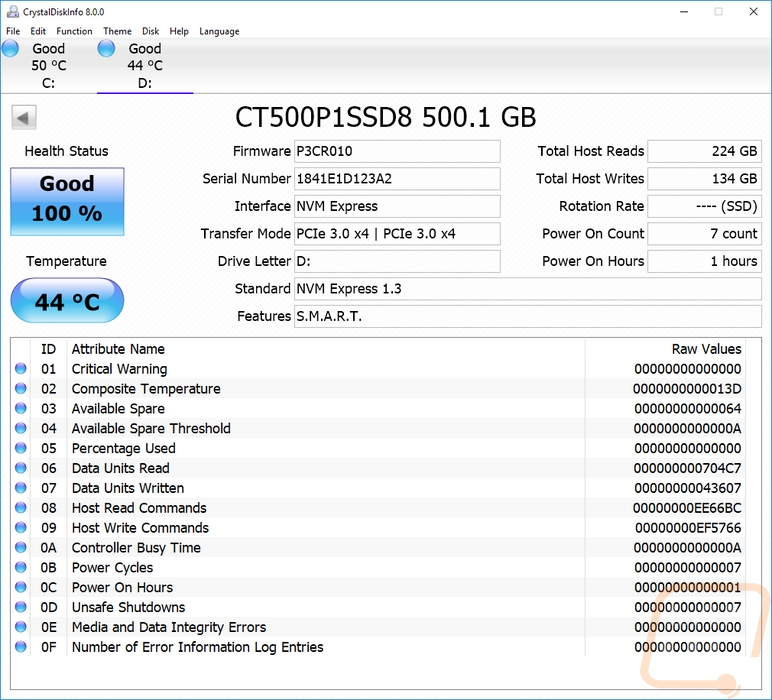
Before getting too far into testing I did run CrystalDiskInfo on both drives too. This is mostly just to document the firmware version they were tested on. You can see that the 500GB I had already done some testing but the 1TB drive hadn’t been tested at all other than being powered on a few times when getting it all set up. I did all of the testing on our GPU test bench with the Rampage VI Apex motherboard. You can see all of the information on that configuration and our test procedures on the previous page.
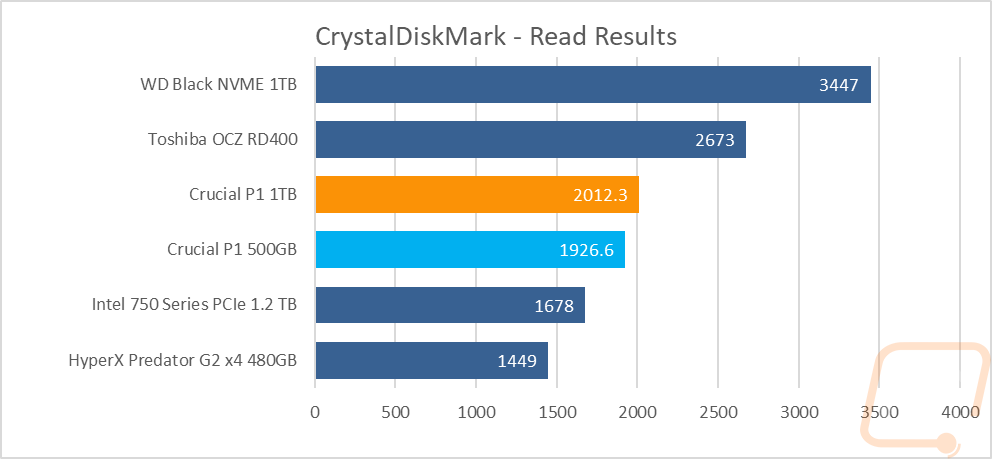
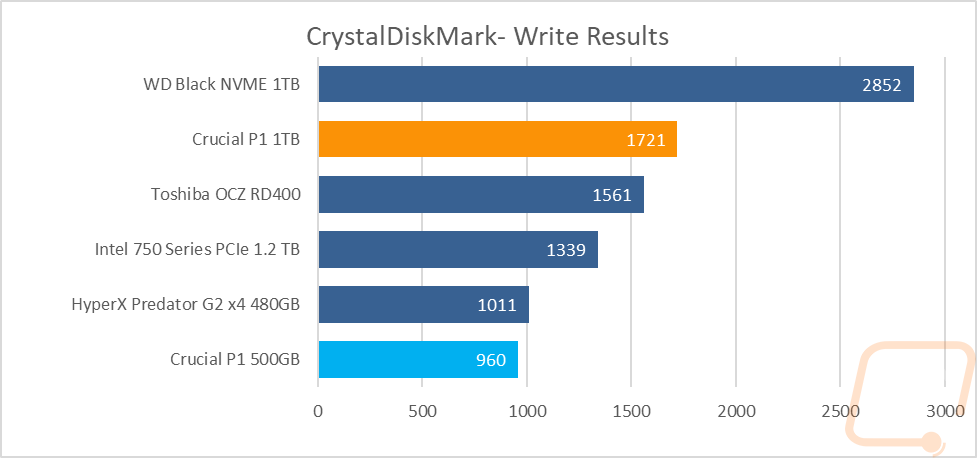
My first set of tests were to look at your basic sequential read and write speeds. These were done in Crystal Disk Mark and it is important to note that CrystalDiskMark does run each test multiple times so in addition to the normal SLC write caching, it is possible that the drive caught on to the multiple uses and kept some of the data on the faster SLC cache rather than the QLC NAND. That said, both the 1TB and 500GB P1 drives came in close to the 2000MB/s read speed range. This as you can see it far from what the top end of the NVMe market is currently doing but is also faster than the early NVMe drives. As for write speeds, well here the 1TB P1 drive was significantly faster than the 500GB model. The difference put the 1TB model up close to the top (but with still a long way to go to match the WD Black) and the 500GB P1 down at the bottom.
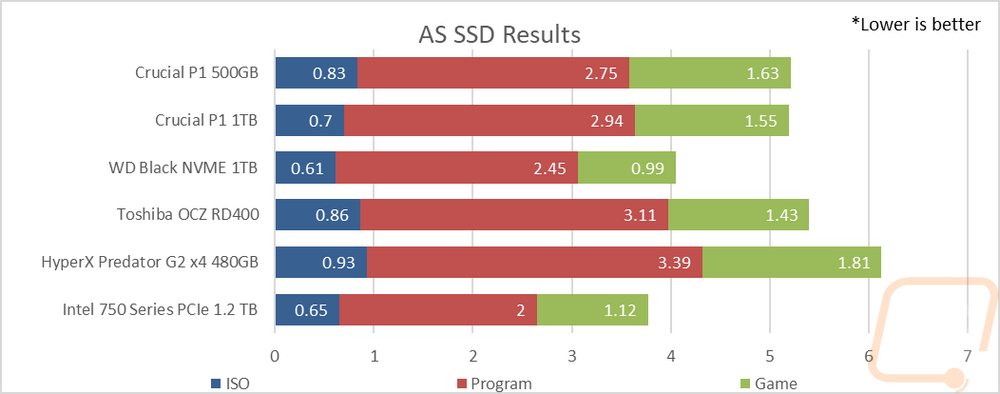
My next test was using AS SSD but rather than the normal sequential tests that are a lot like CrystalDiskMark I ran the file transfer tests. AS SSD times file transfers using three different types of files with a lower score being better. I put all three results together to get a better idea of which drives are faster overall. Here the aging Intel 750 Series still wins and the newer WD Black isn’t far behind. The Crucial P1, on the other hand, was in the middle of the pack. The 1TB model was faster with ISO transfers than most but a little slower with the program files, even compared to the 500GB P1.
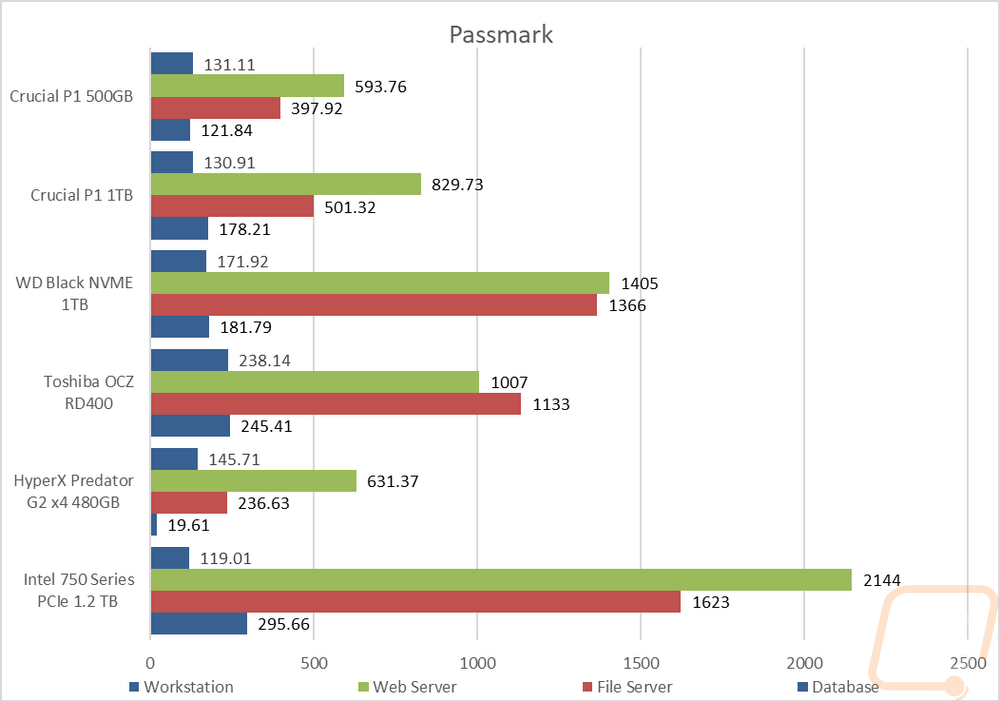
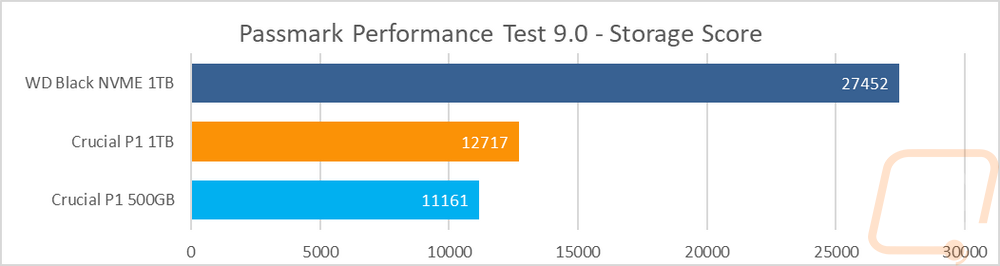
My next set of testing was in Passmark Performance Test 9. Here I ran a few different tests. The first and one that I’ve used for a long time is their advanced disk benchmark where I run four already put together workloads that are easy for others to compare with. They are labeled with different enterprise applications like workstation, web server, file server, and database. Obviously, three of the four are server focused. What I found was both P1 drives were a little on the slower side here, especially the 500GB model which was the slowest drive tested in the Web Server workload, same with Workstation and Database workloads. The 1TB drive was noticeably faster, most likely due to the larger DDR3 capacity and because its larger capacity also means a larger SLC Cache being used on the NAND. After those tests, I also ran the all in one Storage Score benchmark in the normal Passmark Performance Test 9 program. This runs all of their workloads and gives a score. As you can see when compared to the ultra-fast WD Black the P1 drive were much slower. Sadly because I just added this into our testing I don’t have other data points for comparison.
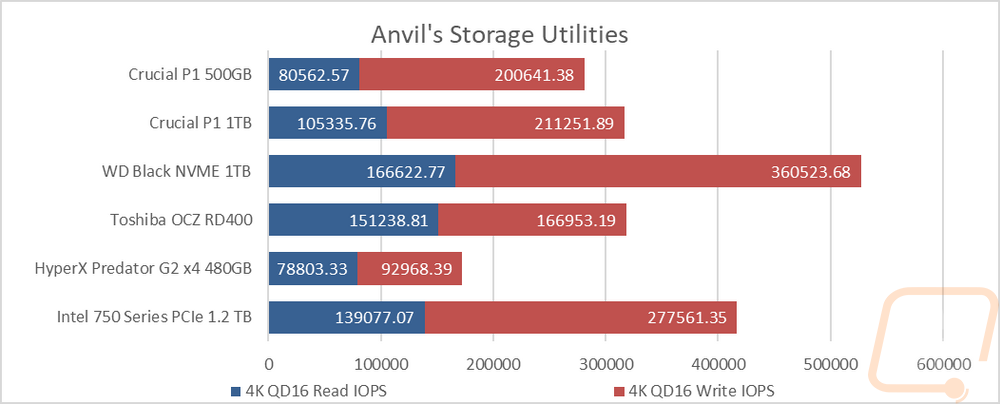
Next using Anvil’s Storage Utilities I took a look at read and write IOPS. Specifically at the 4k data side and with a queue depth of 16 on both. Again, like before I put both results together in the graph because I believe a drive has to be well rounded so ultra fast on one but slow on the other doesn’t really make for good performance. So the Crucial P1 drives didn’t do too bad here. They both scored much higher on the write IOPS as expected with the SLC write cache. When the read speeds were also added the drives both came in the middle of the pack with the 1TB model being faster on its read speeds.
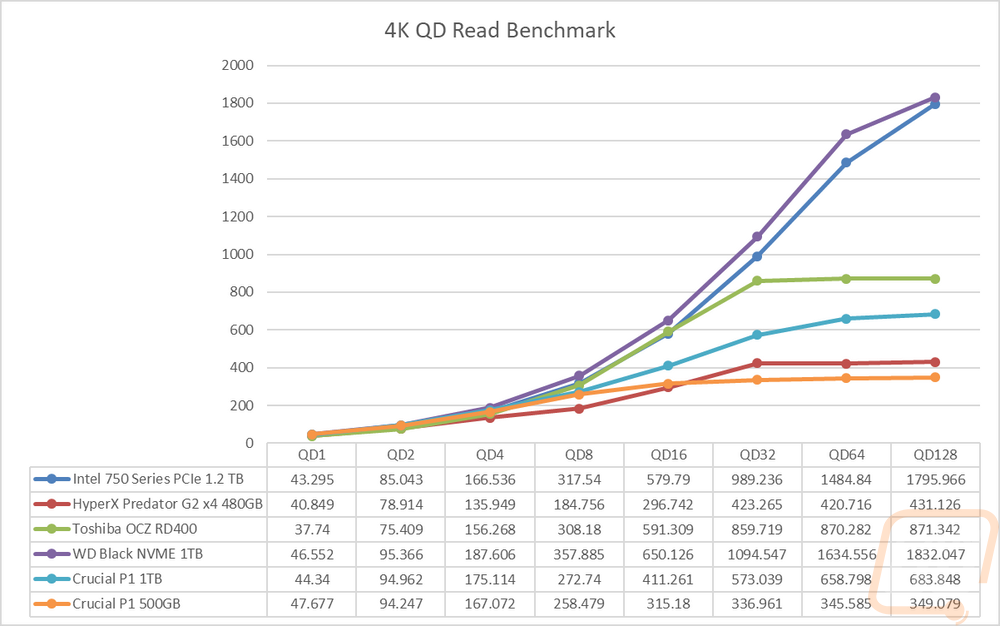
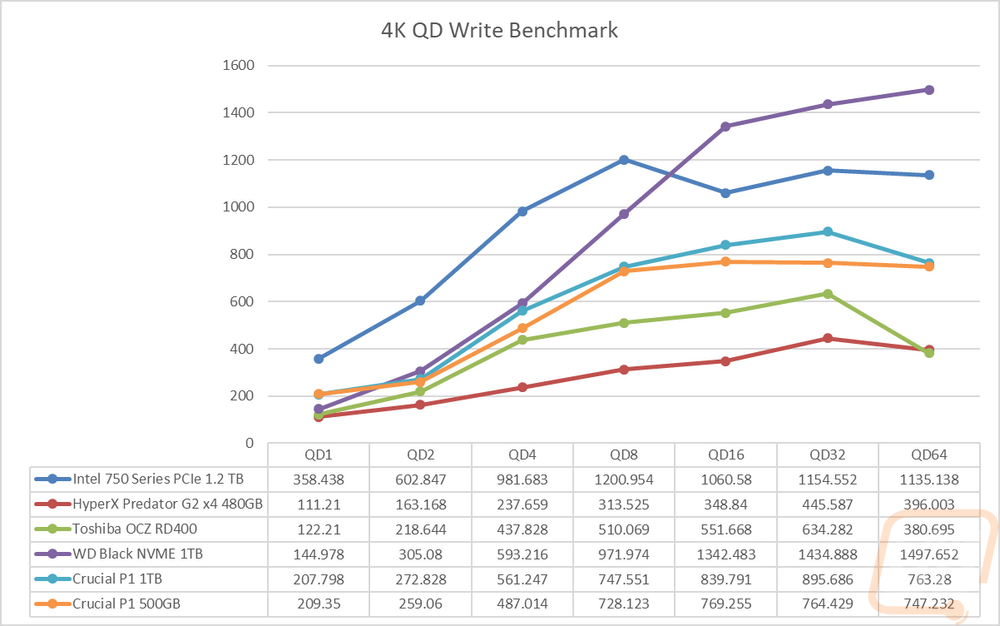
Using Anvil’s again I went in and manually tested both read and write speeds through a series of different tests at different queue depths. What I was looking for here was to see how the drives handle low and high queue depth situations. For the read numbers the 1 QD test they were the 2nd and 3rd fastest tested with the Black being the fastest. This continued but started to drop off from a queue depth of 8 and more. At 16 the 500GB model flatlined and didn’t improve much after that and the 1TB P1 ended up leveling off mode are 64, being 4th of the drives tested from 8QD on. The write graph is a little more all over the place, mostly because the Intel drive still dominates here down low. The P1 drives were 2nd and 3rd at a QD of 1 but the WD Black took over after that. The P1s slowed down some after 4 but the 500GB model went flat at 8 and actually slowed down at the higher end. The 1TB model kept climbing until 64 but then also fell off. This is the SLC cache at work, you will notice both drives hand nearly the same end result for the 64QD test showing the QLC to cap out at around 750 on both.