CPU Performance
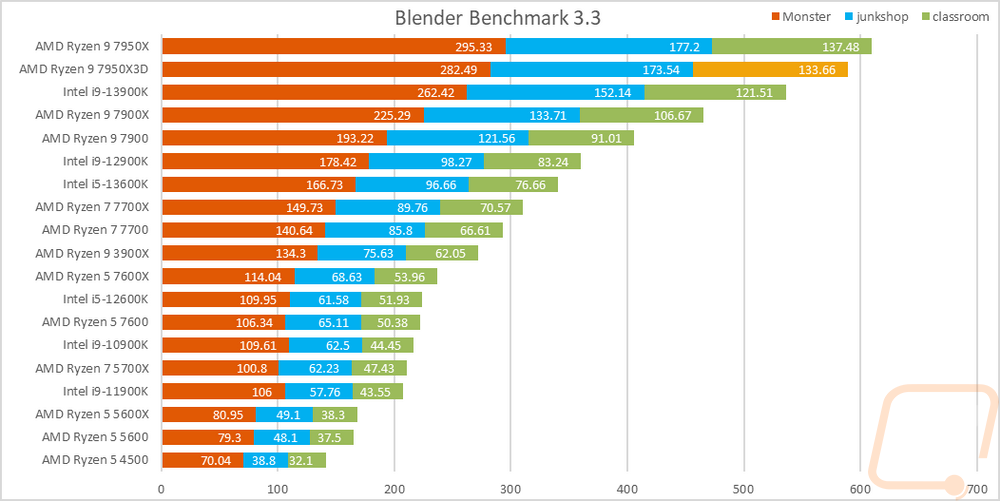
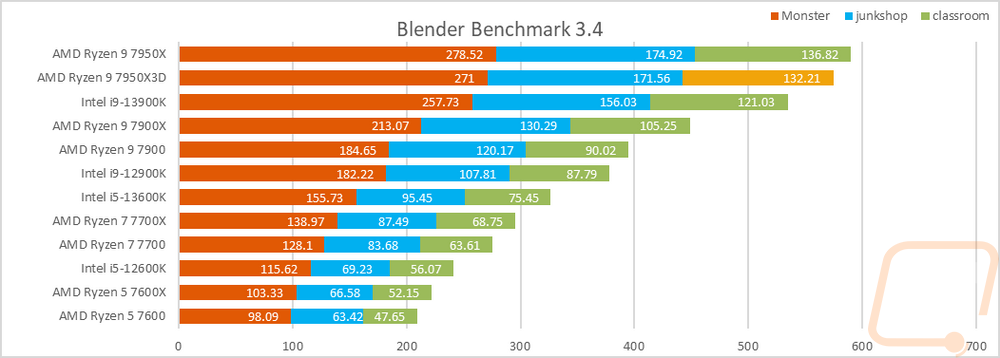
To start testing off I went with a rendering-focused benchmark with the always popular Blender. This benchmark was recently updated so our result list is smaller here. I have all three tests stacked together so we can see an overall of them altogether. Blender loves the higher core counts but clock speed does still make a difference and we can see that here with the 7950X3D coming in a little behind the original 7950X which has a higher base clock in both Blender 3.3 and 3.4. That said it Is still well ahead of the 13900K which is the next fastest CPU tested.
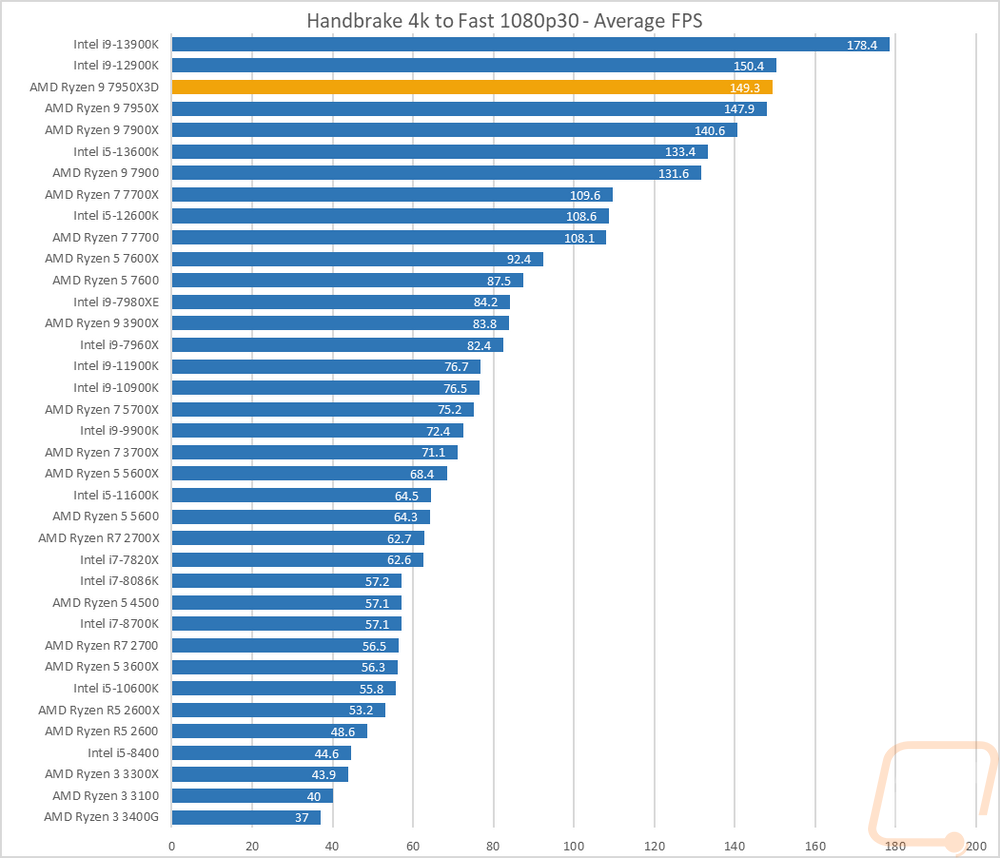
Continuing with the video encoding theme I also have Handbrake which is an open-source transcoder. For this test I am taking a 4k video down to 1080p 30 FPS, the results are the average FPS of that task. The Ryzen 9 7950X3D outperformed the 7950X here by almost 2 FPS. This was enough to get close to the 12900K but the 13900K is still way out in front in this test.
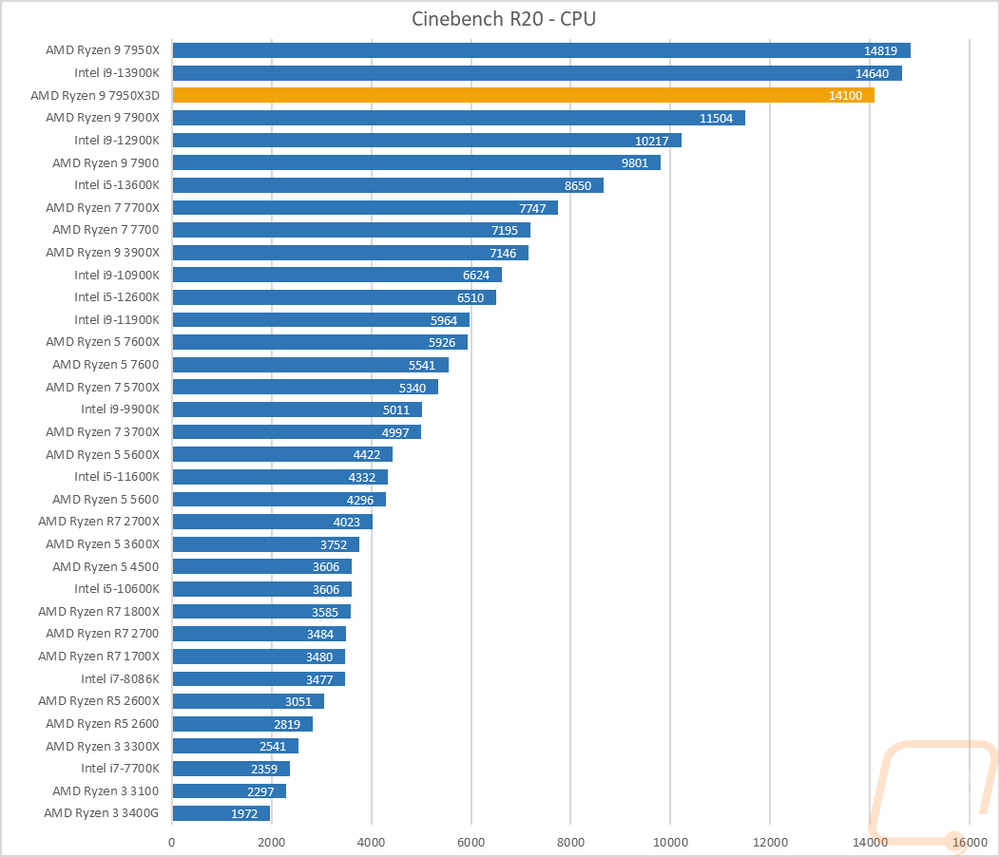
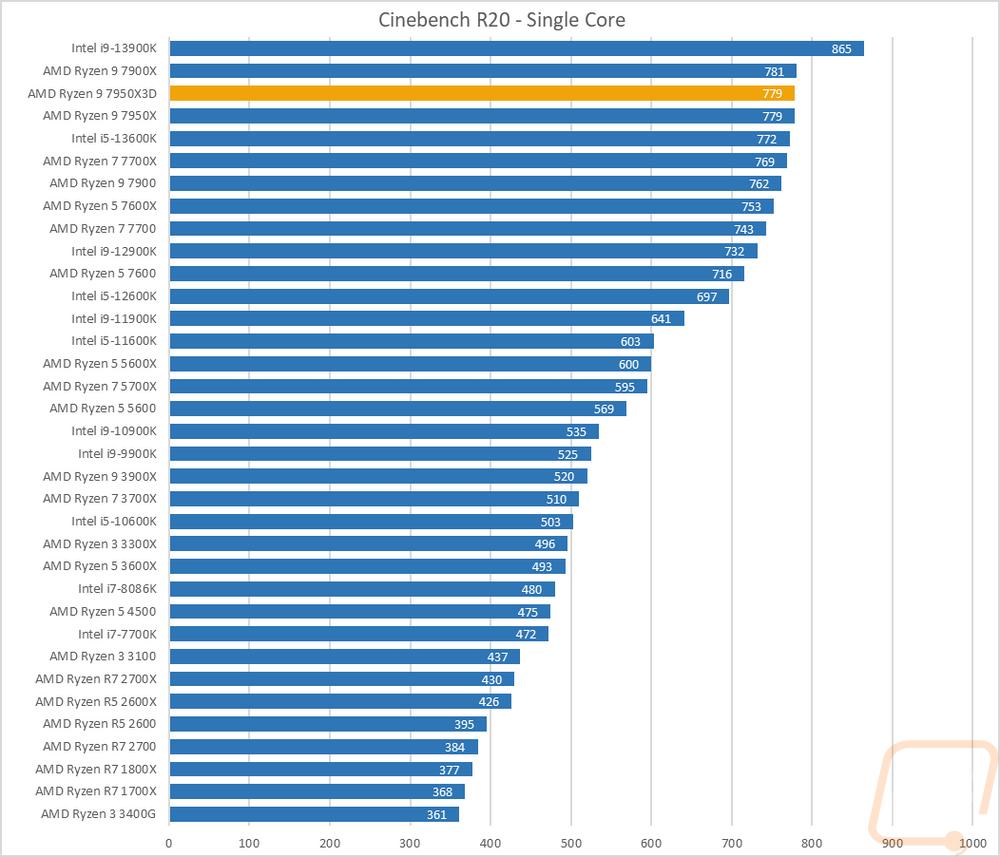
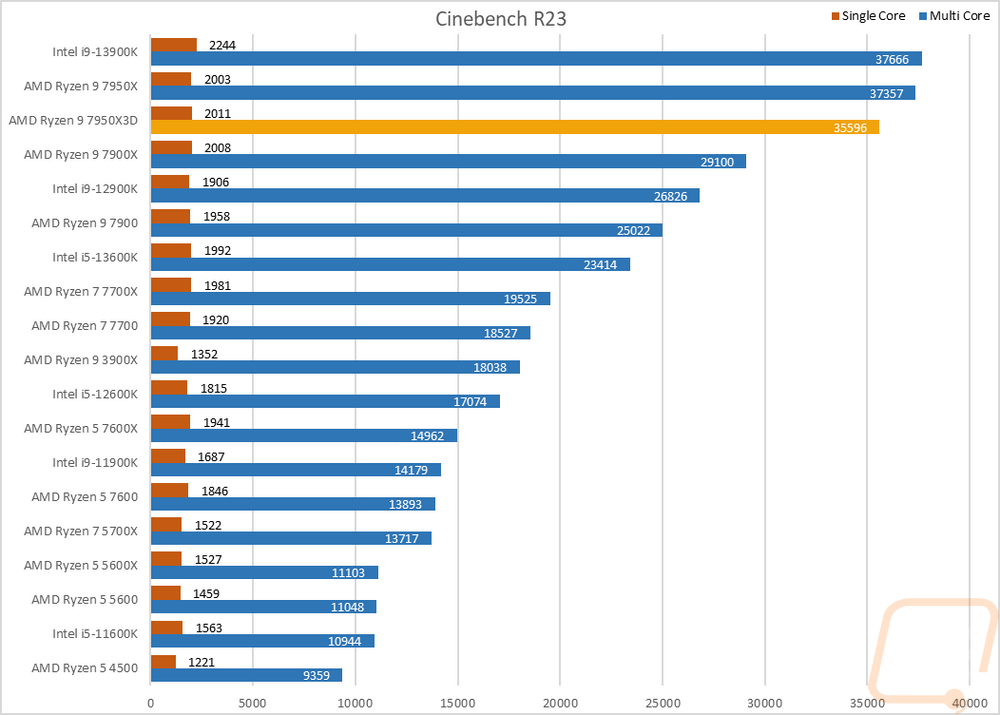
For the always popular Cinebench, I am testing with the current R23 and the slightly older Cinebench R20. I always like Cinebench because we have multi-core and single-core performance which gives us a good look at the performance of the whole CPU and IPC performance. In R20 on the multi-core test, the 7950X3D drops down below the 13900K in the multi-core test but did match the 7950X in the single-core result but is still well behind the 13900K with just one core. In Cinebench R23 the 13900K is still at the top but again we see the 7950X3D drop when compared to the 7950X, it does slightly improve in the single-core however.
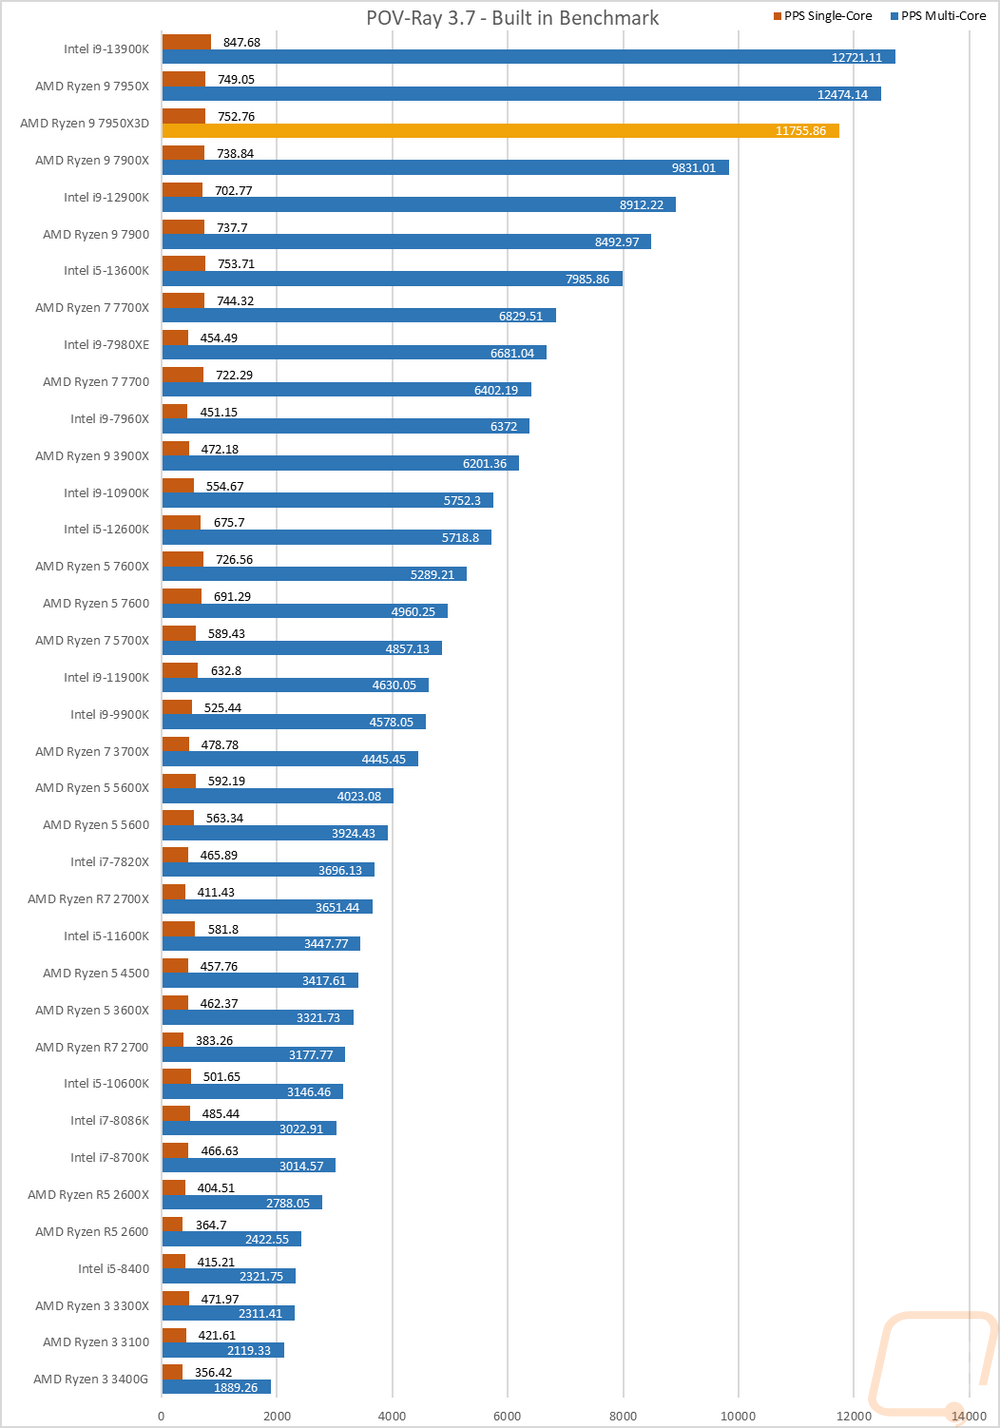
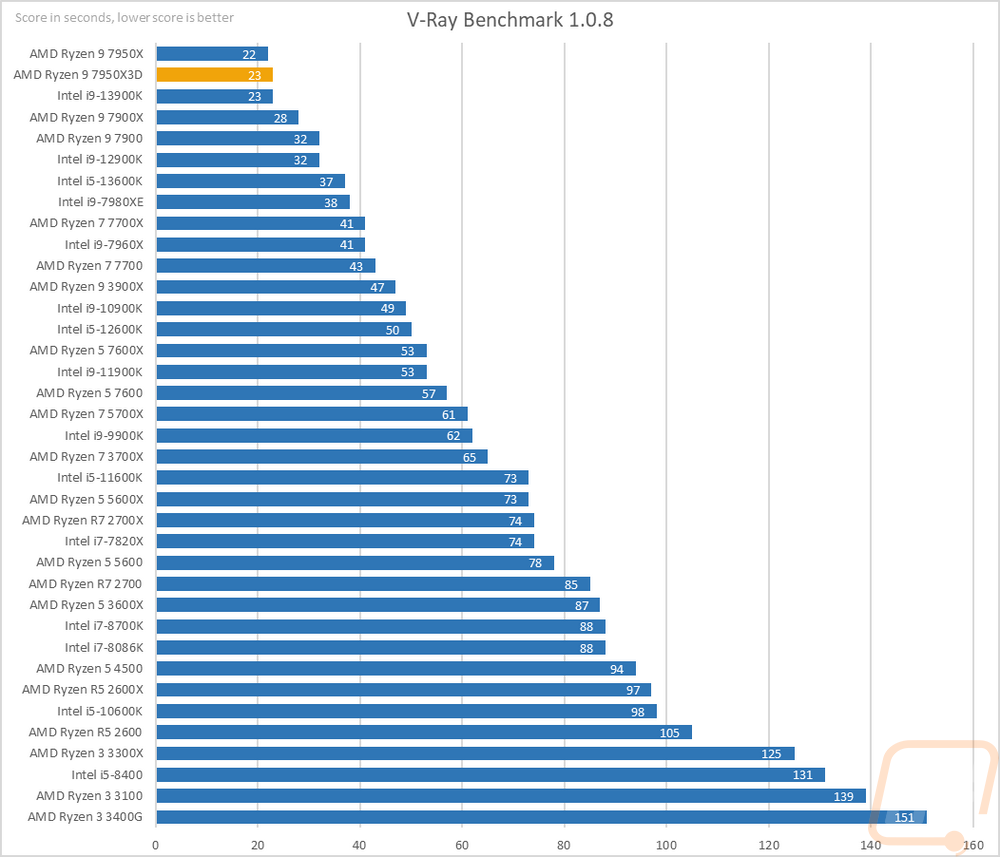
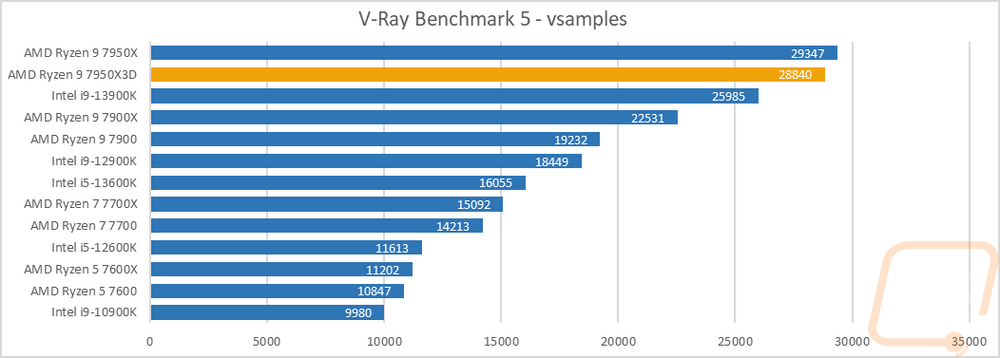
Next up we have ray tracing-focused rendering benchmarks. Here I tested the CPUs in POV-Ray and V-Ray including the newer V-Ray Benchmark 5. POV-Ray was also tested with a single core and across all of the cores. Like in Cinebench the 7950X3D does drop off in the POV=Ray multicore test with its lower base clock and 50-watt lower TDP but again the single-core performance improved slightly. In the older V-Ray, it dropped 1 second to now match the 13900K’s performance and in the newer V-Ray Benchmark 5 the performance did drop slightly from the 7950X but it is well ahead of the 13900K in that benchmark.
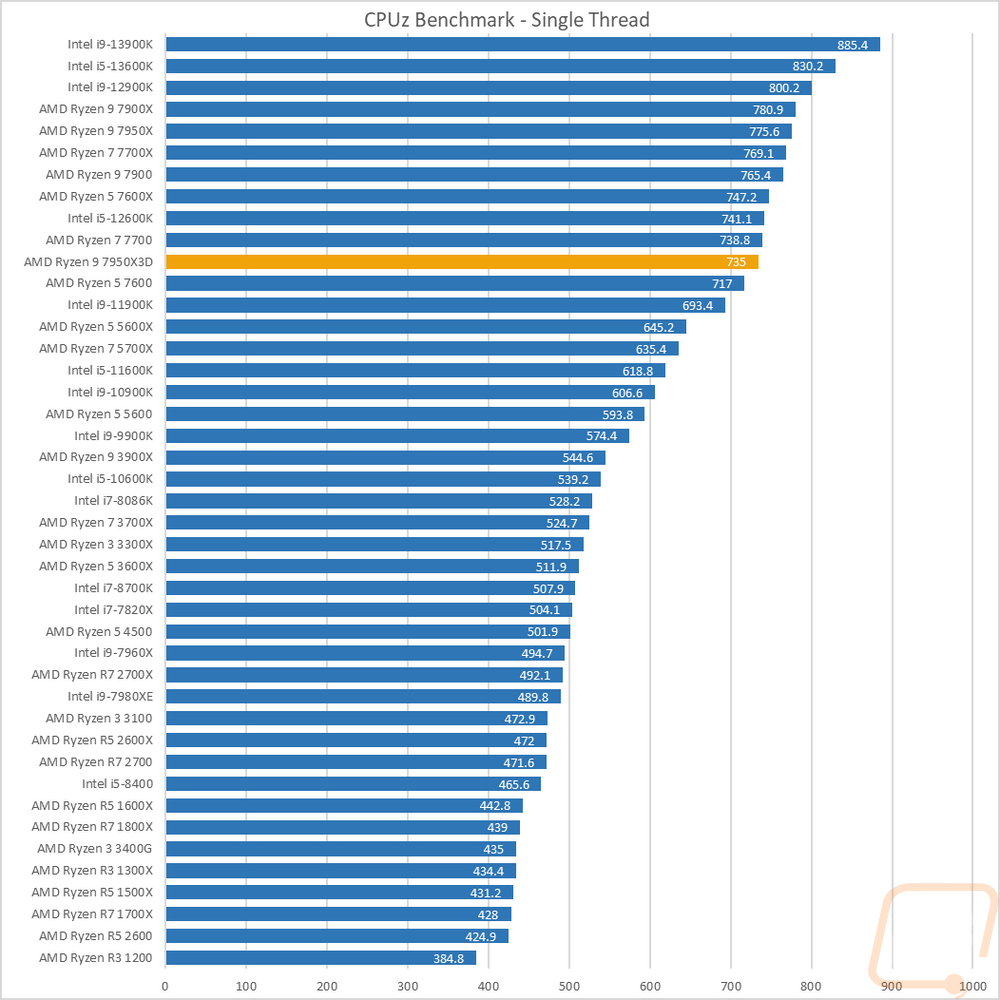
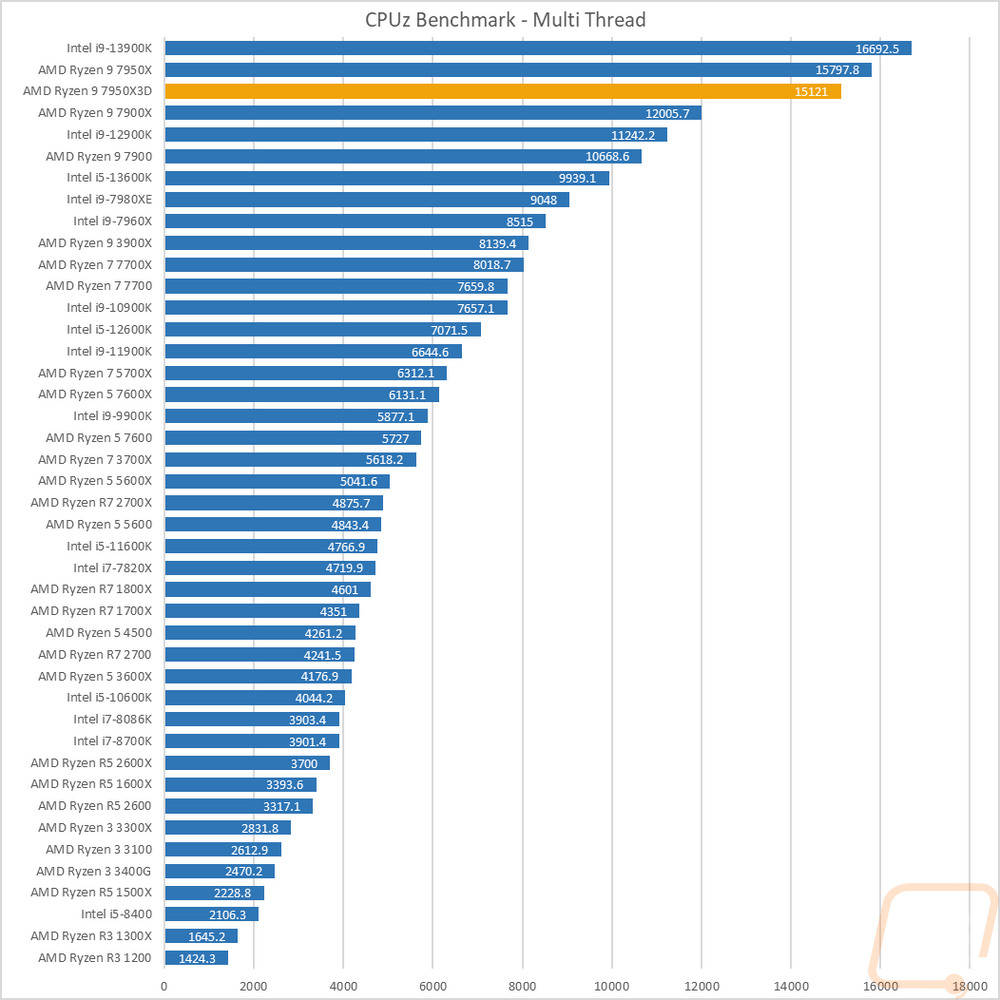
I also tested using the CPUz’s built-in benchmark which does run on a single thread and with all threads. In the multi-thread test, the 7950X3D has the same 16-core and 32-thread configuration that the 7950X has but in the multi-thread CPUz result we do still see the lower base clock and lower TDP making a difference with it sitting back slightly with a 4% performance drop. This still puts it WELL ahead of anything else other than the 13900K. The same drop can be seen in the single thread test as well which the 7950X3D drops down 5% which puts it down in the middle of the non-X 7000 Series CPUs.
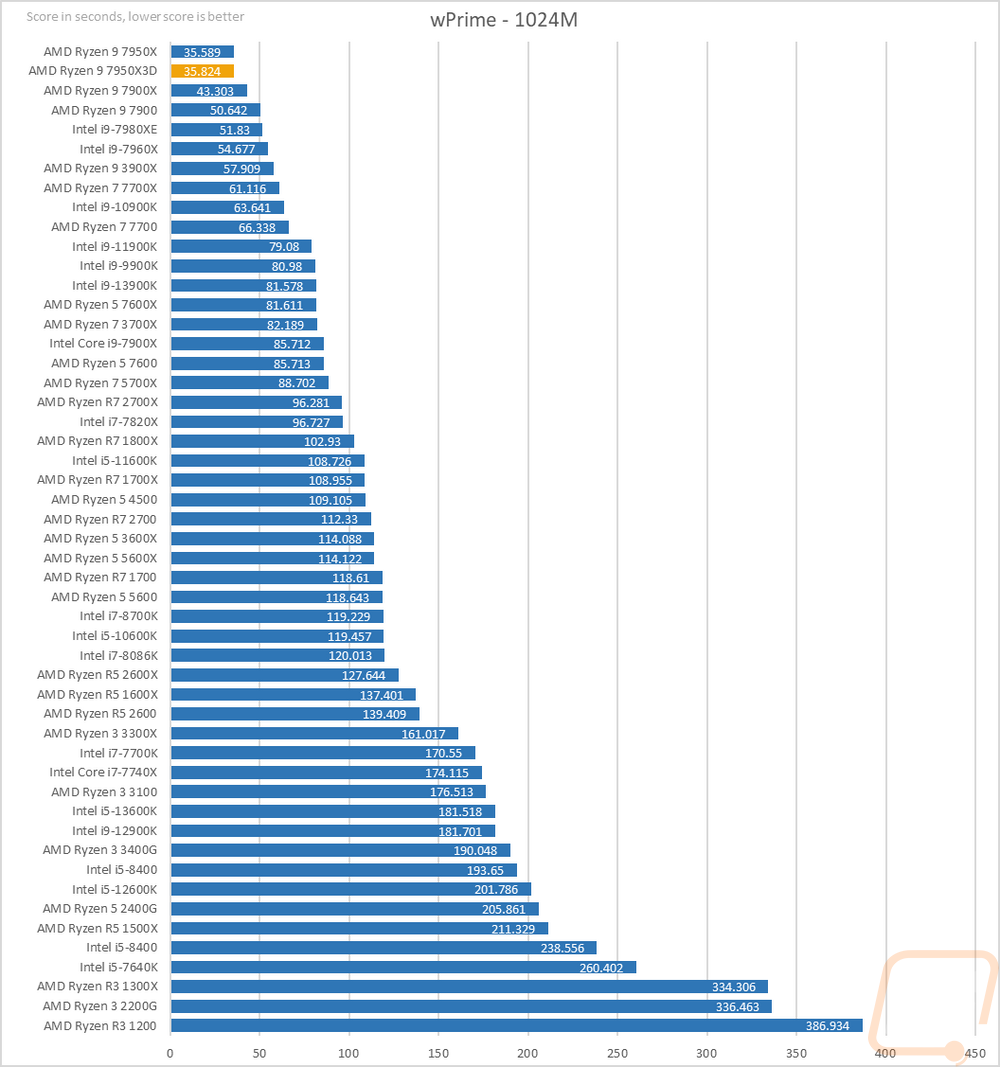
Next, we have wPrime which is a classic overclocking benchmark that calculates pi out to 1024 million digits and is timed. This is a multi-thread heavy test which has the older high core count CPUs still all over the top of the charts and the 7950X3D doesn’t change much from the 7950X in this test with both CPUs sitting together out in front of everything else tested.
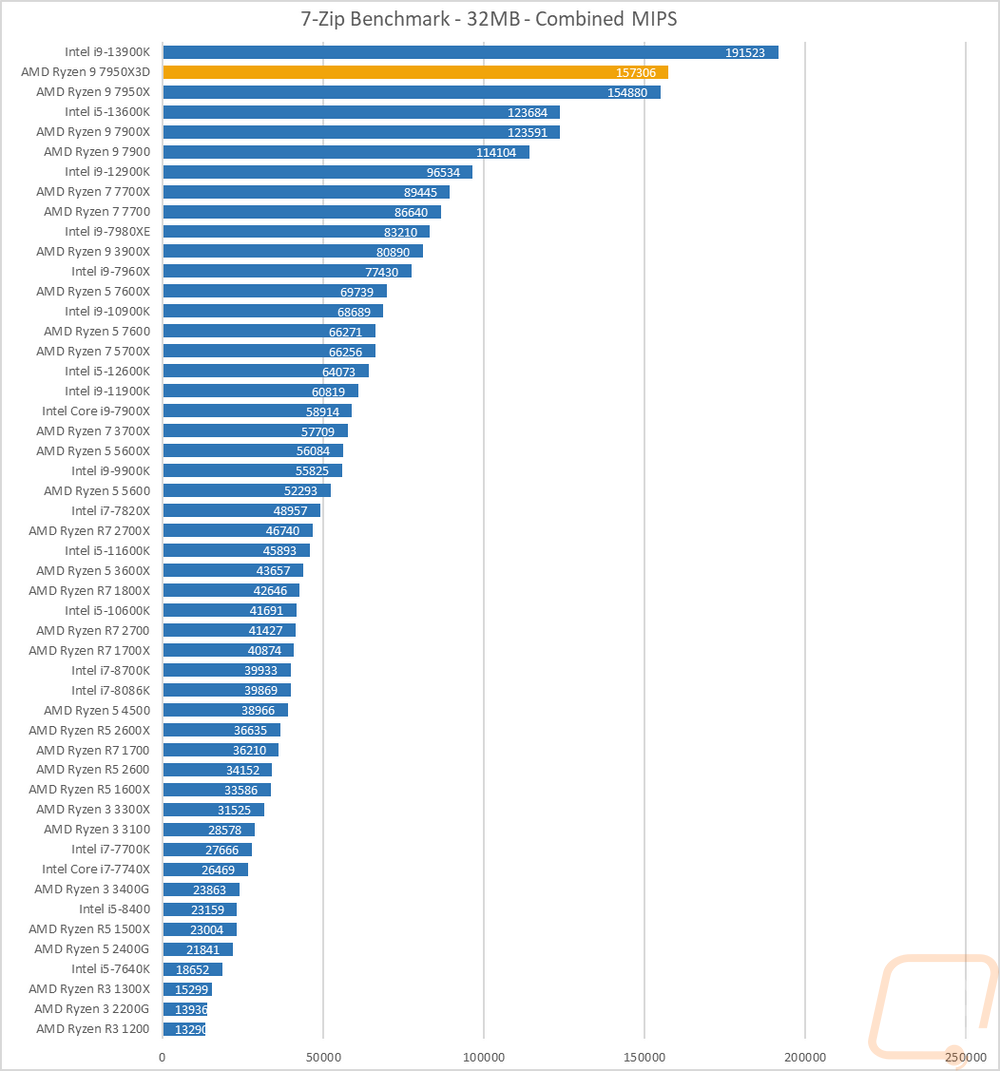
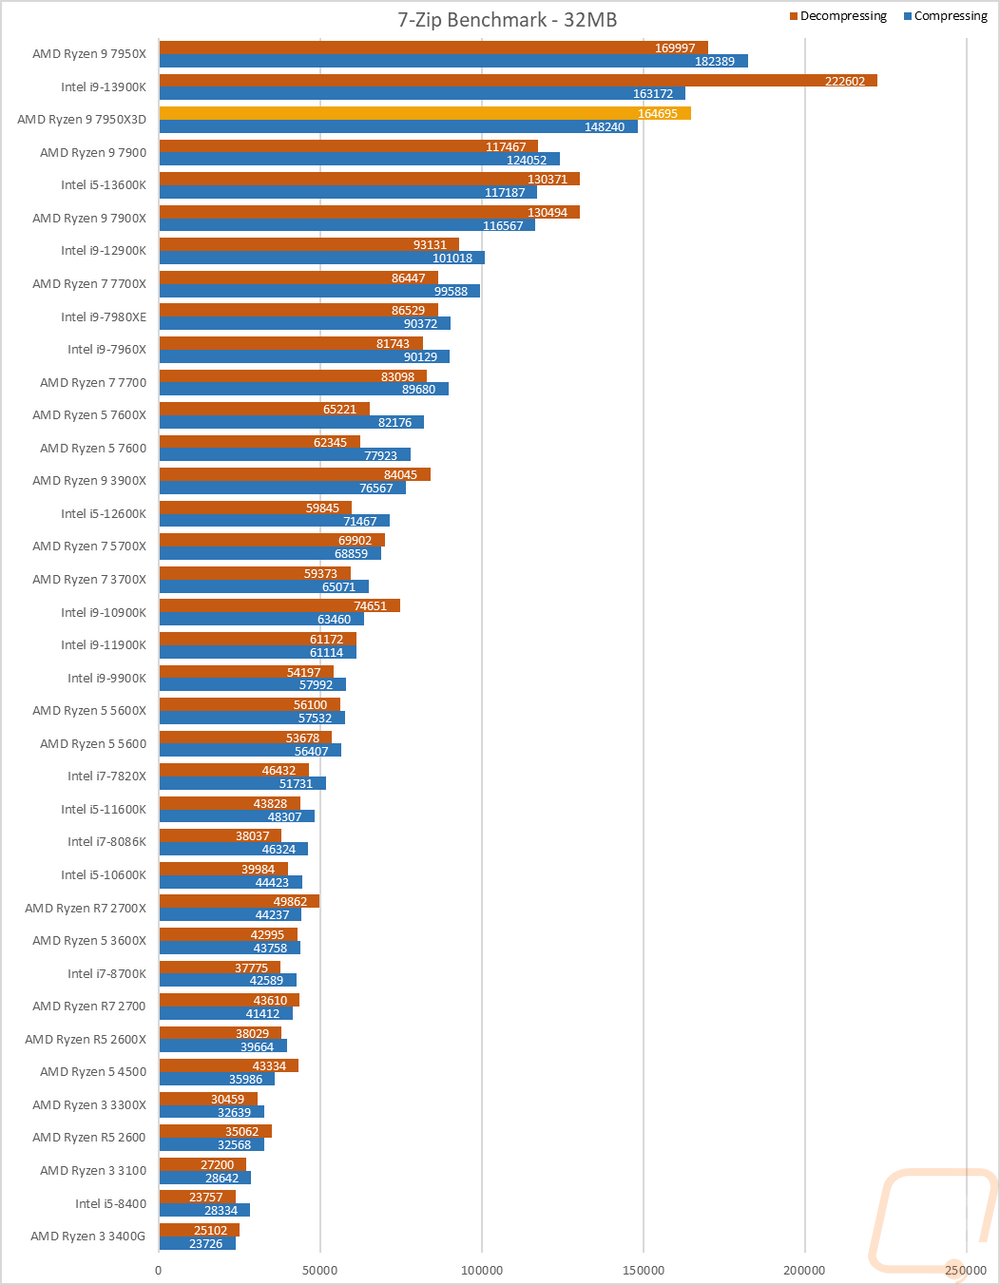
7 Zip is another open-source program, this time for compressing and decompressing all of your files. Here I have run the benchmark and we have three results. The combined MIPS is a combination of compressing and decompressing performance. Then I have it broken down between the two. The combined results have the 7950X3D showing an overall improvement in the combined MIPS results improving 1.5% over the 7950X but still well behind the 13900K. The split numbers show a different story however with both the decompressing and compressing numbers below the 7905X, especially on the compress numbers.
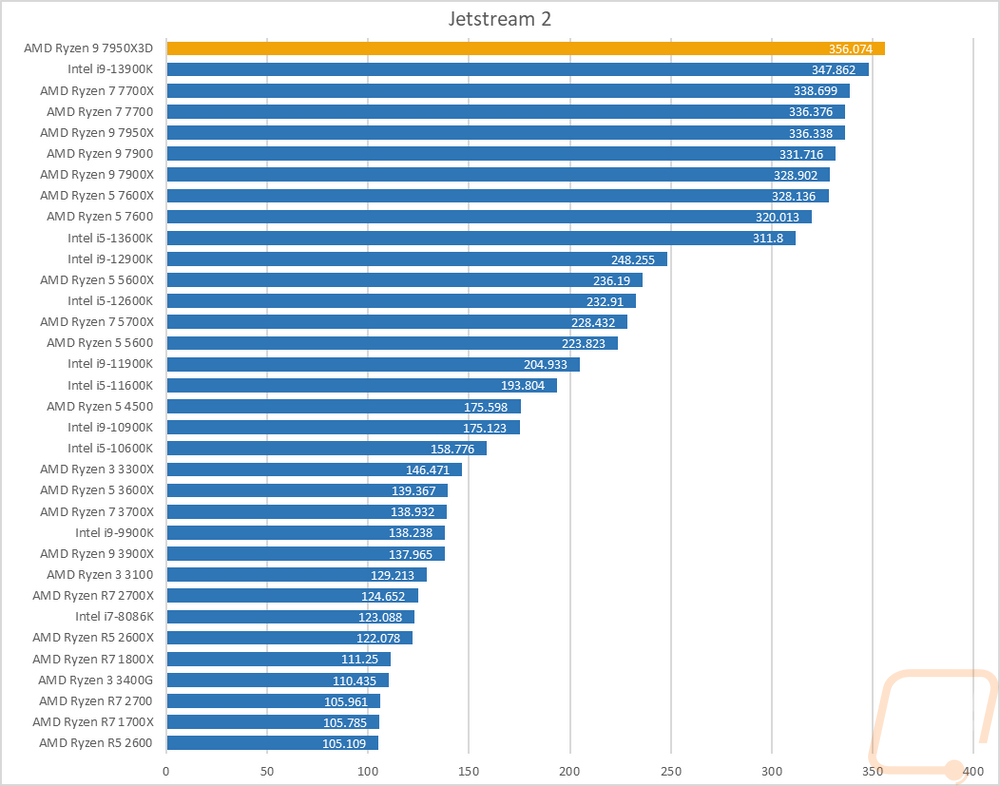
Jetstream 2 is a compilation benchmark that takes a long list of HTML5 and Java in-browser tests and runs them all three times and puts together an overall score. I love this benchmark because let's be honest, most people are using their browser more than any other game or program. Jetstream gives some interesting results sometimes though but it tends to prefer high IPC or single-core performance and there are some situations where it prefers lower core-count CPUs. This time around the Ryzen 9 7950X3D tops the chart and a 5.8% increase over the 7950X which was enough to even surpass the 13900K by a good margin.
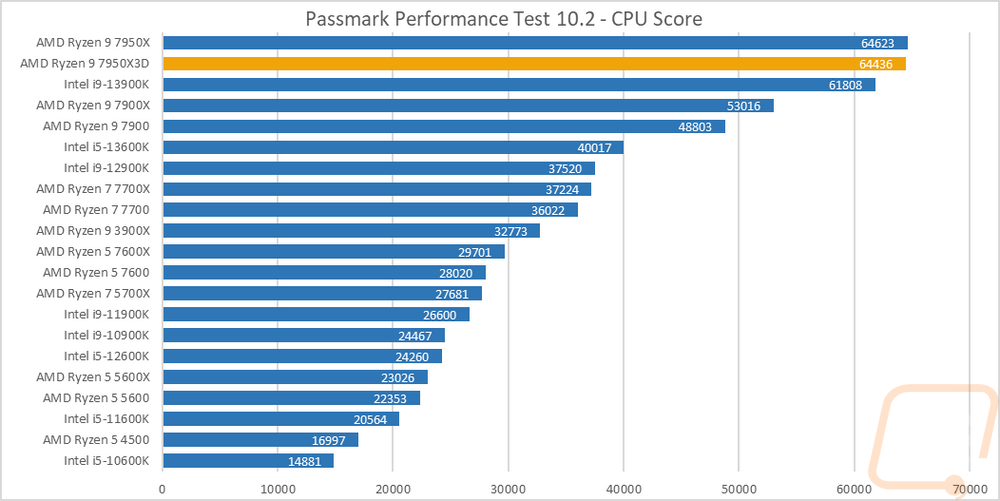
For Passmark Performance Test I used the latest version, Performance Test 10 I only look at the overall CPU score which takes a few different synthetic benchmarks and combines the results to put together an overall score. This is a test that does favor multi-threader performance over IPC and you can see that with the 7950 and the 7950X3D are eventually tied and sitting at the top of the chart out ahead of everything else from their raw core count and good IPC.
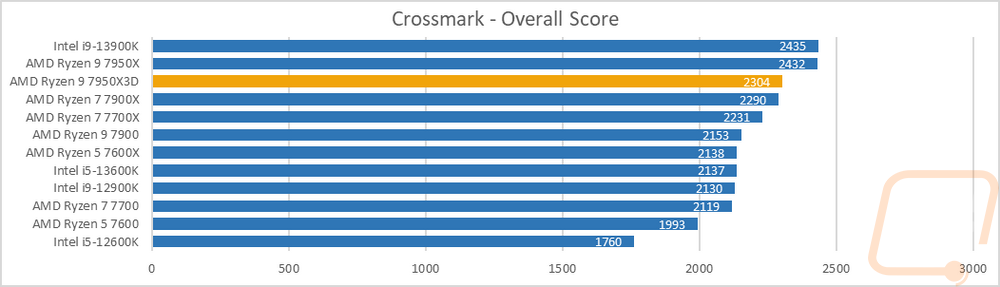
Crossmark is from BAPCo which also makes SYSmark and this is a cross-platform test where you can compare performance between phones and both windows and mac computers. This is the start of our overall PC benchmarks and Crossmark uses a mix of real-world tests to output an overall score. The Ryzen 9 7950X3D drops 5.2% compared with the 7950X which was also basically tied with the 13900K. This puts it just ahead of the 7900X.
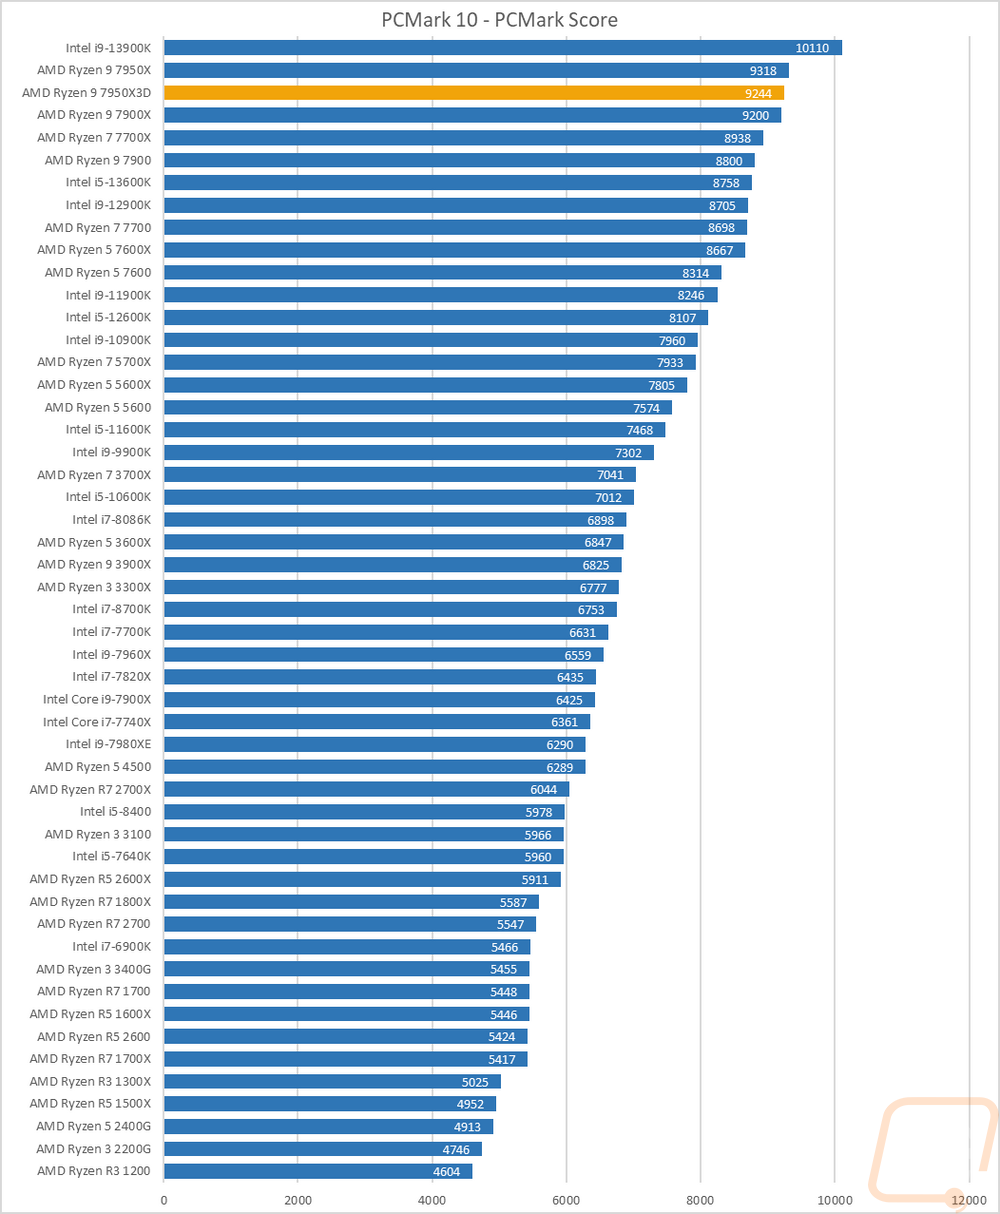
PCMark 10 is a great test because it tests things like video calls, browser performance, excel, and word performance to give an idea of real-world performance. It tends to like higher clock speeds but does take raw core count into account as well which you can see with the 7950X3D is a hair behind the 7950X with a .7% drop in performance between the two. This still keeps the 13900K well out in front and the 7900X isn’t far behind the 7950X3D.
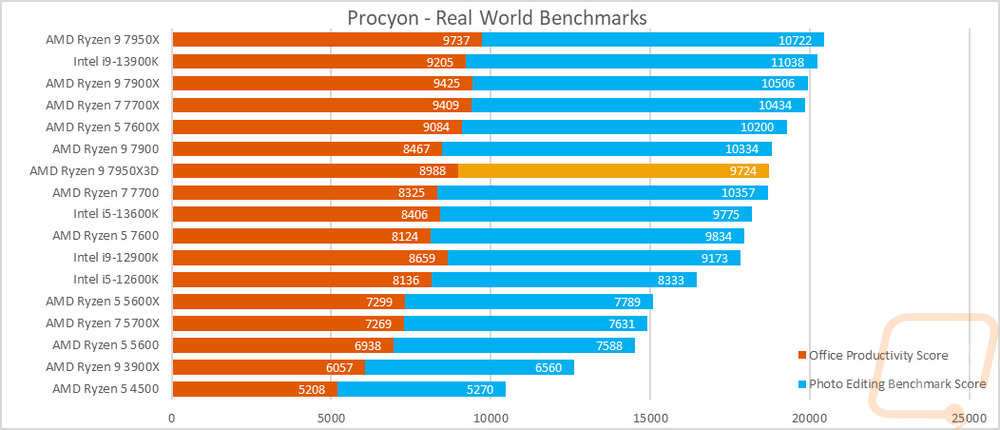
We recently added even more real-world testing with the UL Procyon Benchmarks which are as real-world as they can get using the actual programs that you would use in each test. There are two overall benchmarks, first is the Office Productivity Benchmark which uses Microsoft Office 365 to test actual performance in word, excel, PowerPoint, and outlook. The second benchmark is the Photo Editing Benchmark which is run using the latest version of Photoshop as well as Lightroom Classic to look at photo editing performance. I have both scores stacked together to get an overall look at the performance. The Ryzen 9 7950X3D results here are interesting because when combined the 7950X3D is in the middle of the chart with an 8.5% performance drop compared to the 7950X up at the top of the chart. The office productivity score however drops less at 7.6%.
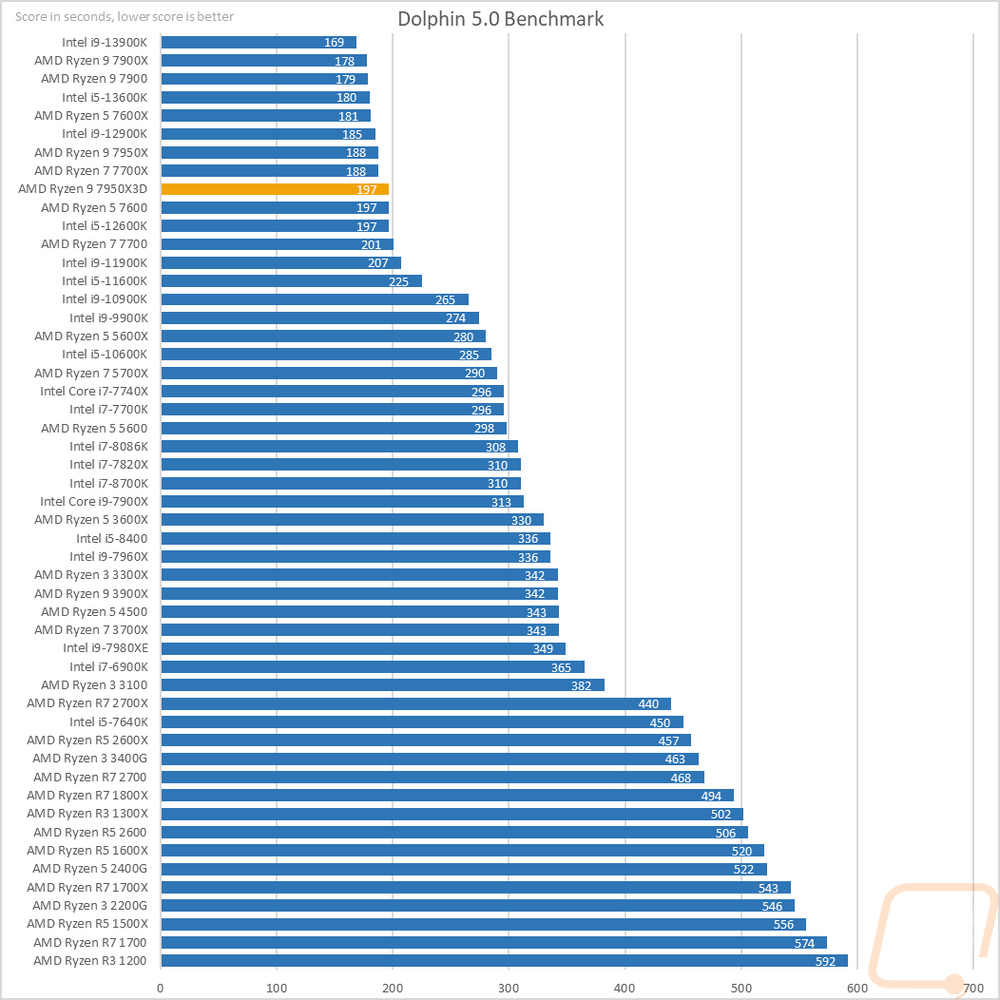
Moving the focus over towards gaming my next test is using Dolphin 5.0 Benchmark. Dolphin 5.0 is a Wii emulator and like most emulators, it doesn’t care about high core counts at all. In fact, it only runs two in total. Clock speeds are king here most of the time and the 7950X3D ties with the 7600 at 197 seconds for the test putting it 4.7% behind the original 7950X which struggled in this test as well when compared to CPUs like the 13900K and the 7900X.
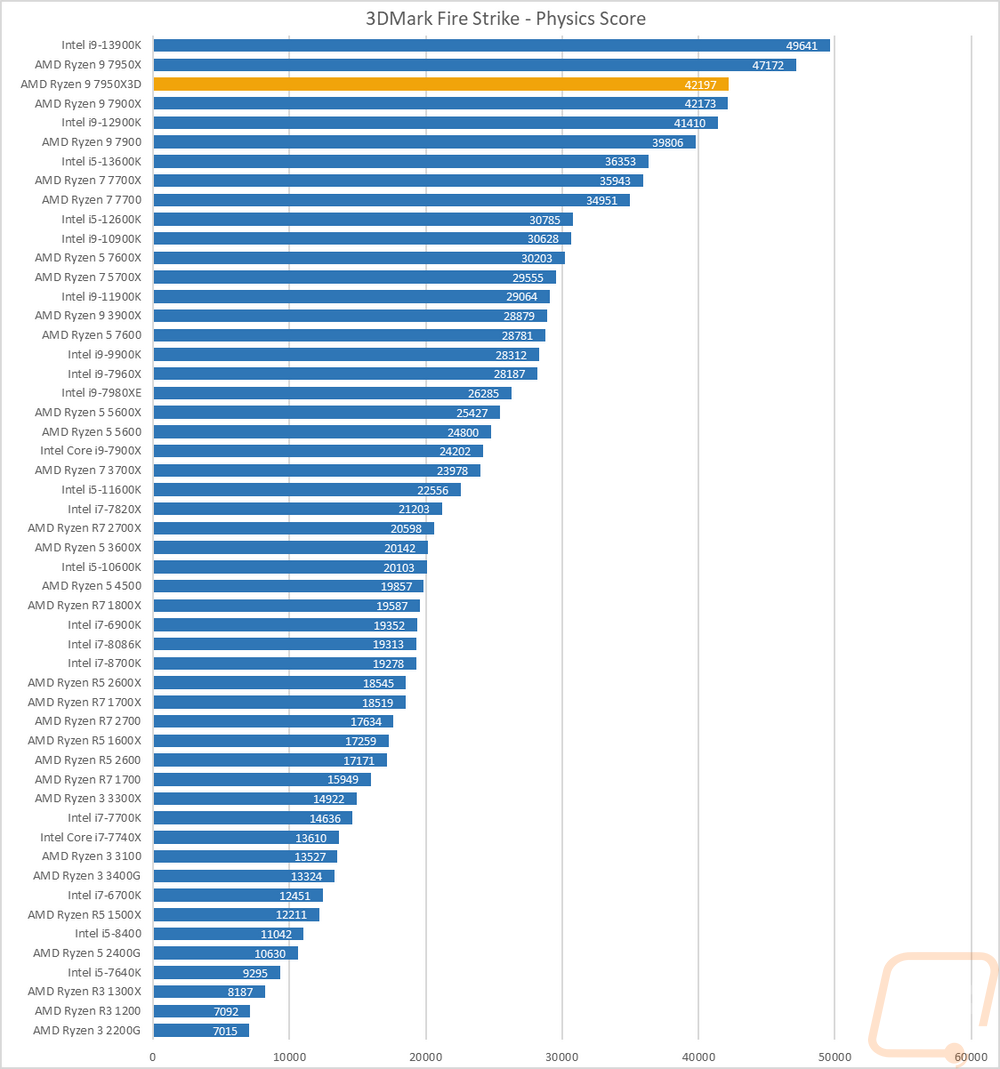
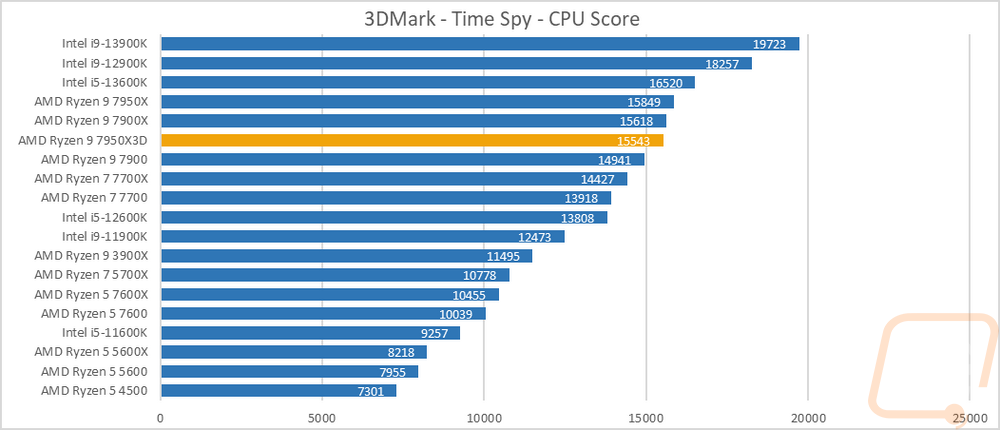
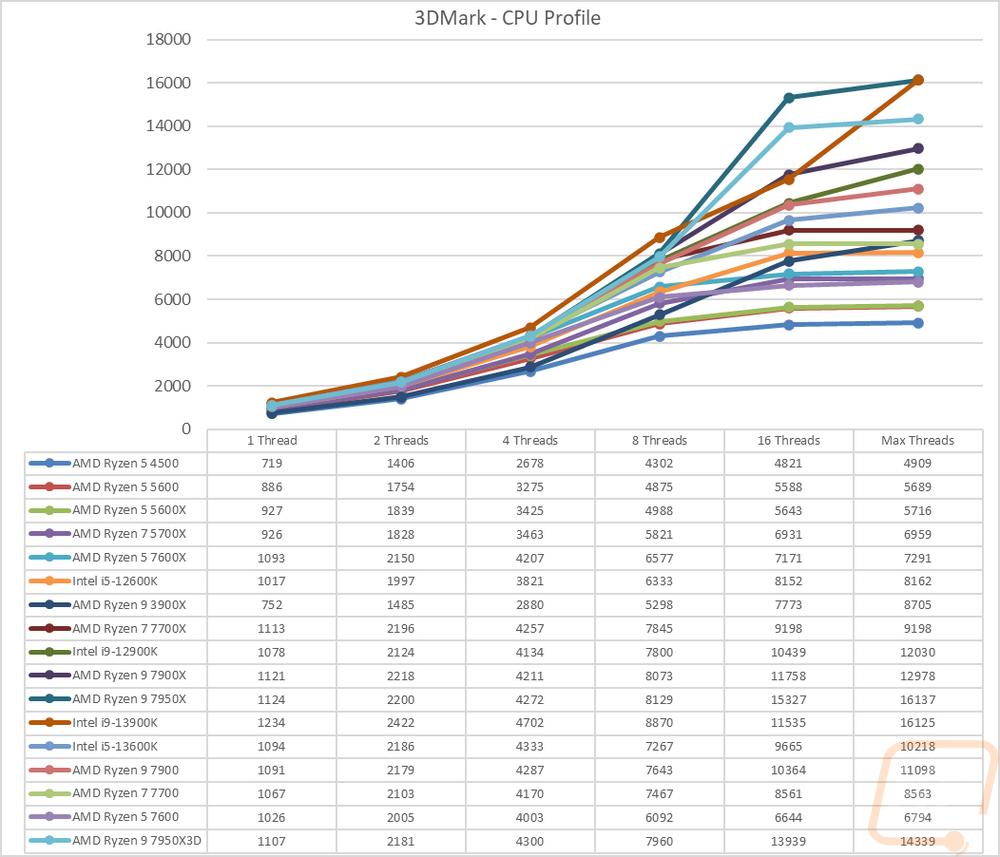
Before diving into game testing I wanted to check out synthetic performance using 3DMark. I tested with the older DX11 Fire Strike test as well as the newer DX12 Time Spy. I also added the new 3DMark CPU Profile benchmark into the mix as well which does a good job of showing the full range of thread counts that you might see being used in games as well as a max threads option that does everything above 16 threads. In the Fire Strike test, the 7950X dropped 10% in the Fire Strike compared to the 7950X putting in tied right with the 7900X. The drop was significantly smaller in Time Spy at just 1.9% but it was again right with the 7900X. Then in the CPU profile test, we see it once again 11% behind the 7950X in the max threads test, interestingly though when limited to 16 threads we see it running ahead of the 13900K.
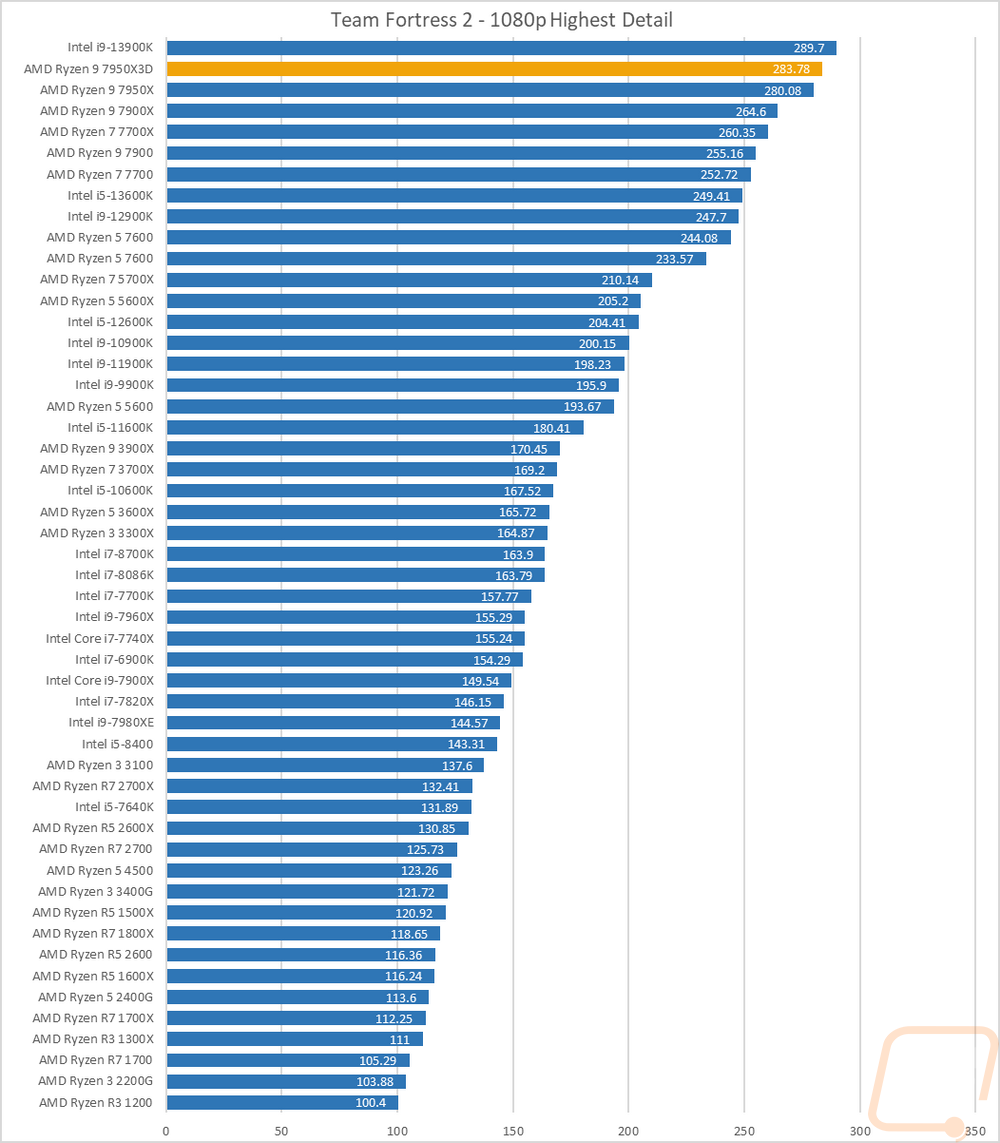
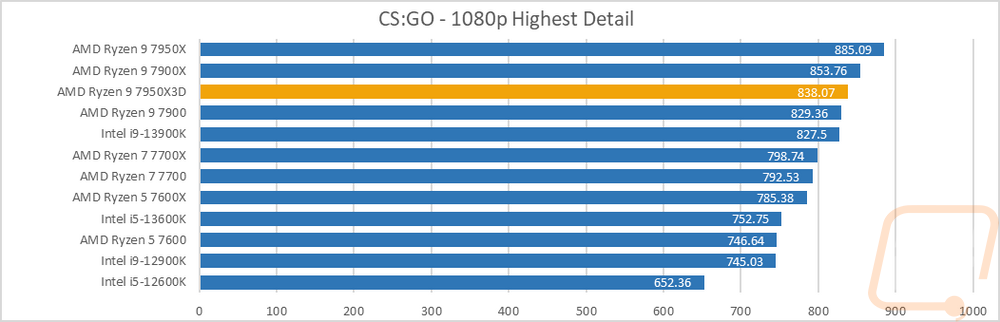
Of course, as most of you already know, where the 3d stacked cache shows itself the most is in a lot of games and I put the Ryzen 9 7950X3D as well as the rest of AMDs 7000 Series CPUs, Intel’s 13900K, 13600K, and the two 12000 Series CPUs as well all to the test in 9 different games. I used a mix of games with some being older classics and some newer games as well. Most are tested at mid-range detail settings and all were testing at 1080p which with the Nvidia RTX 4090 we know that puts everything at being CPU limited. The first two are older Valve titles with CS:GO still being one of the most played games on steam. TF2 also works out in that it has been extremely CPU limited for so long that after testing I could confirm that I could keep our older results into the mix to give us a window back farther back to the original Ryzen launch and back to Intel’s 7000 Series. In TF2 the 7950X3D improves on the 7950X’s performance by 1.3% but it still wasn’t enough to catch up to the 130900K. Looking back to the original Ryzen launch though we see the 7950X3D has more than doubled the performance of the original Ryzen flagship 1800X at 139% improvement. CS:GO interestingly the cache on the 7950X3D didn’t help with it sitting 5.3% behind the 7950X but still out in front of the 13900K.
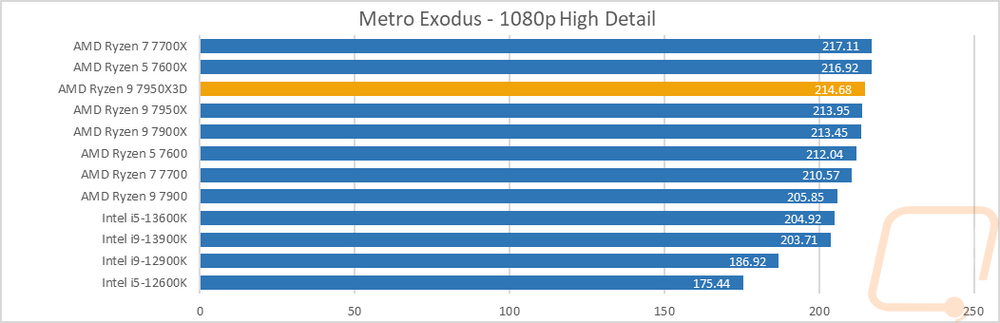
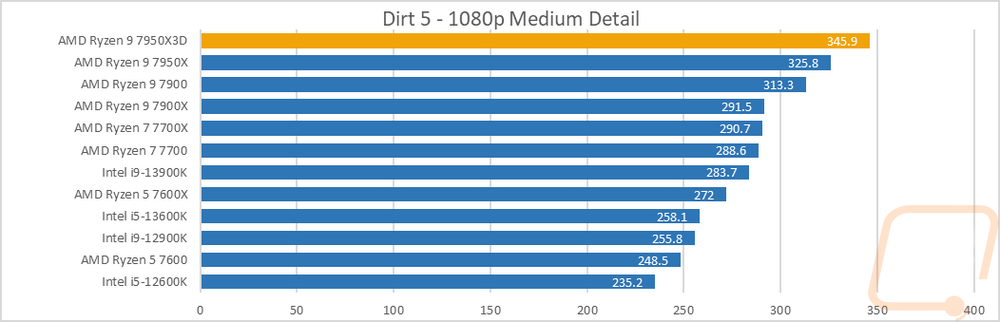
Metro Exodus was another where we didn’t see a big improvement but there was a small improvement of .3%. This is also a game where the lower core count CPUs did better with the 770X and 7600X out in front. In Dirt 5 the 7950X improved on the 7950X’s score by 6.1% as well which is a nice improvement.
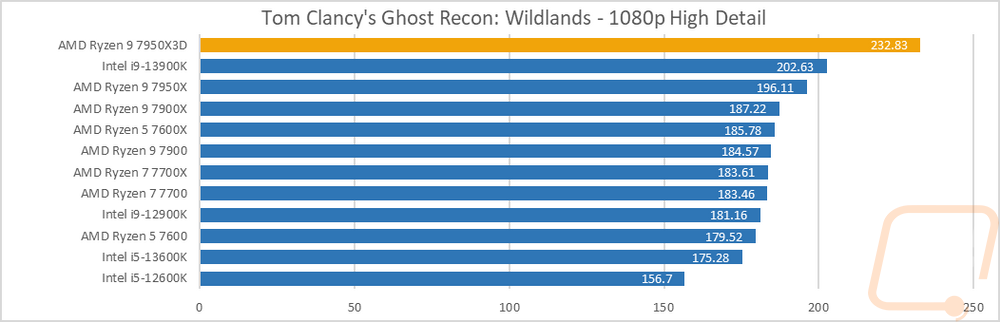
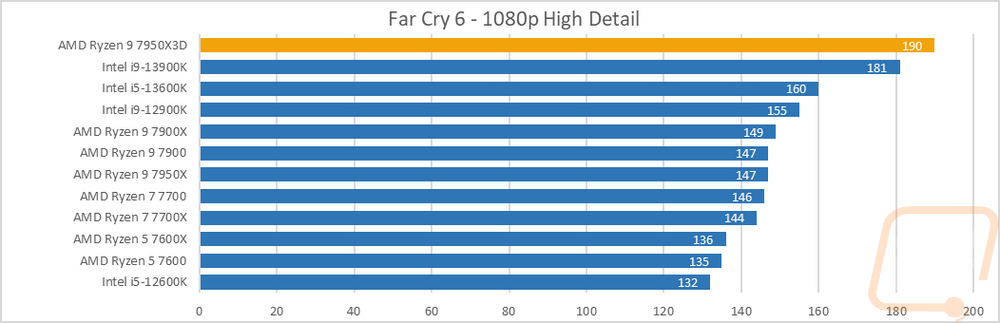
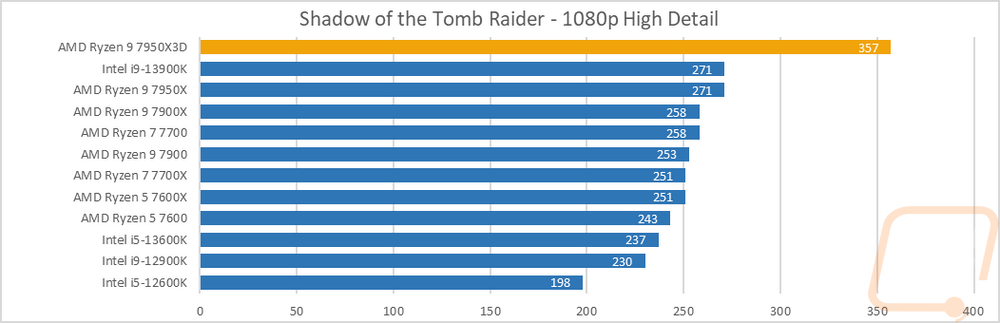
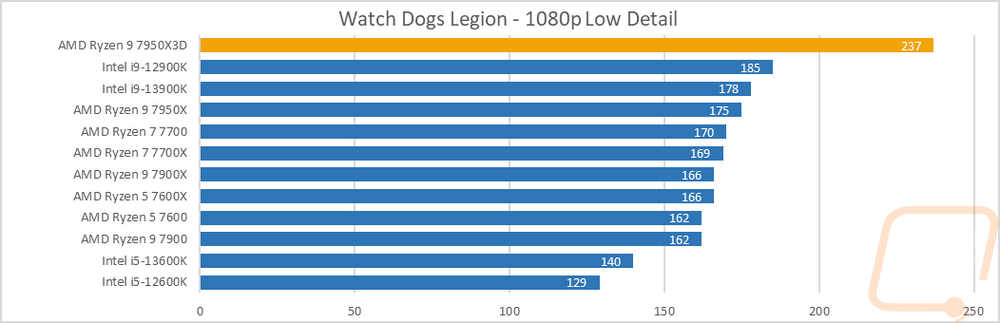
The other five games I tested all saw huge performance improvements, so much so that I spent more time than I would like to admit retesting everything over and over to confirm. Ghost Recon Wildlands for example the 7950X3D jumped 18.7% which not only pushed it past the 13900K but well beyond. Far Cry 6 was another big one at 29% moving it from behind multiple Intel CPUs up to the top of the chart. Watch Dogs Legion and Borderlands were similar as well. I should really point out though that all of these benchmarks other than TF2 and CS:GO are running at lower settings than they could be and all of the games were tested at 1080p whereas if you were running an RTX 4090 like this you would be wasting its performance by not using it at 4K. In other words, these tests were done at resolutions and detail settings that would show the performance gap between CPUs more. Gaming at detail and resolutions that match the hardware would still show a performance gap but it would be much much smaller.

The AIDA64 cache tests show an improvement all across the board compared to the 7950X and not just on the L3 cache. The same goes for how the 7950X3D handles its memory with that performing better as well which may be from AGESA refinements from the launch until now. The single and double precision performance has dropped slightly as has the AES-256 processing.
|
AIDA64 |
L1 Cache Read |
L1 Cache Write |
L1 Cache Latency |
L2 Cache Read |
L2 Cache Write |
L2 Cache Latency |
L3 Cache Read |
L3 Cache Write |
L3 Cache Latency |
|
|
GB/s |
GB/s |
ns |
GB/s |
GB/s |
ns |
GB/s |
GB/s |
ns |
|
AMD Ryzen R7 2700X |
999.43 |
502.5 |
1 |
978.03 |
495.12 |
2.8 |
414.95 |
417.71 |
8.8 |
|
AMD Ryzen R5 2600X |
768.13 |
388.05 |
1 |
729.37 |
366.01 |
2.9 |
429.09 |
323.83 |
9.1 |
|
Ryzen 5 2400G |
485.01 |
238.29 |
1 |
459.8 |
232.2 |
3.1 |
222.96 |
181.6 |
9.6 |
|
Ryzen 3 2200G |
460.55 |
227.41 |
1.1 |
352.84 |
177.56 |
3.3 |
137.3 |
171.2 |
10.2 |
|
Intel i7-8700K |
1595.6 |
803.65 |
0.9 |
640.37 |
397.14 |
2.6 |
337 |
213.67 |
11 |
|
Intel i5-8400 |
1417.2 |
710.79 |
1 |
543.81 |
352.9 |
3.1 |
270.89 |
186.82 |
13 |
|
Intel Core i9-7980XE |
3758.3 |
1896.7 |
1.1 |
1671.7 |
1069.9 |
5.6 |
229.61 |
118.4 |
21 |
|
Intel Core i9-7960X |
3532.3 |
1785.2 |
1 |
1571.6 |
1003.5 |
5.1 |
220.22 |
121.04 |
19.8 |
|
Intel Core i7-7820X |
1969.9 |
995.02 |
1 |
884.63 |
574.74 |
5.6 |
114.4 |
103.57 |
19.2 |
|
Intel Core i5-7640X |
1044.8 |
31888 |
1 |
397.26 |
247 |
2.9 |
228.31 |
163.86 |
11.1 |
|
Intel Core i9-7900X |
2418.5 |
709.16 |
1 |
1037.3 |
521.94 |
5.2 |
124.16 |
106.78 |
21.2 |
|
Intel Core i7-7740X |
1102.7 |
561.25 |
0.9 |
424.55 |
304.3 |
2.7 |
287.01 |
186.67 |
21.2 |
|
Intel i7-6900K |
1963.9 |
999.59 |
1 |
710.28 |
310.34 |
4.1 |
243.96 |
195.41 |
14.6 |
|
Intel i7-7700K |
1114.6 |
560.82 |
0.9 |
415.45 |
285.97 |
2.7 |
234.5 |
188.7 |
10.4 |
|
Intel i7-5960X |
1748.5 |
874.6 |
1.2 |
623.08 |
272.77 |
3.5 |
260.72 |
184.92 |
15.3 |
|
AMD Ryzen R7 1800X |
917.46 |
460.16 |
1.1 |
831.95 |
446.37 |
4.7 |
388.18 |
386.01 |
12.4 |
|
AMD Ryzen R7 1700X |
867.89 |
435.33 |
1.2 |
809.29 |
419.38 |
5 |
369.75 |
350.31 |
12.9 |
|
AMD Ryzen R7 1700 |
793.9 |
398.12 |
1.3 |
742.92 |
389.73 |
5.4 |
334.36 |
332.12 |
14.2 |
|
AMD Ryzen R5 1600X |
689.47 |
345.95 |
1.1 |
630.99 |
334.93 |
4.7 |
386.48 |
326.86 |
12.3 |
|
AMD Ryzen R5 1500X |
446.84 |
224.01 |
1.1 |
306.82 |
211.58 |
11.8 |
306.82 |
211.58 |
11.8 |
|
AMD Ryzen R5 2600 |
685.38 |
344.05 |
1 |
669.28 |
333.5 |
3.1 |
381.16 |
320.56 |
9.8 |
|
AMD Ryzen R7 2700X |
849.91 |
426.09 |
1 |
837.76 |
418.75 |
3 |
357.51 |
356.71 |
9.4 |
|
Intel i7-8086K |
1596.4 |
803.56 |
0.9 |
623.36 |
423.53 |
2.6 |
380.04 |
243.73 |
10.9 |
|
Intel i9-9900K |
2375.6 |
1195.4 |
0.8 |
907.65 |
626.34 |
2.4 |
302.01 |
221.1 |
11 |
|
AMD Ryzen 9 3900X |
3098.6 |
1551.4 |
0.9 |
1545.3 |
1416.8 |
2.8 |
1014.4 |
836.39 |
11.5 |
|
AMD Ryzen 7 3700X |
2133.2 |
1072.9 |
0.9 |
1069.1 |
993.49 |
2.8 |
611.53 |
573.21 |
10.2 |
|
AMD Ryzen 5 3600X |
1547.4 |
779.24 |
1 |
777.62 |
745.3 |
2.8 |
584.93 |
538.45 |
10.4 |
|
AMD Ryzen 3 3400G |
508.97 |
253.87 |
1 |
490.26 |
247.04 |
3 |
233.57 |
193.62 |
9.3 |
|
AMD Ryzen 3 3300X |
1080.5 |
541.5 |
0.9 |
541.84 |
530.5 |
2.7 |
322.13 |
321.33 |
11.1 |
|
AMD Ryzen 3 3100 |
965.85 |
484.67 |
1 |
485.55 |
460.71 |
3.1 |
374.11 |
343.53 |
11.8 |
|
Intel i5-10600K |
1676.6 |
840.87 |
0.8 |
662.98 |
452.67 |
2.5 |
361.35 |
238.47 |
10.5 |
|
Intel i9-10900K |
3162.1 |
1586.7 |
0.8 |
1201.8 |
759.97 |
2.4 |
407.66 |
245.94 |
11.4 |
|
AMD Ryzen 5 5600X |
1721.4 |
869.69 |
0.9 |
851.89 |
831.97 |
2.6 |
276.24 |
298.84 |
11 |
|
Intel i9-11900K |
4542.8 |
2299.3 |
1 |
1413.2 |
691.62 |
2.5 |
330.32 |
213.28 |
11.4 |
|
Intel i5-11600K |
3412.3 |
1724.9 |
1 |
960.91 |
526.76 |
2.7 |
319.1 |
198.57 |
11.4 |
|
Intel i9-12900K |
2310 |
1438.7 |
1 |
1233.5 |
562.72 |
2.9 |
678.84 |
418.11 |
19.8 |
|
Intel i5-12600K |
1461.1 |
971.78 |
1.1 |
846.4 |
360.51 |
3.2 |
598.86 |
292.09 |
21.4 |
|
AMD Ryzen 5 4500 |
1561.9 |
784.1 |
1 |
785.34 |
751.61 |
2.9 |
350.05 |
571.19 |
10.5 |
|
AMD Ryzen 5 5600 |
1646.6 |
831.24 |
0.9 |
832.43 |
767.22 |
2.7 |
445.8 |
437.73 |
11.9 |
|
AMD Ryzen 7 5700X |
2267.8 |
1157.8 |
0.9 |
1147.6 |
1026.1 |
2.6 |
501.53 |
526.11 |
11.5 |
|
AMD Ryzen 7 7700X |
2722.9 |
1381 |
0.7 |
1361.1 |
1305.1 |
2.7 |
887.95 |
901.2 |
10.1 |
|
AMD Ryzen 5 7600X |
1996.3 |
1019.3 |
0.7 |
1020.9 |
999.93 |
2.6 |
847.43 |
847.61 |
10.5 |
|
AMD Ryzen 9 7950X |
5252.2 |
2685 |
0.7 |
2615.6 |
2588.4 |
2.6 |
1293.7 |
1357.3 |
9.9 |
|
AMD Ryzen 9 7900X |
4042.4 |
2051.4 |
0.7 |
2008.5 |
1956.3 |
2.5 |
1278.6 |
1394.1 |
9.8 |
|
Intel i9-13900K |
2005.7 |
872.39 |
0.9 |
2280.2 |
851.63 |
3.7 |
1729.2 |
619.38 |
18.3 |
|
Intel i5-13600K |
3218.4 |
1472.5 |
1.1 |
1156 |
479.87 |
4.5 |
907.63 |
406.76 |
14.9 |
|
AMD Ryzen 9 7900 |
3839.2 |
2023.6 |
0.7 |
1925.5 |
1865.1 |
2.7 |
1146 |
1046.4 |
10.3 |
|
AMD Ryzen 7 7700 |
2630.8 |
1333.7 |
0.8 |
1336.2 |
1298.2 |
2.9 |
826.97 |
879.08 |
10.4 |
|
AMD Ryzen 5 7600 |
1898 |
963.23 |
0.8 |
964.63 |
946.49 |
2.9 |
698.77 |
690.84 |
10.8 |
|
AMD Ryzen 9 7950X3D |
4734.9 |
2518.4 |
0.8 |
2558.7 |
2422.3 |
2.7 |
1314.4 |
1376.8 |
12.5 |
|
AIDA64 |
Memory Read |
Memory Write |
Memory Latency |
Single-Precision FLOPS |
Double Precision FLOPS |
AES-256 |
24-bit Integer IOPS |
32-bit Integer IOPS |
64-bit Integer IOPS |
|
|
MB/s |
MB/s |
ns |
GFLOPS |
GFLOPS |
MB/s |
GIOPS |
GIOPS |
GIOPS |
|
AMD Ryzen R7 2700X |
50214 |
48578 |
65 |
507.9 |
253.9 |
70514 |
127.7 |
127.7 |
64.22 |
|
AMD Ryzen R5 2600X |
50273 |
48346 |
65.5 |
383.2 |
191.4 |
51932 |
95.82 |
95.82 |
48.15 |
|
Ryzen 5 2400G |
45967 |
47850 |
66.6 |
235.9 |
117.8 |
32388 |
58.94 |
58.98 |
29.67 |
|
Ryzen 3 2200G |
35567 |
36240 |
118.4 |
225.8 |
112.6 |
27603 |
56.32 |
56.32 |
28.3 |
|
Intel i7-8700K |
38421 |
40175 |
57.9 |
825 |
412.5 |
29406 |
370 |
370 |
51.55 |
|
Intel i5-8400 |
38096 |
40549 |
59.8 |
728.8 |
364.5 |
25192 |
323.5 |
323.5 |
45.55 |
|
Intel Core i9-7980XE |
77004 |
68888 |
73.4 |
1831 |
915.5 |
69377 |
821.2 |
821.3 |
121.6 |
|
Intel Core i9-7960X |
79416 |
71554 |
74.9 |
1681 |
840.6 |
65409 |
754 |
753.9 |
114.7 |
|
Intel Core i7-7820X |
76049 |
73759 |
71.6 |
944.9 |
472.5 |
36420 |
423.7 |
423.7 |
63.85 |
|
Intel Core i5-7640X |
30786 |
31888 |
68.5 |
536.5 |
268.2 |
18547 |
238.1 |
138.1 |
33.53 |
|
Intel Core i9-7900X |
76856 |
72856 |
72.8 |
1148 |
574.5 |
45506 |
515.1 |
515 |
79.76 |
|
Intel Core i7-7740X |
38455 |
40596 |
53.2 |
575.4 |
287.8 |
20503 |
258.1 |
258 |
35.97 |
|
Intel i7-6900K |
66786 |
68130 |
61.9 |
1023 |
511.7 |
36340 |
255.9 |
255.9 |
63.96 |
|
Intel i7-7700K |
38498 |
40448 |
52.7 |
575.7 |
287.9 |
20519 |
258 |
258 |
35.98 |
|
Intel i7-5960X |
66108 |
49545 |
62.8 |
895.5 |
447.7 |
31783 |
223.9 |
223.9 |
55.97 |
|
AMD Ryzen R7 1800X |
44031 |
43425 |
81.8 |
472.4 |
236.2 |
64016 |
118.1 |
118.1 |
59.03 |
|
AMD Ryzen R7 1700X |
44493 |
43749 |
78.3 |
446.8 |
223.4 |
61730 |
111.7 |
111.7 |
55.84 |
|
AMD Ryzen R7 1700 |
45343 |
43777 |
82.6 |
408.5 |
204.3 |
56811 |
102.1 |
102.1 |
51.05 |
|
AMD Ryzen R5 1600X |
44452 |
43918 |
83.7 |
354.9 |
177.5 |
49340 |
88.74 |
88.73 |
44.34 |
|
AMD Ryzen R5 1500X |
44289 |
43746 |
83.1 |
229.8 |
114.8 |
31983 |
57.43 |
57.45 |
28.72 |
|
AMD Ryzen R5 2600 |
50385 |
48499 |
66.5 |
351 |
175.4 |
48939 |
88.03 |
88.02 |
44.01 |
|
AMD Ryzen R7 2700 |
50088 |
48343 |
65.9 |
434.3 |
217.2 |
60336 |
108.6 |
108.6 |
54.68 |
|
Intel i7-8086K |
39069 |
40675 |
56.2 |
824.9 |
412.5 |
29397 |
369.9 |
369.9 |
51.55 |
|
Intel i9-9900K |
39682 |
41015 |
51.1 |
1226 |
613 |
45542 |
550 |
549.8 |
79.79 |
|
AMD Ryzen 9 3900X |
53981 |
52271 |
70.7 |
1546 |
772.1 |
106943 |
385.7 |
385.7 |
96.57 |
|
AMD Ryzen 7 3700X |
51498 |
28739 |
67.3 |
1078 |
537.8 |
74474 |
271 |
271.2 |
67.77 |
|
AMD Ryzen 5 3600X |
50769 |
28736 |
68.9 |
799.5 |
400 |
55456 |
198.6 |
198.6 |
49.64 |
|
AMD Ryzen 3 3400G |
49936 |
53502 |
67.1 |
257.2 |
128.5 |
35736 |
64.16 |
64.16 |
32.25 |
|
AMD Ryzen 3 3300X |
51435 |
28743 |
66.4 |
551.6 |
276.1 |
38176 |
138.7 |
138.7 |
34.65 |
|
AMD Ryzen 3 3100 |
50246 |
28734 |
71.1 |
497.6 |
248.7 |
34946 |
124.4 |
124.4 |
31.09 |
|
Intel i5-10600K |
43340 |
43430 |
48.2 |
863.8 |
431.9 |
30782 |
387.2 |
386.9 |
53.99 |
|
Intel i9-10900K |
44972 |
43808 |
50.5 |
1632 |
815.7 |
58163 |
731.3 |
731.2 |
102 |
|
AMD Ryzen 5 5600X |
50972 |
28772 |
59.2 |
891.9 |
445.8 |
61623 |
709.6 |
709.7 |
55.72 |
|
Intel i9-11900K |
44919 |
43343 |
51.8 |
1068 |
534.2 |
164966 |
547 |
547 |
182.7 |
|
Intel i5-11600K |
43953 |
43468 |
55.6 |
838.7 |
419.4 |
123767 |
429.3 |
429.3 |
143.4 |
|
Intel i9-12900K |
71418 |
72395 |
82 |
695.7 |
247.9 |
140499 |
400.6 |
400.6 |
166.2 |
|
Intel i5-12600K |
65416 |
71336 |
87.8 |
432.5 |
216.2 |
86470 |
252.7 |
252.7 |
96.22 |
|
AMD Ryzen 5 4500 |
52683 |
53191 |
82.8 |
806 |
402.6 |
56578 |
201.5 |
201.3 |
50.35 |
|
AMD Ryzen 5 5600 |
48444 |
28753 |
70.9 |
853.2 |
426.2 |
107839 |
675.8 |
679.6 |
53.38 |
|
AMD Ryzen 7 5700X |
47858 |
28760 |
68.2 |
1158 |
577.9 |
137459 |
919.1 |
912.9 |
74.38 |
|
AMD Ryzen 7 7700X |
58755 |
80120 |
70 |
1392 |
694.6 |
192730 |
1205 |
1205 |
602.4 |
|
AMD Ryzen 5 7600X |
54720 |
80771 |
69.5 |
1046 |
523.1 |
147661 |
912.5 |
912.5 |
456.4 |
|
AMD Ryzen 9 7950X |
67342 |
76712 |
69 |
2735 |
1364 |
379510 |
2370 |
2370 |
1184 |
|
AMD Ryzen 9 7900X |
68064 |
78123 |
67.7 |
2062 |
1029 |
288134 |
1792 |
1789 |
895.4 |
|
Intel i9-13900K |
76006 |
68902 |
86.1 |
2238 |
1116 |
157028 |
831.4 |
831.4 |
270.6 |
|
Intel i5-13600K |
64721 |
62311 |
97.2 |
1294 |
647 |
86637 |
509.5 |
509.4 |
136.4 |
|
AMD Ryzen 9 7900 |
73968 |
73494 |
69.4 |
2007 |
998.7 |
267499 |
1710 |
1709 |
855.9 |
|
AMD Ryzen 7 7700 |
58694 |
79929 |
68.9 |
1369 |
684.7 |
185084 |
1192 |
1192 |
594.3 |
|
AMD Ryzen 5 7600 |
59454 |
81467 |
69.6 |
988.6 |
494.3 |
140625 |
861.9 |
861.2 |
431.2 |
|
AMD Ryzen 9 7950X3D |
77677 |
80314 |
68.1 |
2619 |
1311 |
178269 |
2239 |
2239 |
1120 |
