Its been an exciting few years in the PC market, especially with big gains in the CPU market. But it gets a lot crazier when you look back farther. Intel recently did this when they were celebrating the 40th birthday of their 8086 microprocessor. While most of you may not know the 8086 specifically, you would recognize some of the processors that it paved the way for. Most notably the ones that came after it the 286 and the 386. I personally grew up playing with those and played my first real PC games like the original Warcraft on a 486 after we spent a LOT of money to upgrade to I think it was 12MB of ram. The 8086 brought the X86 platform so 40 years was a big milestone. To celebrate Intel brought out the 8086K, named after the original. It is also their first CPU to deliver 5.0 GHz single core turbo clock speeds. Well, today I’m going to take a look at the 8086K and see where it fits in the market.
Product Name: Intel i7-8086K
Review Sample Provided by: Intel
Written by: Wes Compton
Pictures by: Wes Compton
Amazon Affiliate Link: HERE
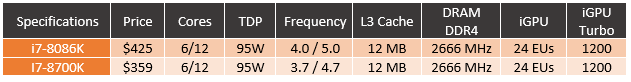
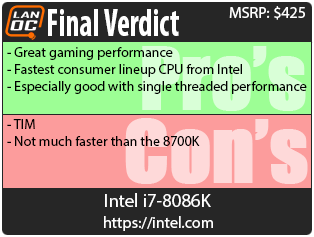
Just a quick look at the specifications, I have it listed with the i7-8700K because it is based on that same CPU. This isn’t a new architecture or a giant leap in tech. In fact, it is spec for spec the same as the 8700K with the exception of its frequencies. The base clock is up to 4 GHz from 3.7 and the boost is at 5.0 GHz. With that, the price is also up from $359 to $425. Something that later when I recap everything will most likely be a big sticking point. That is a big jump. Intel did also give away 8086 of this CPU and they are starting to go out. That is a big giveaway, with the total retail price at $3,436,550. But 40 years, why wouldn’t they be excited!
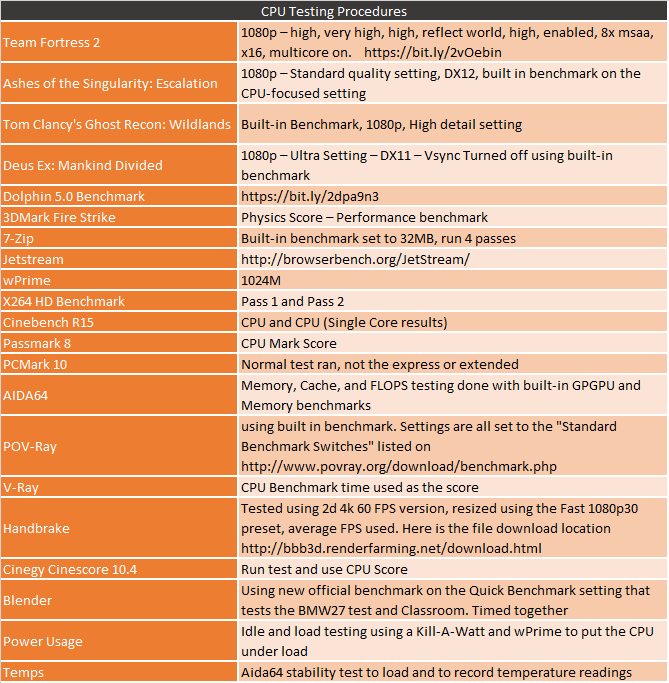
Test Rig and Procedures
Test System
Motherboard: Asus ROG Maximus X Hero- Live Pricing
Cooling: Noctua NH-U12S for cooling - Live Pricing
Noctua NT-H1 Thermal Paste - Live Pricing
Memory: Kingston HyperX Fury 16GB 2666MHz - Live Pricing
Storage: Kingston HyperX 240GB SSD - Live Pricing
Video Card: Nvidia GTX 1080 Ti - Live Pricing
Power Supply: Corsair TX750M - Live Pricing
Case: Dimastech Test Bench - Live Pricing
OS: Windows 10 Pro 64-bit - Live Pricing
CPU Performance
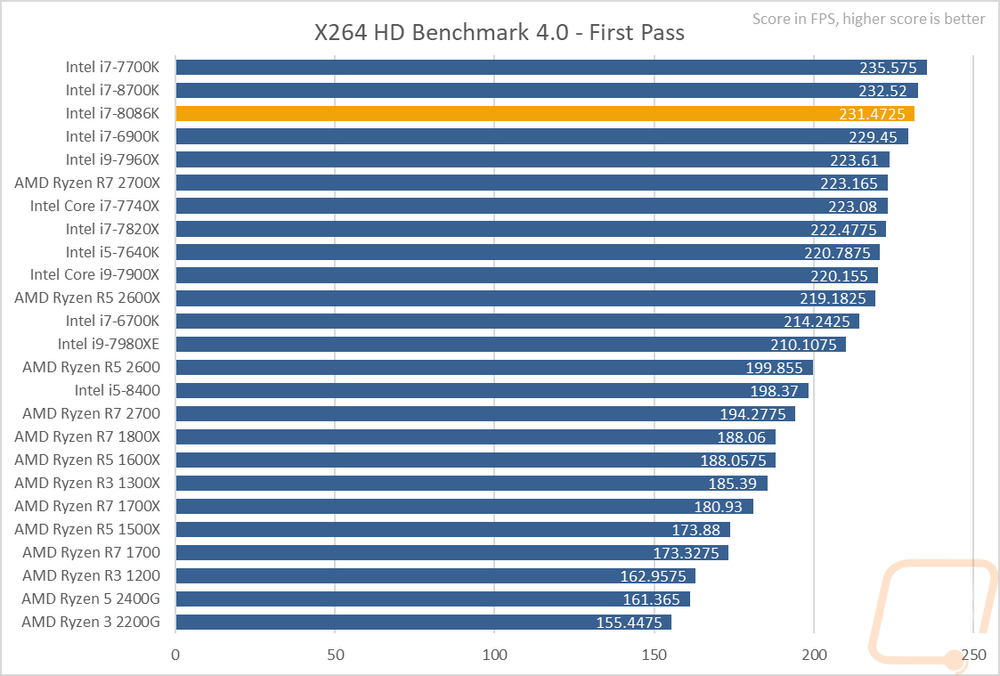
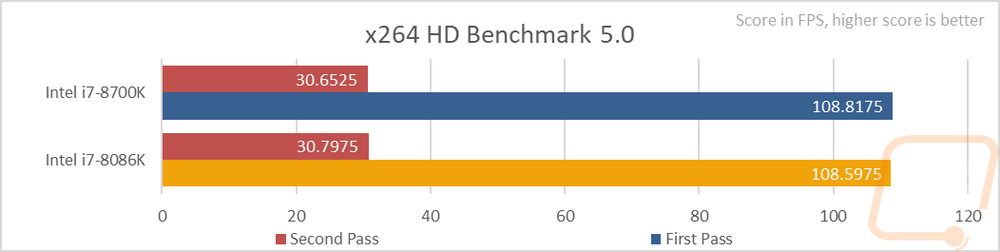
Well, we can finally dive into the performance. Our test suite has expanded a lot to try to bring in more multi-threaded loads with the core wars starting. Most of those are expanding our editing and production tests. But to start things off I have one of our classic encoding tests, the X264 HD Benchmark 4.0. Here the Intel CPUs have always done extremely well as this older encoding benchmark likes clock speeds more than core count. The i7-7700K (pre spectra updates) is still at the top but I suspect that the Spectra updates would fix that. As for the 8700K and 8086K that I am the most interested in, they are about 1 FPS apart with the 8700K coming in ahead surprisingly. I have also gone ahead and added in the X264 HD Benchmark 5.0 as well to give that test a refresh and the two CPUs basically come in exactly the same with .4 of an FPS between them. Being a new test you can expect to see me going back and filling it out later with some of the past CPUs.
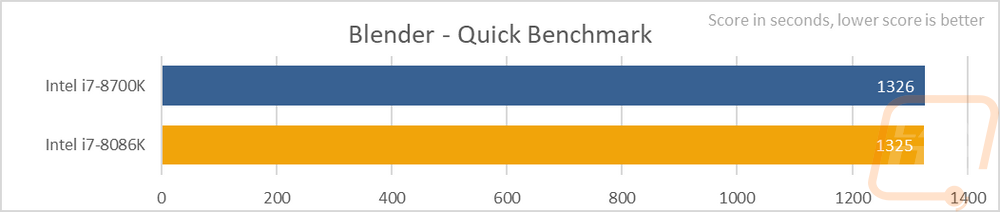
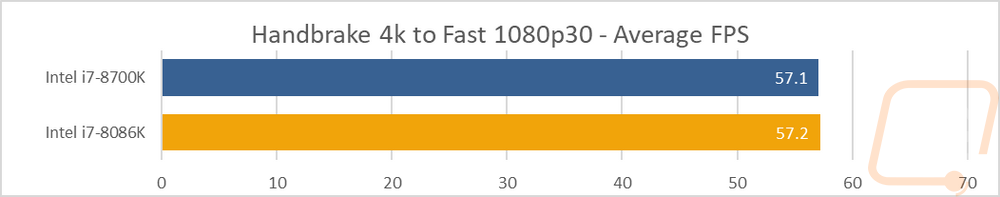
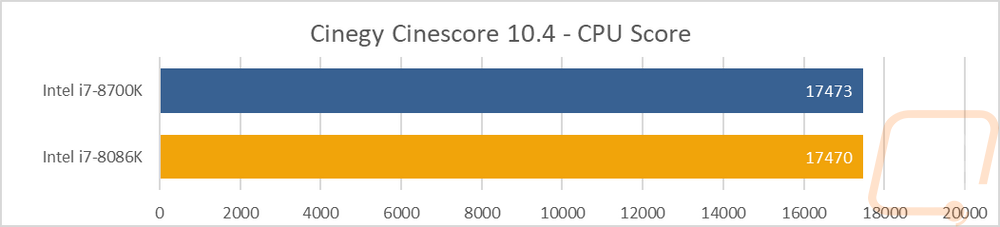
Speaking of our new benchmarks, here are three of them. With Blender, I am using their new timed benchmark. Even the quick benchmark mode takes a while, but it does run through two renders the classic BMW scene and then the longer classroom scene. The times are combined and a lower score is better. The 8700K and 8086K came in almost exactly the same, with just one second between them. In our Handbrake test, I use the 2D 4k60 version of the Big Buck Bunny movie and rip it down using the Fast 1080p30 preset. Near the end of the render, I take the average FPS. Once again both CPUs were basically exactly the same, with just a .1 FPS difference. The i7-8086K was the one that came out ahead. The next test is also a video production test, this is the Cinegy Cinescore 10.4 test. Cinegy is a real media video editing platform. The benchmark runs through a lot of different situations going all the way up to 8K tests across a whole stack of formats for each resolution. For this one I focused on the CPU score and no surprise, they were within 3 points of each other. With the being 8700K was slightly ahead.
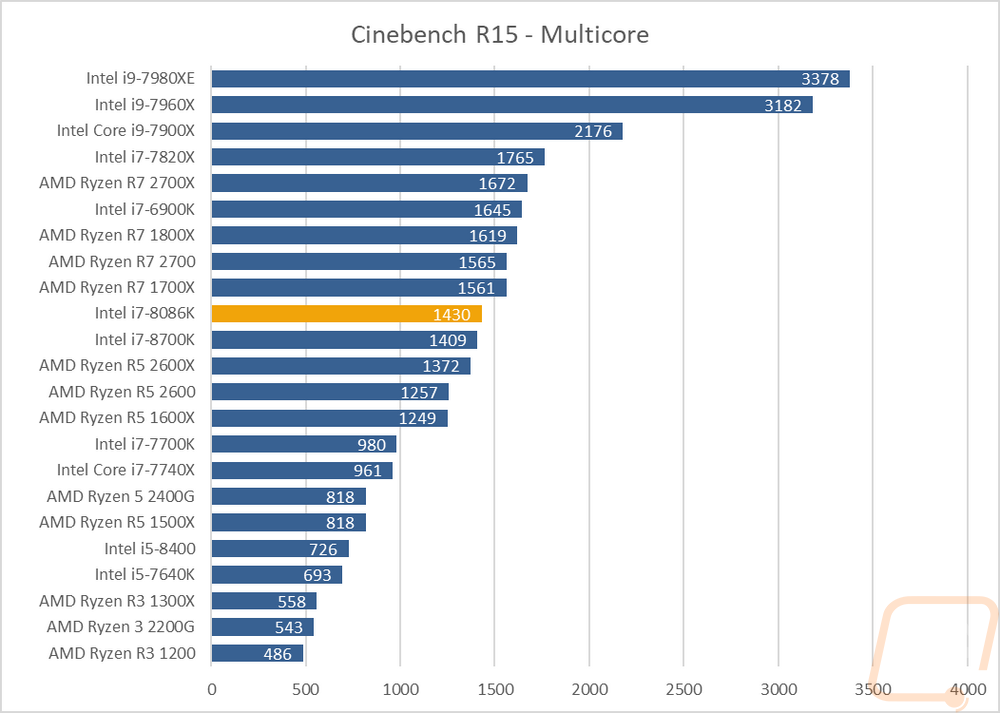
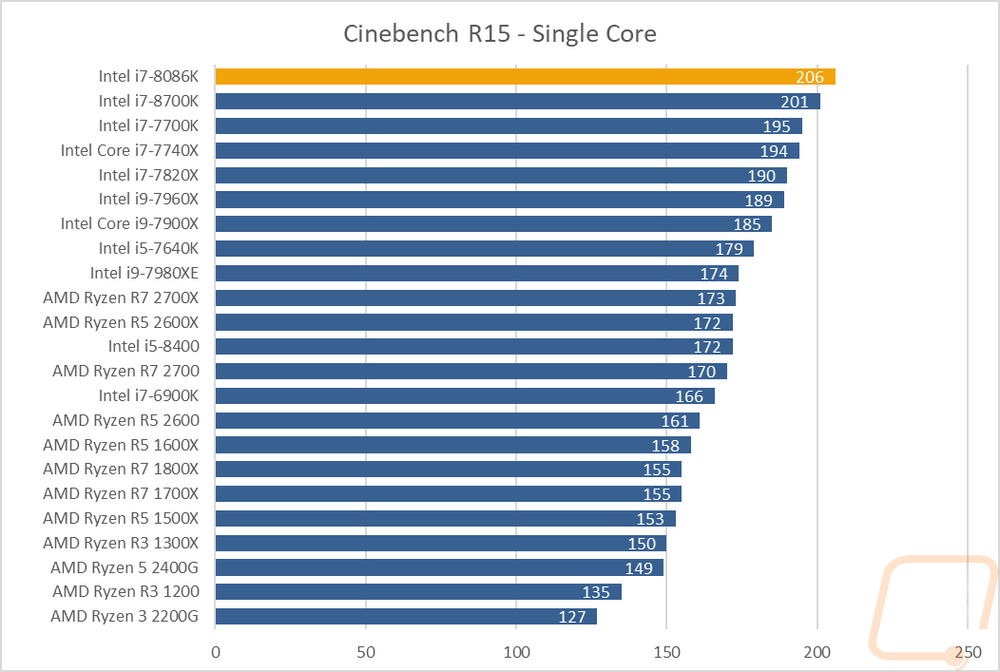
I didn’t forget about my favorite benchmark, Cinebench R15. The reason I love this test is because it lets us look at both single and multi-threaded results to get a good look at both of those situations with the same test. Bonus points because over the last few years we are finally seeing Intel and AMD also promote these results, mostly because of the push for more cores. Anyhow in the Multicore test, the 8086K is just above the 8700K, putting it just behind all of the 8 core Ryzen CPUs. Switching to just one core the 8086K jumps to the top of the charts. The 8700K was the fastest before, so it isn’t a big surprise that the same CPU with a higher base and boost clock would perform well here.
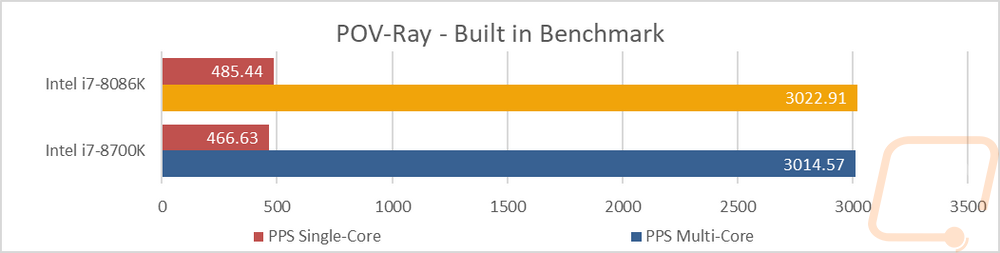
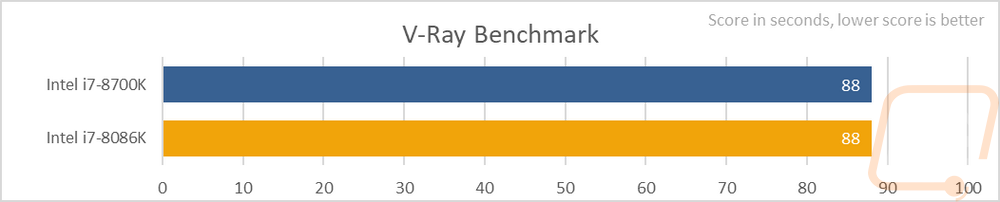
Two more new tests! These are a little trendy given Nvidia’s recent announcements but I actually added them before that. So we have POV-Ray and V-Ray benchmarks, two different ray tracing benchmarks. The POV-Ray benchmark uses the POV-Ray benchmarking guidelines on their website including their benchmark scene. This one is especially cool because it tests with a single core and all 6 cores/12 threads. The 8086K did especially well in the single core test, but it came out ahead in both results. Then the V-Ray benchmark is the standalone benchmark directly from Chaosgroup and it is a simple test that runs on the CPU then again on the GPU. For now, the CPU result is all I needed and both CPUs ended up with the same 88-second score. I can’t wait to get more testing done with the rest of our CPUs to see where everything else lands. I just added these new tests last minute and figured if nothing else giving everyone the change to be able to test their current CPU and compare would be better than hold them back for our next coverage.
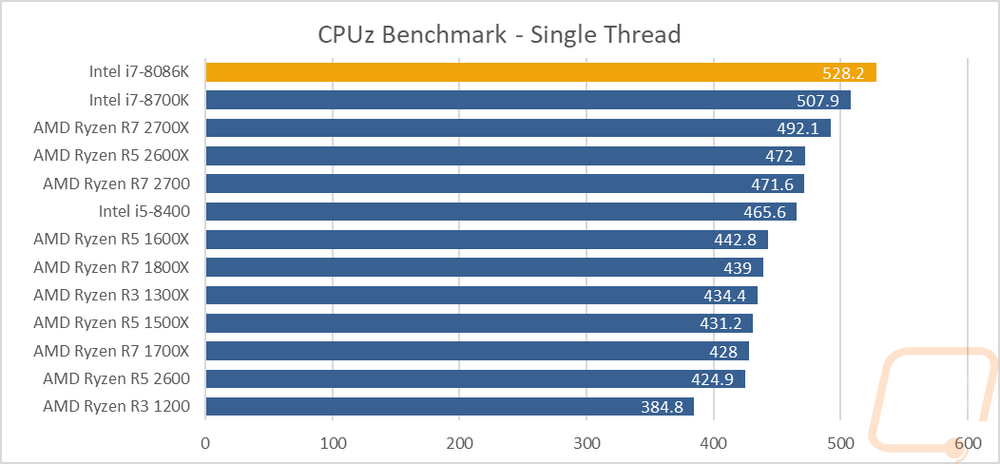
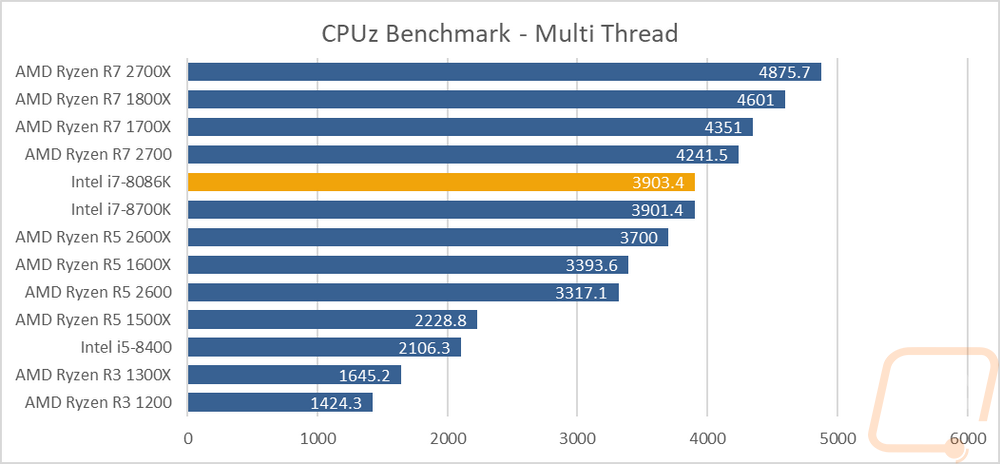
 Our next test is the built-in benchmark in CPUz, this is also another single and multithread test. In the single threaded test, the 8086K was well ahead of the rest of the CPUs tested with the 8700K being the next closest result 21 points lower and the Ryzen 2700X below that by another 15 points. The multi-threaded test, on the other hand, has the 8068k down lower below all of the 8 core Ryzen CPUs. It is up above all of the Ryzen 6 cores and the 8700K as well though only by a tiny margin on that one.
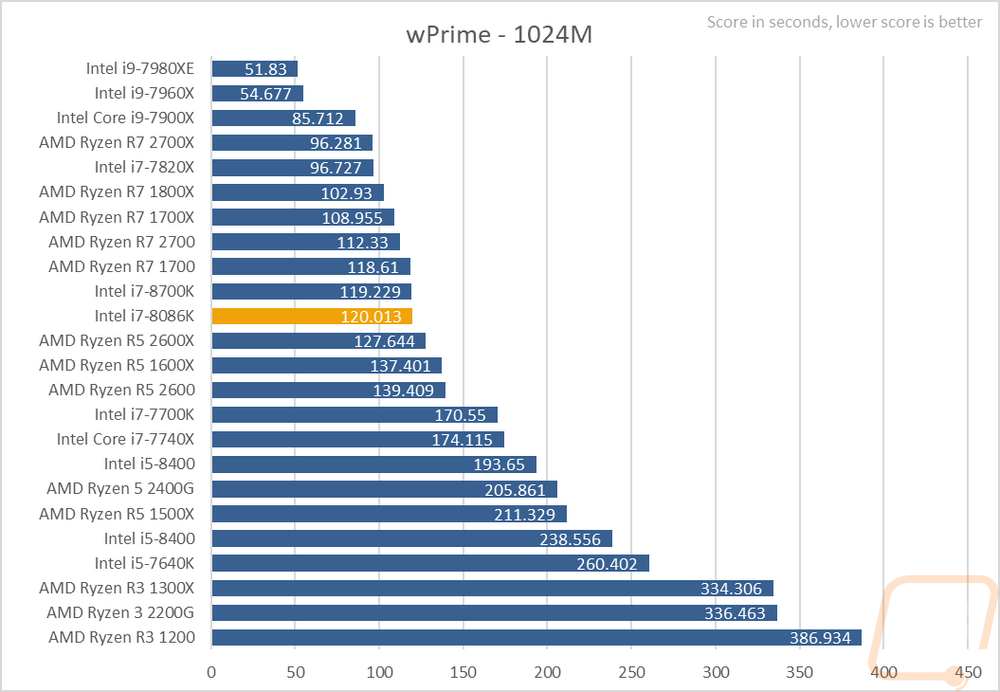
 For a math-based test, we have wPrime that calculates Pi to 1024 million characters and times in. This test the higher core count CPUs did much better including all of the Core-X CPUs up at the top. The 8086K, on the other hand, was still right there with the 8700K, actually performing a little worse by about .8 of a second. Now, this is still above the 2600X but below all of the 8 core Ryzen CPUs again.
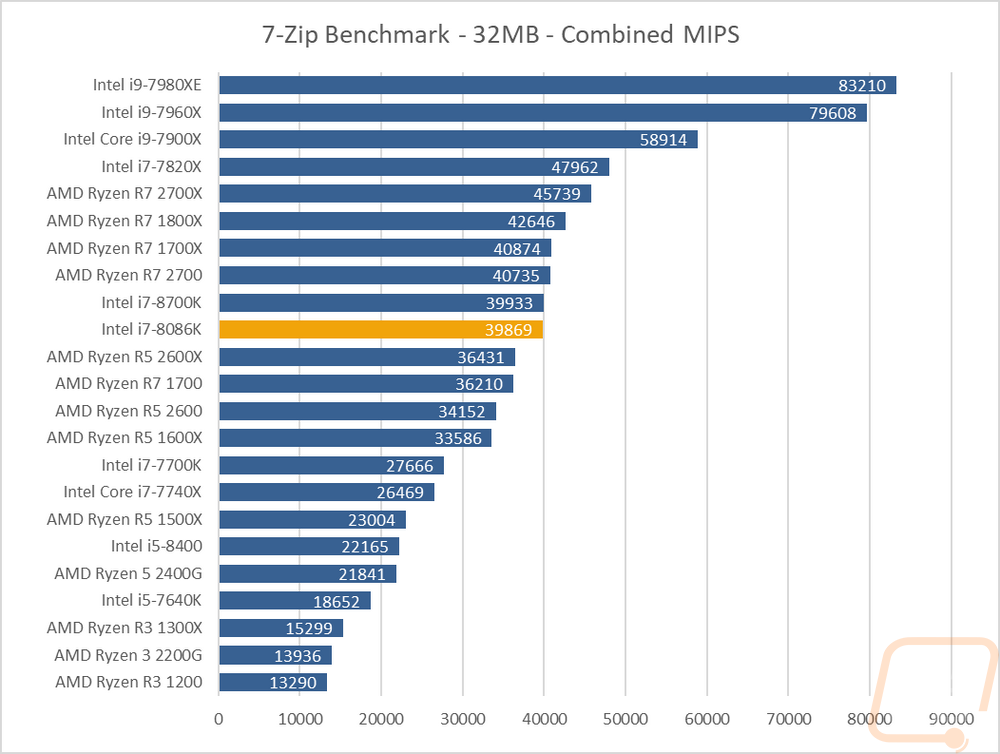
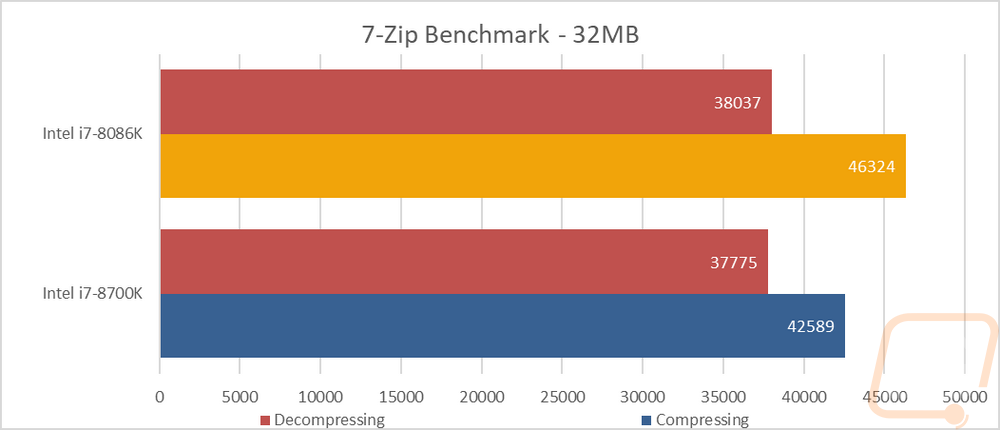
For 7-Zip I did our normal combined MIPS test where we use the combined performance of compressing and decompressing. But I also added in individual results for compressing and decompressing as well. The 8080K came in just behind the 8700K and once again behind all of the 8 core Ryzen CPUs. The new results show a little more though with the compressing performance of the 8086K noticeably better than the 8700K but decompressing was better on the 8700K slightly.
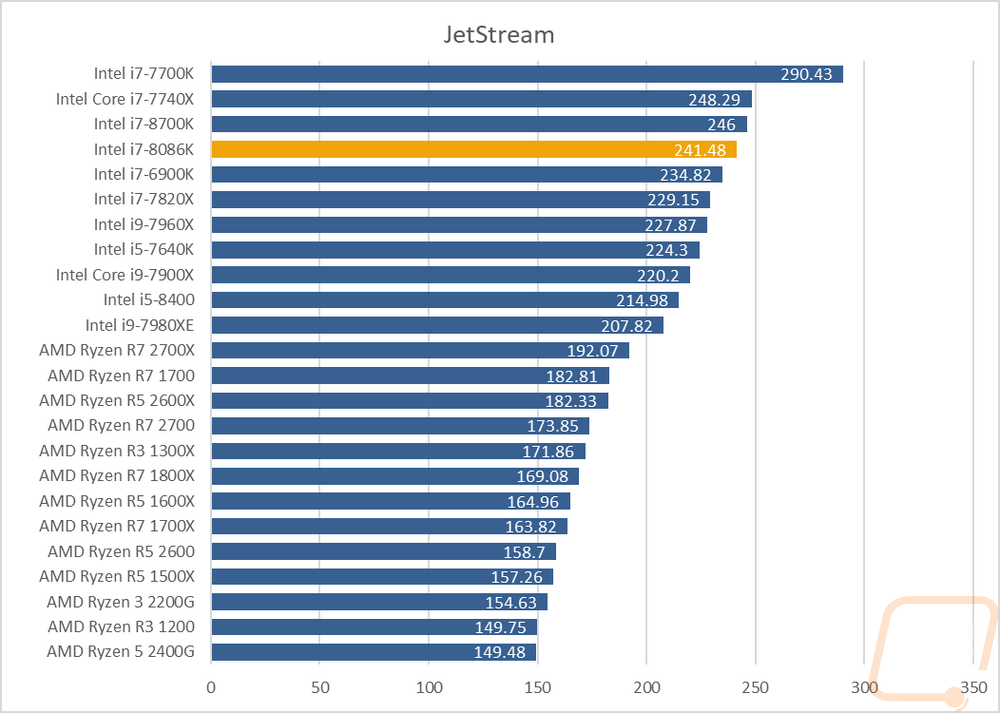
I always like to slip in a look at normal everyday web browser performance because for most people that is the most used program on their PC. Th test I used is the Jetstream test where it runs a long list of available browser benchmarks for Java and HTML5 and averages them all out into a score then retests two more times for an overall average. This test has always favored the Intel CPUs and it was no different this time. The 8700K did score slightly better than the 8086K though.
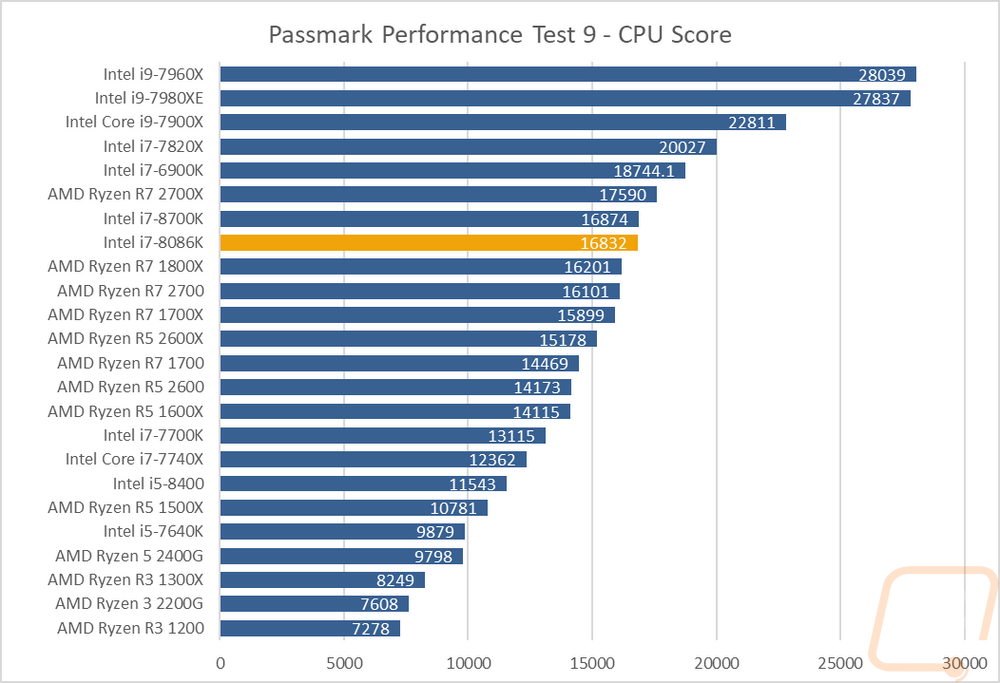
I tested using the Passmark Performance Test 9 CPU benchmark. This touches on a few synthetic tests covering different aspects. The overall score is then put together. Here once again the 8700K did come out ahead by a few points on the otherwise matching numbers. The Ryzen 2700X was ahead of the two but beyond that only the high core count Core-X Intels are higher.
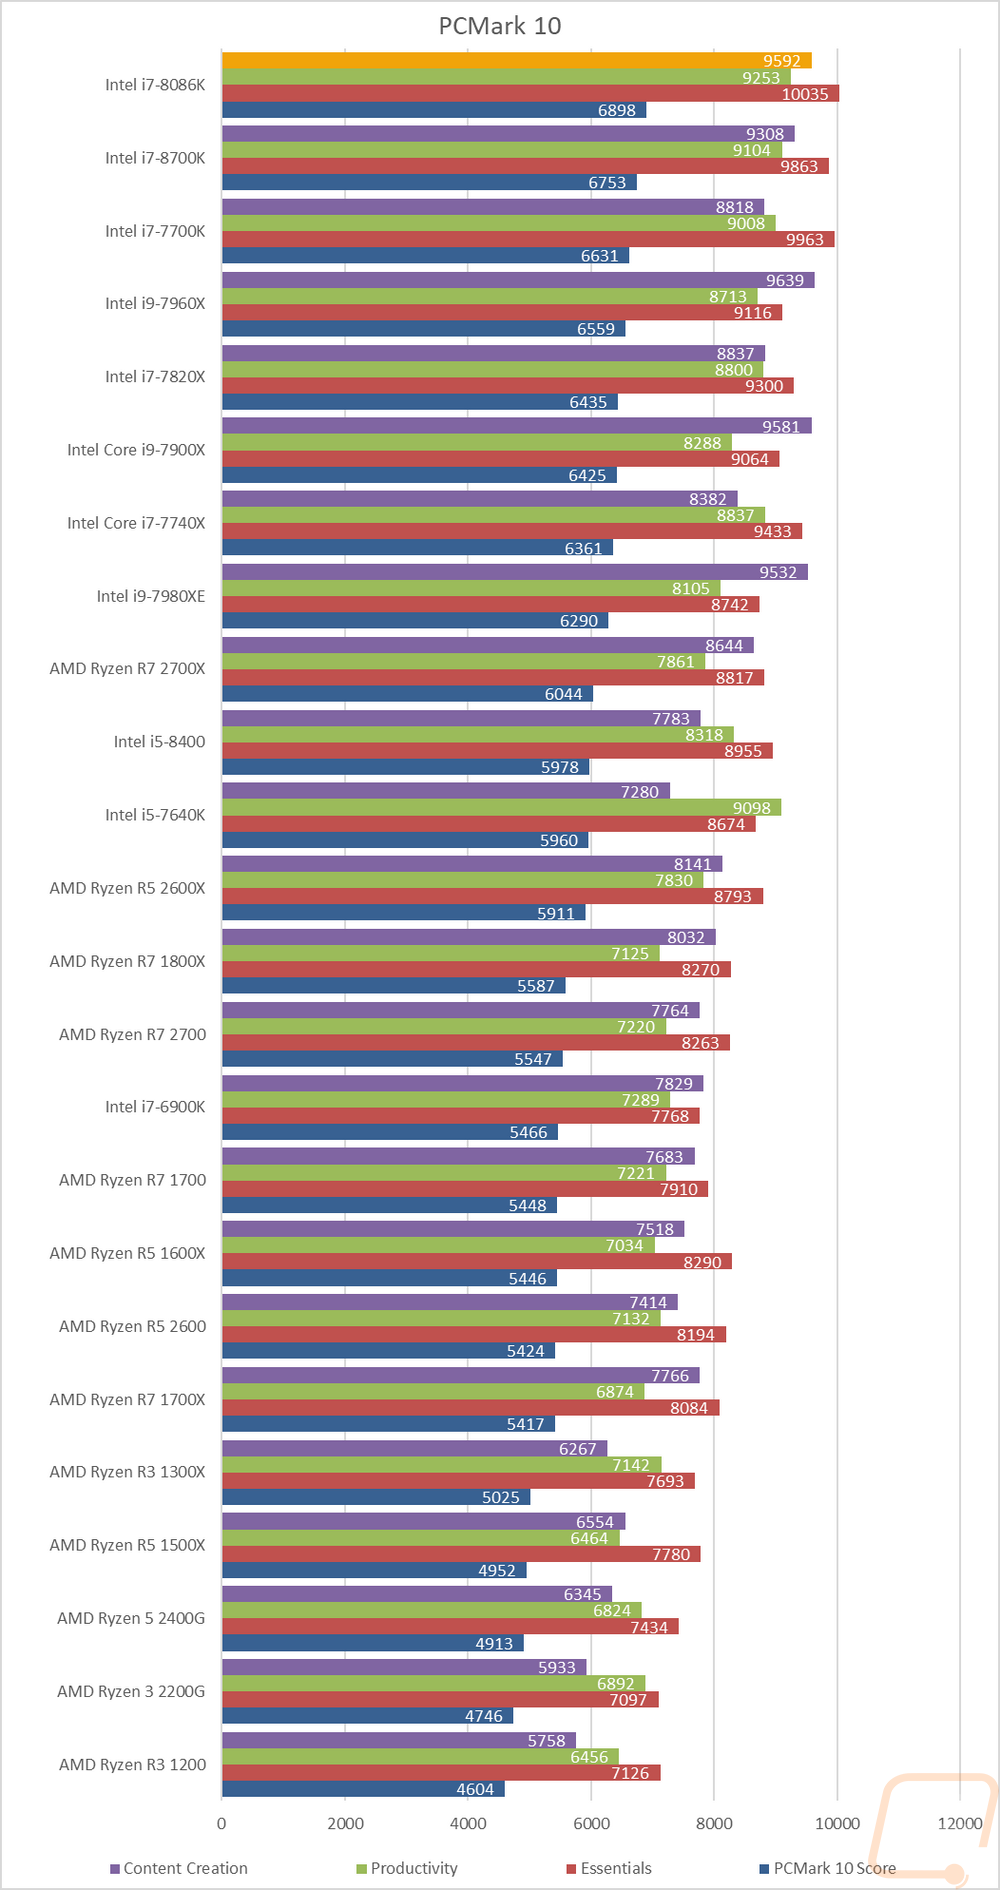
For a nice overall test I love using PCMark 10 because rather than a series of synthetic benchmarks, they use real-life situations like video calls, word processing, spreadsheets, and other work and home workloads. Because a lot of those favor clocks speeds over high thread counts, the 8068K did extremely well here, at the top of the charts in fact. This is one of the tests where it pulled ahead of the 8700K, better representing the higher clock speed than in other tests.
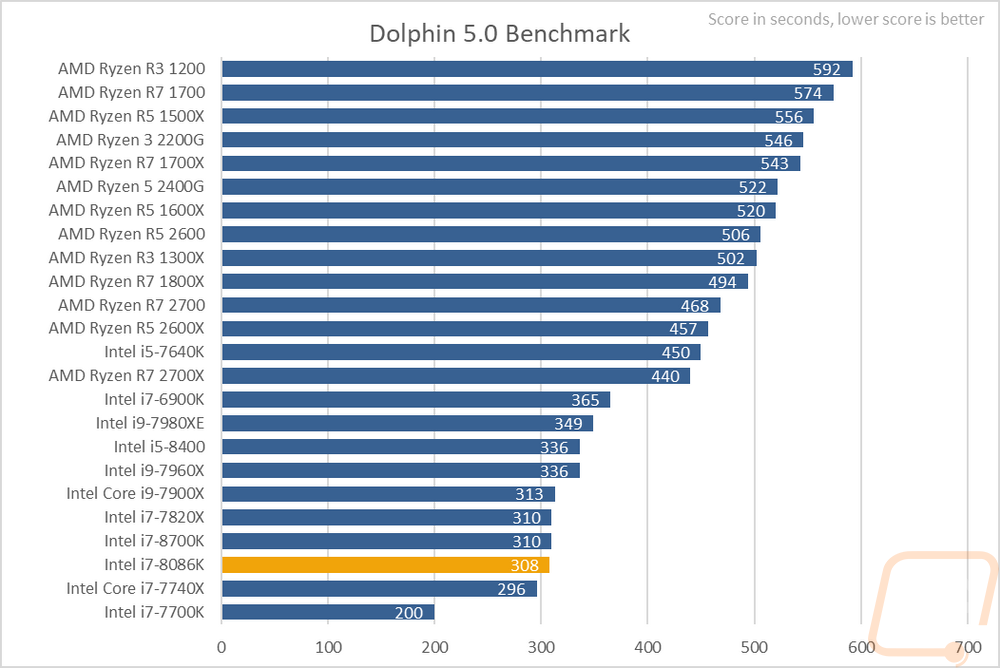
Dolphin 5.0 is a Wii and GameCube emulator and I love to use it to take a look at potential emulator performance, especially given how CPU heavy they are. The 8086K did really well here, coming in just before the 8700K and above even all of the Core-X CPUs. The Ryzen CPUs fair even worse in this specific case, filling up the entire bottom half.
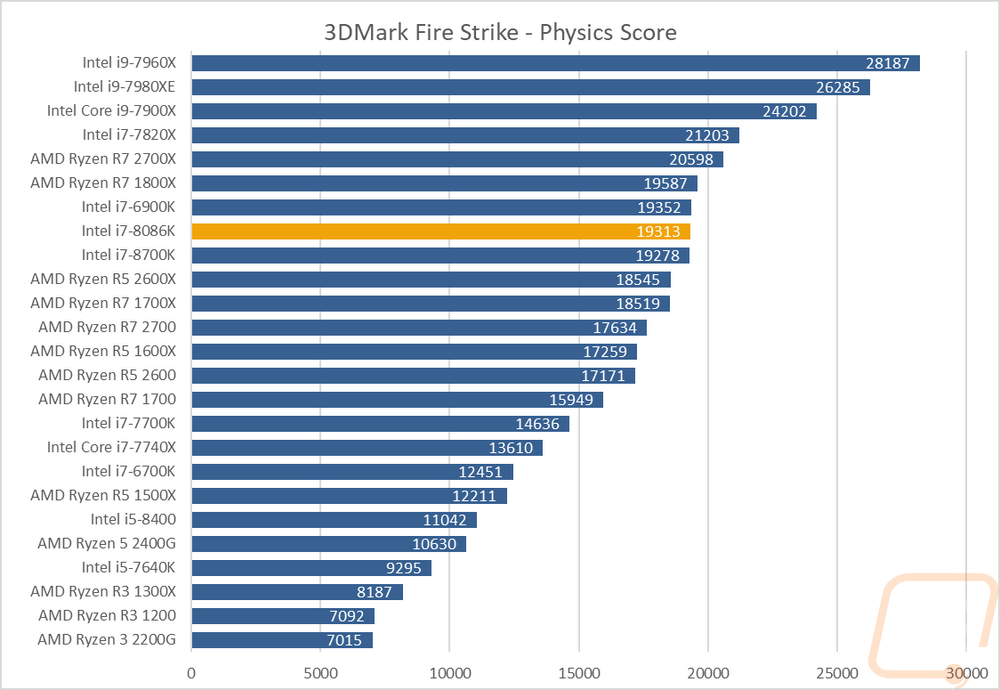
3DMark doesn’t really show exactly what FPS you will get in game, but it is a good fair benchmark that offers repeatable results. In this test, the 8086K and 8700K were both just below the 1800X and 2700X as well as all of the Core-X CPUs. This put it well above the Ryzen 6 core CPUs, including the newer 2600X.
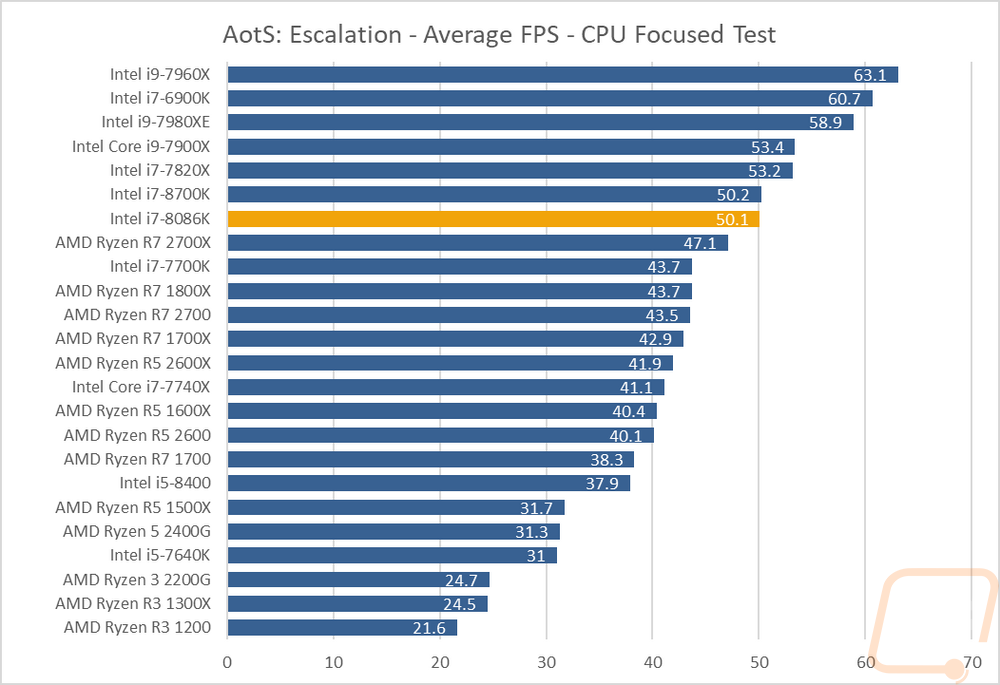
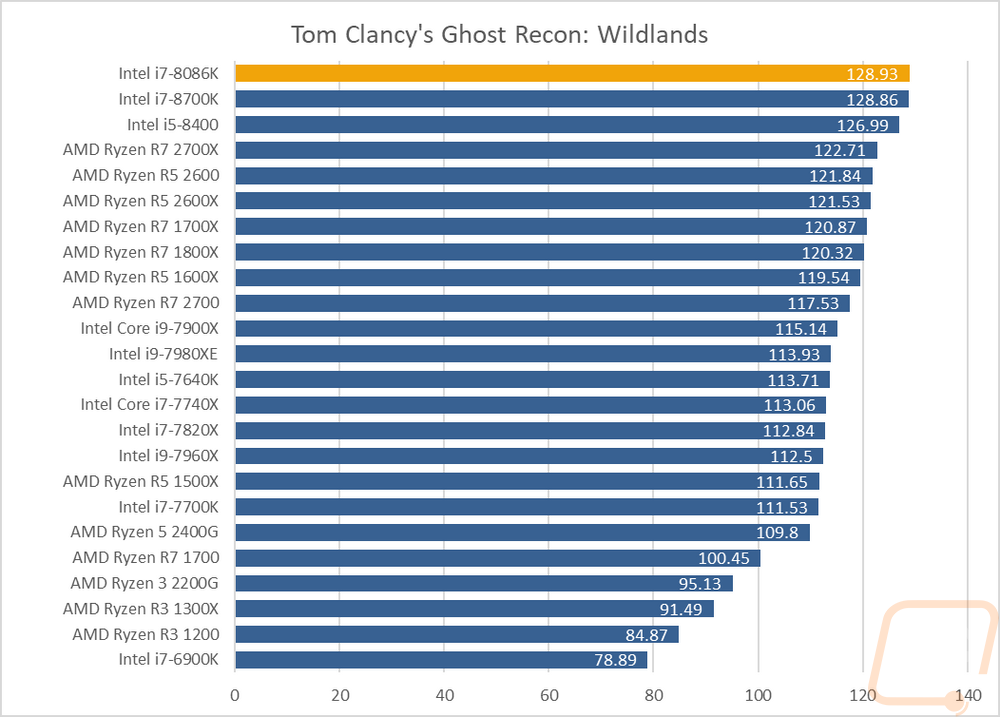
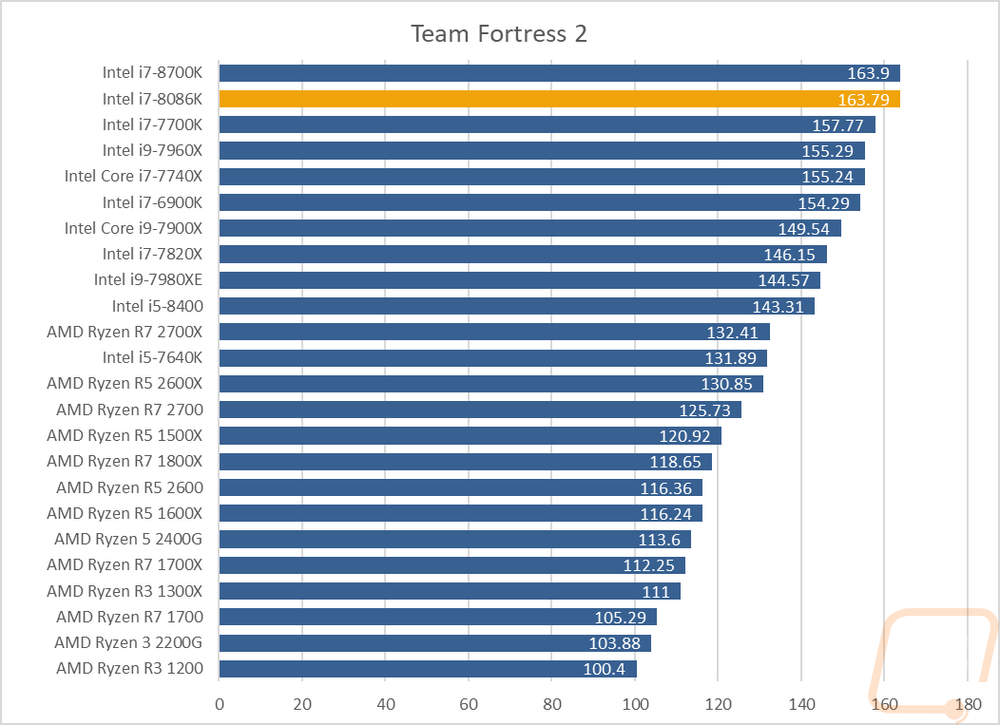
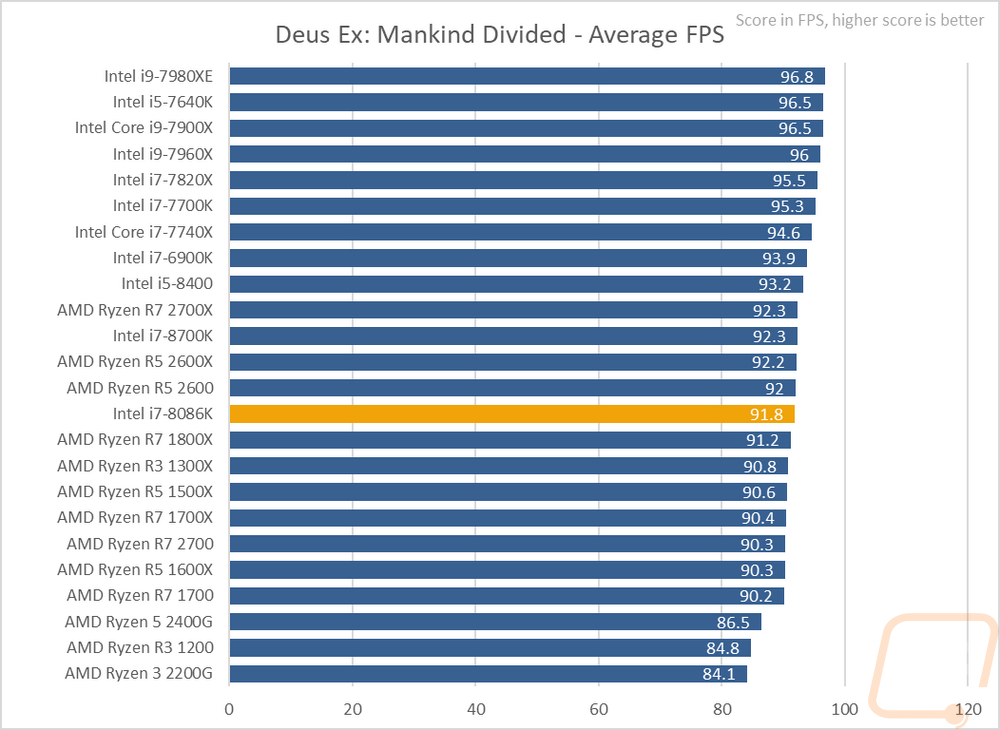
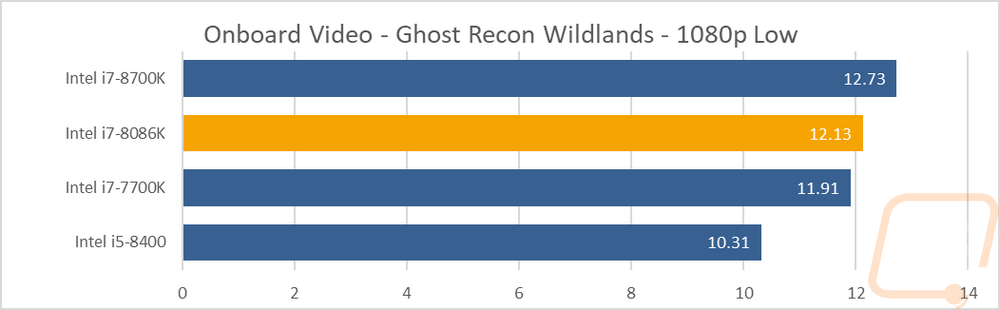
Finally, we have a few real in game benchmarks to take a look at. I try to keep a mix of tests so I include the CPU heavy Ashes of the Singularity using the CPU specific benchmark. The 8086K and the 8700K were basically the same then all of the Core-X CPUs filled out the rest of the top. The 2700X, even with its additional cores was down a little lower than the 8086K. In Ghost Recon Wildlands the 8086K did extremely well, coming in at the top of the charts with the 8700K, of course, chomping at its heels. This was a good 6 FPS up above the 2700X. For an old CPU limited game, we have TD2 and the 8700K and 8086K are once again up at the top only this time the 8700K edged out a .11 FPS lead. Then for the last test, we have Deus Ex: Mankind Divided where all of the CPUs are extremely close with the exception of the bottom three Ryzen CPUs. That said the 8086K didn’t do as well here.
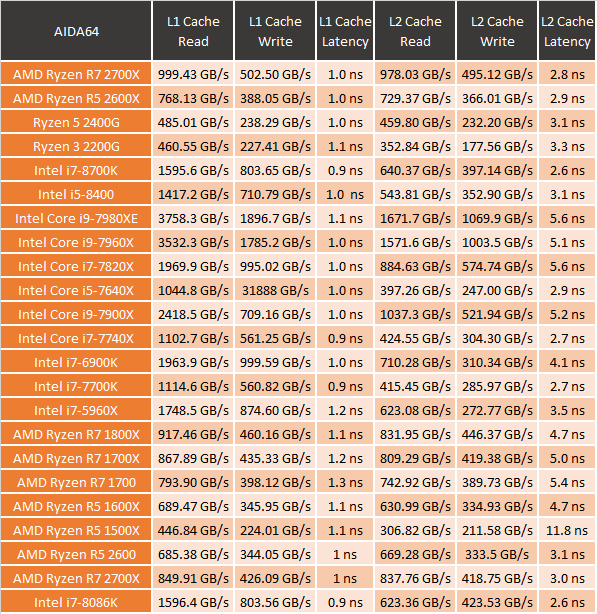
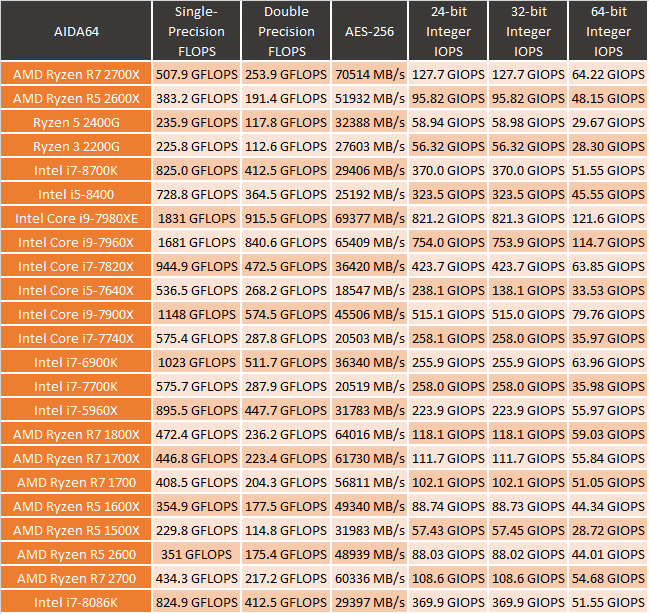
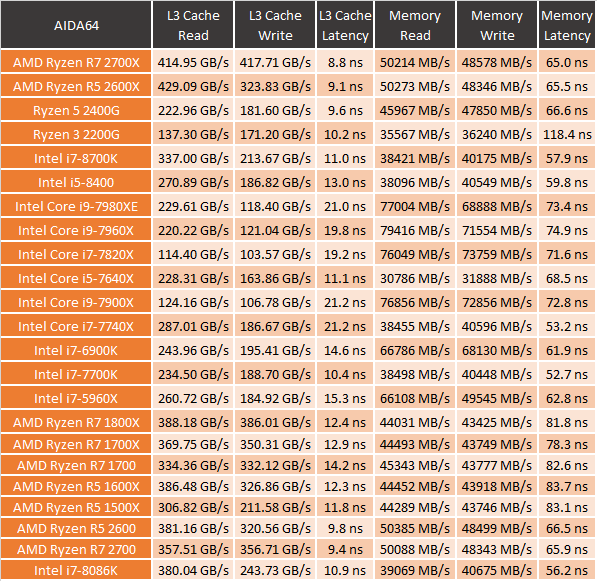
I also include a few tests from ADIA64 to take a look at Cache and memory speeds and latency as well as a few Precision FLOPS and Integer IOPS tests. There is just too much information to pack into a few small graphs though so I have the tables below. The 24 and 32-bit Integer IOPS of the 8086K are great when compared to Ryzen (right in line with the 8700K overall). Overall though all of the results are right there with the 8700K so no big surprised here, not that I expected any.
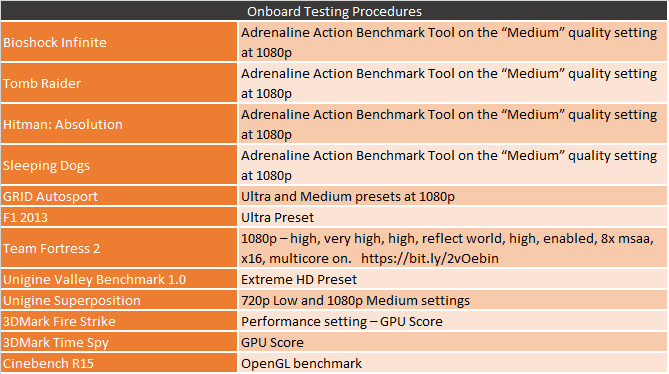
Onboard Performance
Okay so let me first say that nothing on the onboard side has changed from the 8700K, more importantly, this isn’t really a CPU that most people would be buying to use onboard video. But it is nice to know you have the option, assuming your motherboard supports it. So let's take a quick look at our onboard video test suite.
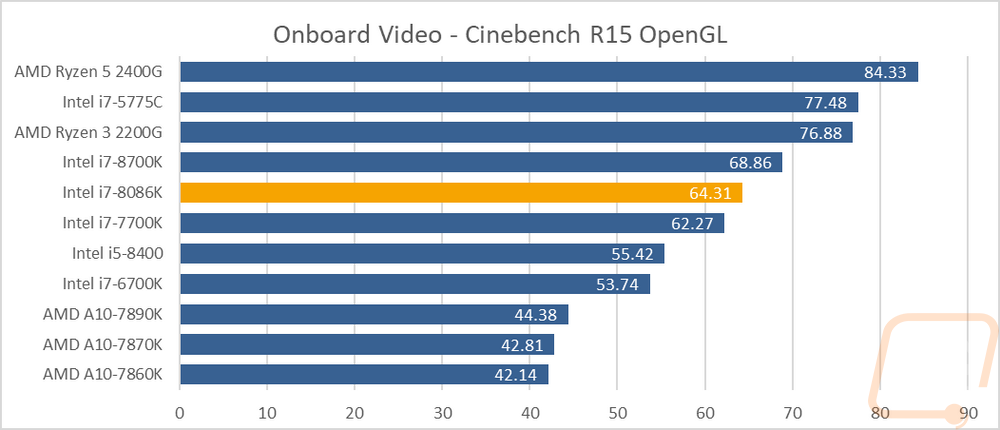
So the Cinebench R15 OpenGL test runs through a video rendering. Our 8086K came in noticeably lower than the 8700K here but no surprises here with the Raven Ridge Ryzen CPUs up at the top of the charts with the now dated but still fast graphics of the 5775C as well.
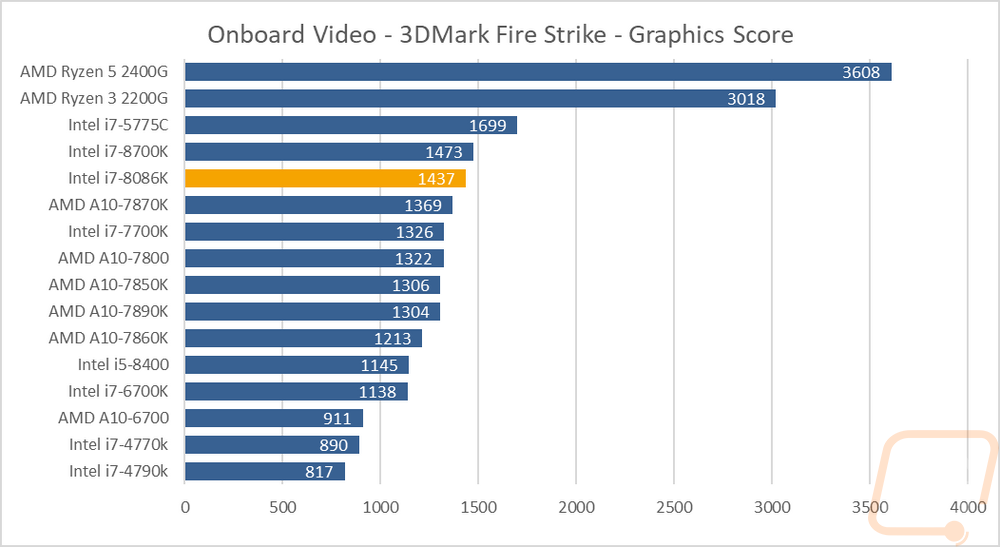
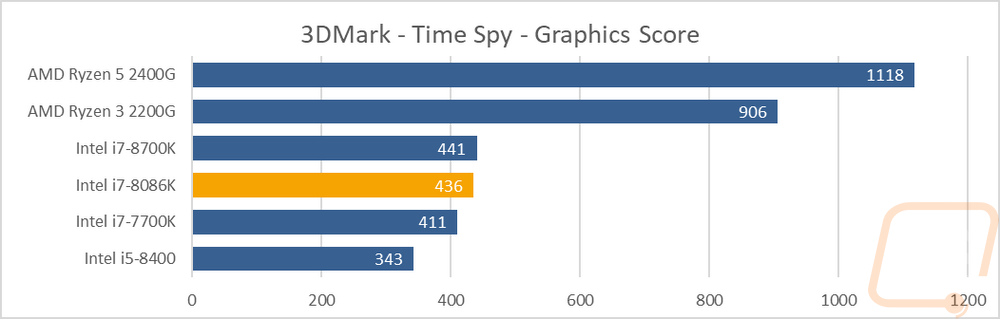
 Next, I fired up 3DMark to check out some synthetic gaming performance. To do this I ran the Fire Strike benchmark as well as the DX12 focused Time Spy. In both the 8700K was a little head with the Raven Ridge CPUs from AMD way out in front.
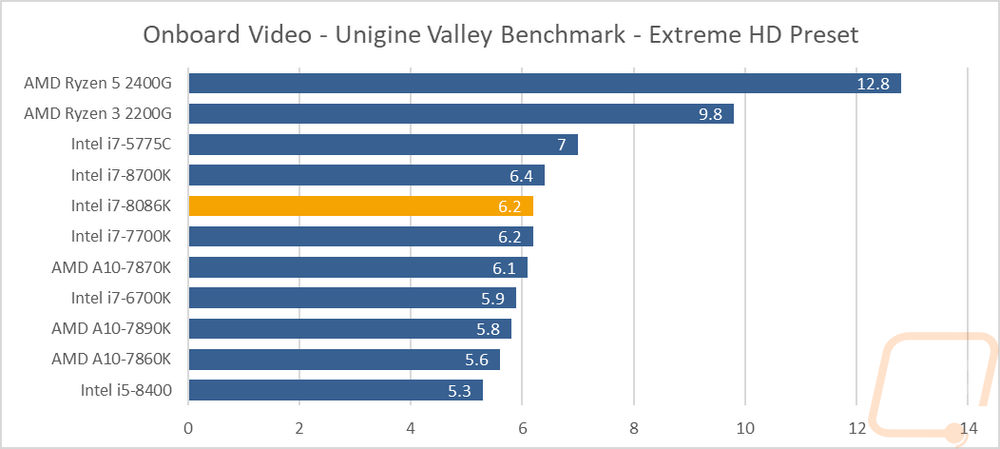
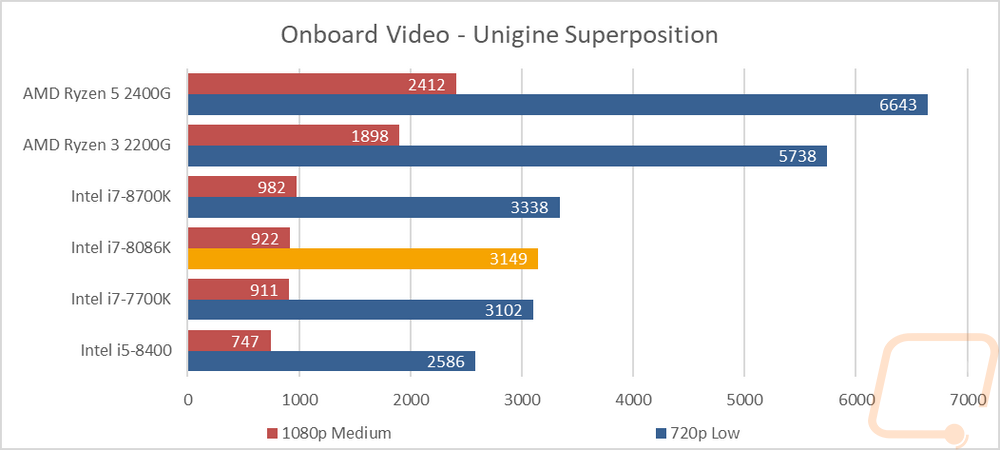
On a similar note, I ran Unigine based Valley Benchmark and the newer Superposition test. It's important to point out that the now dated Valley benchmark struggled on all of the CPUs with at best 12.8 FPS but the 8086K was again just below the 8700K and well below the 2400G and 2200G. Superposition was similar, only with point ratings, not FPS averages. That said doing those tests at 1080p on medium and 720 low were MUCH smoother.
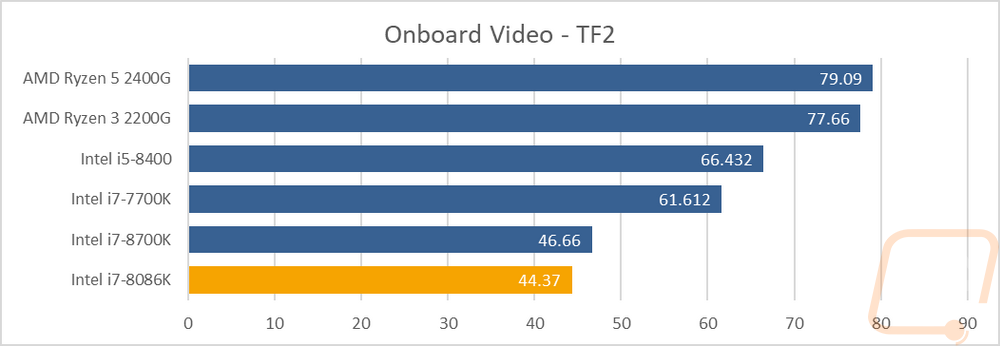
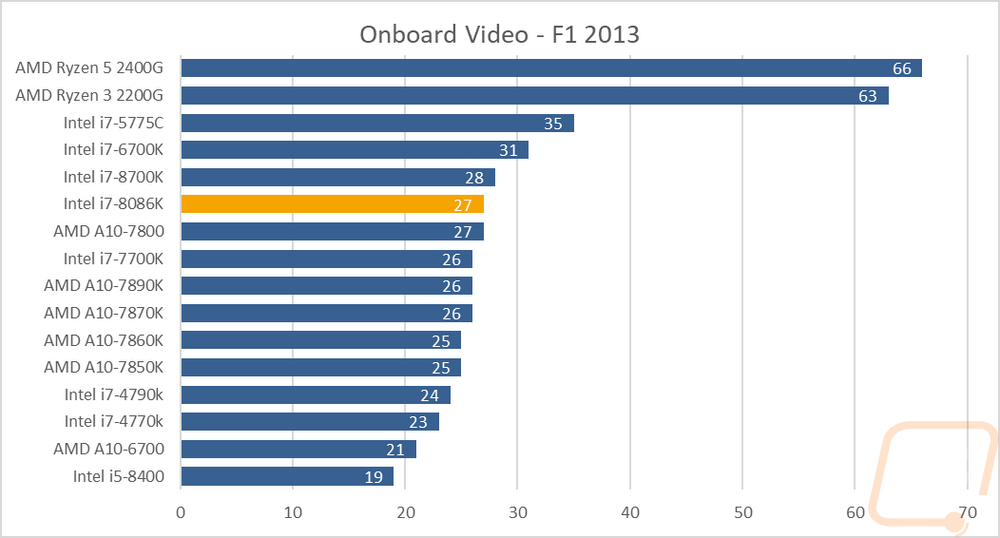
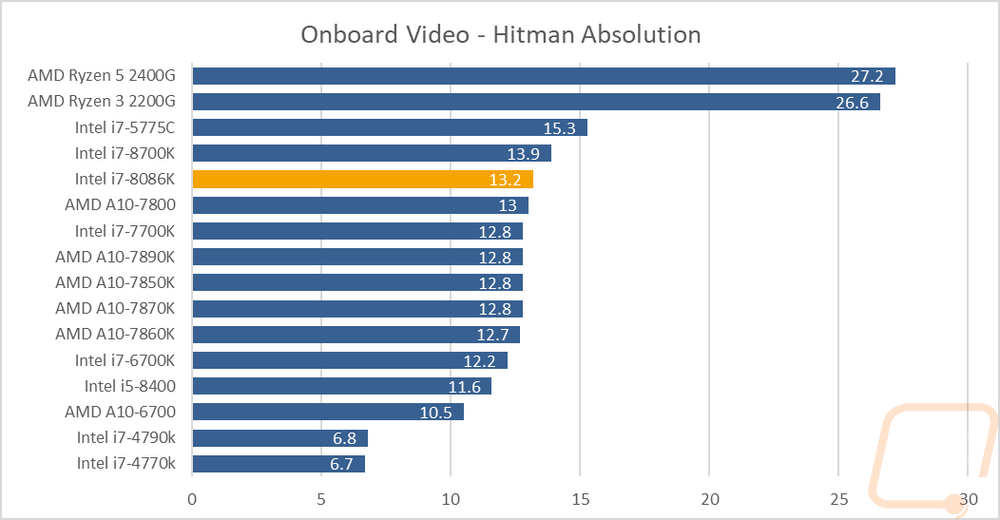
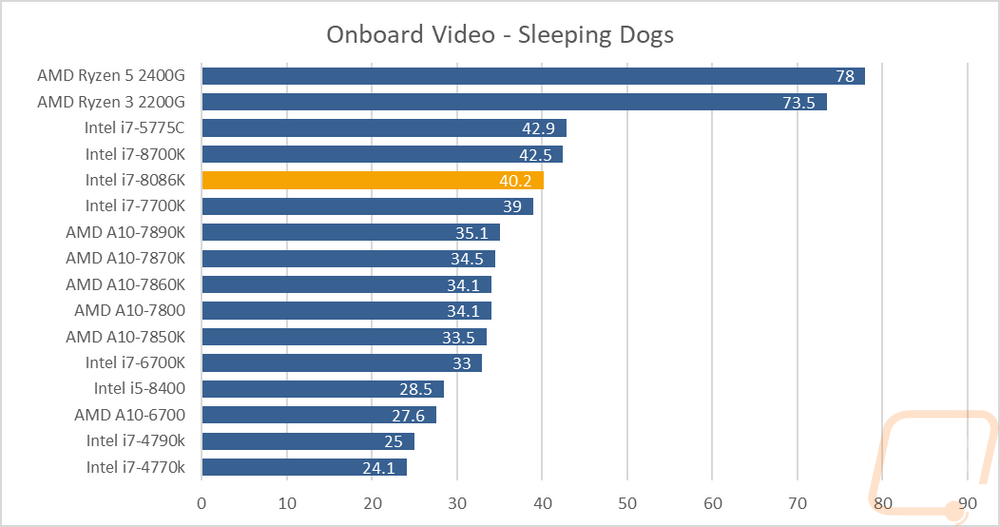
Then from there, I did real in game benchmarks to get a look at overall performance in game. With games like TF2 that are older, I was happy to see that the game was more than playable at 44 FPS. Of course, that was nearly half of the Raven Ridge results. Newer games like Wildlands didn’t go as well, even at the low setting 12 FPS isn’t anything I would want to try to play with. That said there were multiple games with at or over 30 FPS that would be more than playable. That said I would never recommend the 8086K for onboard performance.
Power Usage and Temperatures
My last few tests are what I consider some of the most important. That is because no matter how fast a CPU is, if it requires your own power plant to run or runs extremely hot it might not work in your build. If nothing else it is important to know what you need to plan for your case, cooling, and power supply.
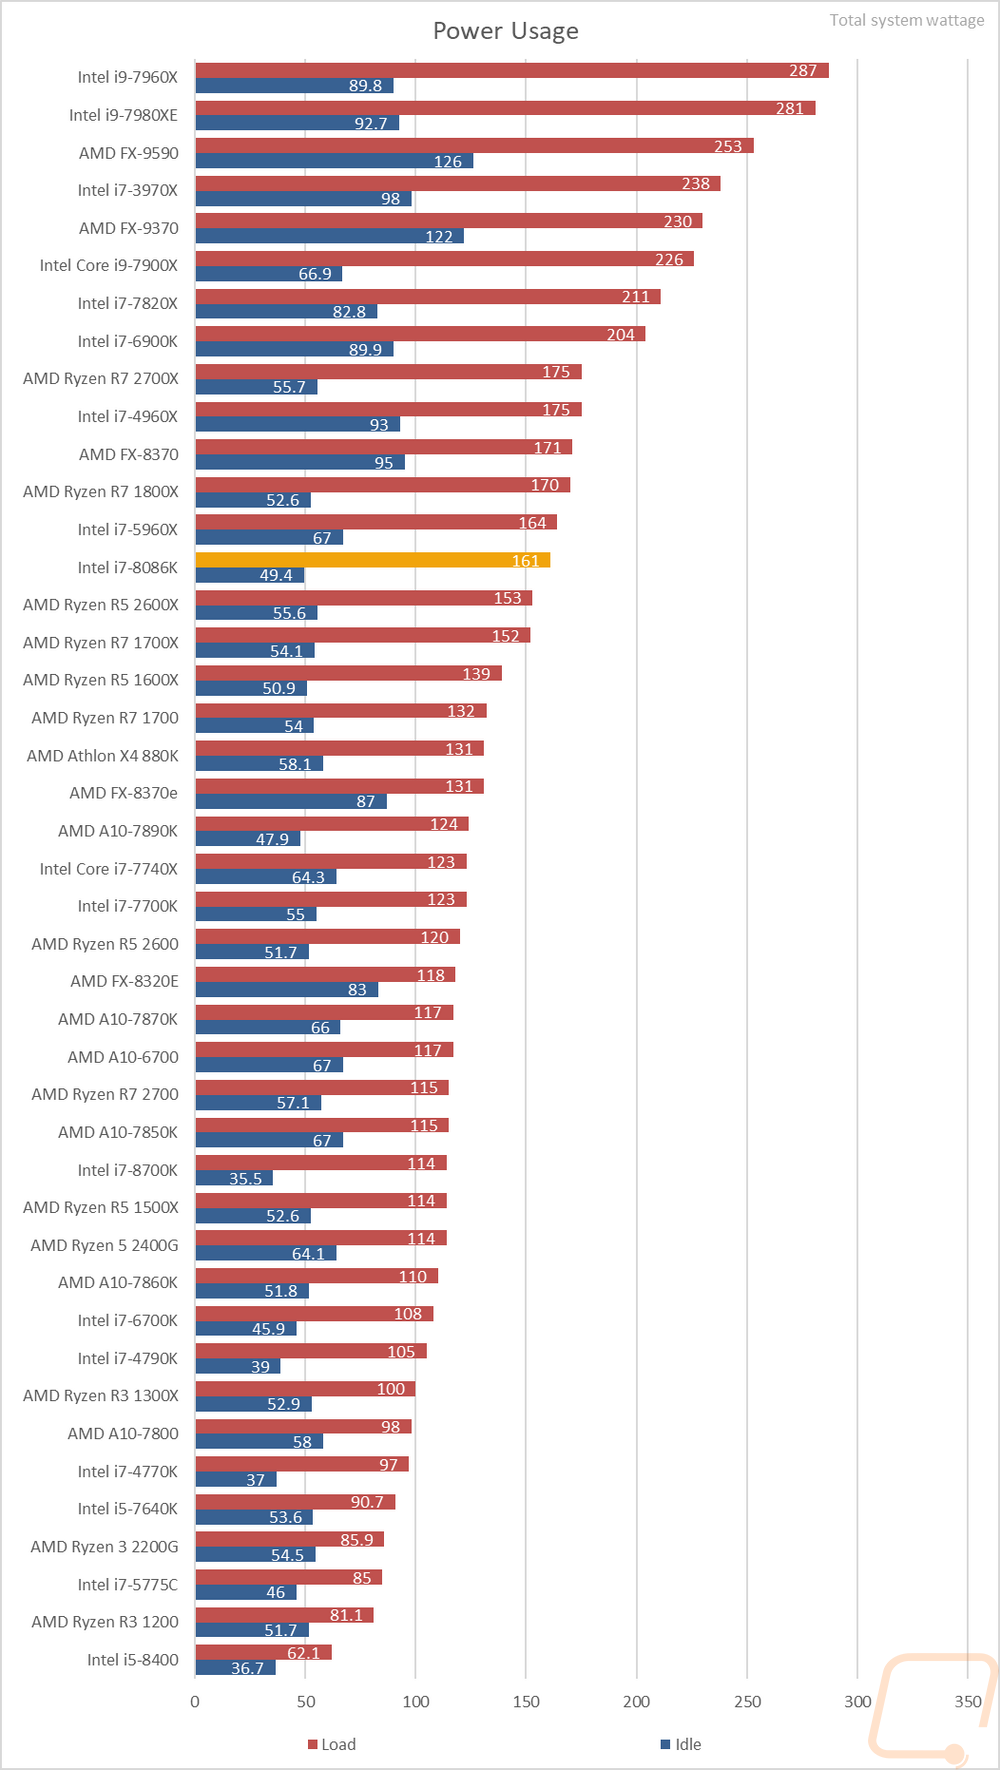
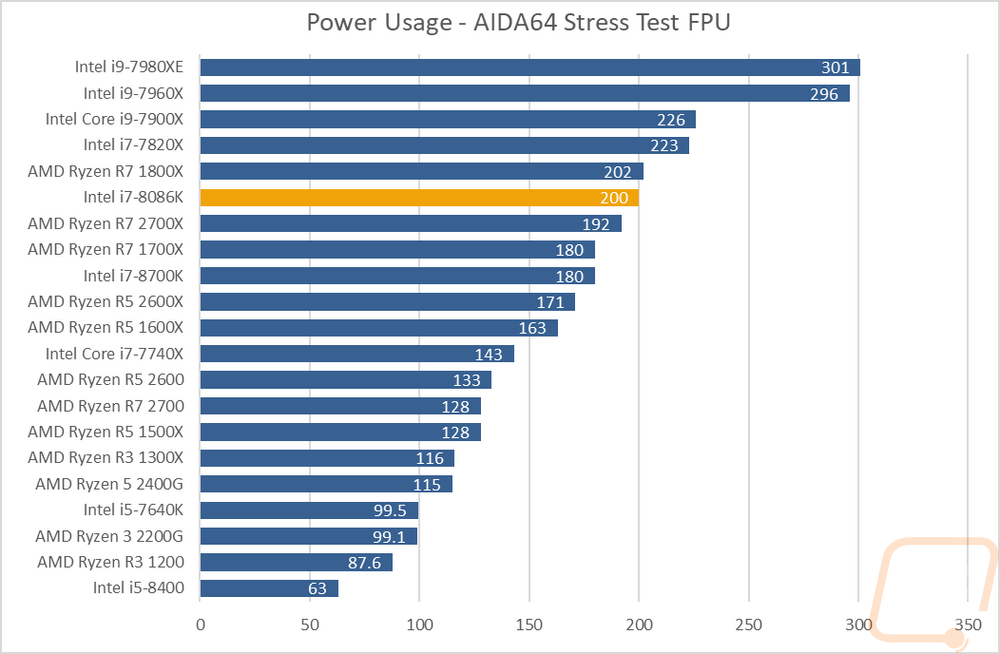
I start with power usage. I ran two sets of tests, both using the Kill-A-Watt to measure the wattage at the plug for our test system. The first test is our older test where I use wPrime to load the CPU and the second is our new test that uses the AIDA64 FPU stress test to put even more of a load on the CPU. In the wPrime test, the 8086K and the rest of our test system pulled 161 watts at peak. When running at idle it pulled 49.4 watts. Now, this wasn’t as bad as the high core count Core-X CPUs from Intel as well as the fastest of the Ryzen 8 core CPUs with the 1800X and 2700X. It was however much higher than the 8700K. In the AIDA64 test, the 8086K pulled 200 watts, coming in just below the 1800X and 20 watts above the 8700K.
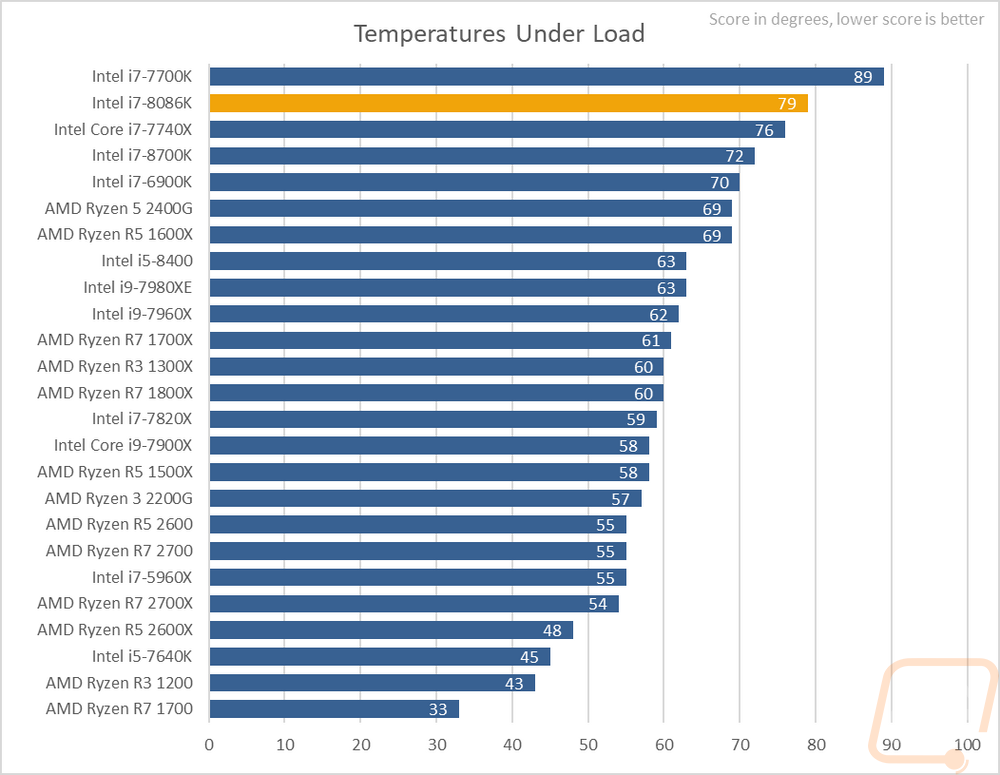
Now the temperature testing, that was also done using AIDA64’s FPU stress test the 8086K was really pushing the limit on the Noctua NH-U12S cooler that we use for all CPU testing. At 79 degrees it was 7 degrees higher than the already hot 8700K and well above all of the Ryzen CPUs that it is competing with. It’s clear those increased clocks really push the limits of the cheaper thermal interface material, this isn’t a huge shock because it was an issue on the 8700K and the 8086K with its higher clocks is only going to be affected even more by it. Now given that the 8086K is binned higher than the 8700K it is known to be a better overclocker when delidded. Check out der8auer reaching 7244 MHz back in June.
Overall and Final Verdict
Well, the i7-8086 is an interesting CPU from Intel for a whole variety of reasons. For starters, it is rare that that have limited edition CPUs available. But more importantly they really only had one chance at honoring the original 8086 and it had to be in their 8000 series of CPUs, that just happened to fall close to the 40th anniversary as well. To celebrate that, edging an i7-8700K up to 5 GHz in a retail product was a nice touch and the first time Intel has ever done that. AMD did do something similar with the FX-9590 back in 2013 only the FX line even at the time was a lot farther behind compared to the market. Anyhow while I don’t think there are a lot of collectors looking to hold on to CPUs, the i7-8086K is going to be a special one looking back.
But how was the performance? Well with the base clock getting a 300 MHz bump up to 4 GHz and the boost clock reaching 5 GHz with a similar 300 MHz bump over the i7-8700K the performance was close to what you would expect. It was in line or a little faster than the 8700K in just about every test, especially when it came to single threaded applications. I do however think that a better cooling solution than our NH-U12S would help edge a little more performance out of the chip at stock. Delidding and upgrading the TIM could also do the same thing, really I was surprised Intel didn’t go with a soldered heatspreader for this special CPU. That along with the clock speeds would have helped justify the price more and give enthusiasts a real reason to want to go for this over the i7-8700K. Now it is still the fastest CPU you can get on Intel’s mainstream lineup and for overall IPC it is the fastest on the market. Gaming performance was especially good, just like on the i7-8700K, this is an area where Ryzen is still catching up.
So where does this fit in the market? Well with an MSRP of $425 this is an expensive CPU for the mainstream lineup. The i7-8700K has an MSRP of $359 and even at that price is expensive compared to the Ryzen 2700X. Not to mention with the 2700X you are getting a semi-capable cooler as well but the 8086K you are going to need to get a decent heatsink or AIO. Now the 8086K is available for a little less than the MSRP on Amazon right now at $399.99 so that helps a little. But the price overall is a bit of a sticking point. Of course, if you want the bleeding edge in gaming performance your top two options are the i7-8700K or the i7-8086K. You can go with the 8700K you shouldn’t have an issue overclocking up to 5/5.1 GHz or you can spend the extra money and not have to do the work with the 8086K. Of course, if you can better take advantage of multi-threaded applications and gaming isn’t your only priority Ryzen might be the better option right now, at least without looking at the Core-X line that is much more expensive.
Live Pricing: HERE
