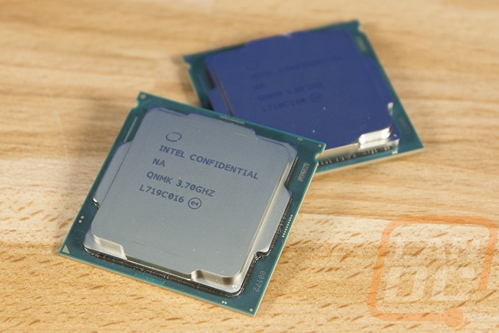
CPU Performance
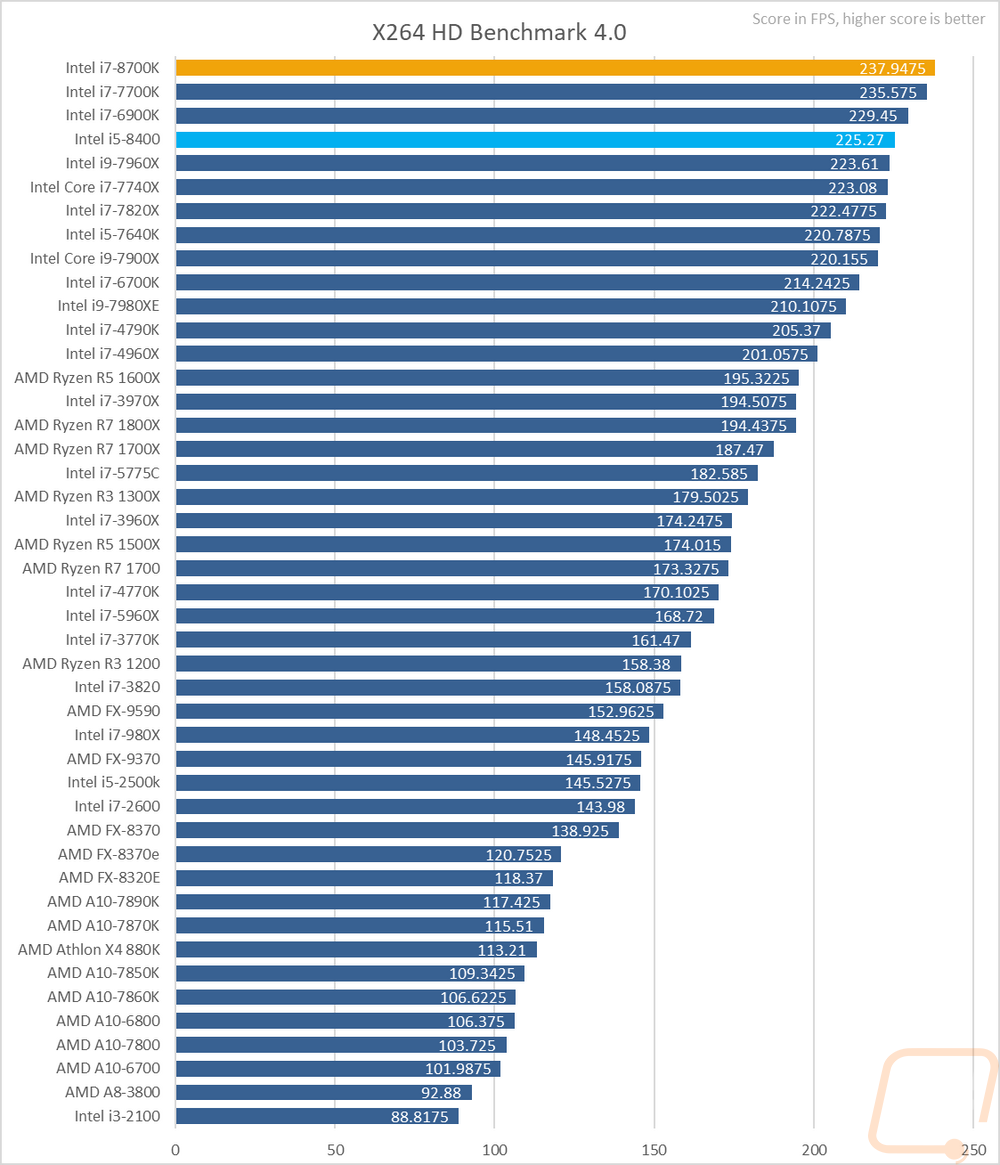
So we can finally dive into performance and to do that I started with X264 HD Benchmark 4.0. This tests overall encoding speed when encoding and the CPUs are ranked by the average FPS that they ran. This is a test that typically favors clock speeds a touch more than core count but it does take both into account. So it isn’t a huge surprise that the 8700K topped the charts above the 7700K. But did surprise me though was the i5-8400 trailing behind just slightly, topping the 7960X and all of those other high-end CPUs.
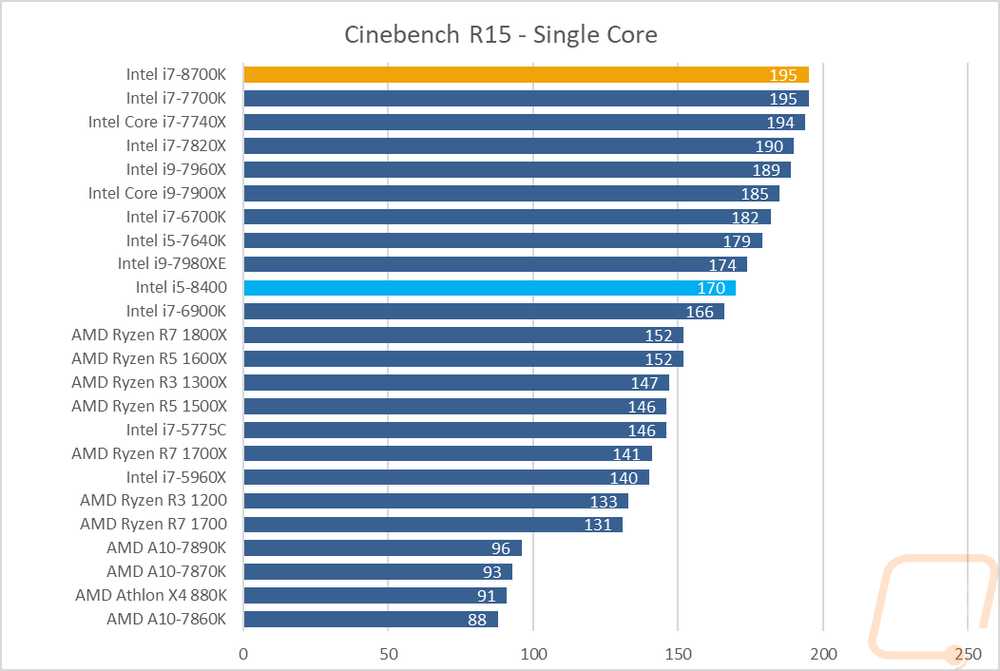
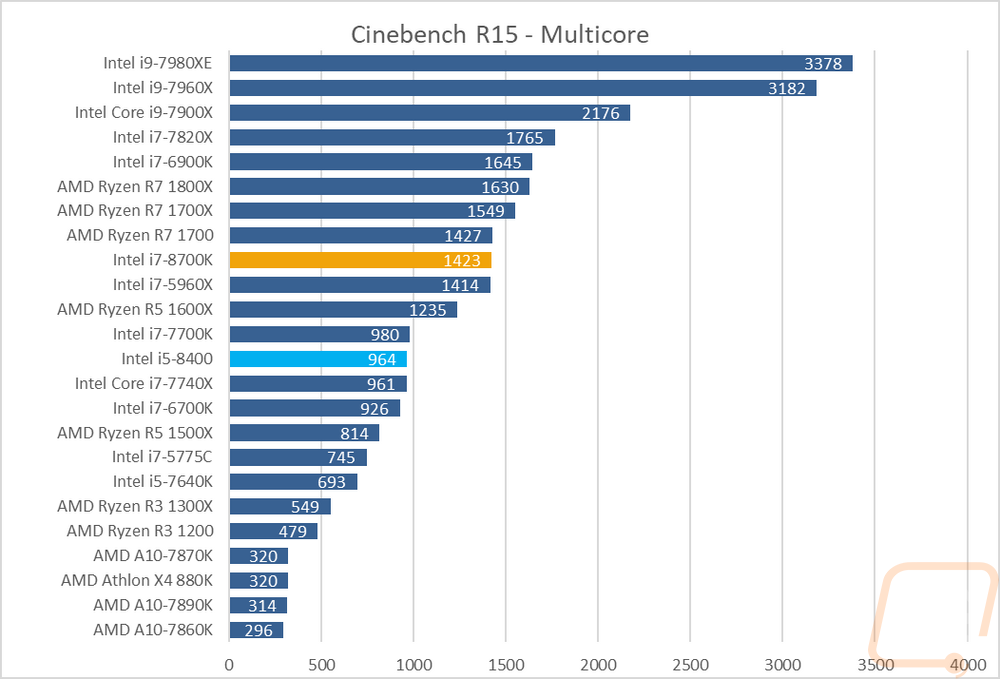
With that out of the way, I could finally get into my favorite benchmark, Cinebench R15. I like this one specifically because it does a test using all of the cores and then another with just a single core. More synthetic benchmarks should do this to give us a better look at performance in programs that don’t use all of your cores. On the single core test, the 8700K matched the 7700K perfectly with a score of 195. The 8400 was down much lower with its lower clock speeds but still up above all of the Ryzen CPUs. When running the multicore test things were a little different. Ryzen has 8 core CPUs and Intel has a whole list of high core count CPUs on the 2066 socket that bested the 8700K. It did still perform really well here and with a score of 1432 over the 7700K’s 980 you can really see how much the two extra cores help. The 8400 comes in right with the 7700K on this one, not bad for an i5.
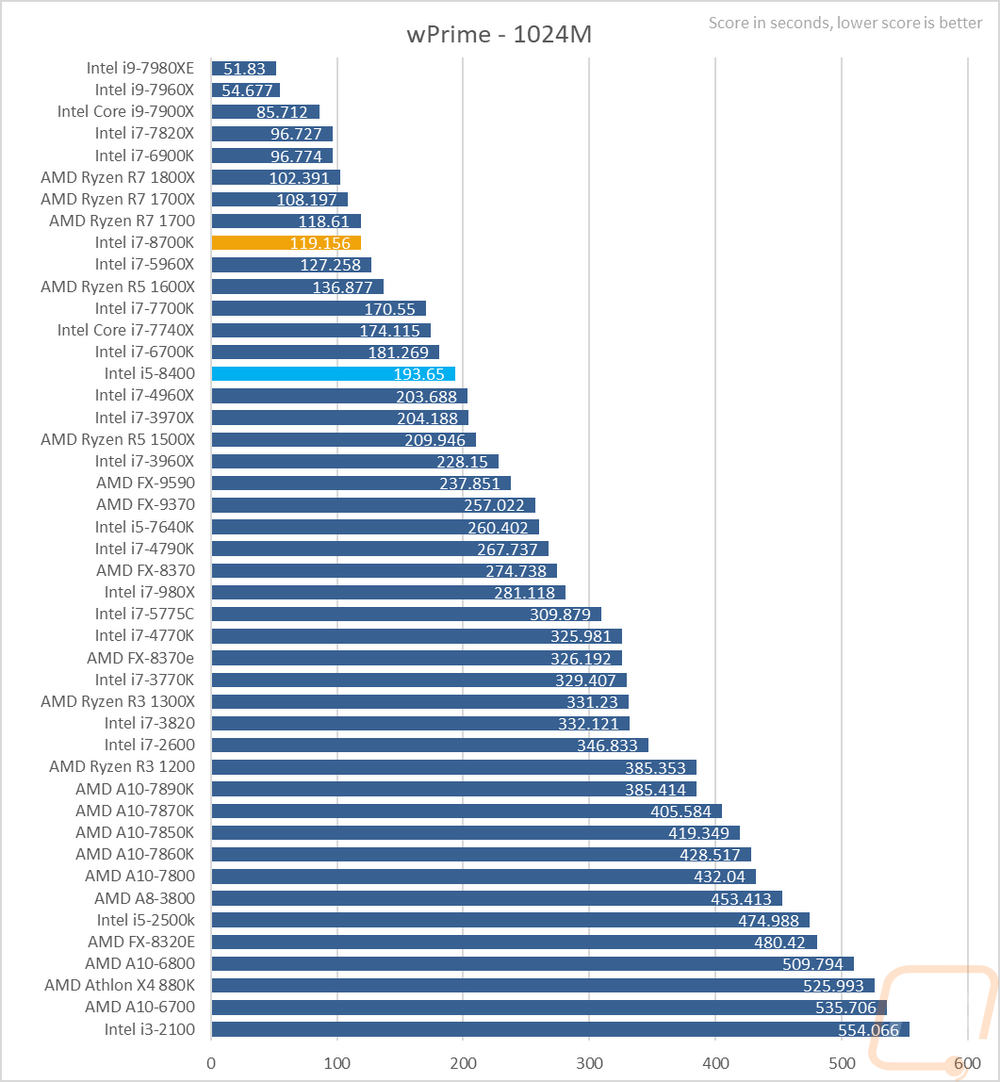
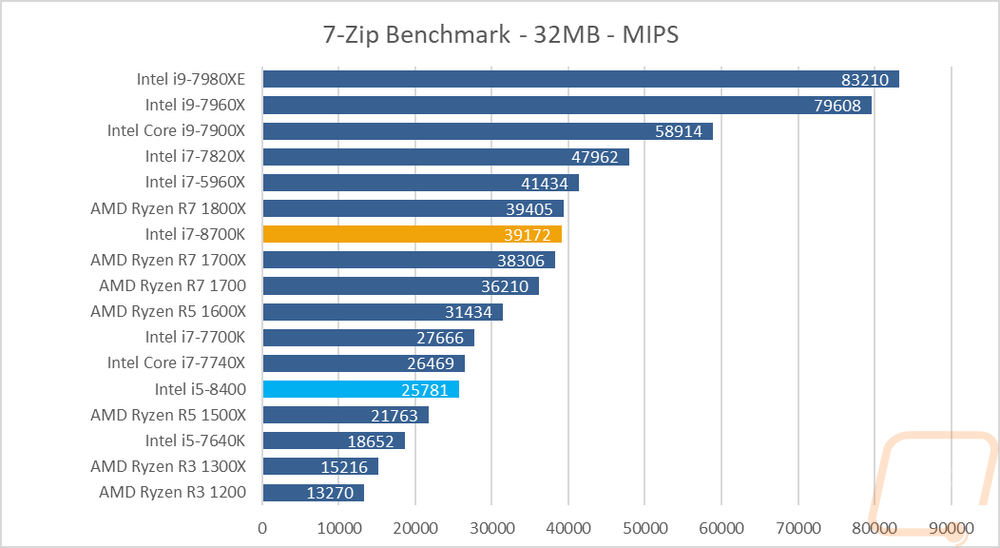
My next two tests are both math related. wPrime is a simple test that calculates prime out to a specific length, in this case, it is 1024 million spots. This is a multi-core test that overclockers love to use to compare performance as clock speeds do make a difference. The 8700K did well here but all of the Ryzen R7 CPUs with their additional two cores were slightly ahead and the new 16 and 18 core count CPUs from Intel are in their own class here. The 8400, on the other hand, came in faster than the R5 1500X but slower than the R5 1600X. In 7-Zip I’m just testing decoding performance, this is also a very multi-threaded application. The 8700K came in right with the 1800X though even with the core count disadvantage. One again on the 8400, it came in between the R5 1500X and the 1600X.
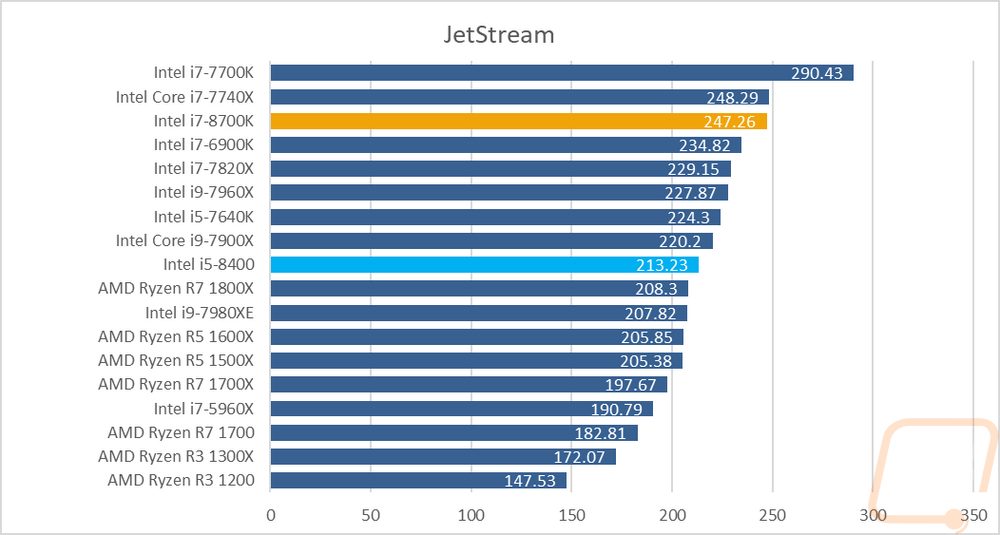
Next, I wanted to check out browser-based performance with a mix of HTML5 and Java tests using Jetstream that runs them all then averages out all of the tests after running each three times. So here the 7700K is still the top dog but the 8700K and the 7740X both came in near each other. The 8400, on the other hand, is down at the low end of the Intel CPUs but up above all of the Ryzen CPUs tested.
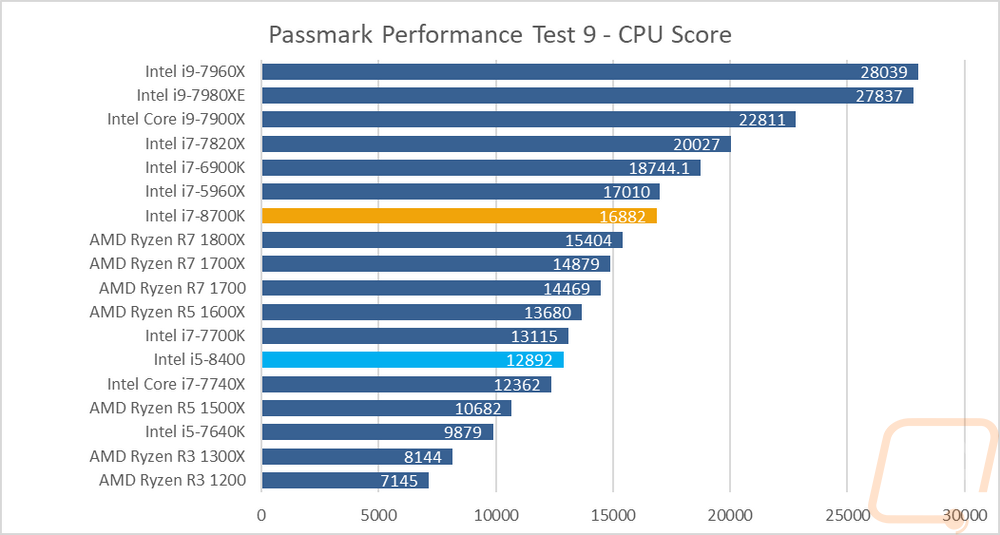
For a general CPU synthetic test, I used Passmark’s Performance Test 9 that runs a whole series of different synthetic CPU focused benchmarks and puts together an overall CPU score. These tests end up favoring the high core count CPUs a lot but the 8700K did still outperform the 8 core Ryzen CPUs and has a large gap between the 7700K and itself. The 8400, on the other hand, came in really close to the 7700K, above the 1500X and below the 1600X.
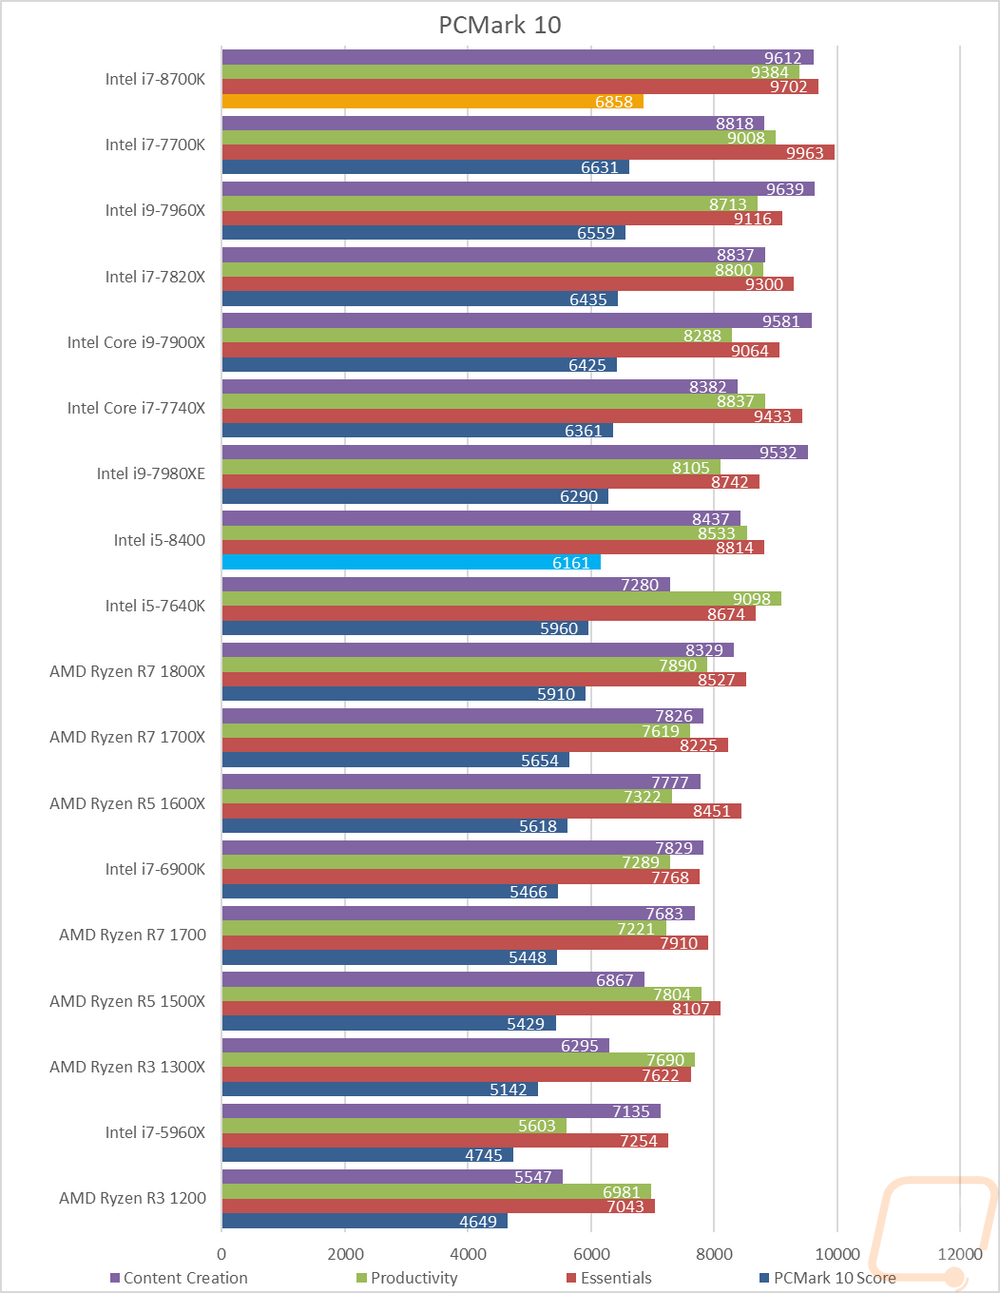
For a more real-world look at the performance, I love using PCMark 10 as it is repeatable and uses rear world programs for things like photo editing, office applications like excel and word, video playback, and any other situation you might use your PC for. We end up with a few scores for each of the areas of the tests as well as an overall score. The 8700K topped the charts here with the overall score. In the Essentials test the 7700K was still faster but it pulled ahead in content creation and productivity where the two additional cores really helped. The 8400 is back in the middle of the pack but competing with the 7980XE a $2,000 CPU. Not bad for an i5 I would say.
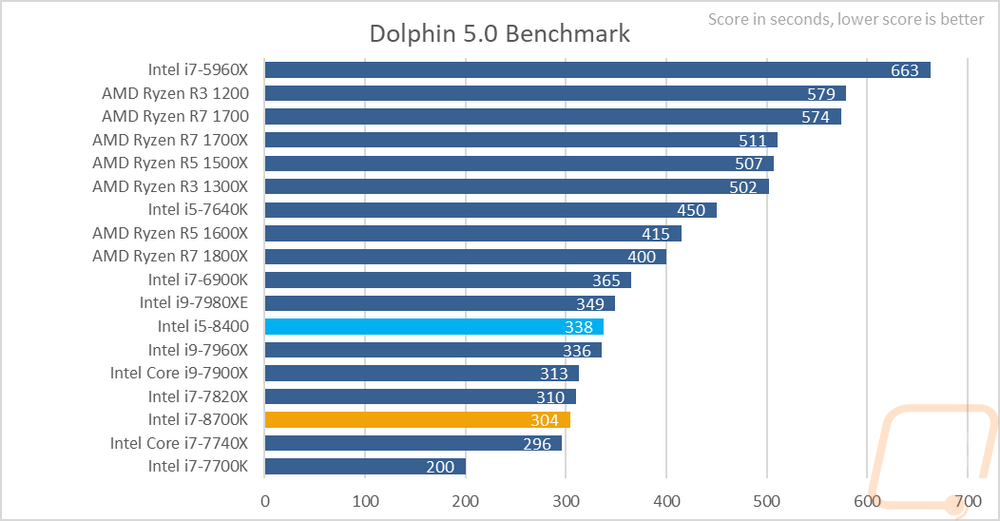
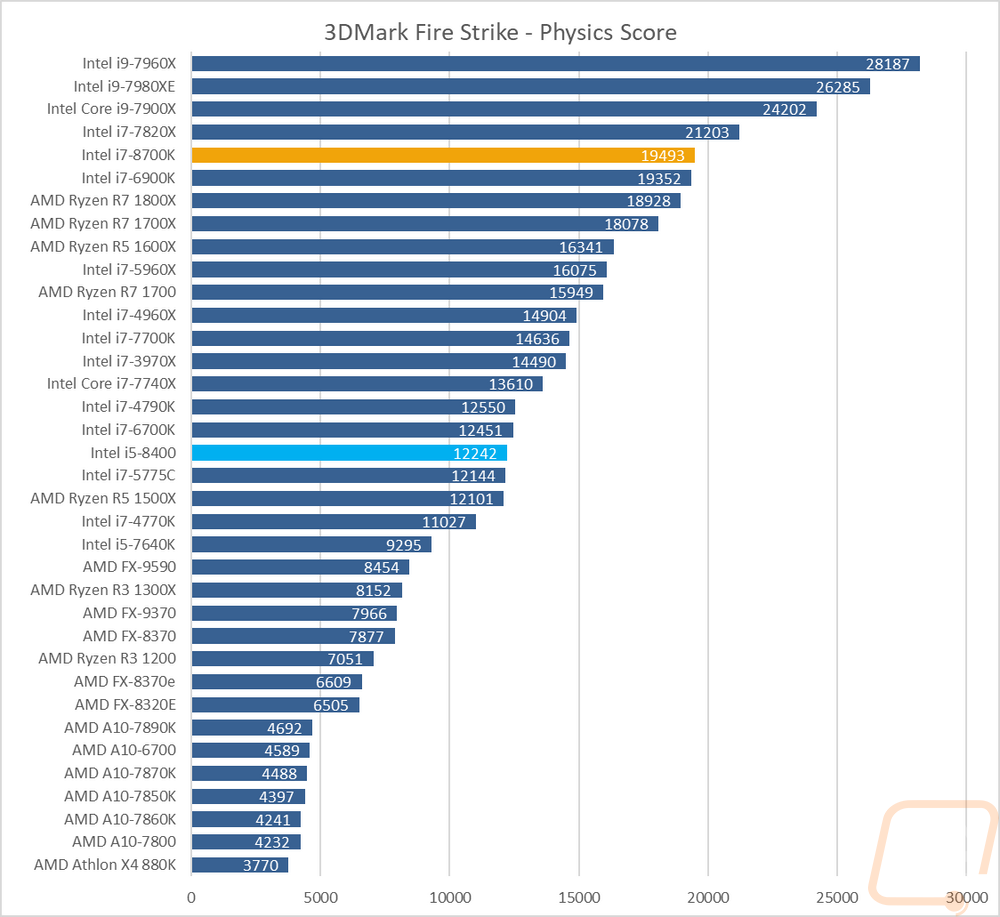
As I start to get into 3D performance I tested using the Dolphin 5.0 benchmark that tests CPU only emulation performance. I was honestly expecting a little better performance here with the two additional cores but Ryzen performs much better in this workload. Then for 3dmark I used the Fire Strike benchmark and took a look at the physics score because that is the main score that changes with CPU performance. The high core count Intel Core-X CPUs are still at the top of this chart but the 8700K isn’t far behind (well relatively at least lol) with it besting the Ryzen 7 CPUs as well as the 7700K. The 8400, on the other hand, was right in line with the 6700K, a still good performing CPU from a few years ago.
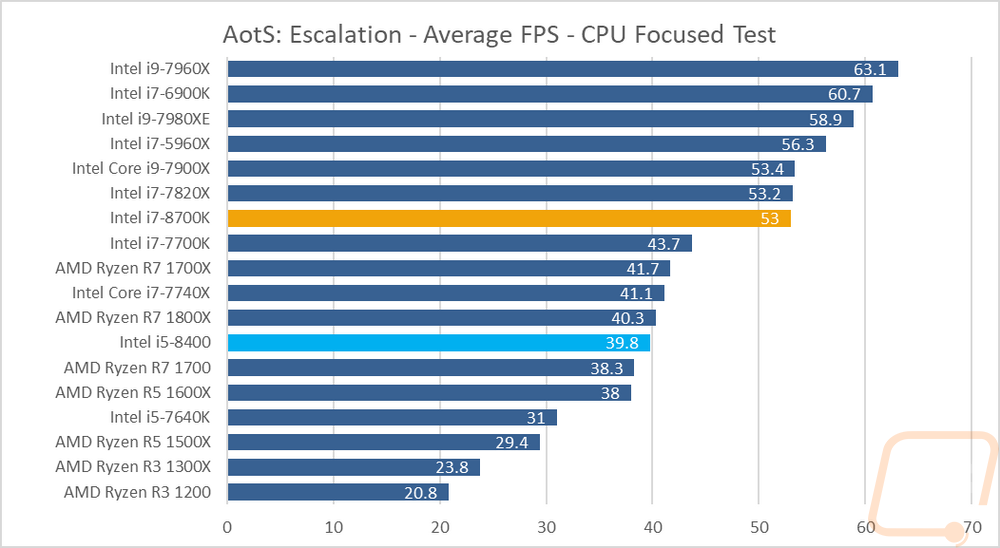
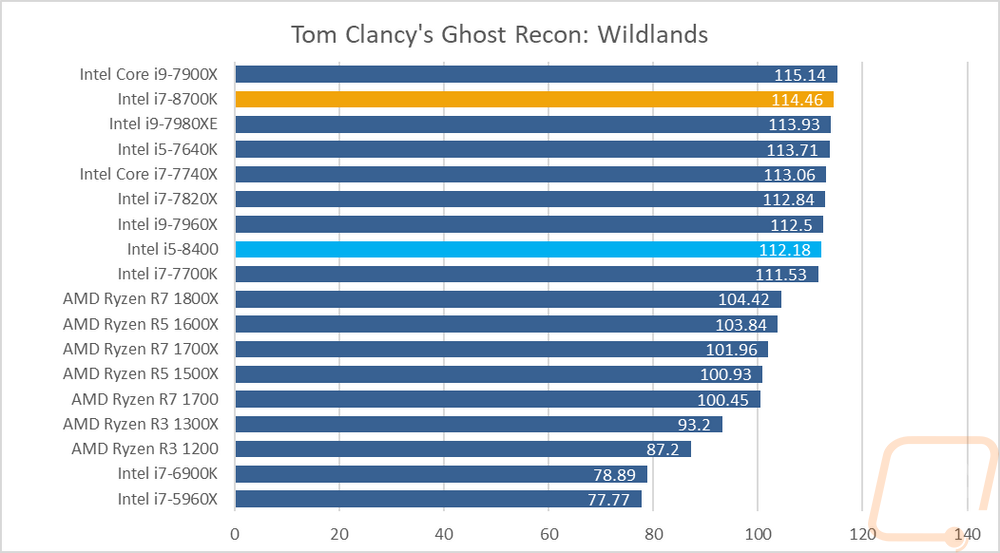
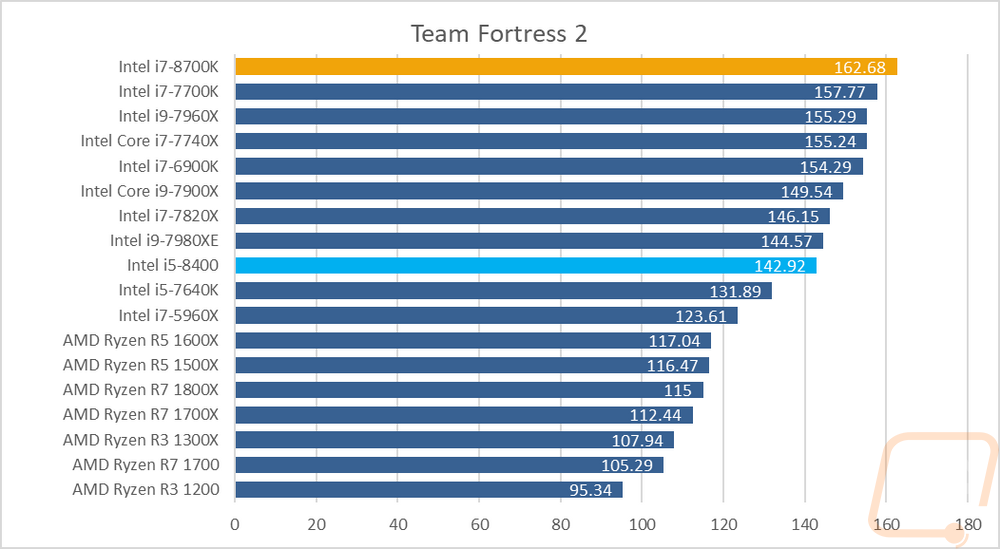
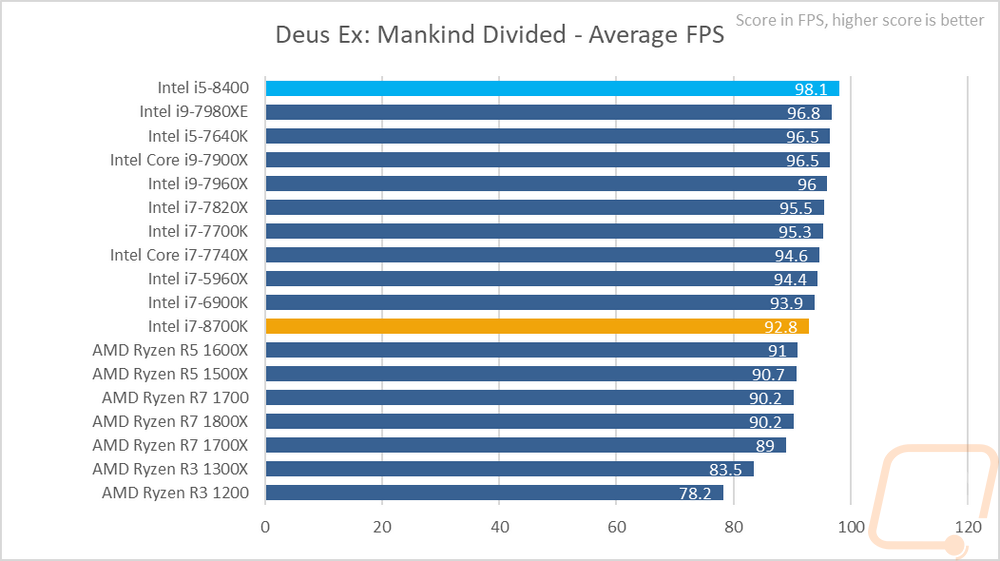
Then I finally got into actual in game performance. I only have a few actual game tests in our suite but I did try to get a good mix. We have new games as well as TF2 as an old game. Then with the new games, they touch on some GPU and some CPU leaning games to show how much of a gap you can see depending on if the game is CPU or GPU limited. In Ashes of the Singularity in the CPU benchmark, you see a big gap between the top CPUs all the way down to the lowest CPUs. Both Coffee Lake CPUs are in the mid-range here with the 8700K doing well but sitting behind all of the 8+ core count Intel CPUs. The 8400, on the other hand, is right in the mix with really good CPUs like the 1800X and 1700X and only a few FPS behind the 7700K. Wildlands shows a big drop in performance when going to any of the Ryzen based CPUs and the 8700K is up near the top here with its big of core count and high clock speeds. In TF2 the 8700K shows a big jump putting itself up over the 7700K that has dominated this chart up until now. Again the Ryzen CPUs are down at the bottom of this chart as well. Deus Ex Mankind Divided, on the other hand, doesn’t have a big FPS range between the top and bottom CPUs so the 8700K that is a the top isn’t far off from all but the lowest CPUs.
For my last batch of tests, I used a few of the benchmarks in AIDA64 to take a look at memory and cache performance as well as single and double precision FLOPs and a few different integer IOPS. Of course, the quality of results when compared with most of the Ryzen and current Intel offerings makes this one into a big wall of text, be warned. The two Coffee Lake CPUs tested come in right with the 7700K for memory performance, given the similar chipset that isn’t too big of a surprise. The bumped up memory speeds don’t apply here because we always test at 2666MHz anyhow. Now the bigger Cache does help though and the two additional cores help a lot in the rest of the tests as well.
|
CPU |
Memory Read |
Memory Write |
Memory Latency |
|
Intel i7-8700K |
38421 MB/s |
40175 MB/s |
57.9 ns |
|
Intel i5-8400 |
38096 MB/s |
40549 MB/s |
59.8 ns |
|
Intel Core i9-7980XE |
77004 MB/s |
68888 MB/s |
73.4 ns |
|
Intel Core i9-7960X |
79416 MB/s |
71554 MB/s |
74.9 ns |
|
Intel Core i7-7820X |
76049 MB/s |
73759 MB/s |
71.6 ns |
|
Intel Core i5-7640X |
30786 MB/s |
31888 MB/s |
68.5 ns |
|
Intel Core i9-7900X |
76856 MB/s |
72856 MB/s |
72.8 ns |
|
Intel Core i7-7740X |
38455 MB/s |
40596 MB/s |
53.2 ns |
|
Intel i7-6900K |
66786 MB/s |
68130 MB/s |
61.9 ns |
|
Intel i7-7700K |
38498 MB/s |
40448 MB/s |
52.7 ns |
|
Intel i7-5960X |
66108 MB/s |
49545 MB/s |
62.8 ns |
|
AMD Ryzen R7 1800X |
44031 MB/s |
43425 MB/s |
81.8 ns |
|
AMD Ryzen R7 1700X |
44493 MB/s |
43749 MB/s |
78.3 ns |
|
AMD Ryzen R7 1700 |
45343 MB/s |
43777 MB/s |
82.6 ns |
|
AMD Ryzen R5 1600X |
44452 MB/s |
43918 MB/s |
83.7 ns |
|
AMD Ryzen R5 1500X |
44289 MB/s |
43746 MB/s |
83.1 ns |
|
|
L1 Cache Read |
L1 Cache Write |
L1 Cache Latency |
|
Intel i7-8700K |
1595.6 GB/s |
803.65 GB/s |
0.9 ns |
|
Intel i5-8400 |
1417.2 GB/s |
710.79 GB/s |
1.0 ns |
|
Intel Core i9-7980XE |
3758.3 GB/s |
1896.7 GB/s |
1.1 ns |
|
Intel Core i9-7960X |
3532.3 GB/s |
1785.2 GB/s |
1.0 ns |
|
Intel Core i7-7820X |
1969.9 GB/s |
995.02 GB/s |
1.0 ns |
|
Intel Core i5-7640X |
1044.8 GB/s |
31888 GB/s |
1.0 ns |
|
Intel Core i9-7900X |
2418.5 GB/s |
709.16 GB/s |
1.0 ns |
|
Intel Core i7-7740X |
1102.7 GB/s |
561.25 GB/s |
0.9 ns |
|
Intel i7-6900K |
1963.9 GB/s |
999.59 GB/s |
1.0 ns |
|
Intel i7-7700K |
1114.6 GB/s |
560.82 GB/s |
0.9 ns |
|
Intel i7-5960X |
1748.5 GB/s |
874.60 GB/s |
1.2 ns |
|
AMD Ryzen R7 1800X |
917.46 GB/s |
460.16 GB/s |
1.1 ns |
|
AMD Ryzen R7 1700X |
867.89 GB/s |
435.33 GB/s |
1.2 ns |
|
AMD Ryzen R7 1700 |
793.90 GB/s |
398.12 GB/s |
1.3 ns |
|
AMD Ryzen R5 1600X |
689.47 GB/s |
345.95 GB/s |
1.1 ns |
|
AMD Ryzen R5 1500X |
446.84 GB/s |
224.01 GB/s |
1.1 ns |
|
|
L2 Cache Read |
L2 Cache Write |
L2 Cache Latency |
|
Intel i7-8700K |
640.37 GB/s |
397.14 GB/s |
2.6 ns |
|
Intel i5-8400 |
543.81 GB/s |
352.90 GB/s |
3.1 ns |
|
Intel Core i9-7980XE |
1671.7 GB/s |
1069.9 GB/s |
5.6 ns |
|
Intel Core i9-7960X |
1571.6 GB/s |
1003.5 GB/s |
5.1 ns |
|
Intel Core i7-7820X |
884.63 GB/s |
574.74 GB/s |
5.6 ns |
|
Intel Core i5-7640X |
397.26 GB/s |
247.00 GB/s |
2.9 ns |
|
Intel Core i9-7900X |
1037.3 GB/s |
521.94 GB/s |
5.2 ns |
|
Intel Core i7-7740X |
424.55 GB/s |
304.30 GB/s |
2.7 ns |
|
Intel i7-6900K |
710.28 GB/s |
310.34 GB/s |
4.1 ns |
|
Intel i7-7700K |
415.45 GB/s |
285.97 GB/s |
2.7 ns |
|
Intel i7-5960X |
623.08 GB/s |
272.77 GB/s |
3.5 ns |
|
AMD Ryzen R7 1800X |
831.95 GB/s |
446.37 GB/s |
4.7 ns |
|
AMD Ryzen R7 1700X |
809.29 GB/s |
419.38 GB/s |
5.0 ns |
|
AMD Ryzen R7 1700 |
742.92 GB/s |
389.73 GB/s |
5.4 ns |
|
AMD Ryzen R5 1600X |
630.99 GB/s |
334.93 GB/s |
4.7 ns |
|
AMD Ryzen R5 1500X |
306.82 GB/s |
211.58 GB/s |
11.8 ns |
|
|
L3 Cache Read |
L3 Cache Write |
L3 Cache Latency |
|
Intel i7-8700K |
337.00 GB/s |
213.67 GB/s |
11.0 ns |
|
Intel i5-8400 |
270.89 GB/s |
186.82 GB/s |
13.0 ns |
|
Intel Core i9-7980XE |
229.61 GB/s |
118.40 GB/s |
21.0 ns |
|
Intel Core i9-7960X |
220.22 GB/s |
121.04 GB/s |
19.8 ns |
|
Intel Core i7-7820X |
114.40 GB/s |
103.57 GB/s |
19.2 ns |
|
Intel Core i5-7640X |
228.31 GB/s |
163.86 GB/s |
11.1 ns |
|
Intel Core i9-7900X |
124.16 GB/s |
106.78 GB/s |
21.2 ns |
|
Intel Core i7-7740X |
287.01 GB/s |
186.67 GB/s |
21.2 ns |
|
Intel i7-6900K |
243.96 GB/s |
195.41 GB/s |
14.6 ns |
|
Intel i7-7700K |
234.50 GB/s |
188.70 GB/s |
10.4 ns |
|
Intel i7-5960X |
260.72 GB/s |
184.92 GB/s |
15.3 ns |
|
AMD Ryzen R7 1800X |
388.18 GB/s |
386.01 GB/s |
12.4 ns |
|
AMD Ryzen R7 1700X |
369.75 GB/s |
350.31 GB/s |
12.9 ns |
|
AMD Ryzen R7 1700 |
334.36 GB/s |
332.12 GB/s |
14.2 ns |
|
AMD Ryzen R5 1600X |
386.48 GB/s |
326.86 GB/s |
12.3 ns |
|
AMD Ryzen R5 1500X |
306.82 GB/s |
211.58 GB/s |
11.8 ns |
|
|
Single-Precision FLOPS |
Double Precision FLOPS |
AES-256 |
|
Intel i7-8700K |
825.0 GFLOPS |
412.5 GFLOPS |
29406 MB/s |
|
Intel i5-8400 |
728.8 GFLOPS |
364.5 GFLOPS |
25192 MB/s |
|
Intel Core i9-7980XE |
1831 GFLOPS |
915.5 GFLOPS |
69377 MB/s |
|
Intel Core i9-7960X |
1681 GFLOPS |
840.6 GFLOPS |
65409 MB/s |
|
Intel Core i7-7820X |
944.9 GFLOPS |
472.5 GFLOPS |
36420 MB/s |
|
Intel Core i5-7640X |
536.5 GFLOPS |
268.2 GFLOPS |
18547 MB/s |
|
Intel Core i9-7900X |
1148 GFLOPS |
574.5 GFLOPS |
45506 MB/s |
|
Intel Core i7-7740X |
575.4 GFLOPS |
287.8 GFLOPS |
20503 MB/s |
|
Intel i7-6900K |
1023 GFLOPS |
511.7 GFLOPS |
36340 MB/s |
|
Intel i7-7700K |
575.7 GFLOPS |
287.9 GFLOPS |
20519 MB/s |
|
Intel i7-5960X |
895.5 GFLOPS |
447.7 GFLOPS |
31783 MB/s |
|
AMD Ryzen R7 1800X |
472.4 GFLOPS |
236.2 GFLOPS |
64016 MB/s |
|
AMD Ryzen R7 1700X |
446.8 GFLOPS |
223.4 GFLOPS |
61730 MB/s |
|
AMD Ryzen R7 1700 |
408.5 GFLOPS |
204.3 GFLOPS |
56811 MB/s |
|
AMD Ryzen R5 1600X |
354.9 GFLOPS |
177.5 GFLOPS |
49340 MB/s |
|
AMD Ryzen R5 1500X |
229.8 GFLOPS |
114.8 GFLOPS |
31983 MB/s |
|
|
24-bit Integer IOPS |
32-bit Integer IOPS |
64-bit Integer IOPS |
|
Intel i7-8700K |
370.0 GIOPS |
370.0 GIOPS |
51.55 GIOPS |
|
Intel i5-8400 |
323.5 GIOPS |
323.5 GIOPS |
45.55 GIOPS |
|
Intel Core i9-7980XE |
821.2 GIOPS |
821.3 GIOPS |
121.6 GIOPS |
|
Intel Core i9-7960X |
754.0 GIOPS |
753.9 GIOPS |
114.7 GIOPS |
|
Intel Core i7-7820X |
423.7 GIOPS |
423.7 GIOPS |
63.85 GIOPS |
|
Intel Core i5-7640X |
238.1 GIOPS |
138.1 GIOPS |
33.53 GIOPS |
|
Intel Core i9-7900X |
515.1 GIOPS |
515.0 GIOPS |
79.76 GIOPS |
|
Intel Core i7-7740X |
258.1 GIOPS |
258.0 GIOPS |
35.97 GIOPS |
|
Intel i7-6900K |
255.9 GIOPS |
255.9 GIOPS |
63.96 GIOPS |
|
Intel i7-7700K |
258.0 GIOPS |
258.0 GIOPS |
35.98 GIOPS |
|
Intel i7-5960X |
223.9 GIOPS |
223.9 GIOPS |
55.97 GIOPS |
|
AMD Ryzen R7 1800X |
118.1 GIOPS |
118.1 GIOPS |
59.03 GIOPS |
|
AMD Ryzen R7 1700X |
111.7 GIOPS |
111.7 GIOPS |
55.84 GIOPS |
|
AMD Ryzen R7 1700 |
102.1 GIOPS |
102.1 GIOPS |
51.05 GIOPS |
|
AMD Ryzen R5 1600X |
88.74 GIOPS |
88.73 GIOPS |
44.34 GIOPS |
|
AMD Ryzen R5 1500X |
57.43 GIOPS |
57.45 GIOPS |
28.72 GIOPS |
