Cooling Noise and Power
For my last few tests, rather than focusing on in game performance, I like to check out other aspects of video card performance. These are also the most important ways to differentiate the performance between cards that have the same GPU. To start things off I took a look at power usage.
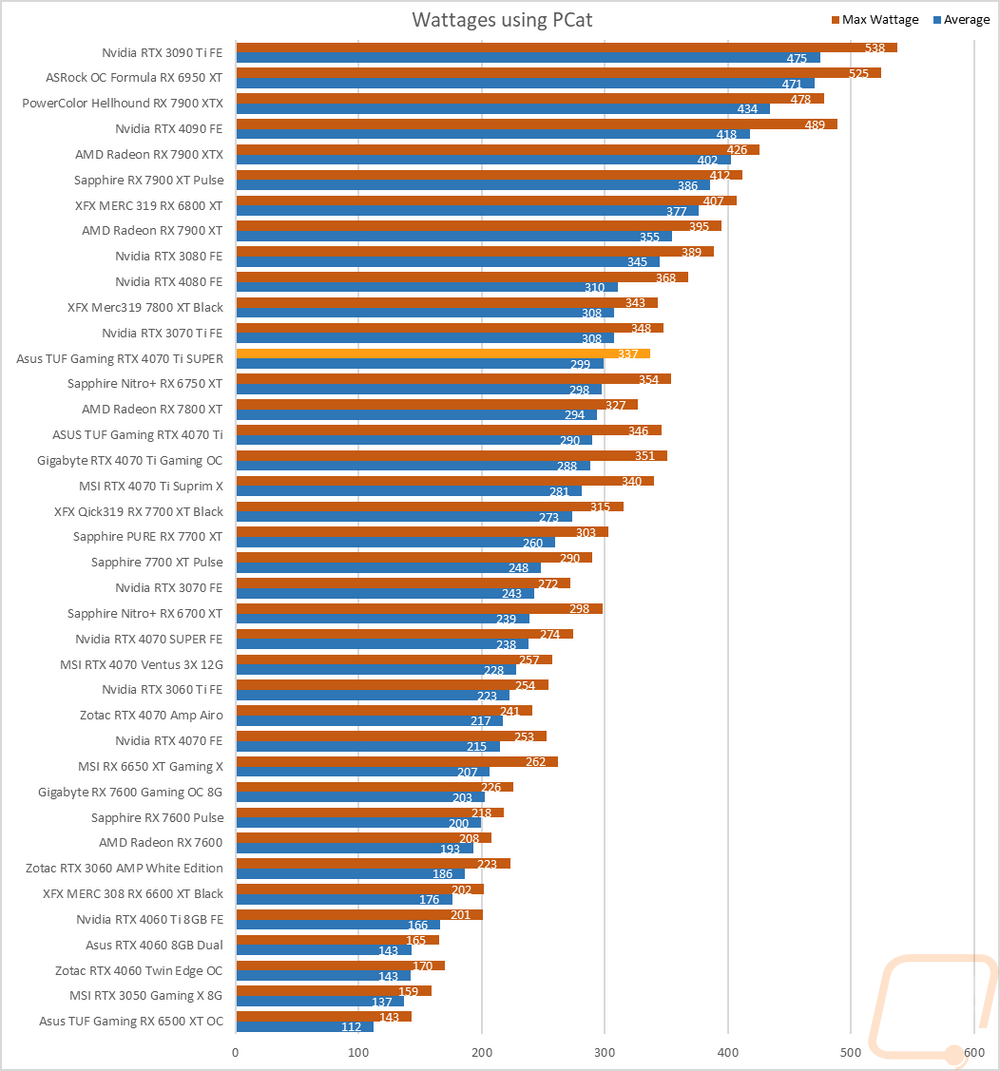
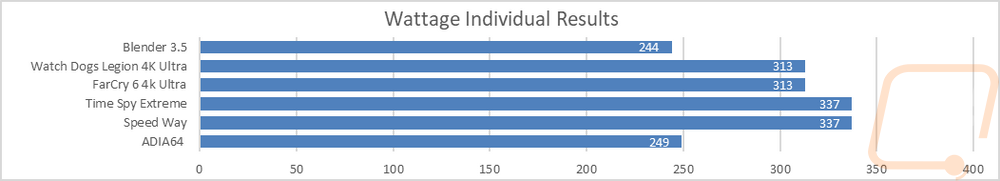
For this, our new test setup utilizes the Nvidia-designed PCat v2 along with cables to handle both traditional 6 or 8-pin connections as well as the new 12VHPWR. The PCat also utilizes a PCIe adapter to measure any power going to the card through the PCIe slot so we can measure the video card wattage exclusively, not the entire system as we have done in the past. I test with a mix of applications to get both in game, synthetic benchmarks, and other workloads like Blender and AIDA64. Then everything is averaged together for our result. I also have the individual results for this specific card and I document the peak wattage result as well which is almost always Time Spy Extreme. The TUF Gaming RTX 4070 Ti SUPER averaged 299 watts and peaked at 337 watts. This was still better than the RTX 3070 Ti by 9 watts on the average and 11 watts on the peak. While officially the TGP didn’t change from Nvidia between the RTX 4070 Ti and the RTX 4070 Ti SUPER, the TUF card did average 9 watts more than the original TUF 4070 Ti but did better on the peak. Bringing in the RX 7900 XT for comparison because they are so close in overall performance, Nvidia is still well ahead in power efficiency with the stock-clocked 7900 XT averaging 56 watts more and peak being 52 watts higher.
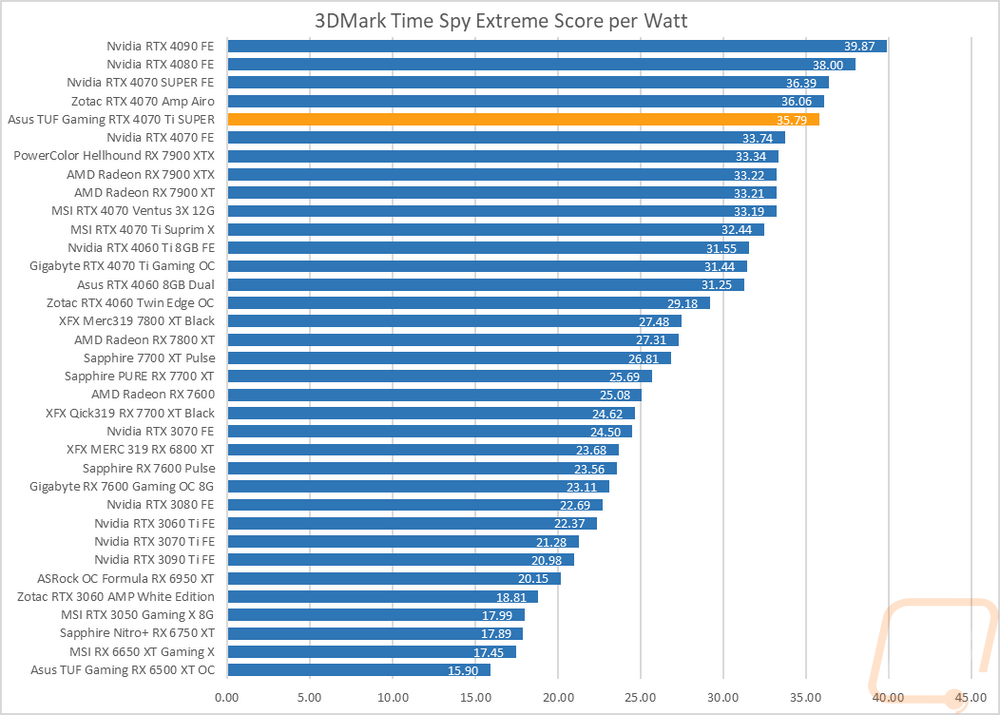
With having exact peak wattage numbers when running Time Spy Extreme I was also able to put together a graph showing the total score for each watt that a card draws which gives us an interesting look at overall power efficiency in the popular and demanding benchmark. The TUF Gaming RTX 4070 Ti SUPER scored 35.79 points per watt which is better than the original 4070 Ti but still just shy of the impressive efficiency that I saw last week on the RTX 4070 SUPER Founders Edition or the 4080 and 4090 which top the chart. This is 2.58 points per watt better than the 7900 XT however.
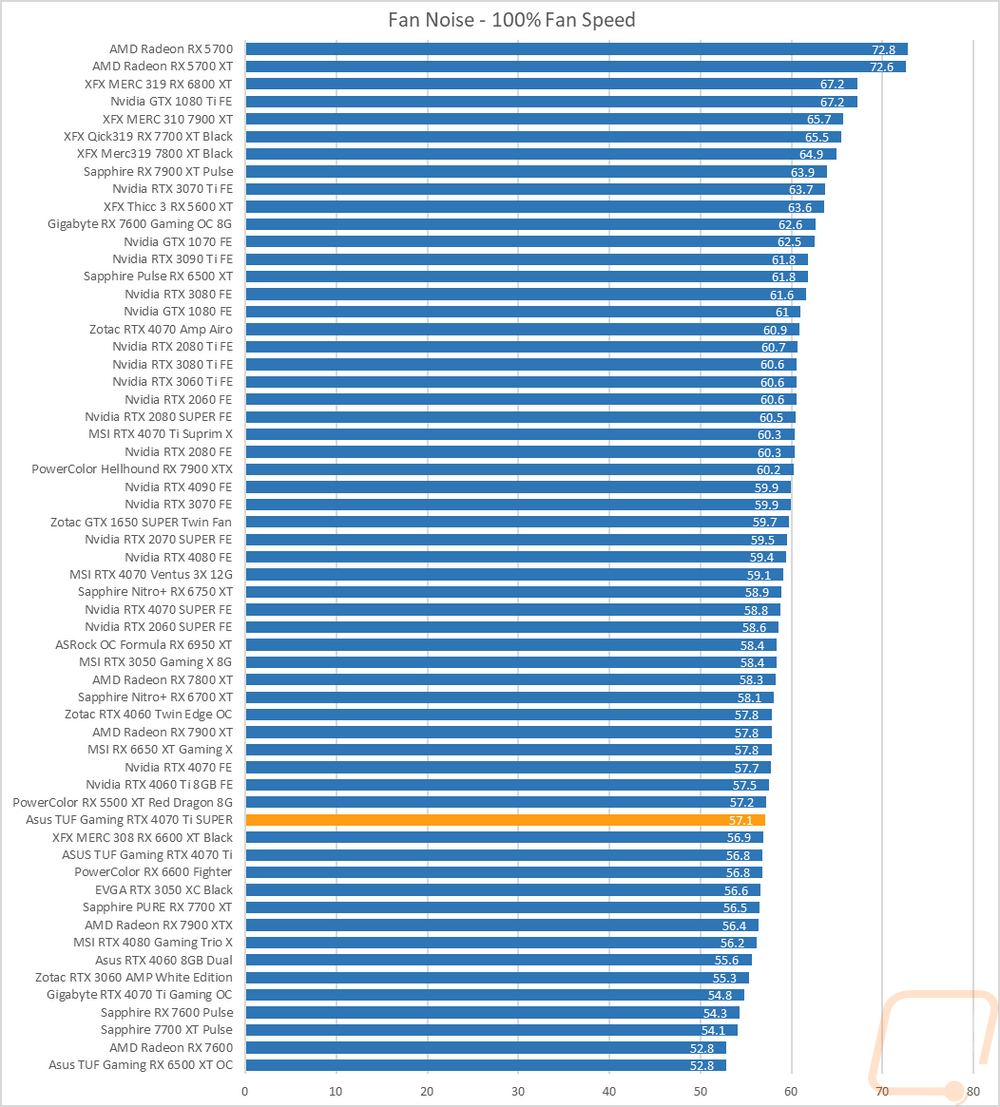
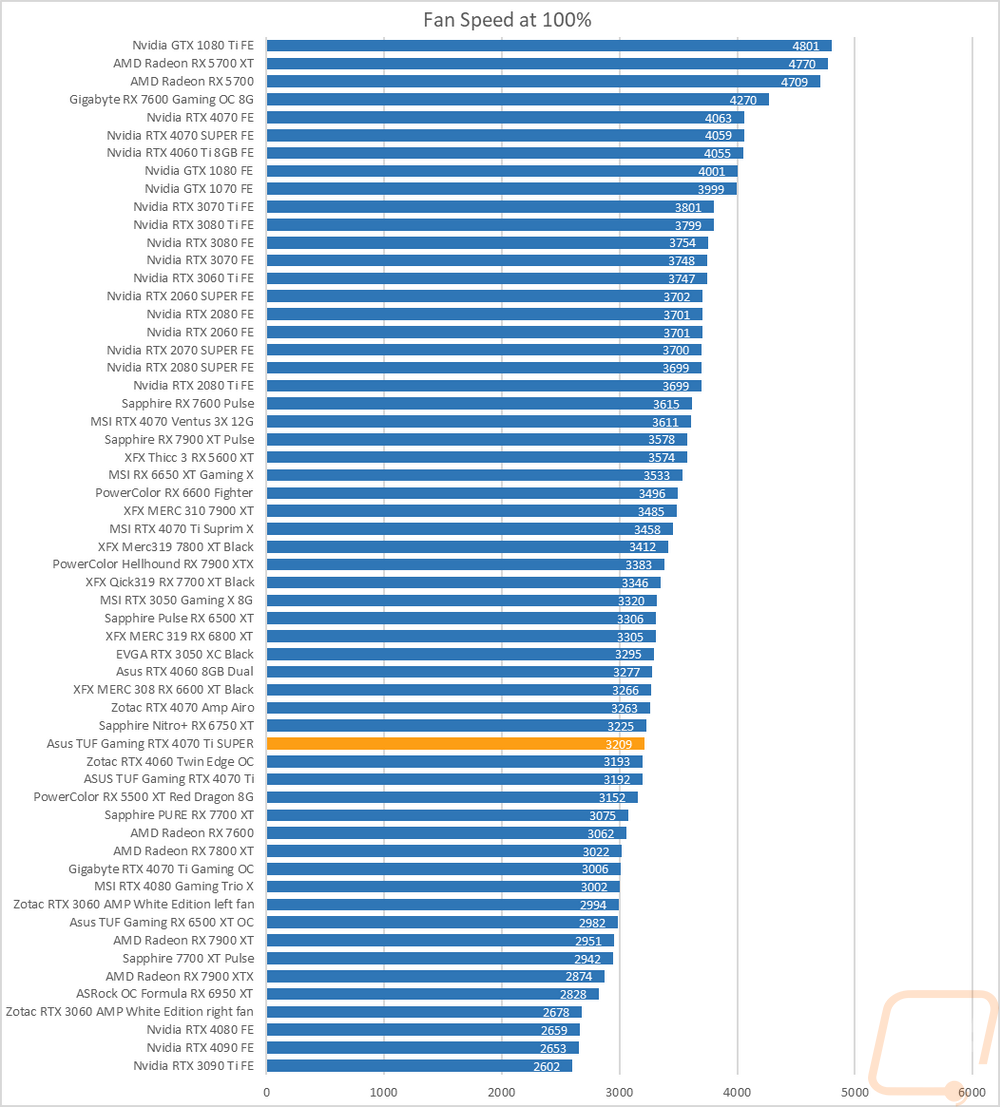
My next round of tests were looking at noise levels. These are especially important to me because I can’t stand to listen to my PC whirling. Especially when I’m not in game and other applications are using the GPU. For my testing, though I first tested with the fan cranked up to 100% to get an idea of how loud it can get, then again at 50% to get an idea of its range. The TUF Gaming RTX 4070 Ti SUPER is down in the bottom of our 50% fan speed chart and even at 100% fan speed was in the bottom 1/3 in that chart as well which is impressive, especially for a 3-fan card. The 100% performance was right in line with where the card falls on the RPM charts and was also right with the original TUF Gaming RTX 4070 Ti that I took a look at last year which has the same cooler.
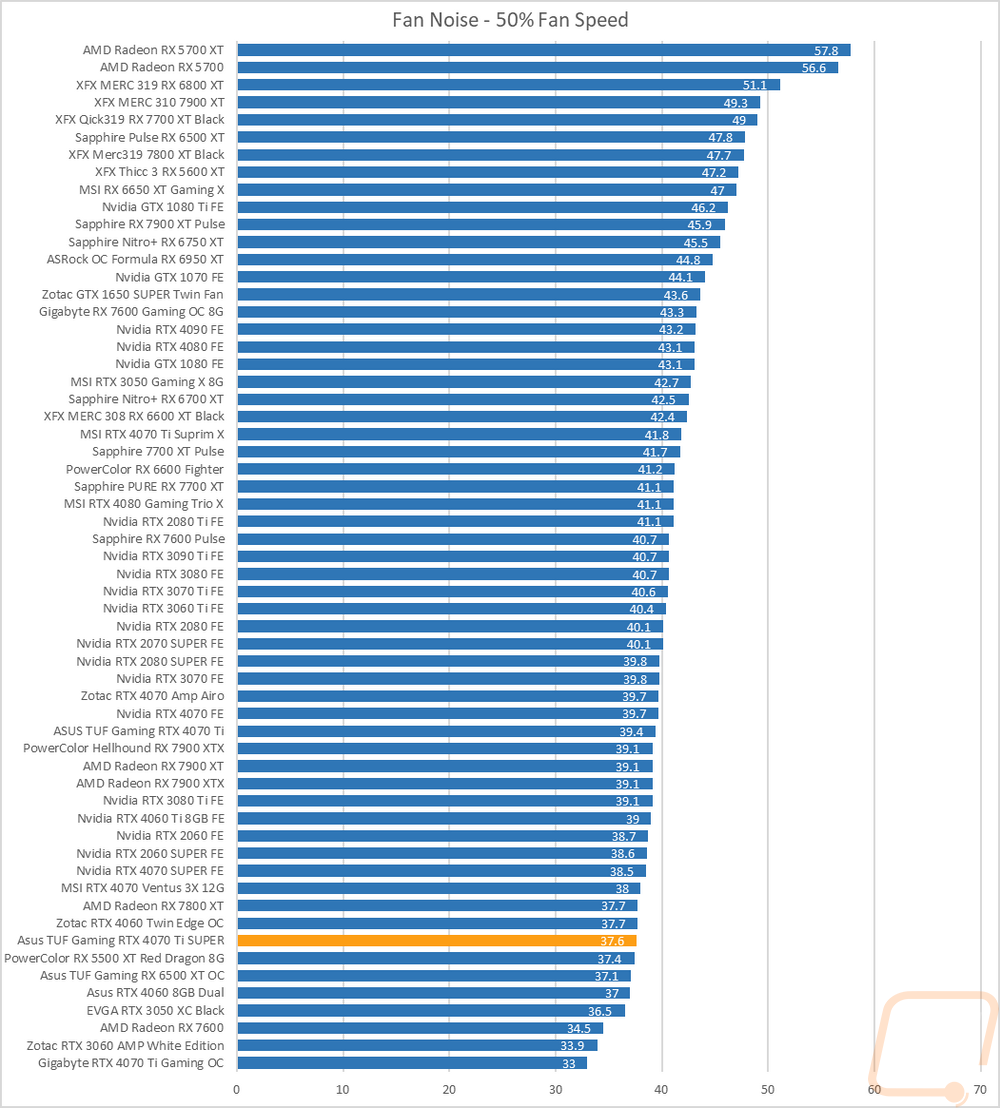
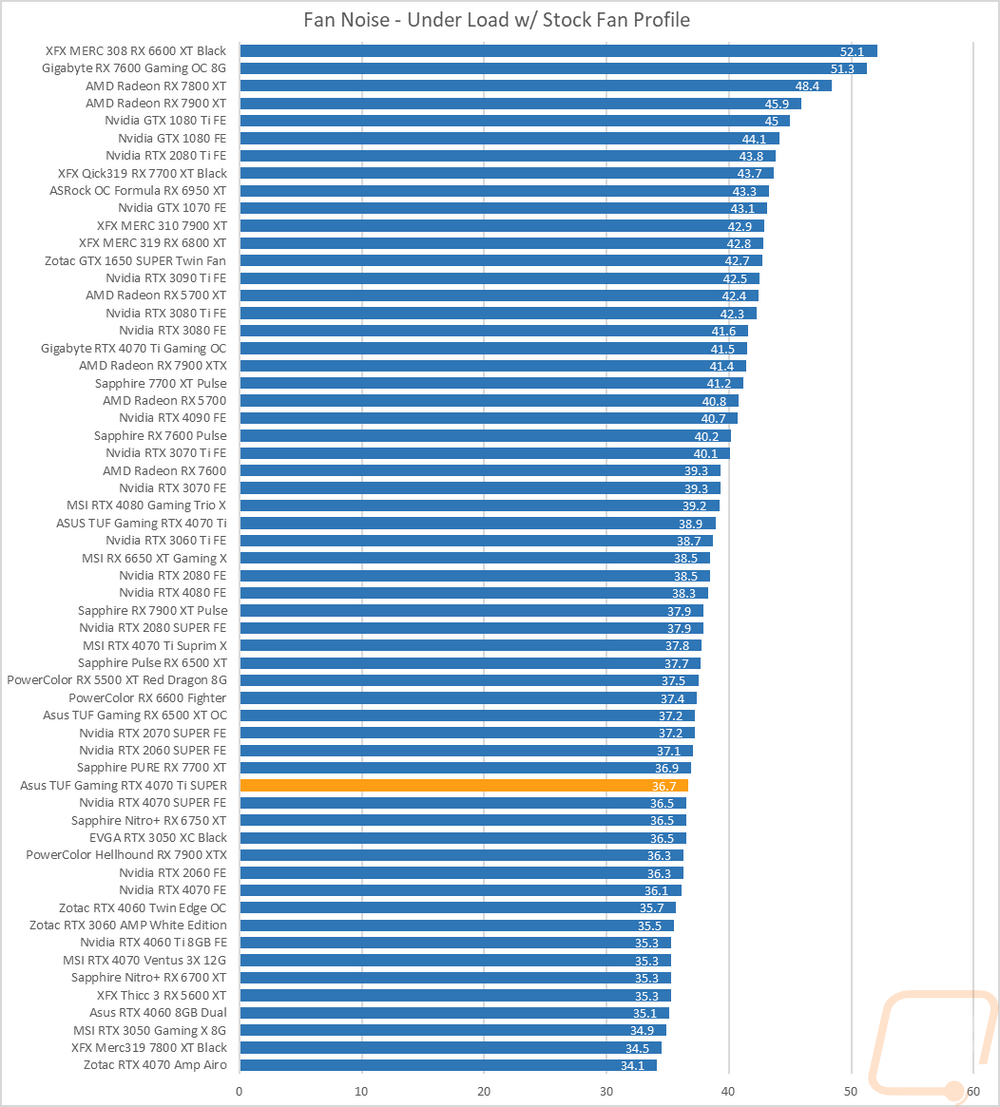
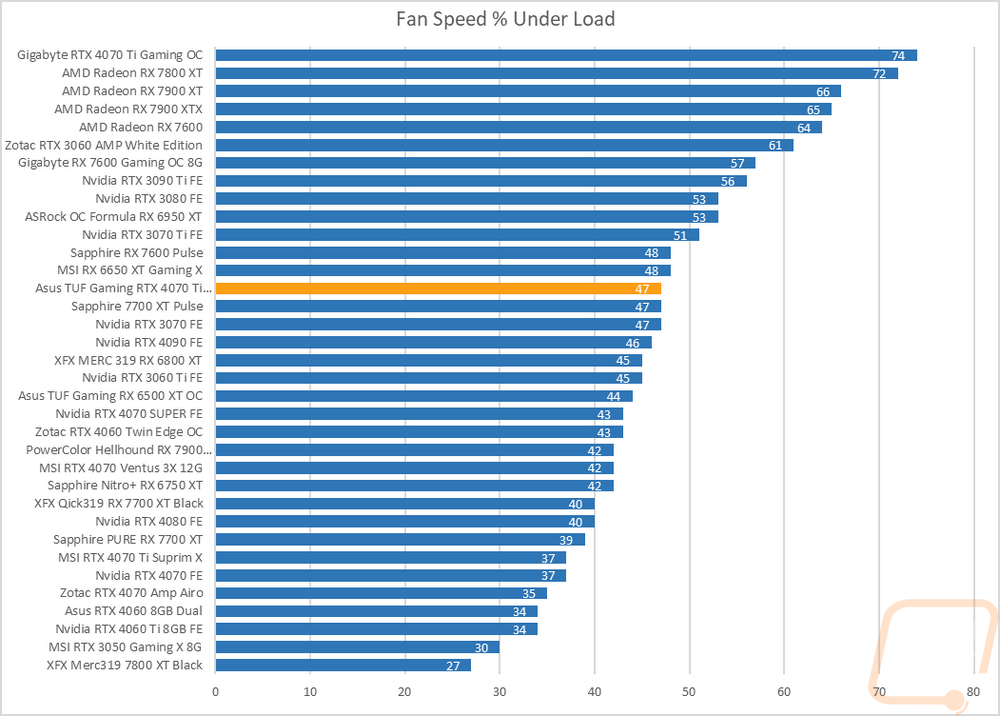
I also take a look at noise performance while under load. For that when running AIDA64’s stress test I wait until the temperature of the card has leveled off and then measure how loud things are when the card is at its worst-case scenario with the stock fan profile. Once again the TUF Gaming RTX 4070 Ti SUPER did well here sitting in the bottom 1/3 of the chart with its 36.7 dB result. When under load it was running at 47% of the total fan speed which makes sense, putting it just behind the 37.6 dB result we saw at 50% fan speed.
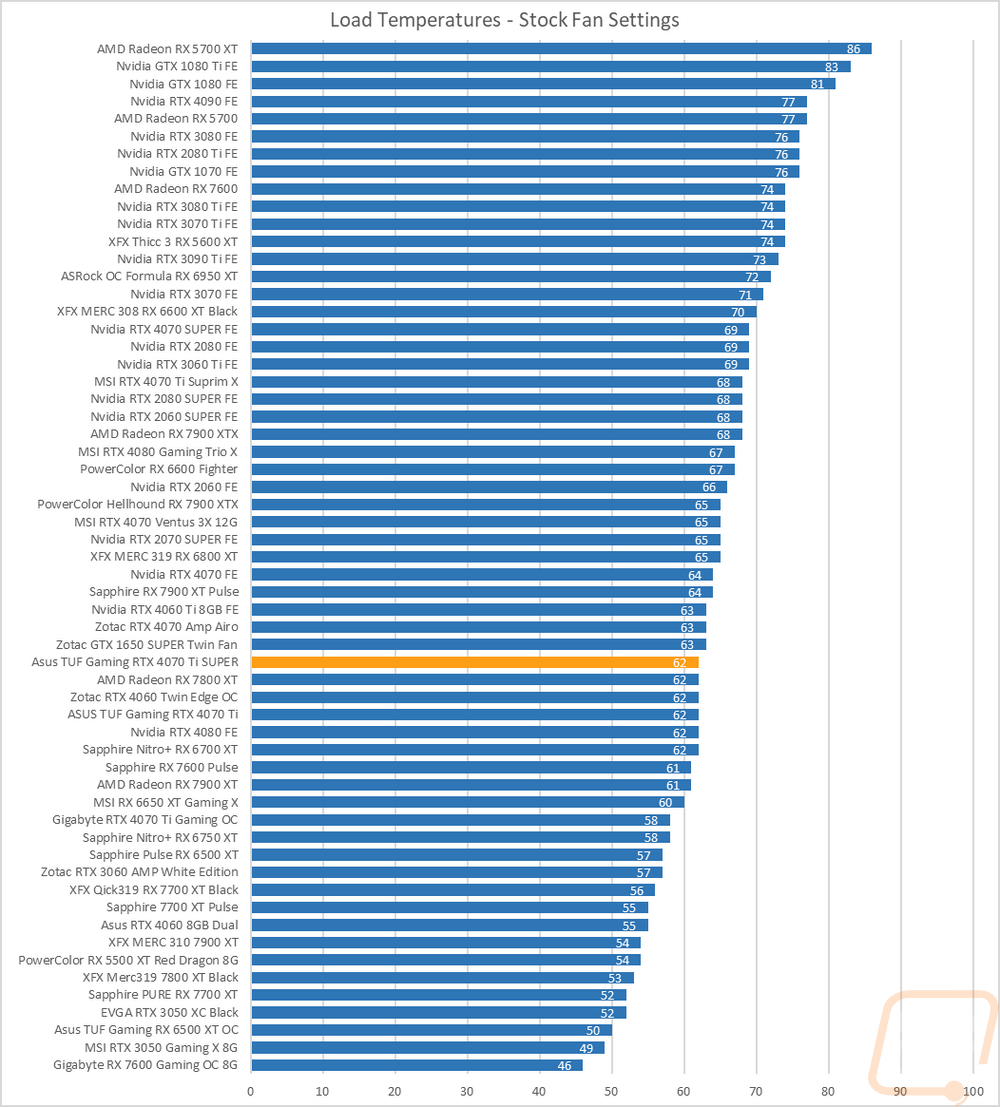
To finish up my testing I of course had to check out the cooling performance. To do this I ran two different tests. I used AIDA64’s Stress Test run for a half-hour each to warm things up. Then I documented what temperature the GPU leveled out at with the stock fan profile and then again with the fans cranked up to 100%. With the stock profile, the TUF Gaming RTX 4070 Ti SUPER leveled off at 62c when under load. This was exactly the same as the original TUF 4070 Ti. The GPU hotspot was 78c and the memory temperature was 60c.
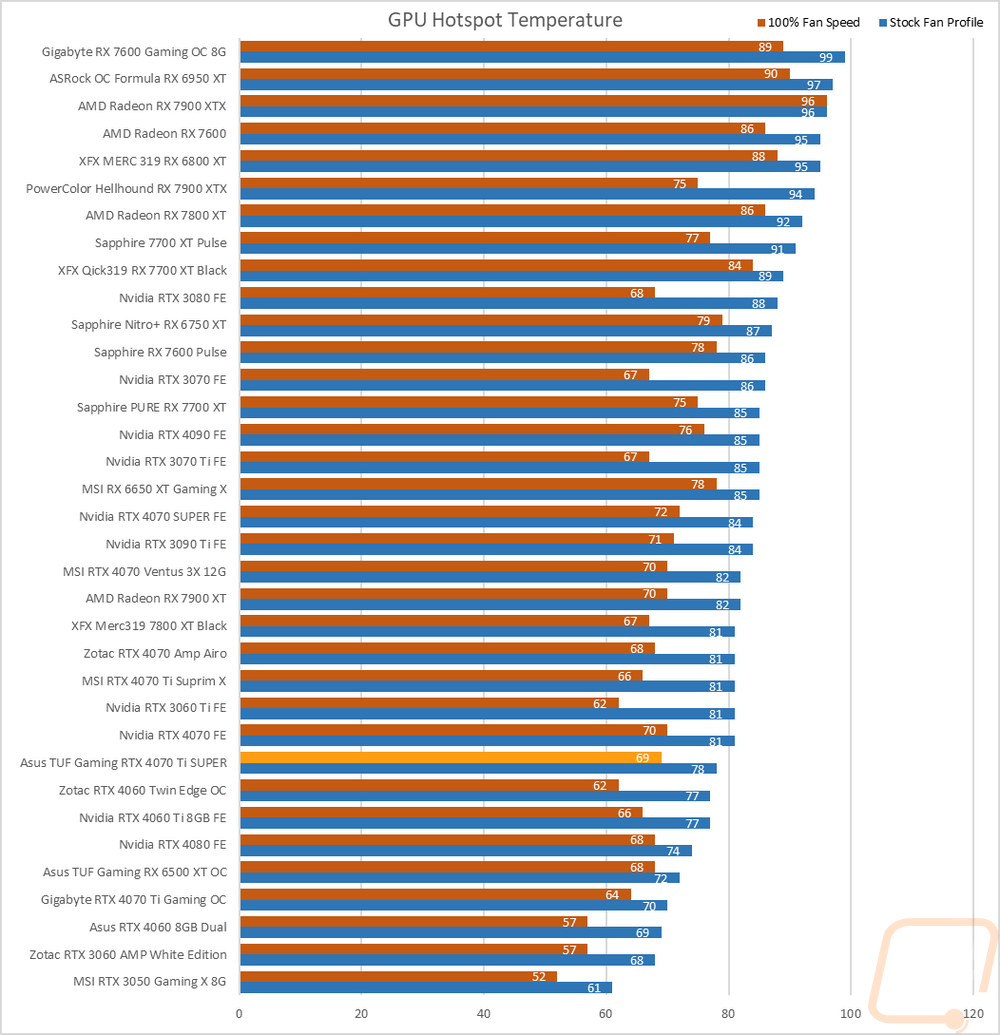
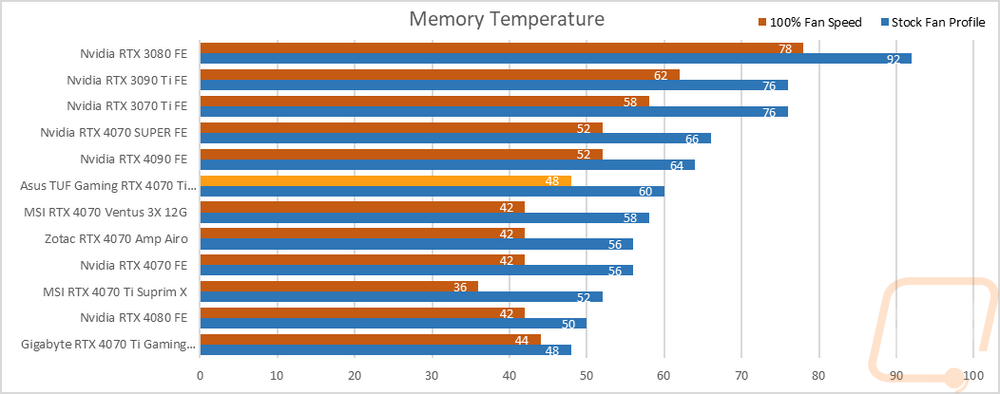
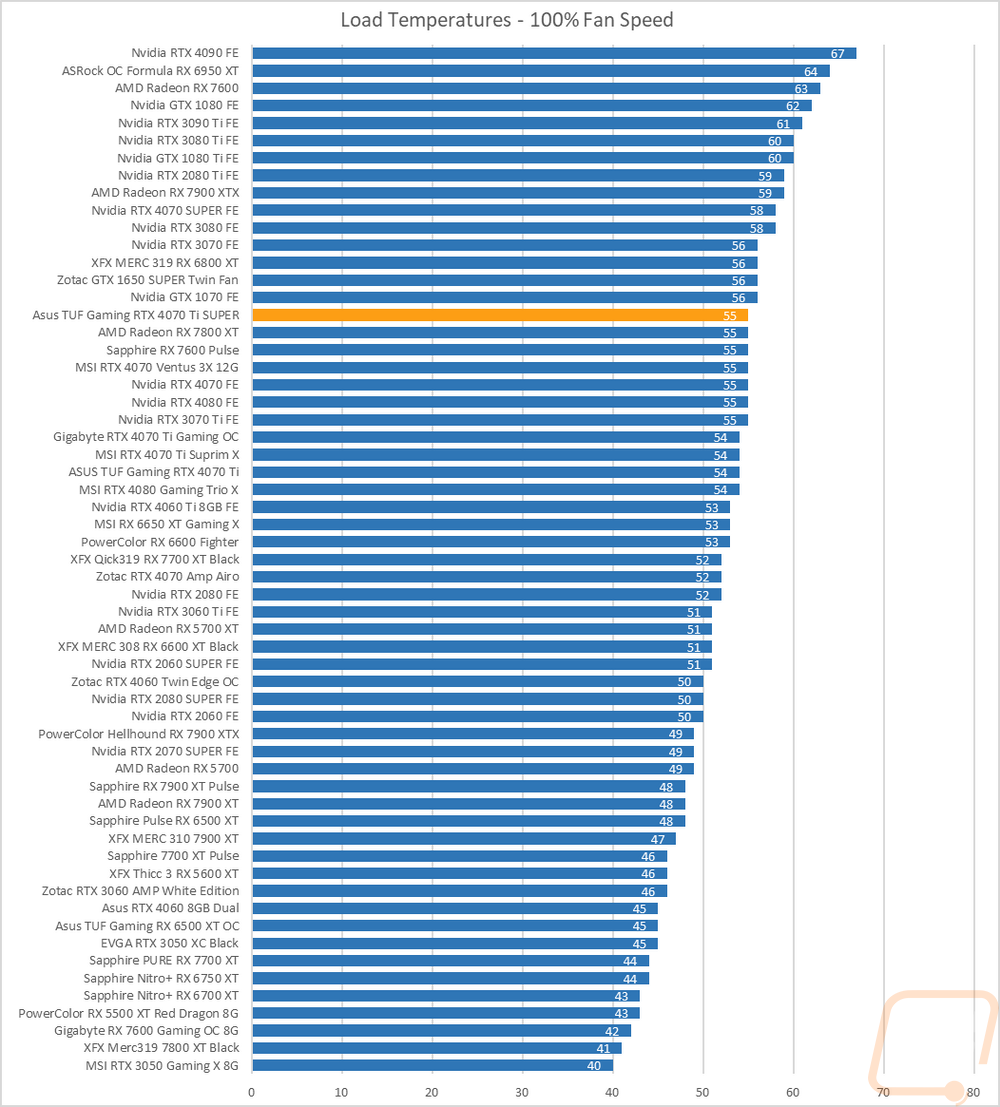
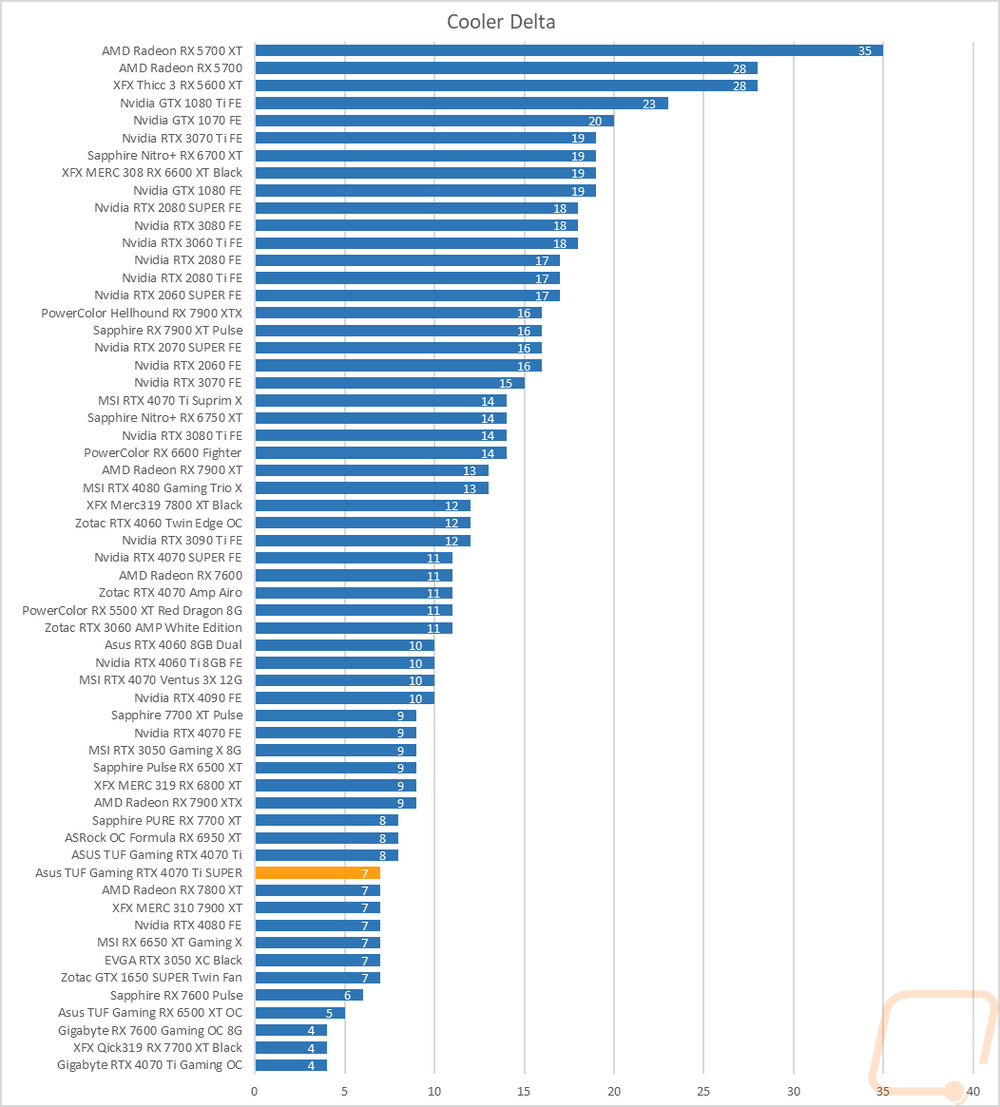
Then with the fans cranked up, the TUF Gaming RTX 4070 Ti SUPER ran at 55c which is a little on the higher side compared to the other cards on our chart. This was 1 degree warmer than the non-SUPER 4070 Ti so there wasn’t too much of a change there. Overall the delta between the stock fan profile and 100% tests was 7 degrees which doesn’t leave a tone of headroom but isn’t concerning at all. At 100% fan speed the GPU hotspot cooled down from 78c to 69c. The memory was affected more dropping from 60c down to 48c.
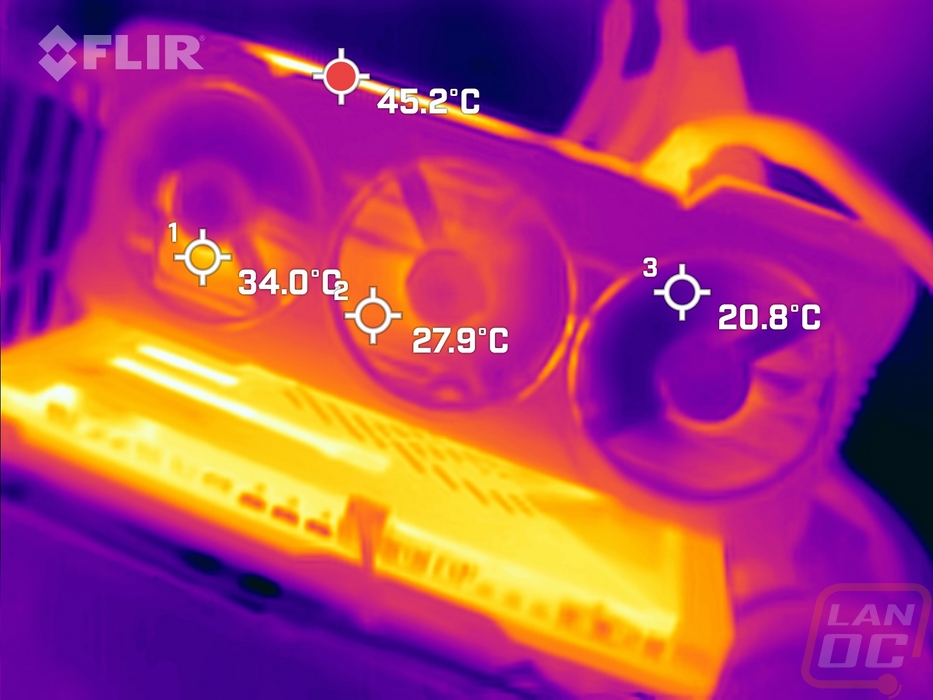
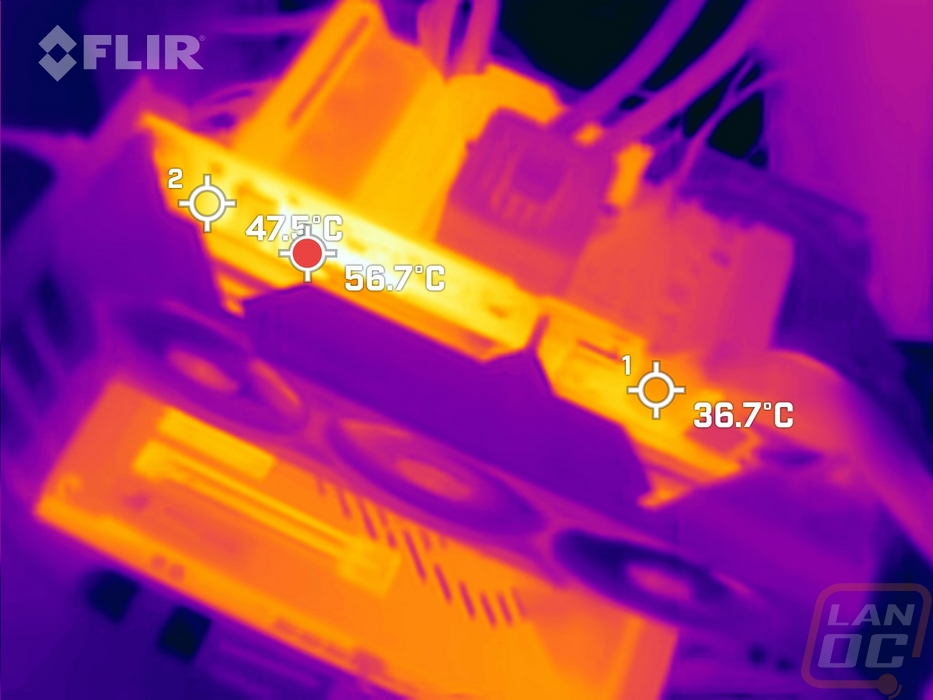
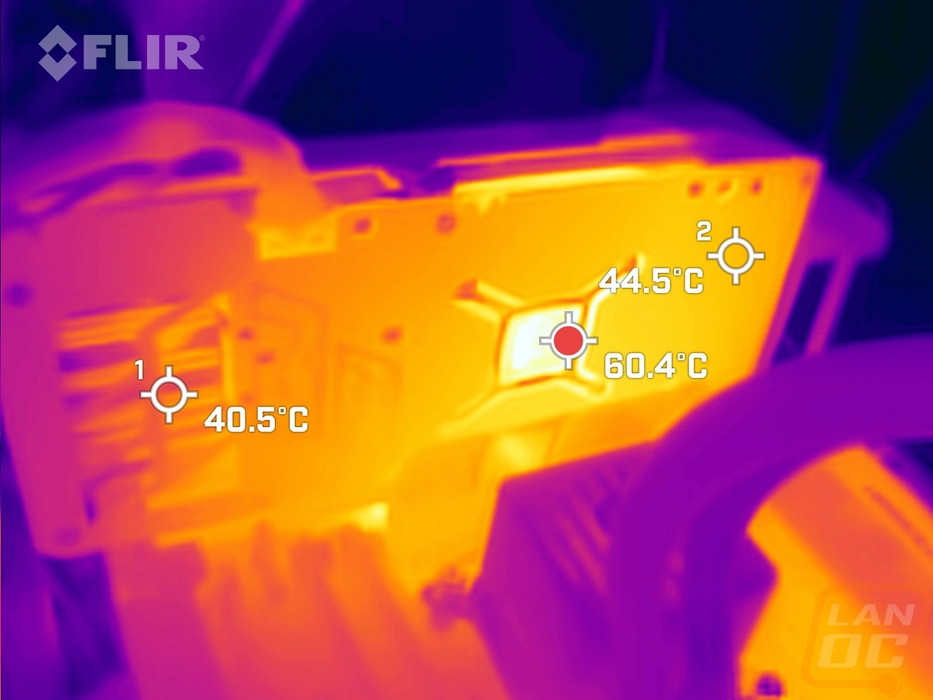
While running the stock fan profile testing I also took the time to get a few thermal images so we could see what is going on. The fan side of the TUF Gaming RTX 4070 Ti SUPER is running nice and cool, this includes the diecast metal fan shroud which I would have thought might start to hold some heat but the triple fan design is keeping things nice and cool there with the hottest spots being behind the far left fan at 34c and the coolest at 20.8c on the far right blow-through fan which is basically room temperature. The top of the card does have some warmer areas with the hotspot at 56.7c. This has the exposed PCB and is also where the heatsink is venting most of its air. Then on the back, the hottest spot on the whole card is the back of the PCB in the one exposed area directly behind the GPU at 60.4c. The left side of the back is a lot cooler with the blow-through area cooling things but even on the right, it was only 44.5c.