In-Game Benchmarks
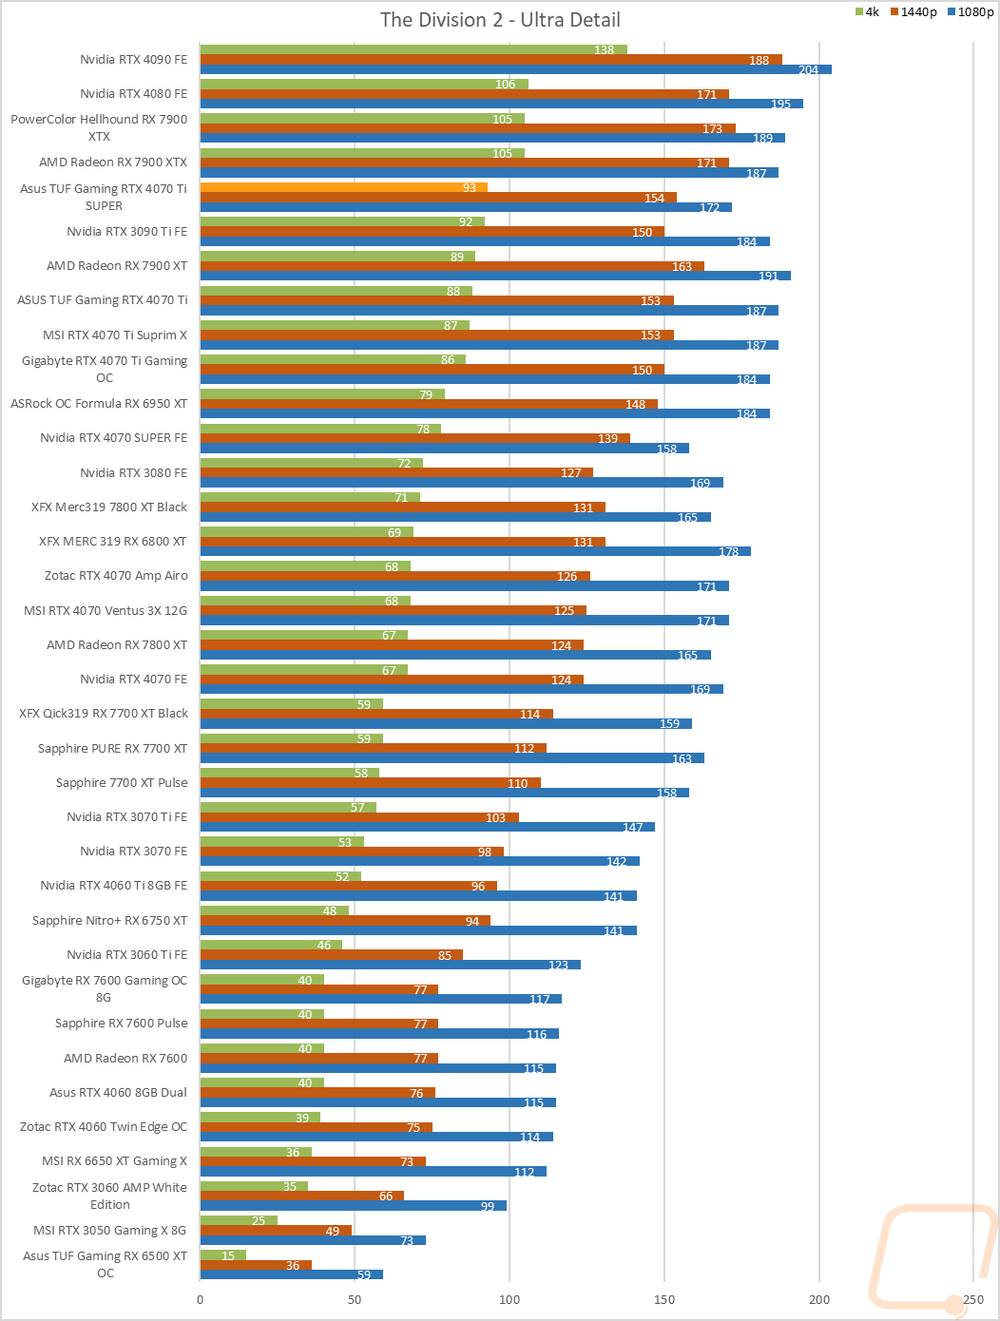
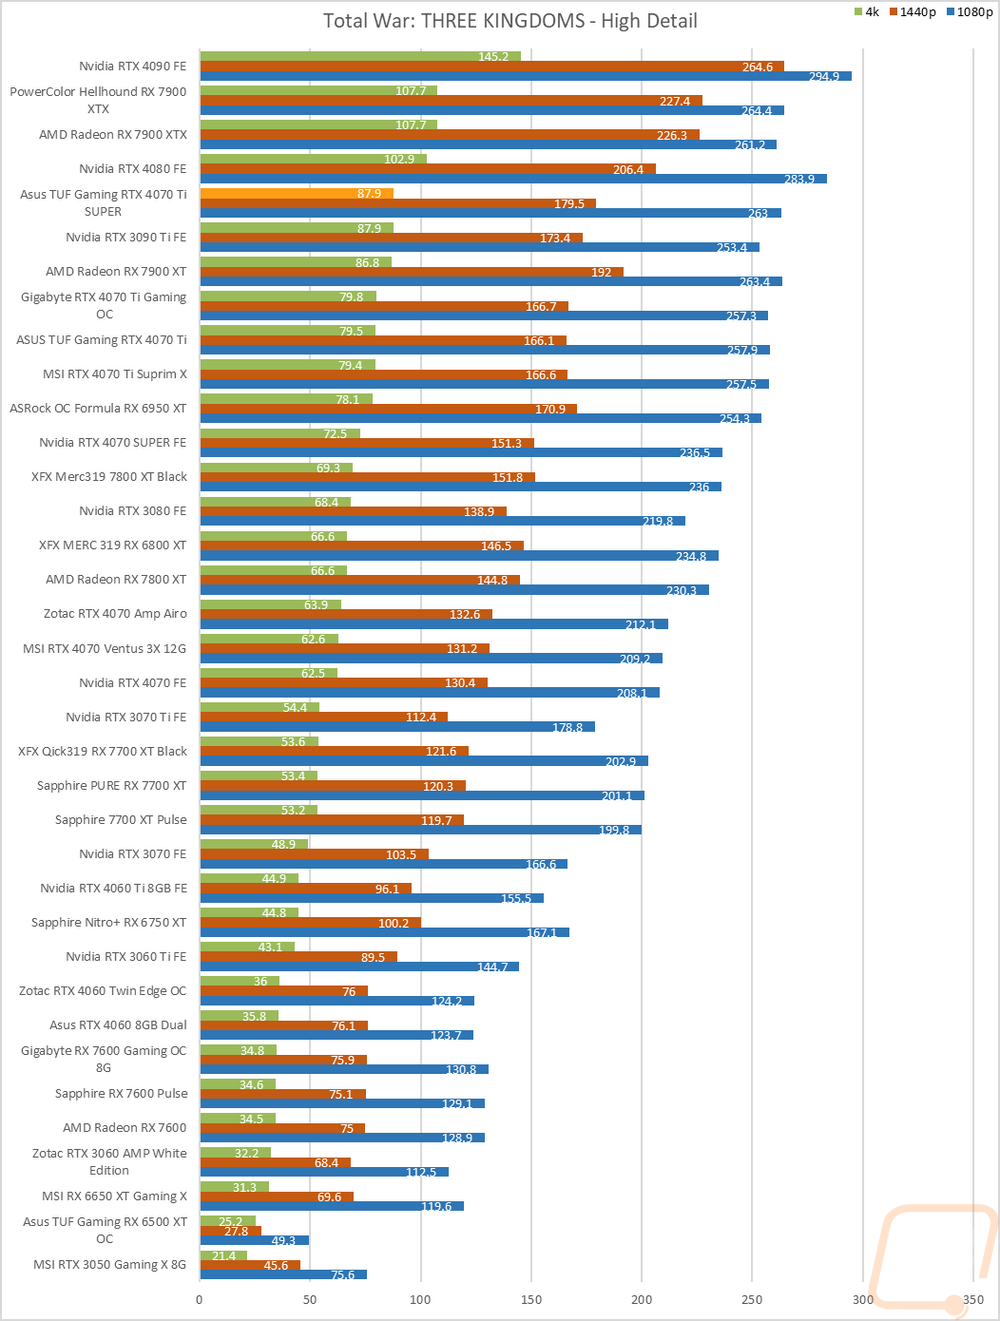
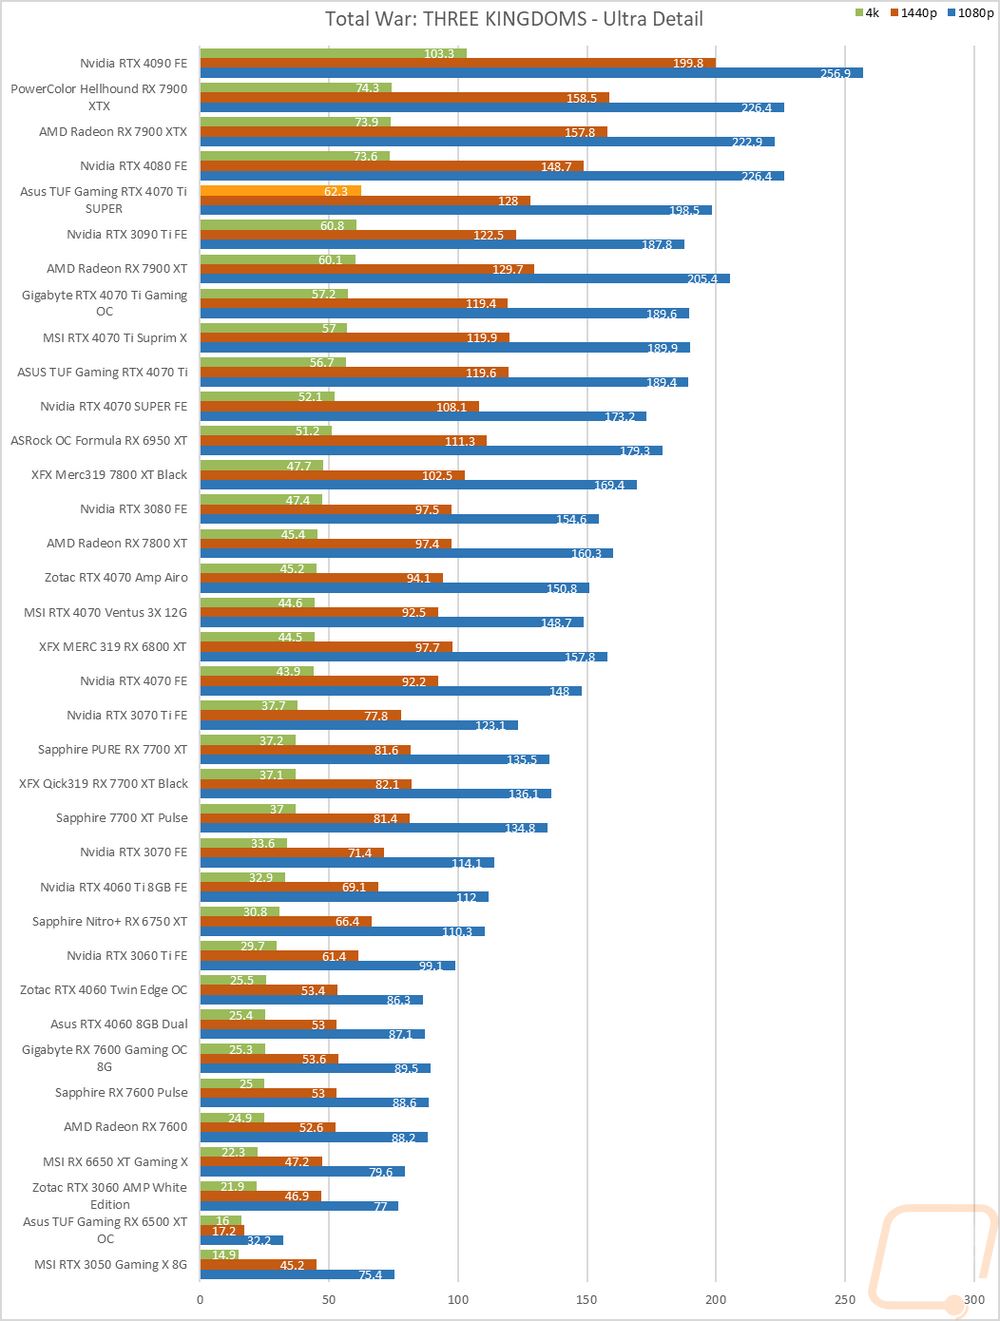
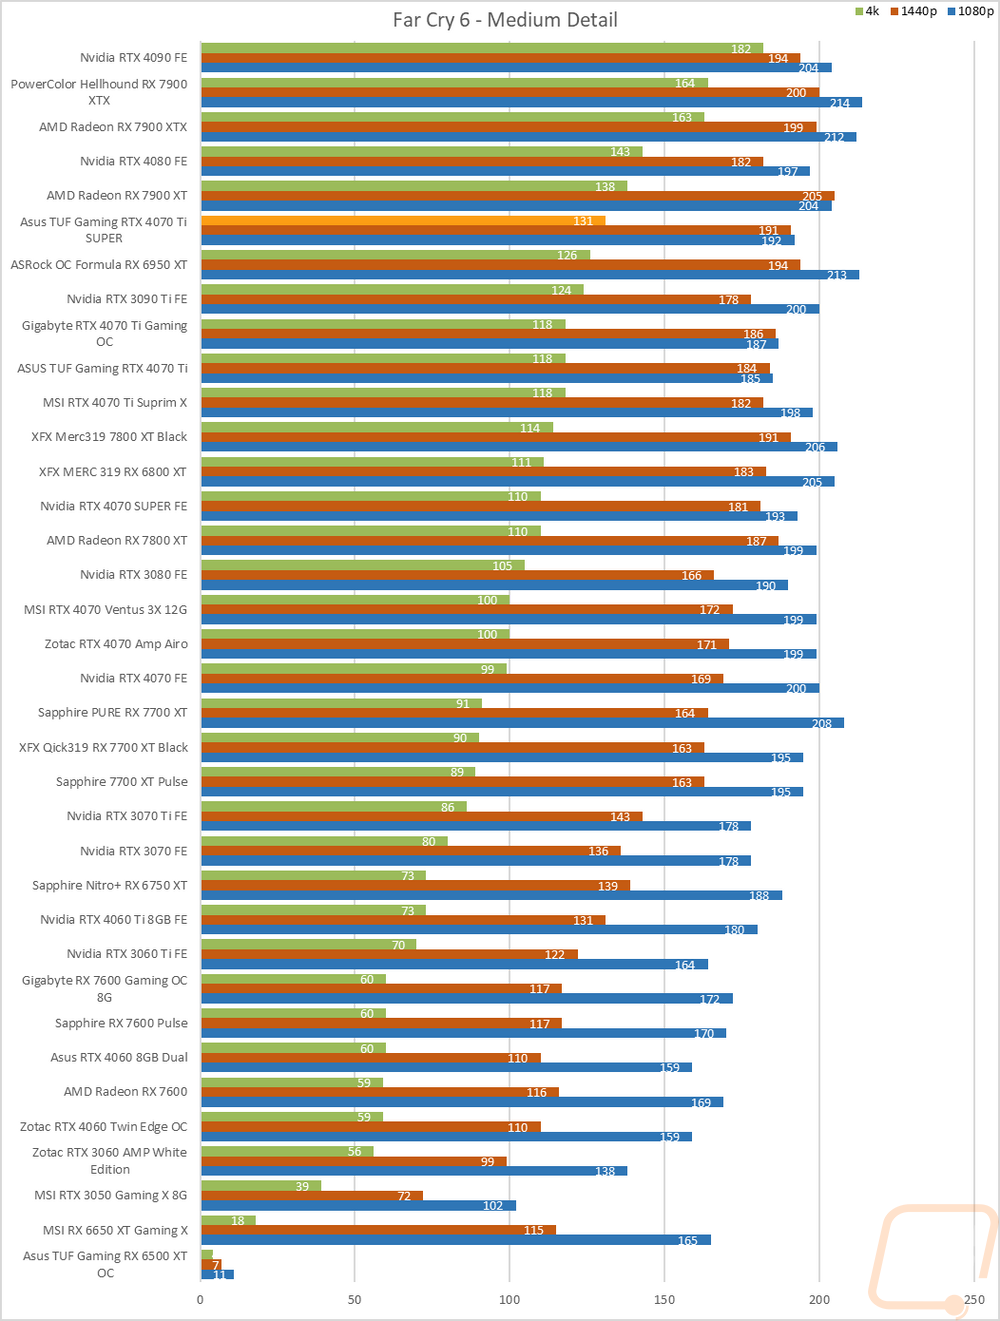
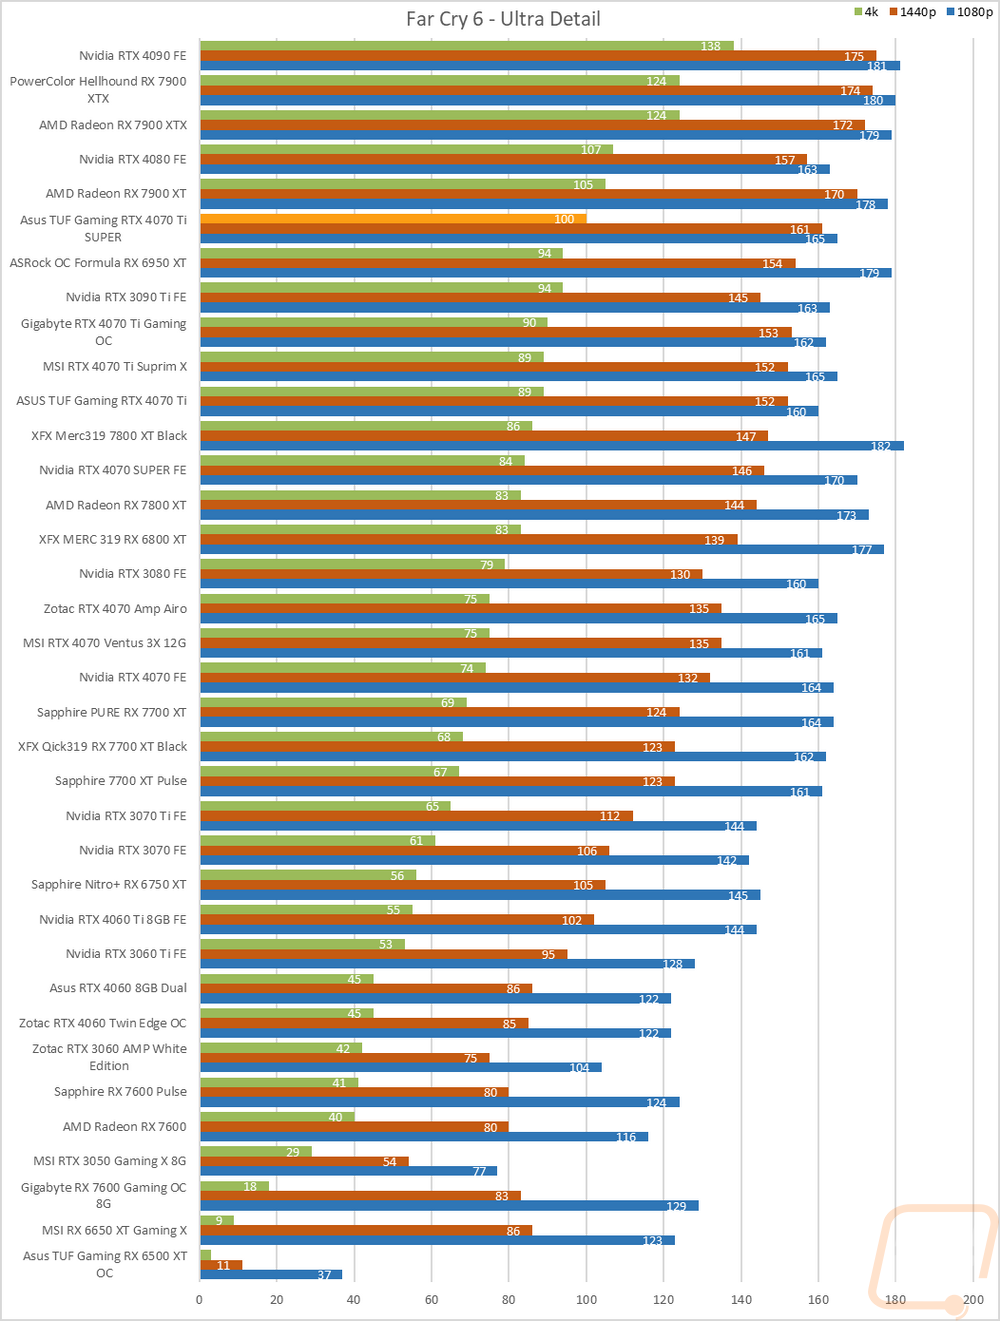
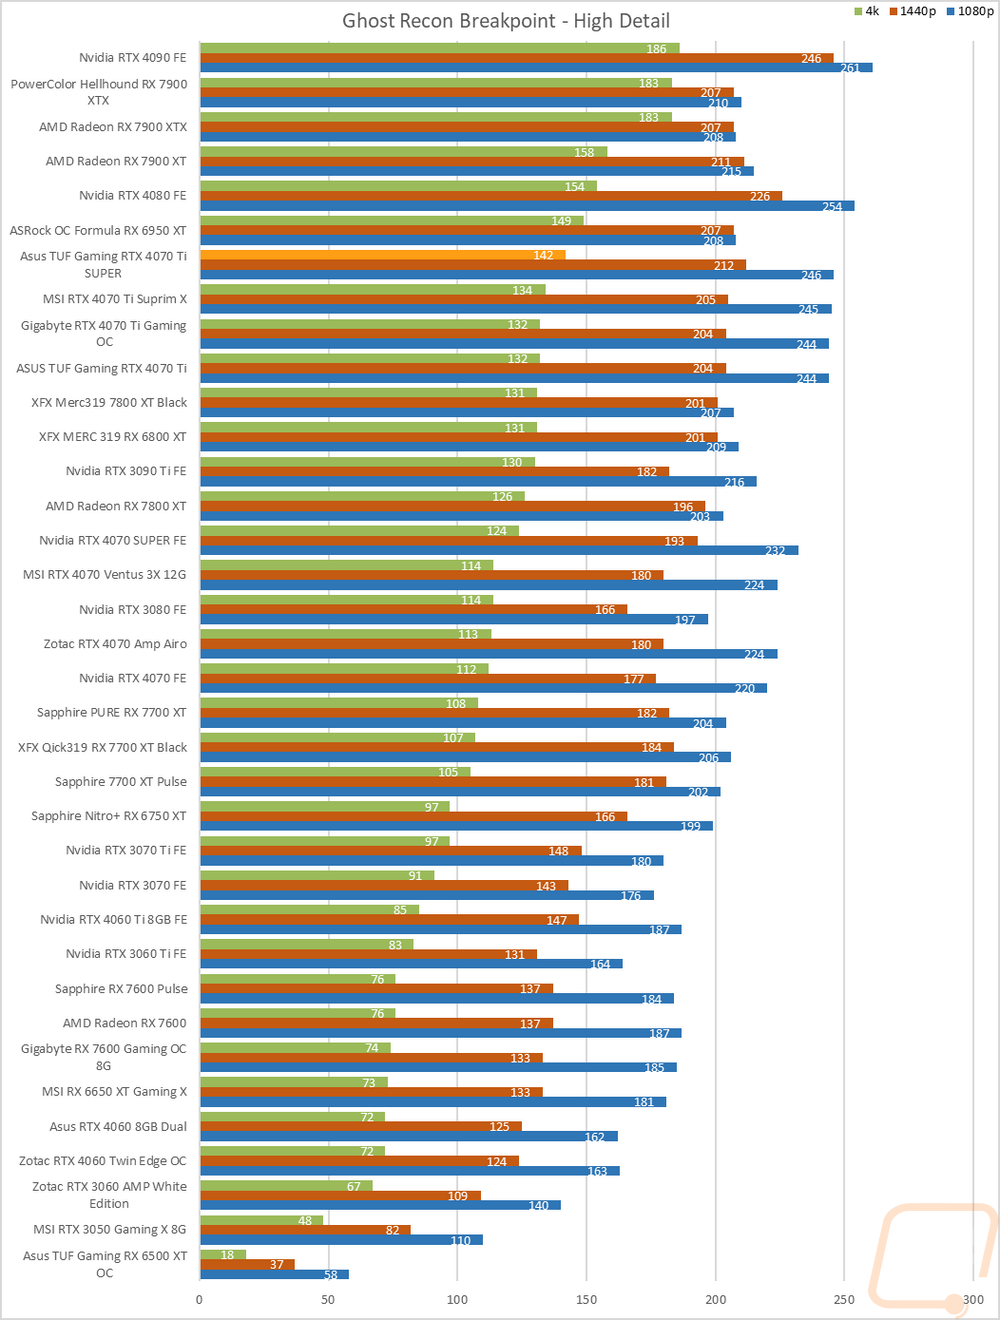
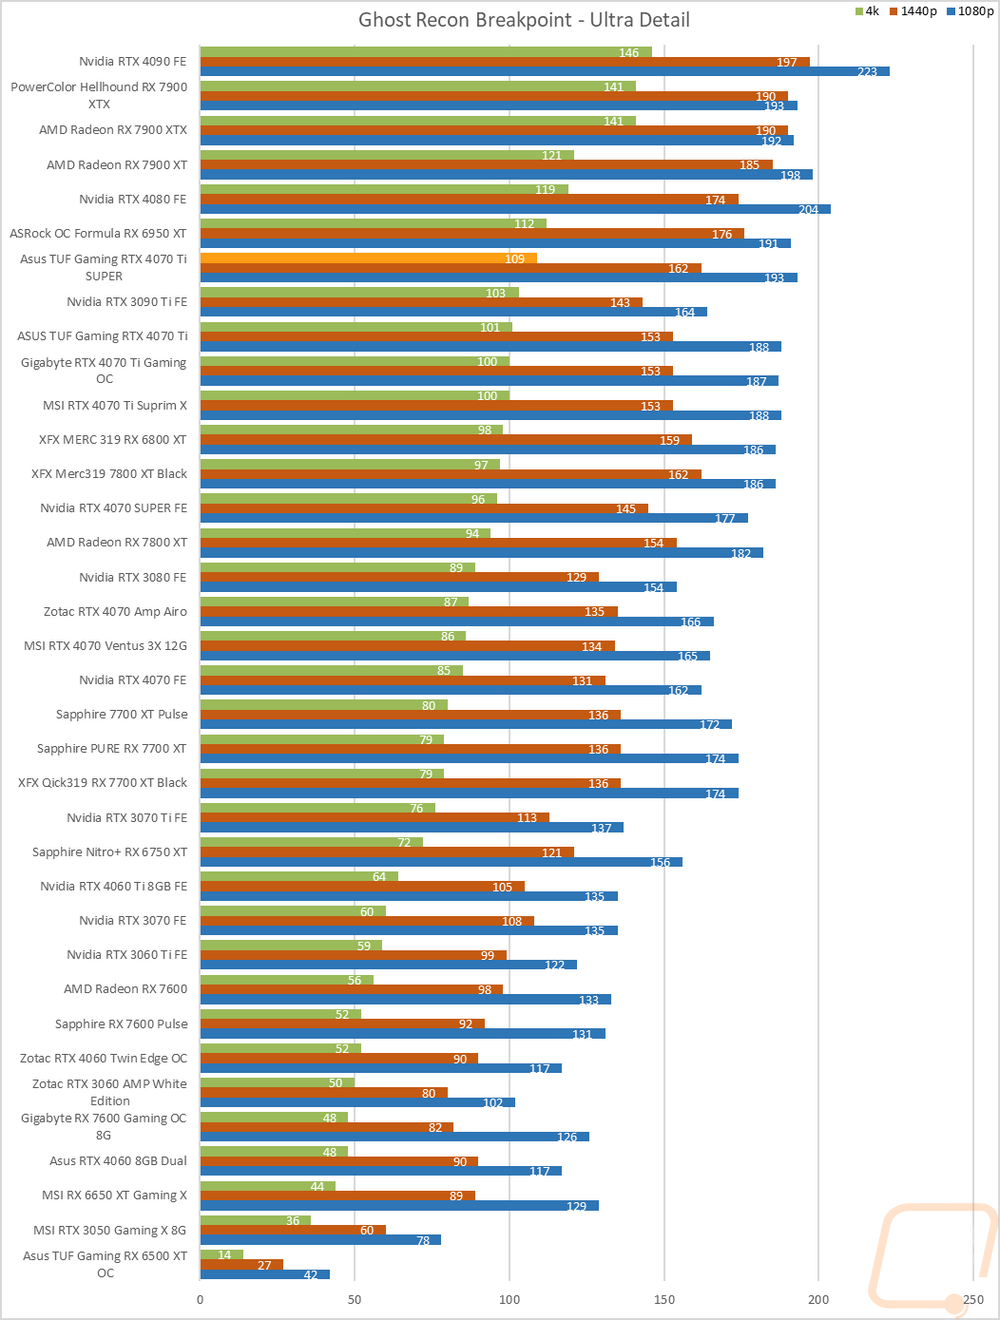
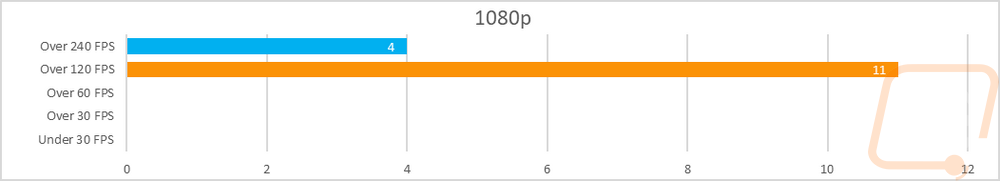
Now we finally get into the in game performance and that is the main reason people pick up a new video card. To test things out I ran through our new benchmark suite that tests 8 games at three different resolutions (1080p, 1440p, and 4k). Most of the games tested have been run at the highest detail setting and a mid-range detail setting to get a look at how turning things up hurts performance and to give an idea of if turning detail down from max will be beneficial for frame rates. In total, each video card is tested 45 times and that makes for a huge mess of results when you put them all together. To help with that I like to start with these overall playability graphs that take all of the results and give an easier-to-read result. I have one for each of the three resolutions and each is broken up into four FPS ranges. Under 30 FPS is considered unplayable, over 30 is playable but not ideal, over 60 is the sweet spot, and then over 120 FPS is for high refresh rate monitors.
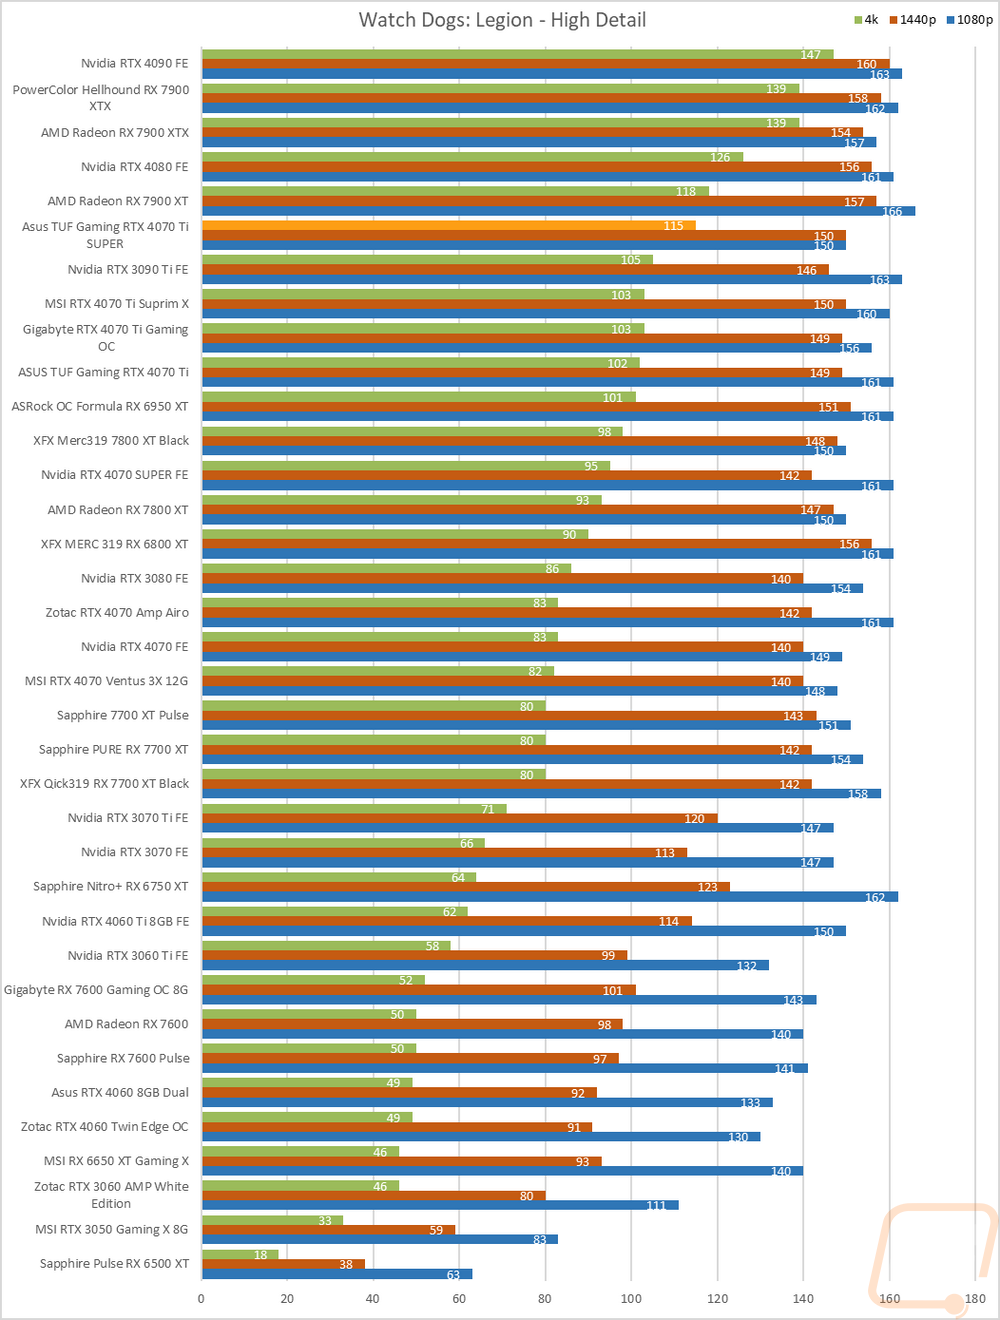
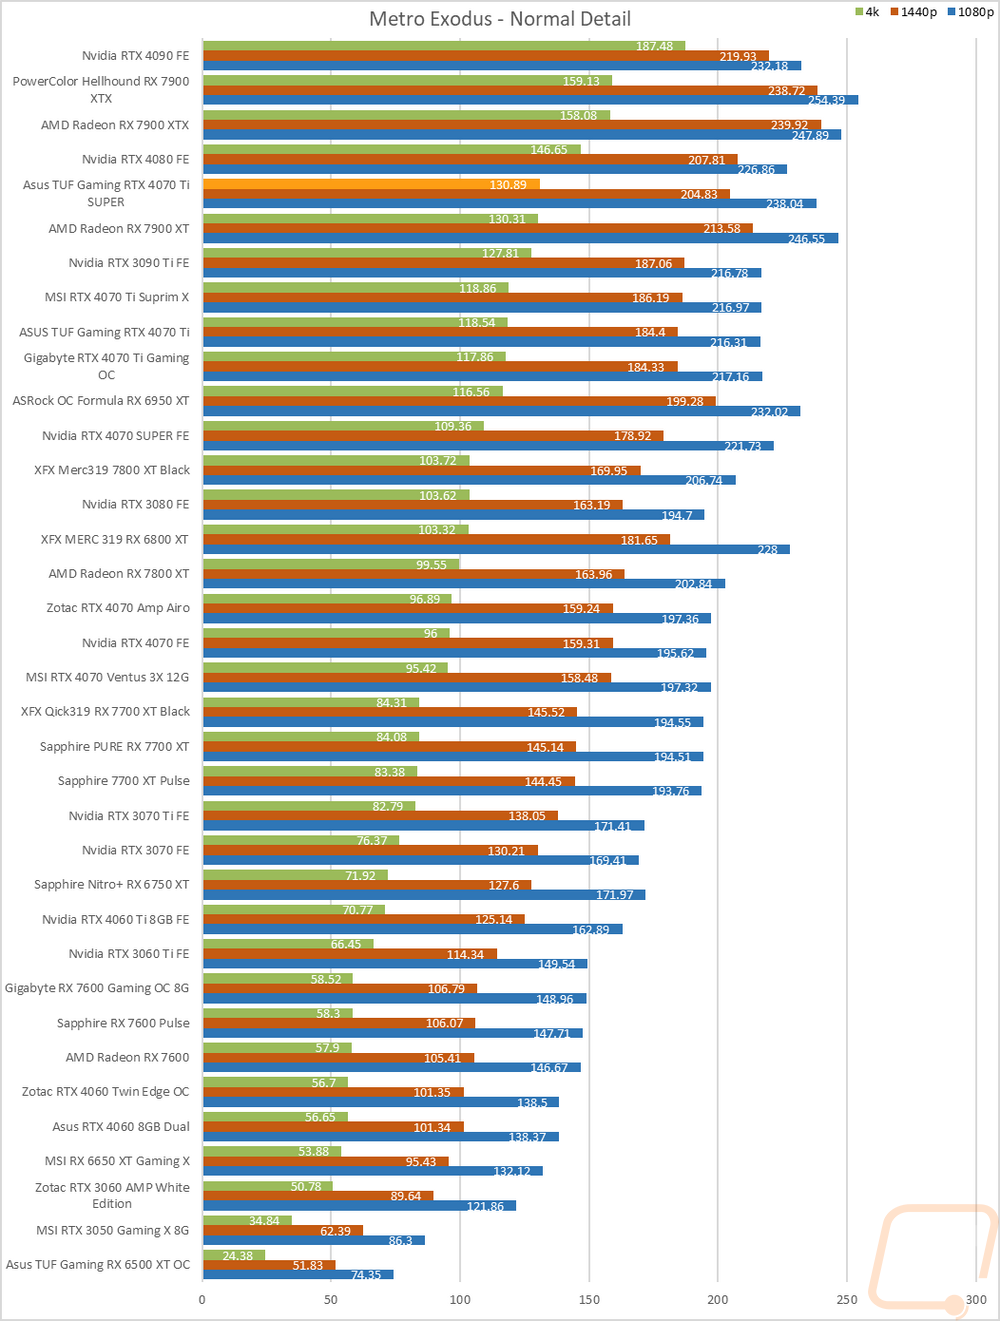
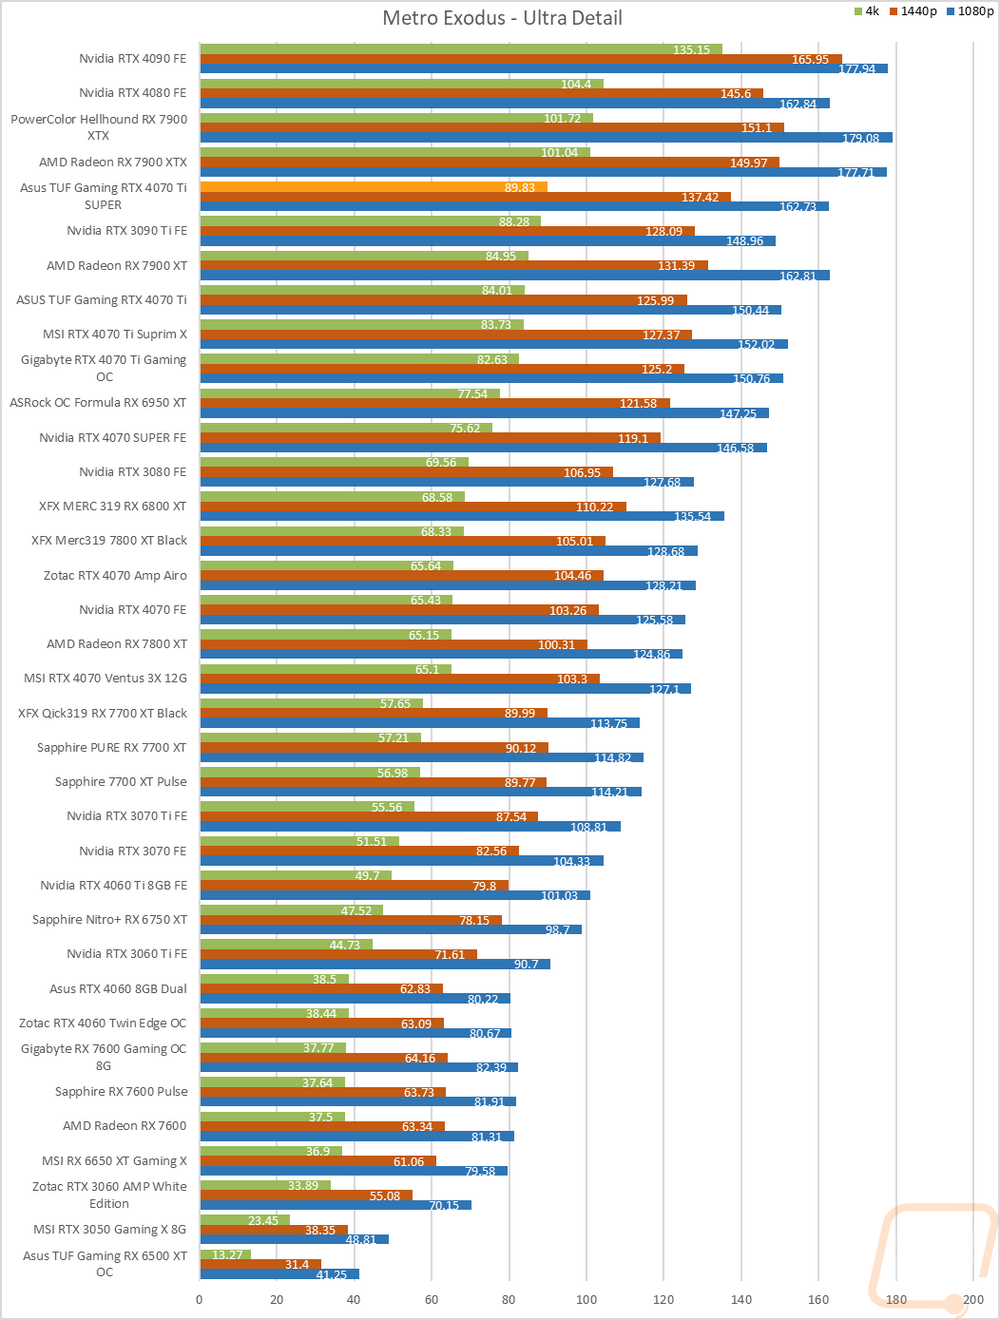
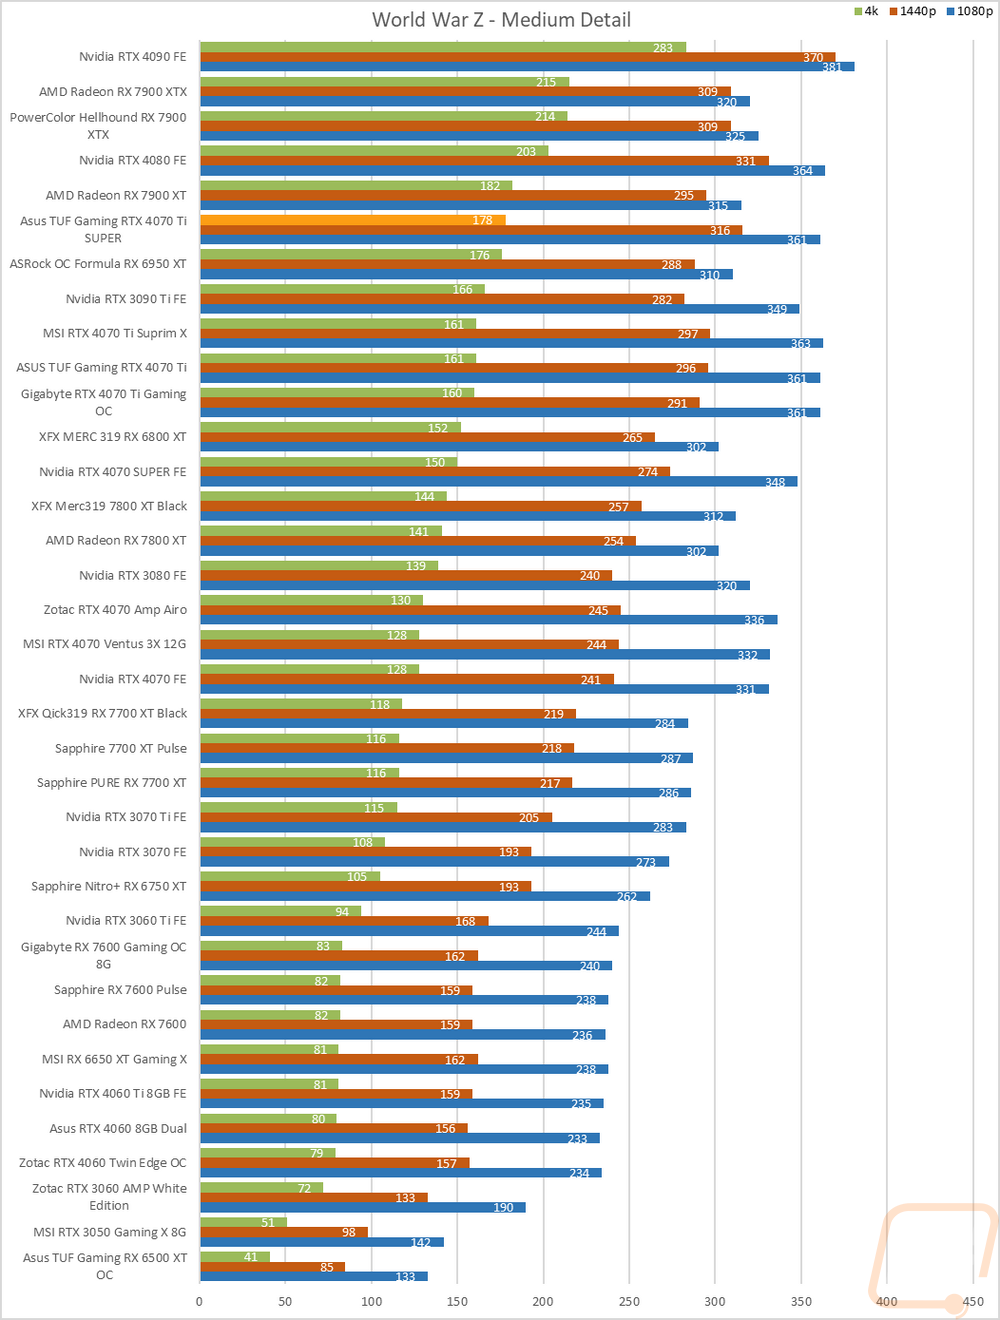
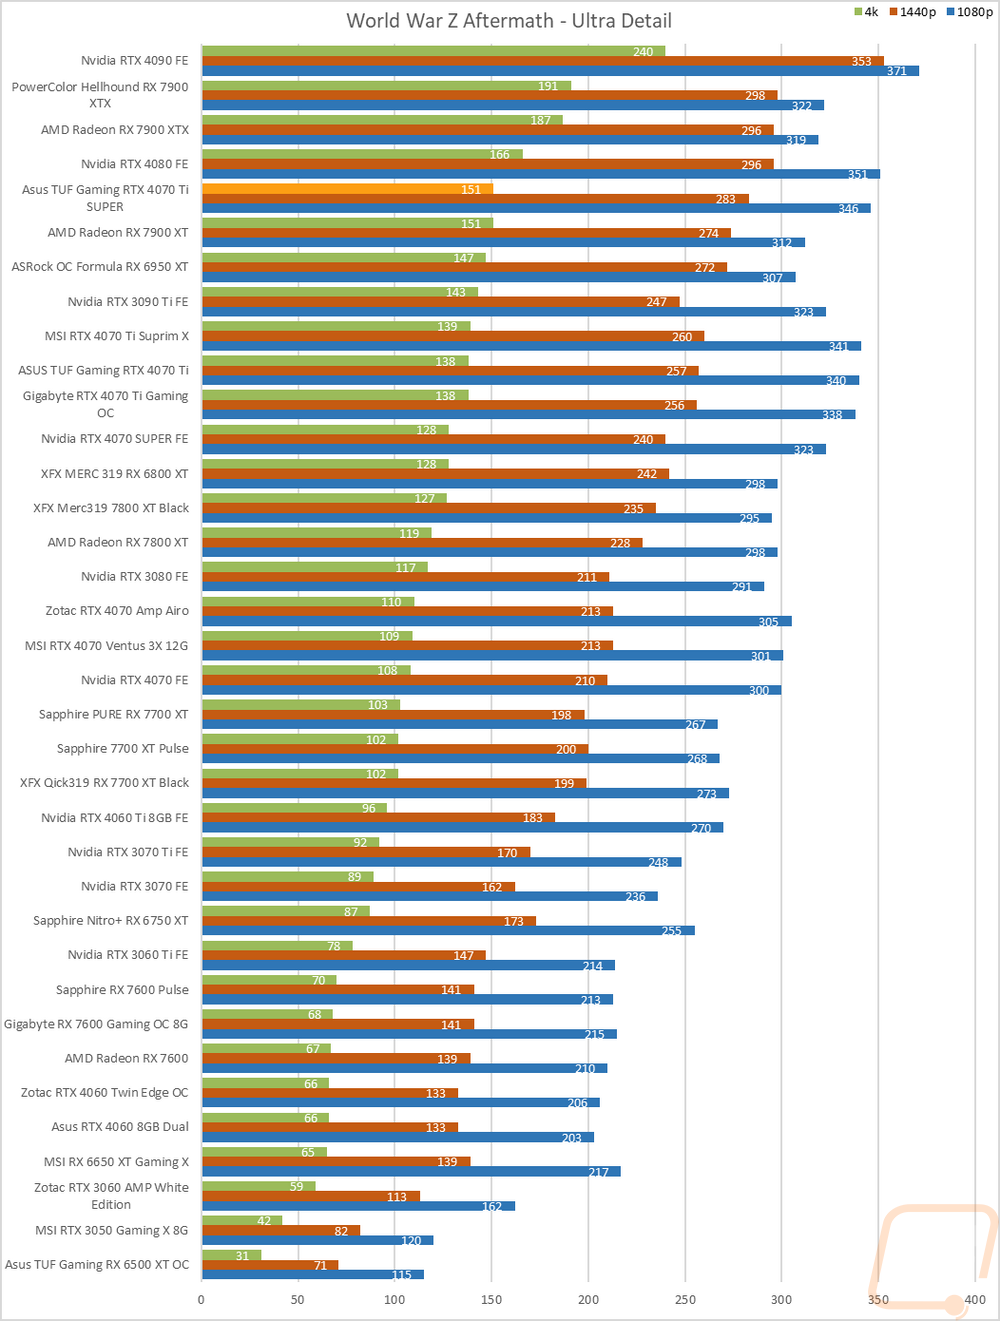
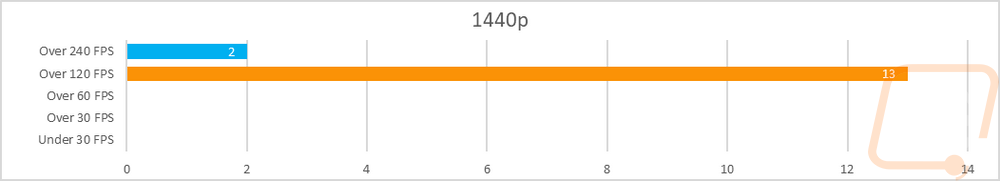
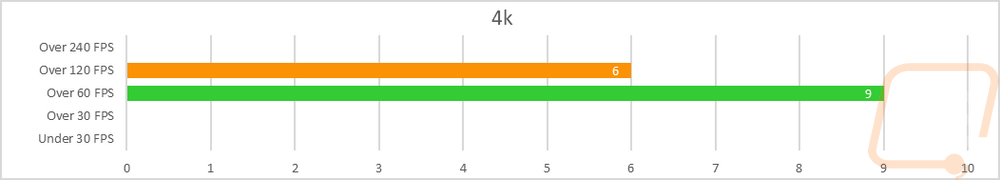
So how did the TUF Gaming RTX 4070 Ti SUPER do? Well at 1080p it breezed through all of the tests with none of the results below 120 FPS and four up over 240 FPS as well. 1440p was similar with 13 out of the 15 results in the 120-239 FPS range and two results over 240 FPS. Finally, at 4k the TUF Gaming RTX 4070 Ti SUPER did start to see some sort of a challenge but even still everything was smooth and over 60 FPS with 9 results in the 60-119 FPS range and then 6 results over 120 FPS.
Of course, I have all of the actual in game results as well for anyone who wants to sort through the wall of graphs below. I have also put together the average frame rates for the TUF Gaming RTX 4070 Ti SUPER alongside of the original TUF Gaming RTX 4070 Ti, the RTX 4080, and the AMD RX 7900 XT. This way we can see how the cards all compare. No big surprises of course when we compare the original 4070 Ti to the 4070 Ti SUPER. At 4k there was a 10% improvement and a 5.5% improvement at 1440p. That gets smaller at 1080p where a majority of the results are CPU limited. The improved core count help but seeing the performance difference at 4k, some of that is related to the larger VRAM as well which the TUF Gaming RTX 4070 Ti SUPER has 16GB to the 12 of the original 4070 Ti. The RTX 4080 is still way out in front. Then we have the RX 7900 XT which is a few FPS lower at 1080p but does beat the TUF Gaming RTX 4070 Ti SUPER at 1440p by 3 FPS and at 4k they are similar.
|
|
1080p |
1440p |
4k |
|
ASUS TUF Gaming RTX 4070 Ti |
210.7 |
174.1 |
103.6 |
|
ASUS TUF Gaming RTX 4070 Ti SUPER |
213.4 |
183.8 |
114.1 |
|
AMD Radeon RX 7900 XT |
211.1 |
186.6 |
114.8 |
|
Nvidia RTX 4080 FE |
220.7 |
193.5 |
127.5 |