
Last week I took a look at the first of Nvidia’s new SUPER lineup, the RTX 4070 SUPER which improved on the original RTX 4070’s performance getting closer to the RTX 4070 Ti’s performance. Nvidia also announced the RTX 4070 Ti SUPER and RTX 4080 SUPER cards at CES this year as well and today is the day that we can check out the RTX 4070 Ti SUPER before it hits stores tomorrow. Is the new card worth the upgrade for those who didn’t upgrade with the 4000 Series launch, today I’ll find out how it performs and where the RTX 4070 Ti SUPER fits in today's market. We also get a chance to check out what ASUS is up to as our card is a TUF Gaming model, so let’s dive in!
Product Name: ASUS TUF Gaming RTX 4070 Ti SUPER
Review Sample Provided by: Nvidia/ASUS
Written by: Wes Compton
Amazon Affiliate Link: HERE
What’s so SUPER
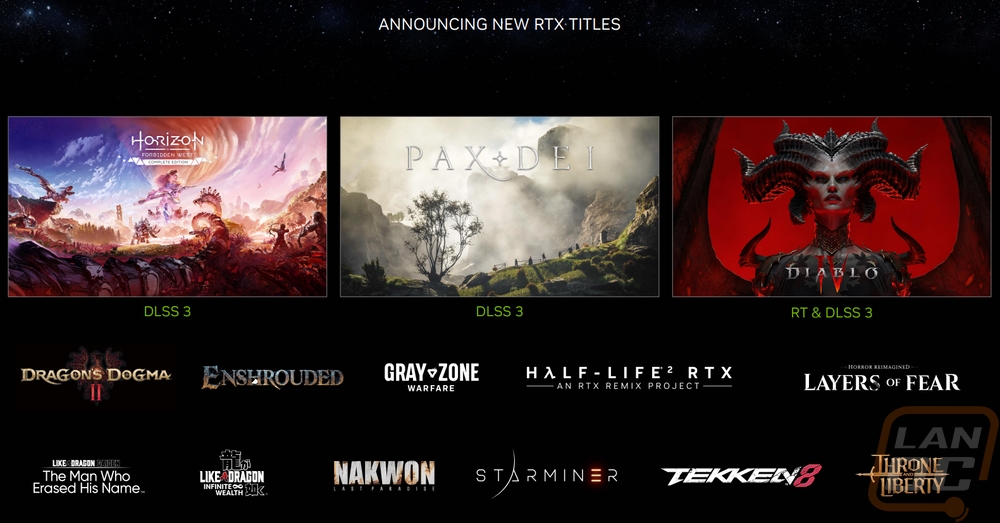
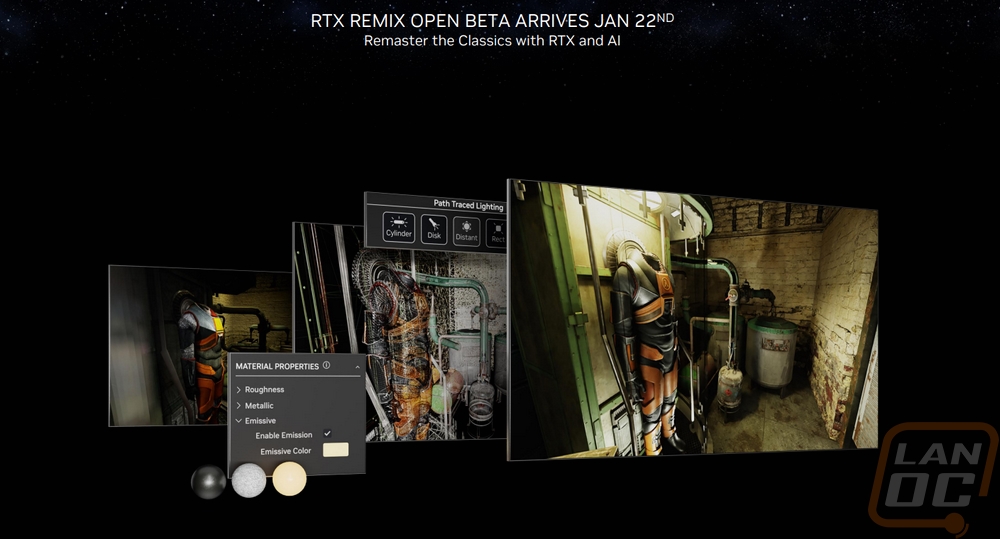
Nvidia’s CES announcements were all covered in their video but to hit a few highlights before getting into what the three new SUPER cards have to offer. They touched on a few new upcoming RTX supported titles. One of those is Half-Life 2 RTX which was done using the RTX Remix tool. That tool is going into open beta offering an easy way for modders and developers to upgrade past and current games to utilize RTX technology. Anything that makes it easier to do will only help get more support and in this case, we can potentially see upgraded games that we would have never seen otherwise which is exciting.
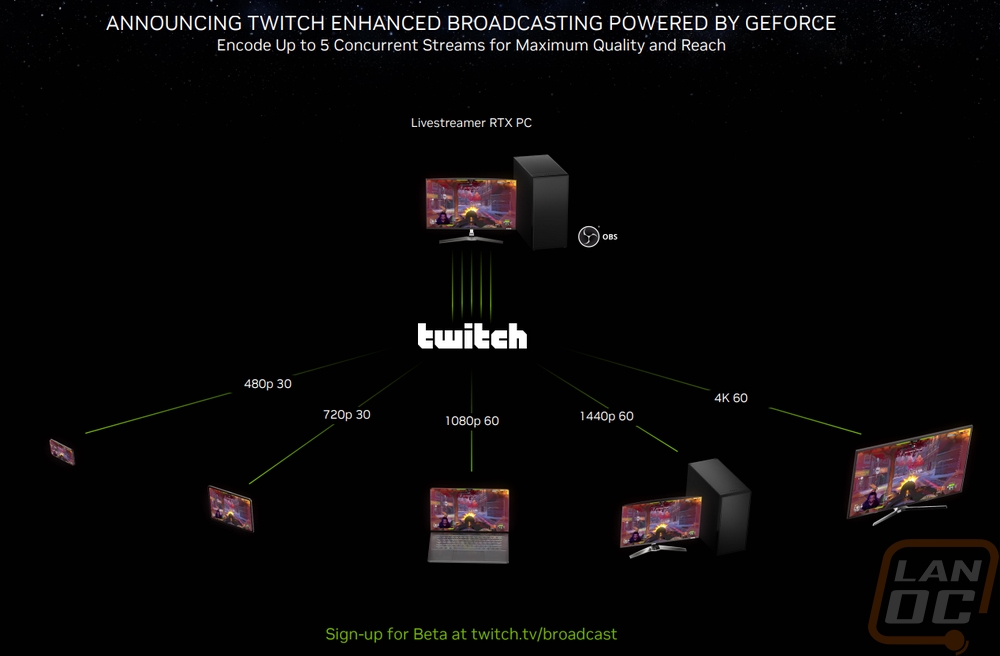
Nvidia and Twitch announced a new way for Twitch streamers to now offer a better range of resolutions. In the past, for anyone who isn’t one of their main partnered streamers you are stuck with just one resolution. This way you will be able to stream at a range of resolutions and frame rates. Viewers who have the bandwidth can enjoy better quality 4k 60 FPS streams but users on mobile or lower-performing internet connections will still be able to watch as well.
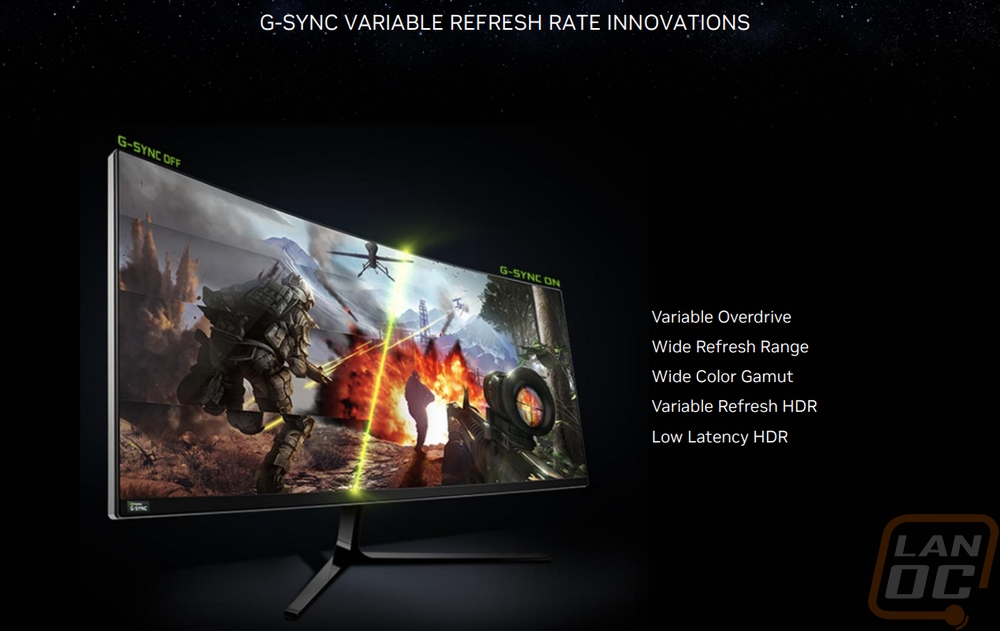
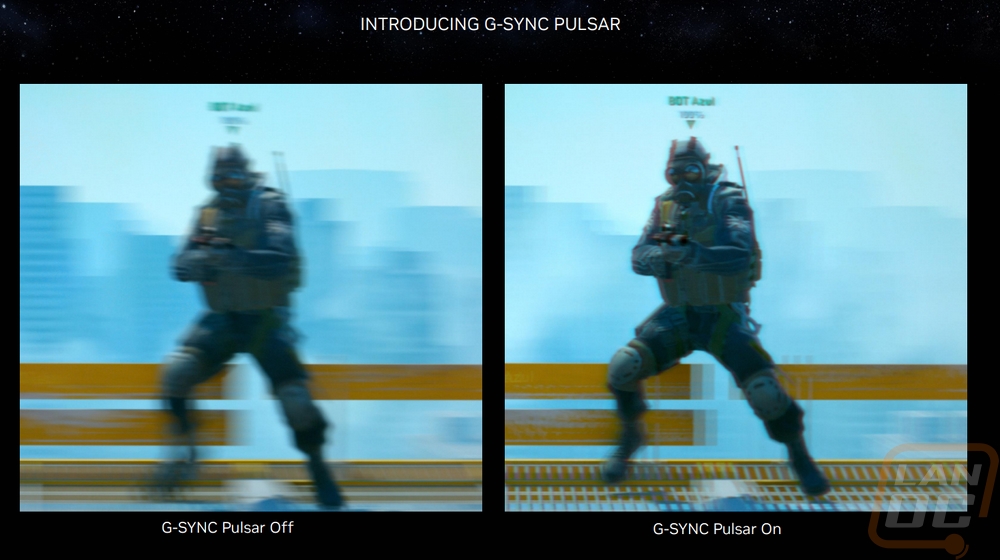
They announced improvements in G-Sync variable refresh rate. Along with that, they covered G-Sync Pulsar which is part of their VRR or variable refresh rate technology. Pulsar bridges the gap between using variable refresh rate and ultra low motion blur to get a smooth experience but cut out the blur that you can get with it.
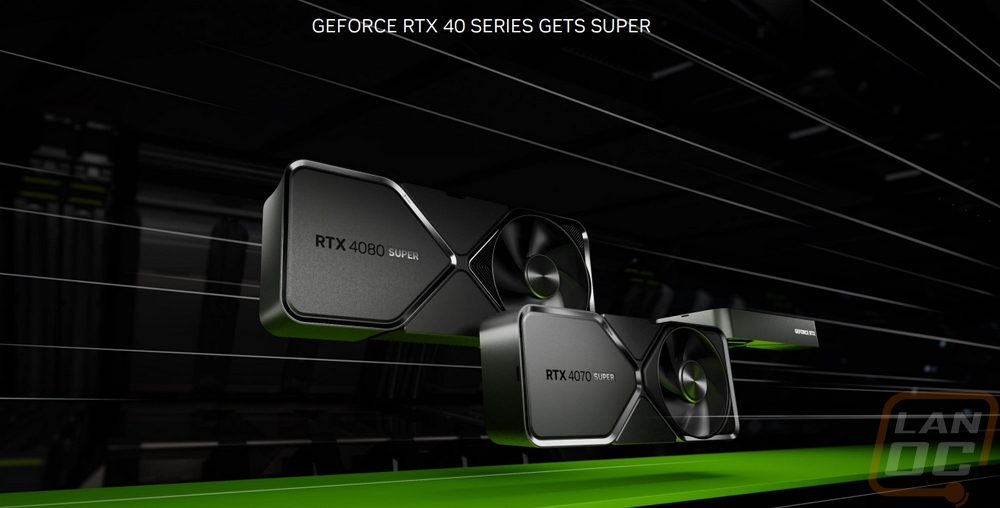
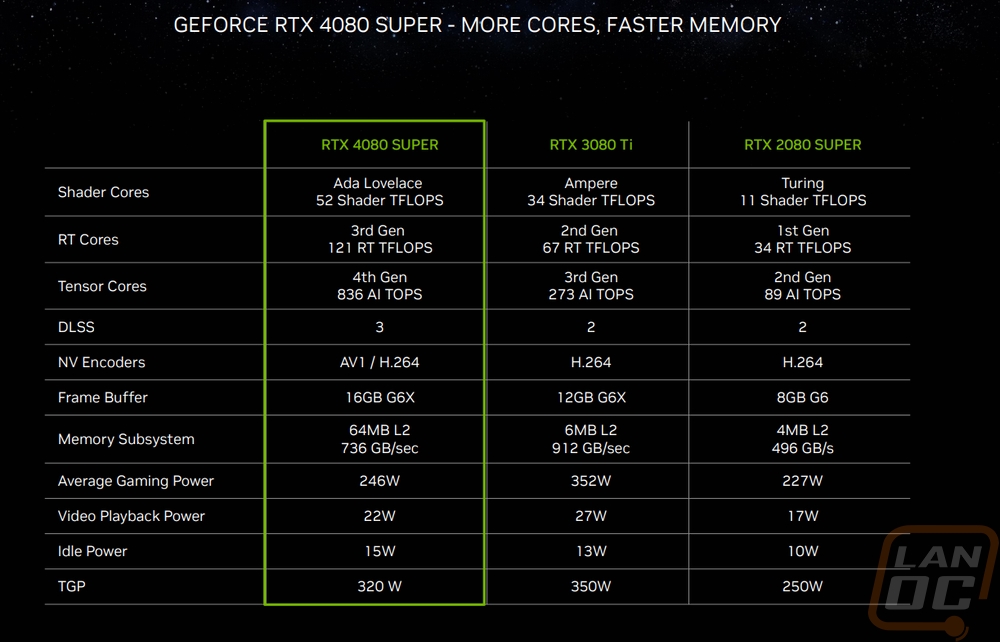
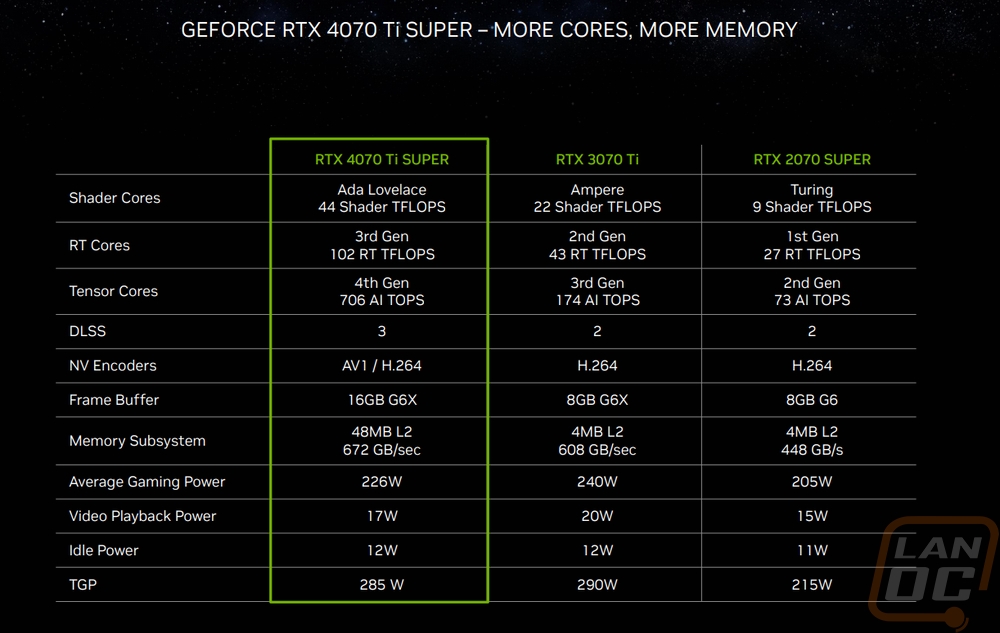
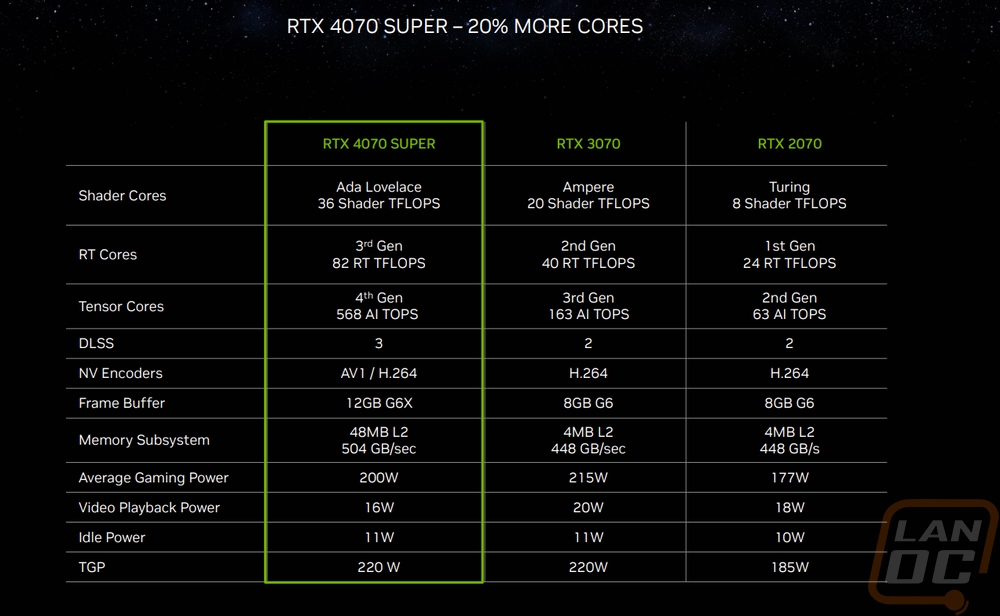
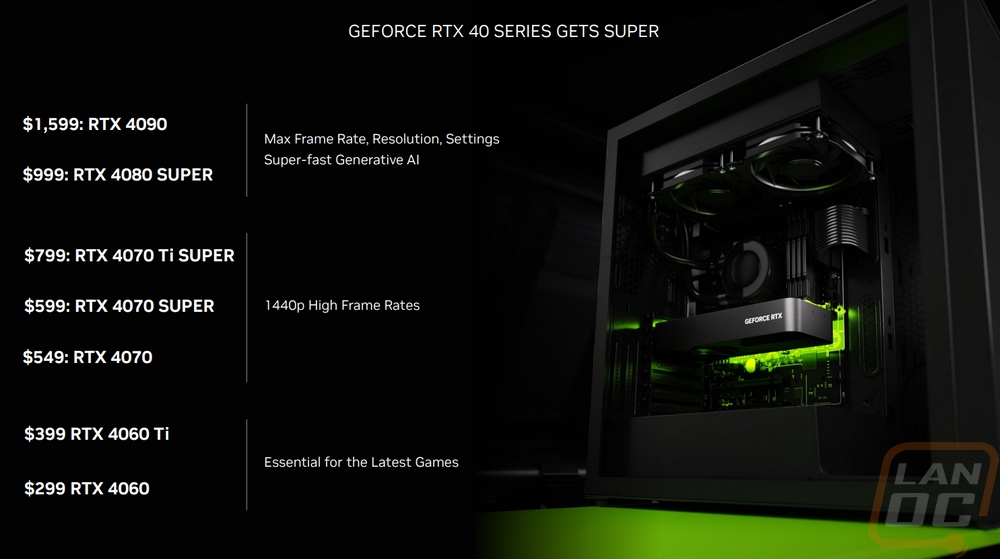
They then of course announced the three new SUPER cards and showed where all three will fit in their updated lineup. The RTX 4080 SUPER will replace the RTX 4080 and sit behind the RTX 4090 still. That will have an MSRP of $999, $200 less than the original MSRP of the RTX 4080. The new card has a faster base clock of 2295 MHz vs 2205 MHz on the 4080 and 40 MHz more on the boost clock with it now at 2550 MHz. The real improvement comes from more cores going from 9728 CUDA cores up to 10240. The RTX 4070 Ti SUPER replaces the RTX 4070 and has an MSRP of $799, the same as the original launch price of the RTX 4070. It gets a memory clock speed improvement but like with the 4080 SUPER, it's big improvements with the CUDA core count jumping up from 7680 up to 8448 which is a big improvement. With all of these cards, the tensor cores and RT cores will also scale up at the same rate as the CUDA cores as well. Lastly the RTX 4070 SUPER doesn’t replace the original RTX 4070, the original is staying in the lineup. The 4070 will now be $549, $50 less than its launch price and the RTX 4070 SUPER takes up that $599 price point and fits in between the 4070 and 4070 Ti SUPER. The CUDA core count goes from 5888 up to 7168, a 21.7% improvement and the same boost and memory clock speeds. Nvidia did bump up the power usage slightly with the 4070 SUPER now having a TGP of 220 Watts to the 200 Watts on the 4070, the 4080 SUPER and 4070 Ti SUPER both stay the same at 285 Watts and 320 watts respectively. Overall though I like that as a refresh the focus is on adding more cores, not cranking up clock speeds which we have seen with things like the RX 480 to RX 580.
|
Specifications |
RTX 4070 SUPER |
RTX 4070 Ti |
RTX 4070 Ti SUPER |
RTX 4080 |
|
Graphics Processing Clusters |
5 |
5 |
6 |
7 |
|
Texture Processing Clusters |
28 |
30 |
33 |
38 |
|
Streaming Multiprocessors |
56 |
60 |
66 |
76 |
|
CUDA Cores |
7168 |
7680 |
8448 |
9728 |
|
Tensor Cores |
224 (4th Gen) |
240 (4th Gen) |
264 (4th Gen) |
304 (4th Gen) |
|
RT Cores |
56 (3rd Gen) |
60 (3rd Gen) |
66 (3rd Gen) |
76 (3rd Gen) |
|
Texture Units |
224 |
240 |
264 |
304 |
|
ROPs |
80 |
80 |
96 |
112 |
|
Boost Clock |
2475 MHz |
2610 MHz |
2610 MHz |
2505 MHz |
|
Memory Clock |
1313 MHz |
1313 MHz |
1313 MHz |
1400 MHz |
|
Memory Data Rate |
21 Gbps |
21 Gbps |
21 Gbps |
22.4 Gbps |
|
L2 Cache Size |
48MB |
48 MB |
48 MB |
64 MB |
|
Total Video Memory |
12 GB GDDR6X |
12 GB GDDR6X |
16 GB GDDR6X |
16 GB GDDR6X |
|
Memory Interface |
162-bit |
192-bit |
256-bit |
256-bit |
|
Total Memory Bandwidth |
504 GB/s |
504 GB/sec |
672 GB/sec |
1008 GB/sec |
|
Texture Rate (Bilinear) |
561.1 GigaTexels/second |
626 Gigatexels/sec |
689 GigaTexels/second |
761.5 GigaTexels/second |
|
Fabrication Process |
4N NVIDIA Custom Process |
TSMC 4N NVIDIA Custom Process |
4N NVIDIA Custom Process |
TSMC 4N NVIDIA Custom Process |
|
Transistor Count |
35.8 Billion |
35.8 billion |
45.9 Billion |
45.9 Billion |
|
Connectors |
3 x DisplayPort 1 x HDMI |
3 x DisplayPort 1 x HDMI |
3 x DisplayPort 1 x HDMI |
3 x DisplayPort 1 x HDMI |
|
Power Connectors |
2x PCIe 8-pin cables (adapter in box) OR 300 W or greater PCIe Gen 5 cable |
2x PCIe 8-pin cables OR 300w or greater PCIe Gen 5 cable |
2x PCIe 8-pin cables (adapter in box) OR 300 W or greater PCIe Gen 5 cable |
3x PCIe 8-pin cables (adapter in box) OR 1x 450 W or greater PCIe Gen 5 cable |
|
Minimum Power Supply |
650 Watts |
700 Watts |
700 Watts |
750 Watts |
|
Total Graphics Power (TGP) |
220 Watts |
285 Watts |
285 Watts |
320 Watts |
|
Maximum GPU Temperature |
90° C |
90° C |
90° C |
90° C |
|
PCI Express Interface |
Gen 4 |
Gen 4 |
Gen 4 |
Gen 4 |
|
Launch MSRP |
$599 |
$799 |
$799 |
$1199 |
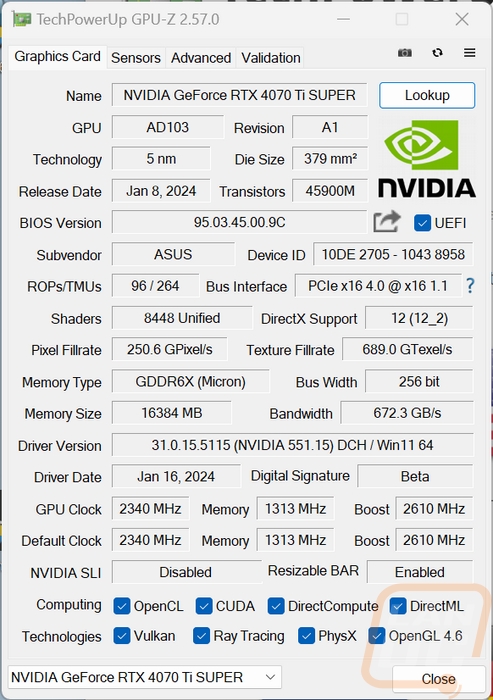
Before getting into testing I did also run GPUz to double-check that our clock speeds match up with the specifications. The TUF Gaming RTX 4070 Ti SUPER has a boost clock of 2610 MHz which matches the stock clock speeds from Nvidia and the 1313 MHz memory clock speed as well. This also shows the driver I tested with which is the 551.15 driver and documents the BIOS version for future reference as well.
Packaging
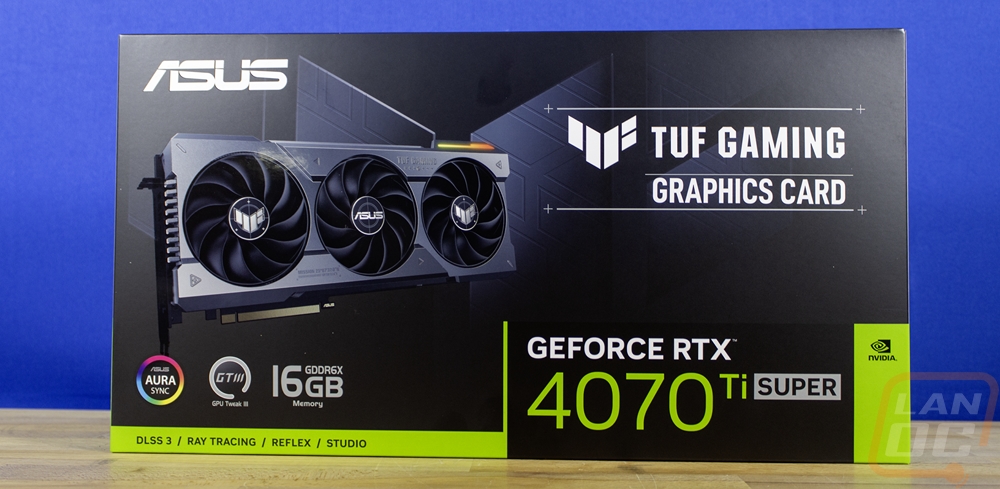
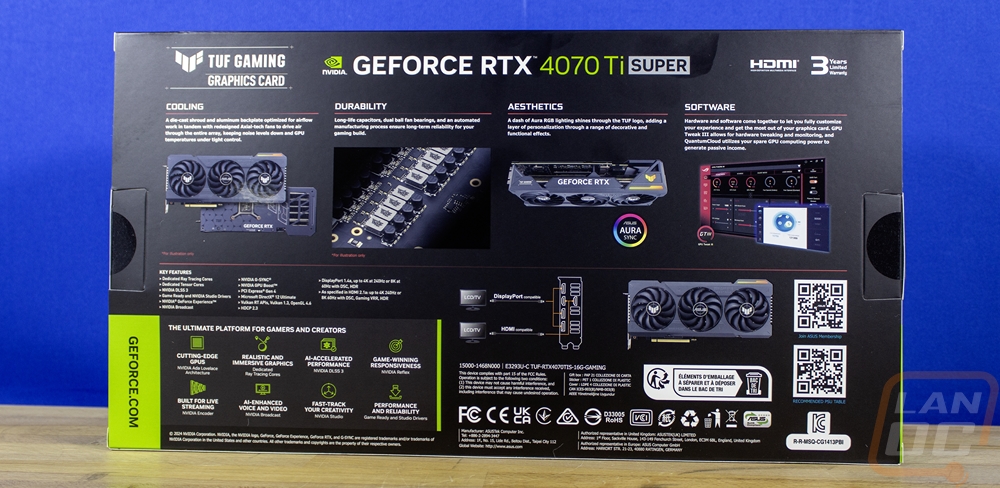
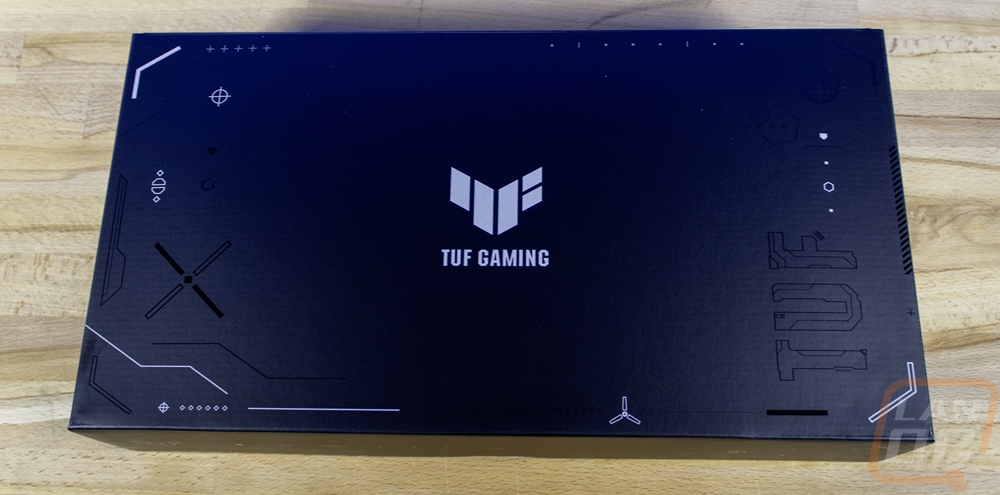
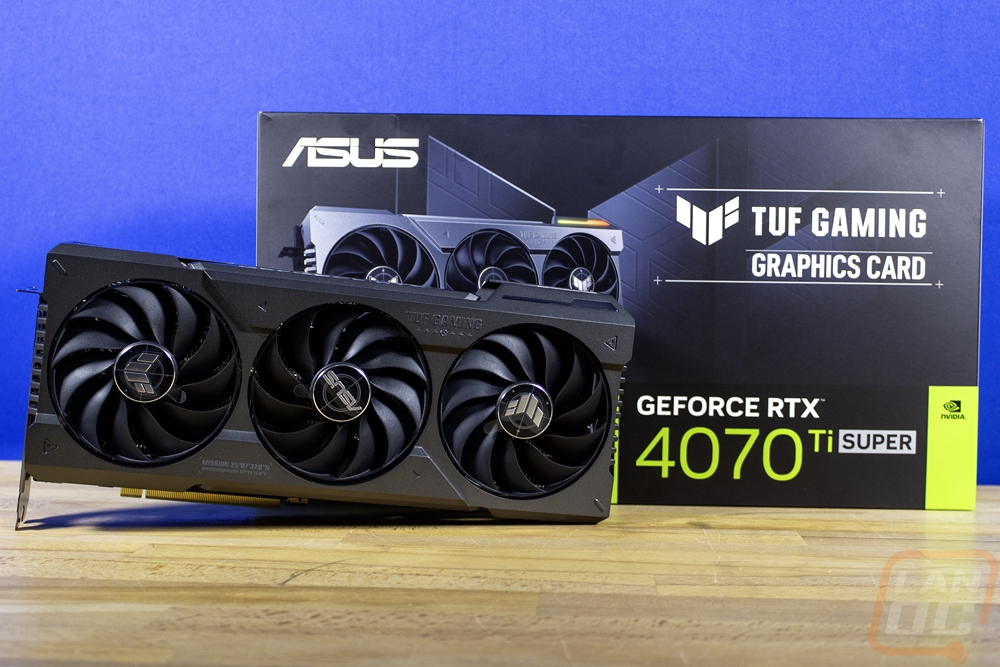
For the packaging on the TUF Gaming RTX 4070 Ti SUPER things aren’t really any different than the TUF 4070 Ti that I took at a year ago. The front of the box has a black background with a TUF logo in the background. Then the front has the entire bottom being Nvidia’s “wraparound” which has the Nvidia green and lets us know the model name and highlights a few of Nviida’s technologies. Asus has their logo in the top left corner then the TUF Gaming branding in the top right leaving just a little room for a picture of the card which I’m glad they included and the 16GB memory and AURA sync support icons are below that. The back of the box has more of Nvidia’s wraparound but here Asus has more room to show off some of the main features with four pictures with descriptions of different features. They also have a line drawing showing the display connections for the card as well. The only thing missing for me if you are shopping in retail is a specification listing that lets you know the clock speed and card dimensions but we never get those on any GPU packaging.
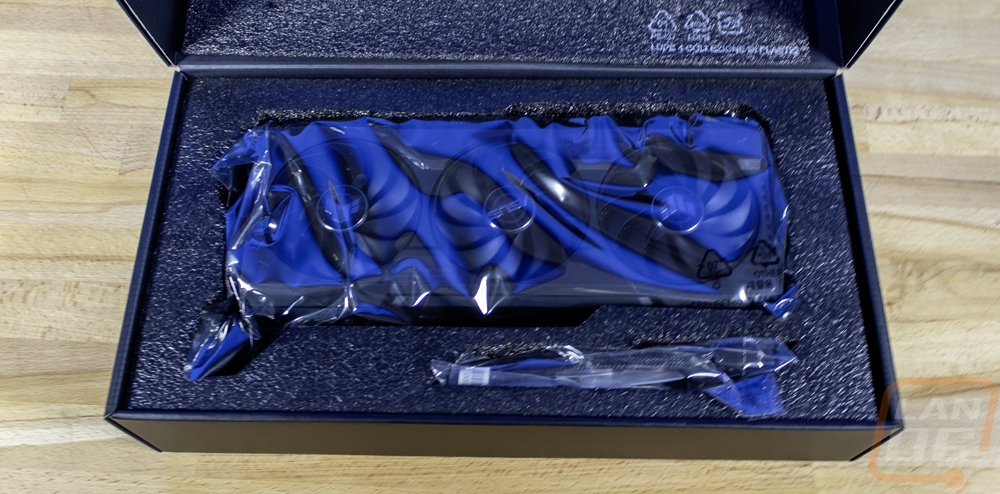
Once you pull the outer box off inside is a black cardboard box which has more TUF Gaming branding all over it in white and gloss black as well. This slides up and has a thin foam layer under the lid and a thick foam tray in the bottom. The foam tray has cutouts for the card which comes in a static protective bag and a second cutout for accessories. Below the card, there is also an Asus branded envelope which has all of the documentation inside.
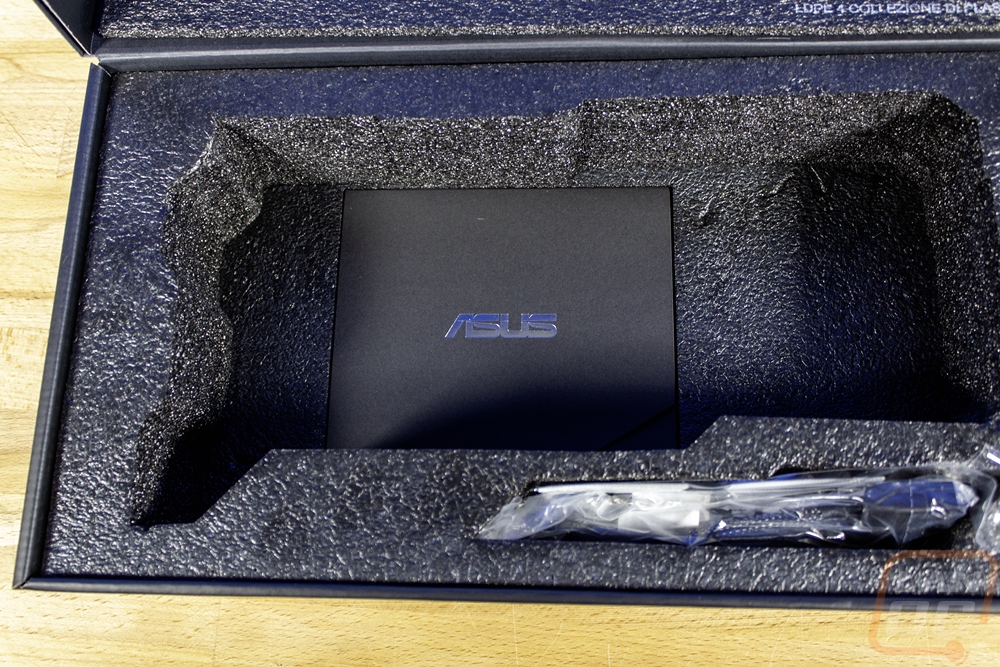
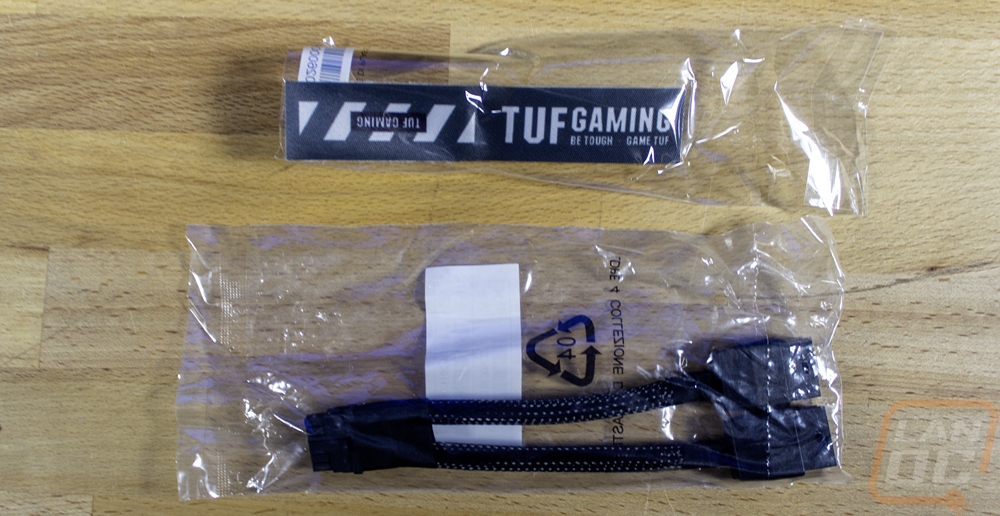
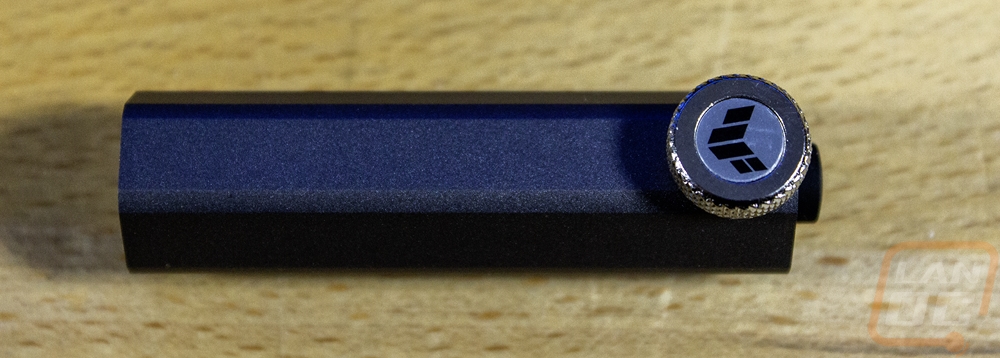
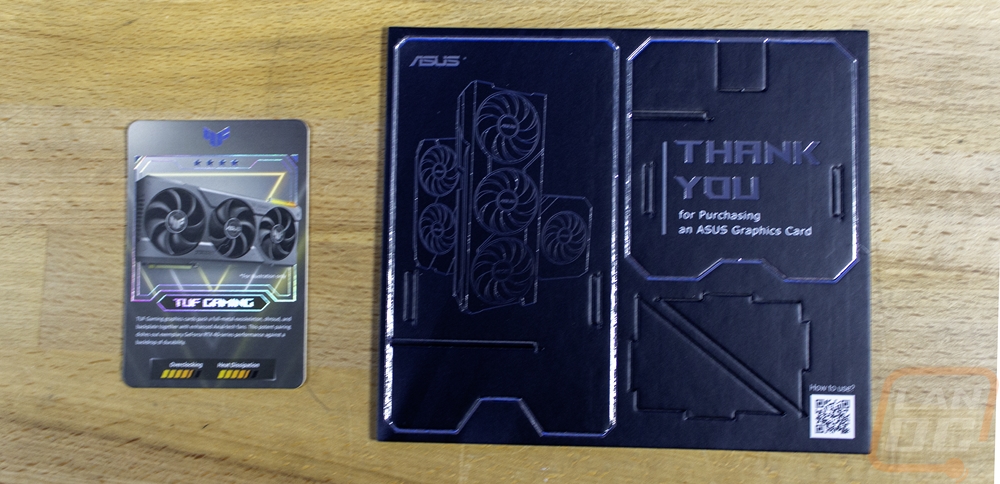
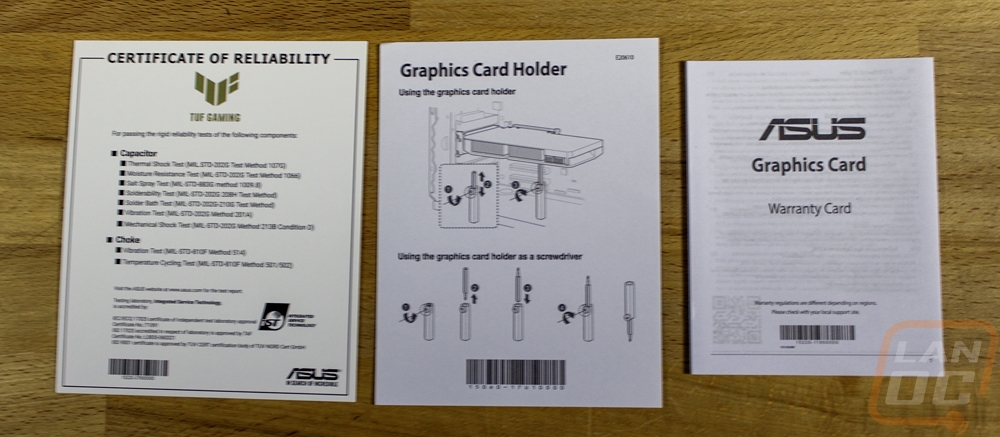
For accessories, the TUF Gaming RTX 4070 Ti SUPER comes with a power adapter, which gives you a 12VHPWR connection from two PCIe 8-pin power plugs. You also get a TUF-branded Velcro wire tie. There is also a small card support which has the TUF logo on the adjustable height setscrew. The envelope had a lot more documentation than I expected. You get a cardboard standee of Asus cards and a thick cardboard playing card which has the GPU on it. There is a certificate of reliability that highlights a few of the reasons that TUF is different from Asus’s other brands and a warranty book as well. There is also a paper that shows how the card support works. Asus included a paper that shows how the new 12VHPWR plug should be plugged in to prevent issues and then a thick quick start guide as well.
Card Layout and Photos
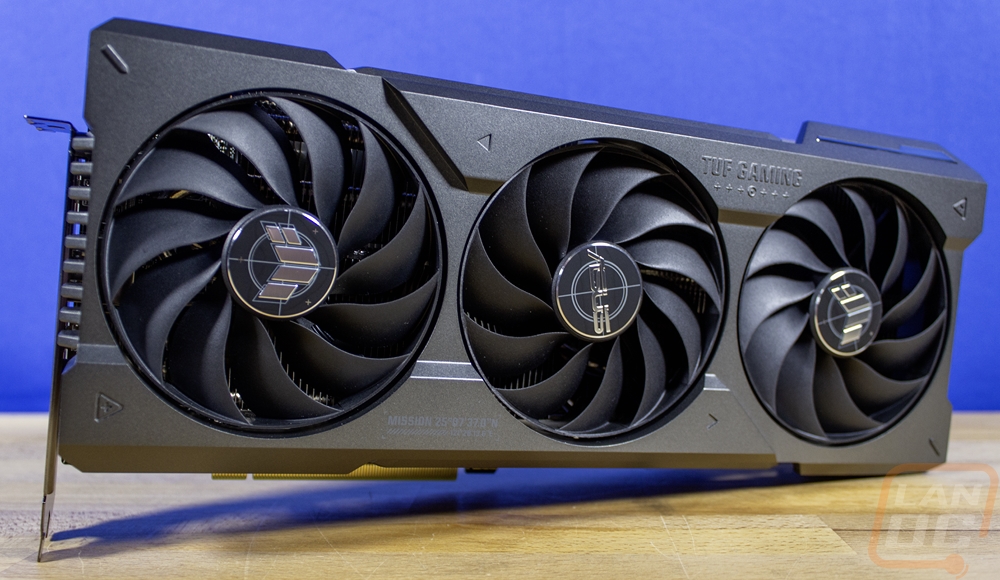
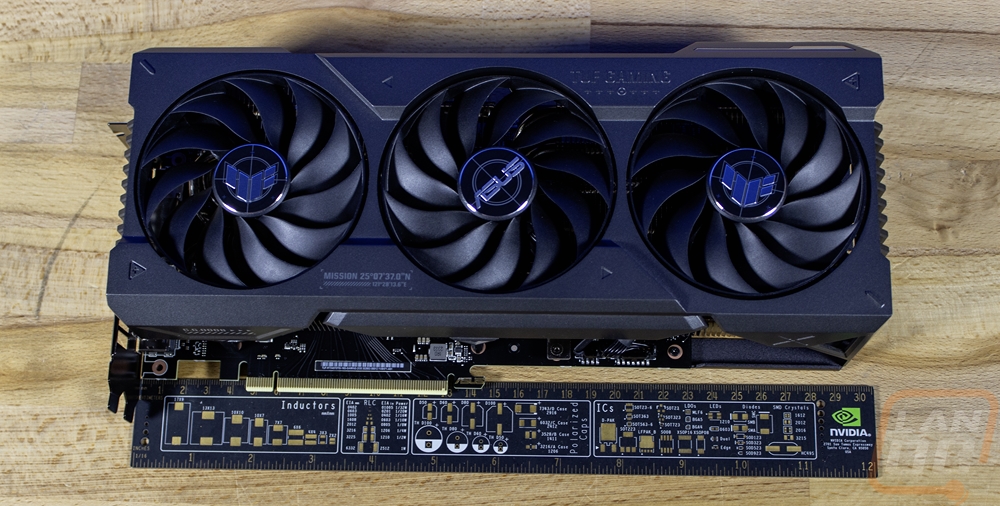
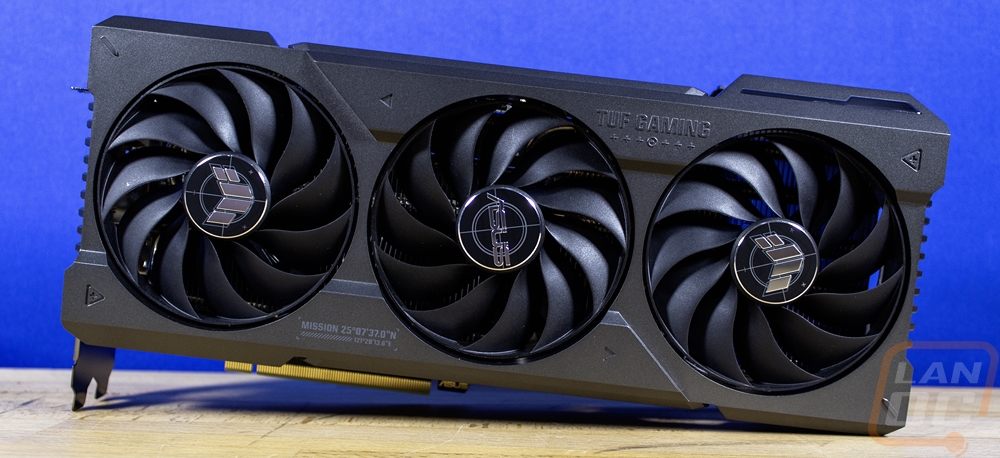
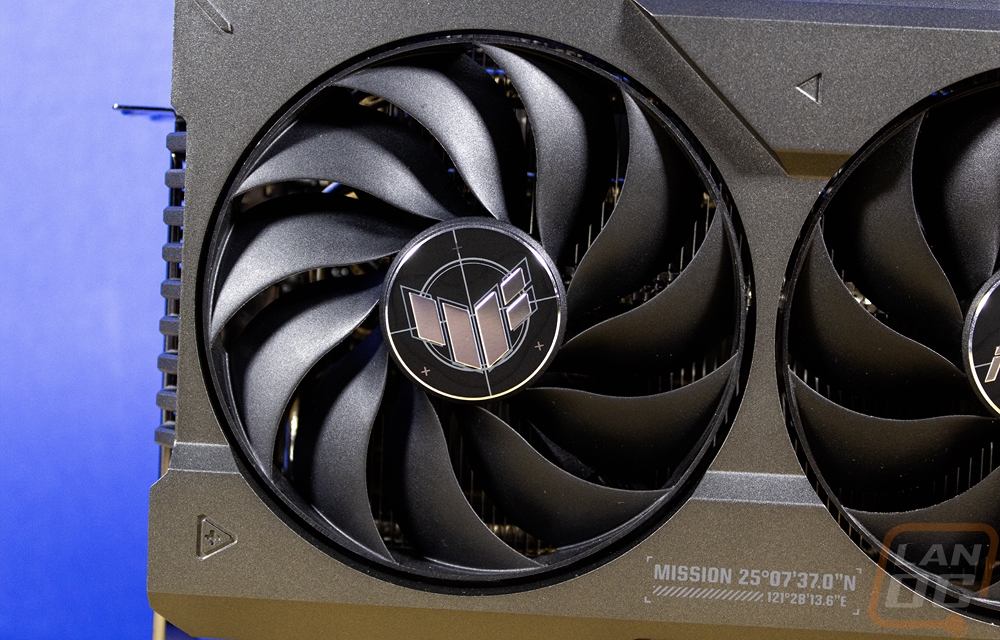
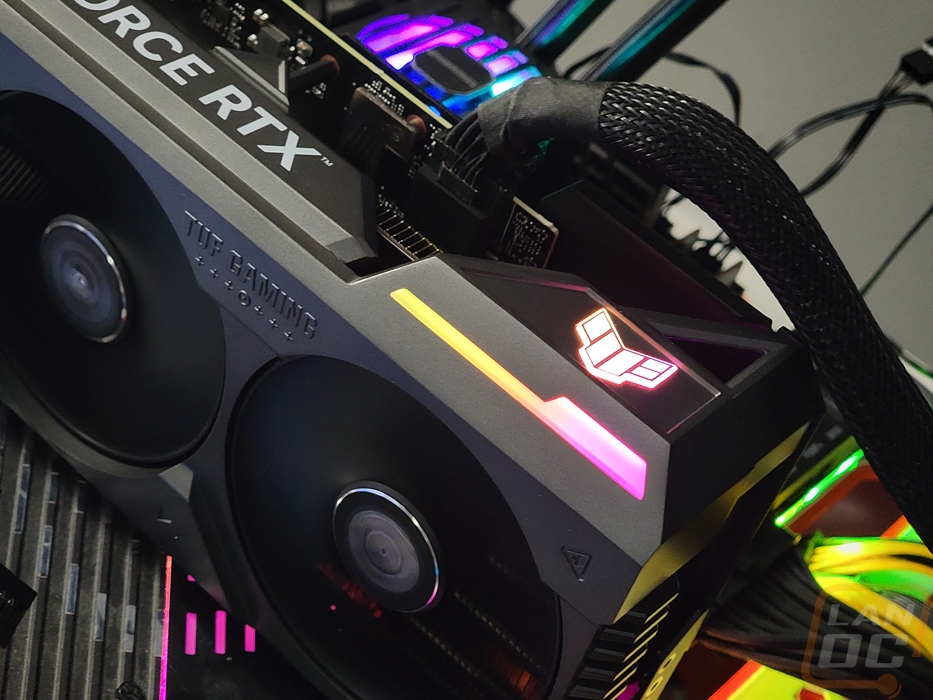
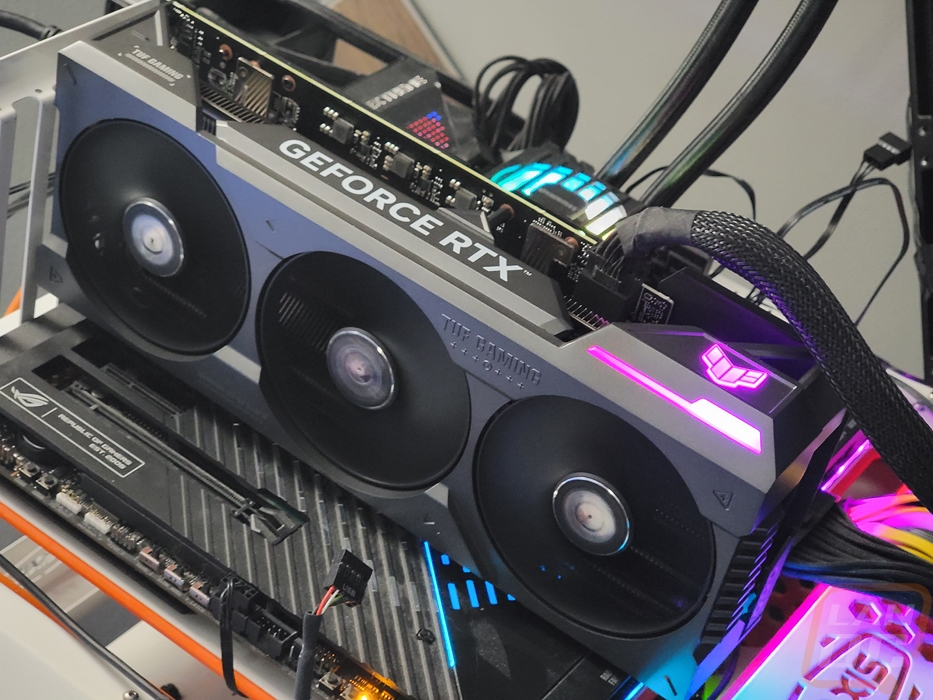
If you saw my coverage of the TUF Gaming RTX 4070 Ti last year then the design of the TUF Gaming RTX 4070 Ti SUPER isn’t going to be a surprise at all. Visually there isn’t anything different here at all. Asus’s TUF lineup sits below their overclocking-focused ROG branded cards but isn’t their budget-focused line as well. The first clue to that is the all-metal fan shroud design which they call the metal exoskeleton which is diecast similar to how Nvidia does their Founders Edition cards but with a more traditional aftermarket card styling. It has triple fans and for styling the shroud has a grey finish and a few raised sections to keep this from being just a boring flat design. They have TUF Gaming cast into the shroud as well as the TUF logo and Asus logo on the fans so you aren’t going to mistake this for any other brand.
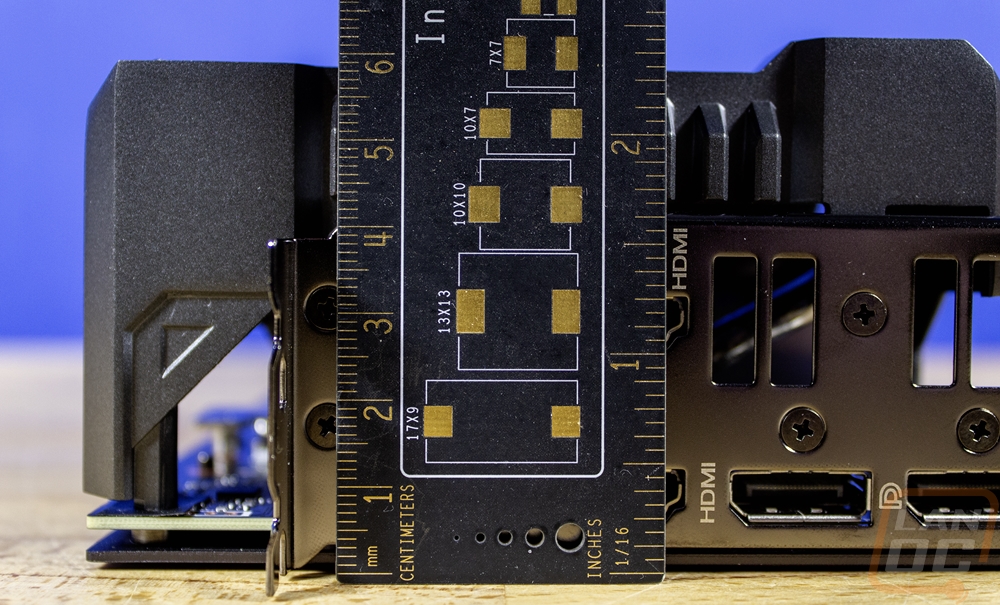
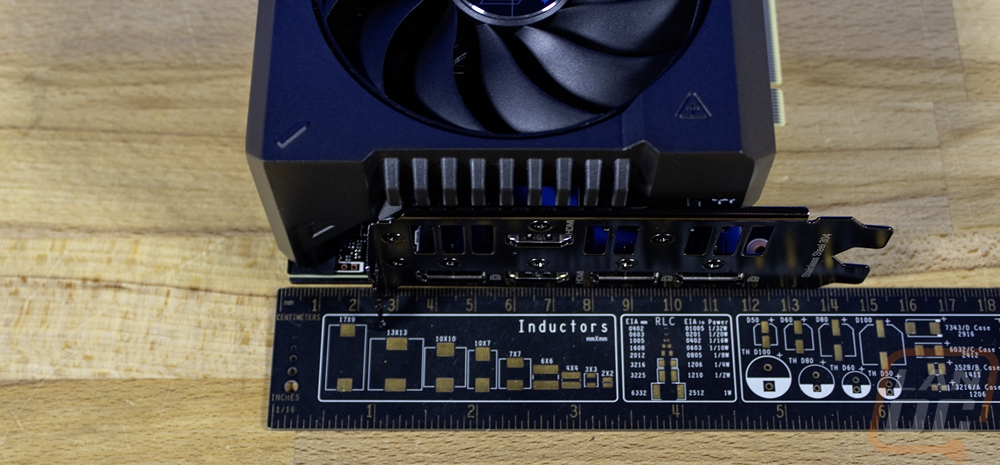
The TUF Gaming RTX 4070 Ti SUPER comes in a hair past 60 mm in thickness with one section of the fan shroud sticking out past the rest. This makes it a full 3 slot card and a hair more. Unlike the Founders Edition card that I took a look at last week, the TUF Gaming RTX 4070 Ti SUPER is also larger in height than a traditional PCI card. It has 26 mm of the card up over the top of the PCI bracket and the PCB runs all the way up there including the power connection so you will need to keep the card height in mind to make sure it will fit in your case. Especially with it having a 12VHPWR connection which doesn’t like being bent too tightly. Then for length, it is right at the end of our ruler at 300 mm in total length. Size wise this is what a top-end card would have been a few generations back but now we do still see them larger than this.
The TUF Gaming RTX 4070 Ti SUPER has three fans which are all the same 90 mm fan size but all three of the fans are not exactly the same fan. They have 11 fan blades and an outer ring that helps directly the airflow better down into the card through the sheet metal heatsink below. The center fan however spins in the opposite direction which helps with the airflow that doesn’t go down into the heatsink by keeping the fans from fighting against each other and making more noise.
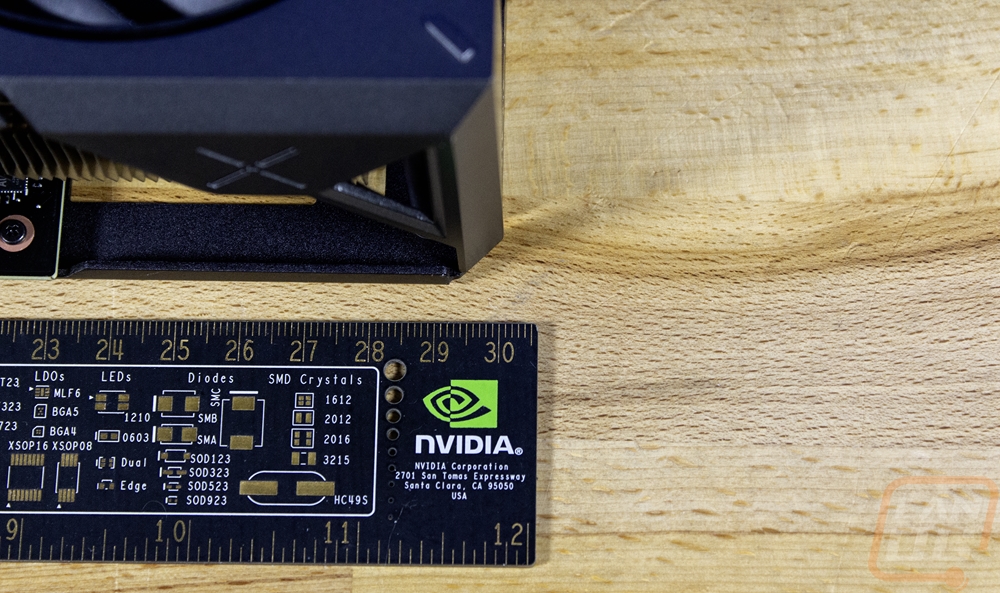
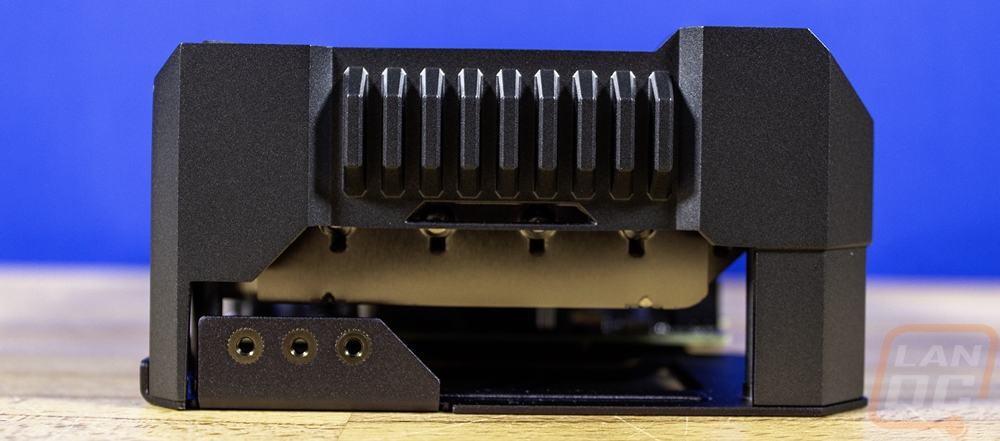
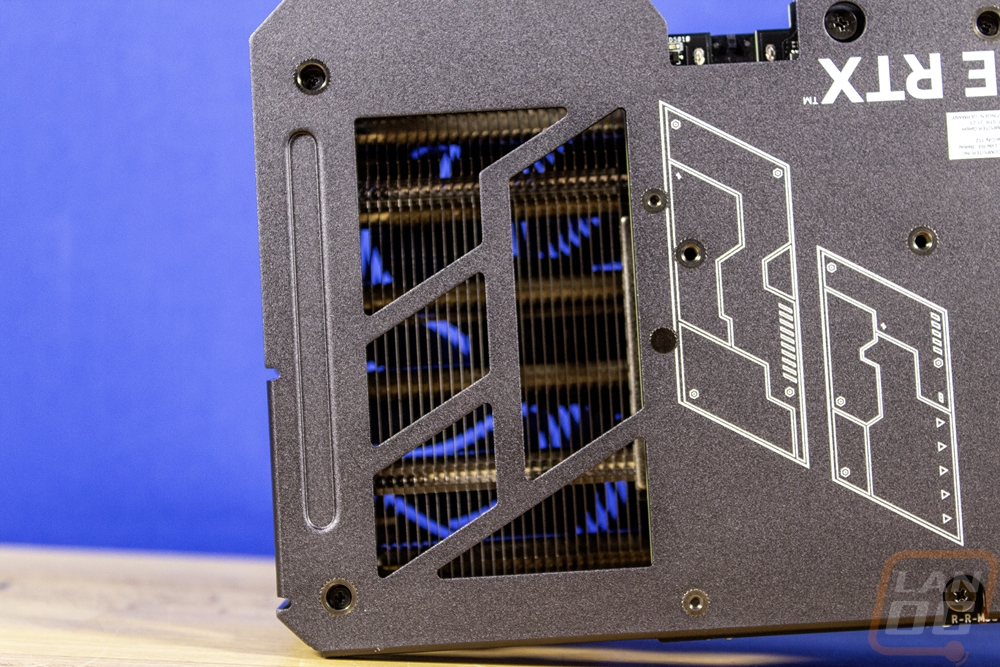
Getting a closer look around the card on the top we can see how the cast shroud wraps around but have a large open area through the middle for airflow and angled supports on the ends for additional strength. The heatsink is visible from the top including the heatpipes right on top of the heatspreader that sits on the GPU and memory. The heatpipes have the aluminum heatsink right on top of it and pull the heat out across the entire length of the card. At the end, we can see the heatsink-like fins cast into the fan shroud which is a nice TUF look, and the aluminum backplate also wraps around and gives three screw mounts for a card support bracket to attach to. The end of the card does have an opening for any extra airflow to vent out if needed but most of the air at this end will be blowing through the backplate. Then the bottom of the card has a similar design to the top of the card without the branding and plenty of room for airflow to vent out of. Being a TUF card Asus has used their “auto-extreme” tech which solders everything on the card in one pass to keep the strain down and they also glue their dies down to try to help prevent fractures in the solder which is one area where some GPUs can have an early death.
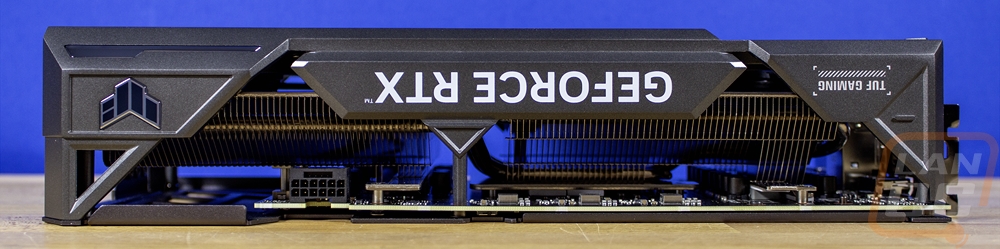
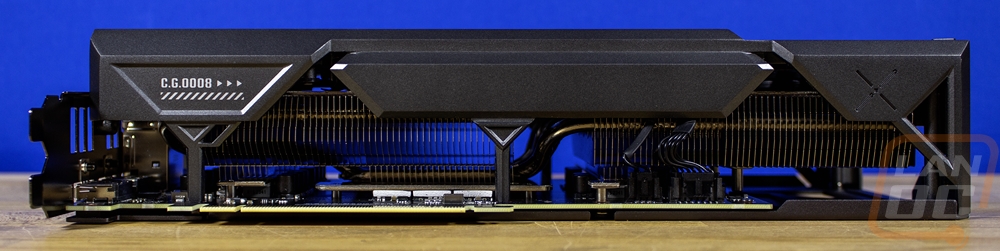
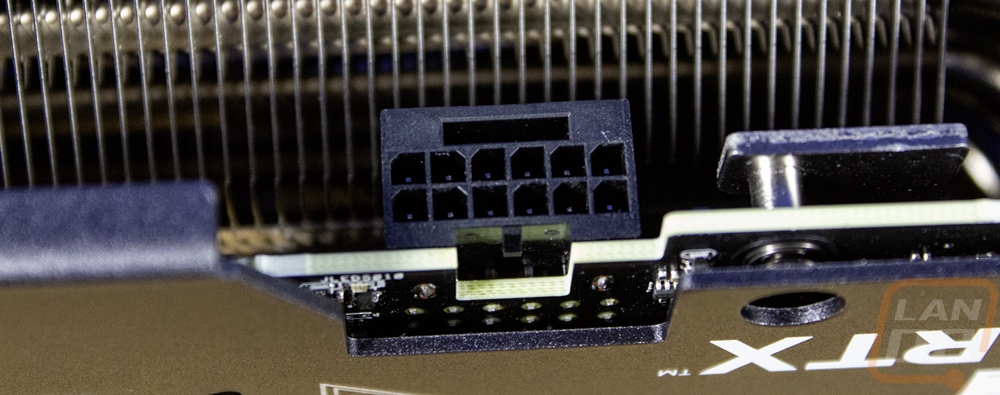
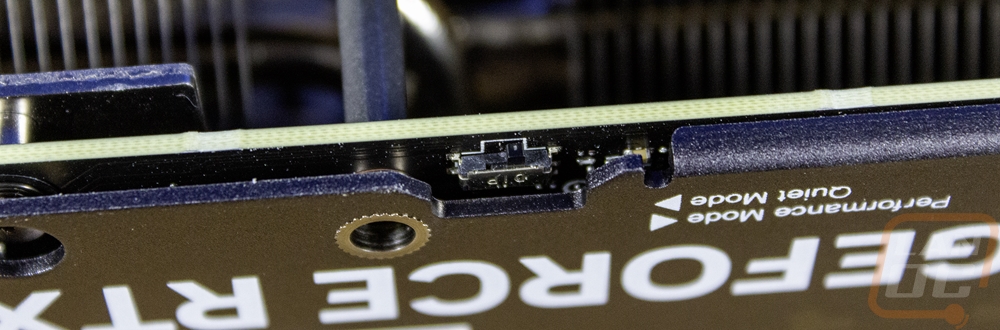
The top edge of the fan shroud is mostly open for airflow but there is a section in the middle where they have printed the Geforce RTX branding in white. Then down towards the end of the card in the blow-through area, they also have the TUF logo which has a mirrored finish and is backlit with Asus’s Aura Sync RGB lighting. Just below the logo on the angled top edge of the shroud, they also have a small accent that is also backlit as well. The end of the PCB ends before the end of the card like on most cards these days so the power connection is a little past the midway point on the top edge. The TUF Gaming RTX 4070 Ti SUPER has just one plug, a 12VHPWR power connection that you can pair with the included dual 8-pin PCIe adapter if you don’t have a newer power supply with the new power cable. Asus also has a small switch on the top edge of the PCB which is labeled on the backplate to let you know one direction is performance mode and the other is quiet mode with the card coming in performance mode.
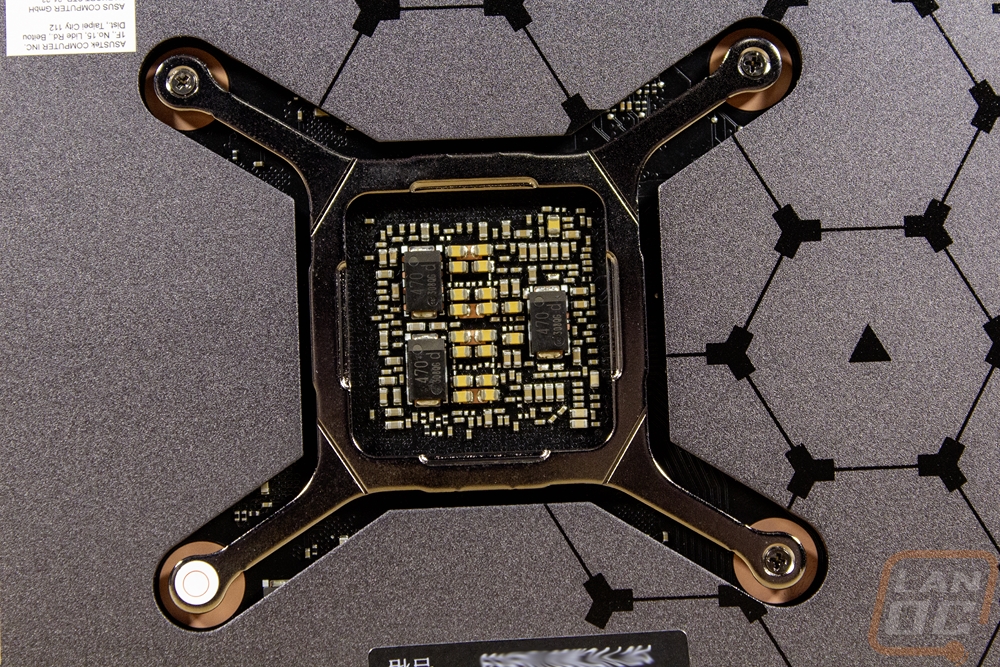
Speaking of the backplate, Asus did go with a metal backplate and it runs the full length of the card, not just to the end of the OCB. For the blow-through design, they have a cutout at the end which has the upside-down F from the TUF logo in its shape. The backplate also has some white accents including GeForce RTX printed on it again as well as a linked together design with the TUF logos in a gloss black that is a little more subtle. In the center, the backplate is cut out around the back bracket for the GPU which means the area in the middle is exposed so that will most likely be the hottest area on the card.
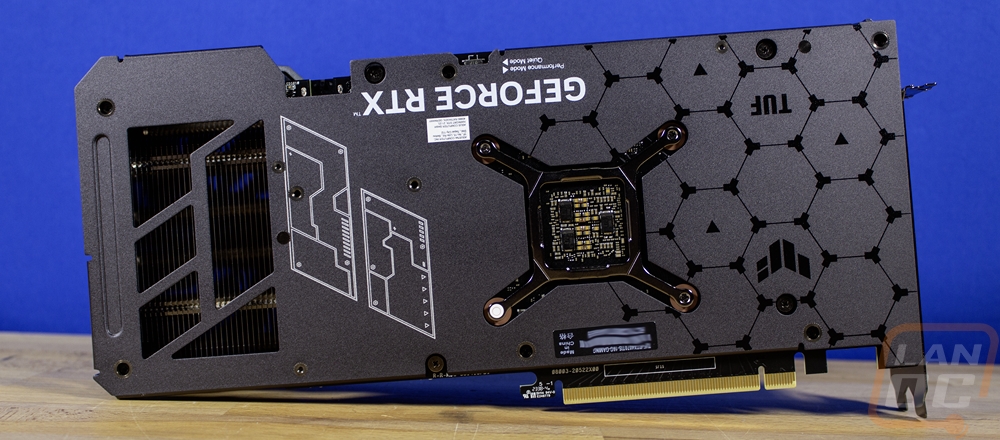
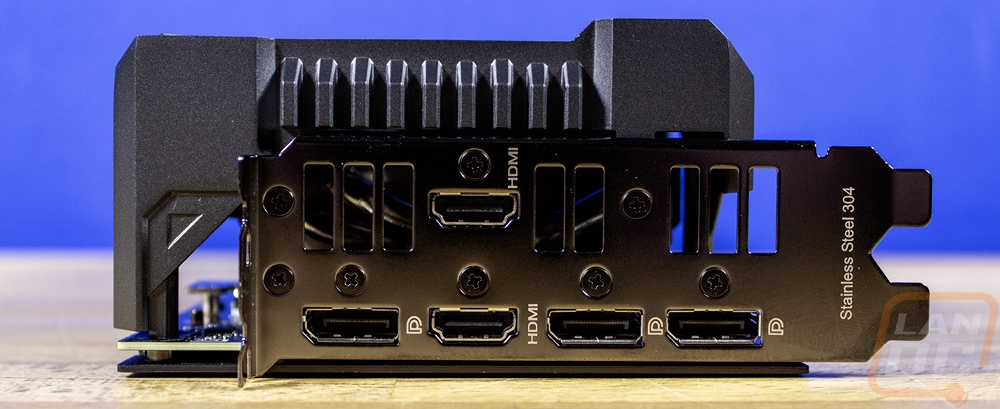
For display connections, the TUF Gaming RTX 4070 Ti SUPER does have the standard three DisplayPort and one HDMI layout across the bottom row but Asus has added in a second HDMI as well up in the top section giving two HDMI connections in total. This is one more than Nvidia’s RTX 4070 Ti SUPER specifications list but is in line with what I saw on the TUF RTX 4070 Ti. The backplate has vent holes on both sides of that second HDMI port and a tinted finish. I would still prefer a full black finish which would match up better with the rest of the card and with a lot of cases. I do like that they have labeled each of the connections for anyone who doesn’t know the difference by looking at the port.
Before getting into testing I did want to check out the lighting on the TUF Gaming RTX 4070 Ti SUPER. Asus has kept things simple with just the one accent on the front of the fan shroud down at the end as well as the backlit TUF Gaming logo on the top edge. I’m never a big fan of backlit branding but this isn’t too over the top, especially with the one accent bar mixed in. I wouldn’t mind there being a little more lighting like the accent bar on the left side of the fan shroud as well though.
Test Rig and Procedures
Test System
CPU: Intel Core-i9 13900K – Live Pricing
PL1=PL2: 253, τ: 56 / 307A
Motherboard: Asus Z790 Extreme – Live Pricing
Cooling: Corsair H100i Elite LCD Display - Live Pricing
Noctua NT-H1 Thermal Paste - Live Pricing
Memory: Crucial 32GB Kit (2 x 16GB) DDR5-5600 UDIMM– Live Pricing
Storage: Sabrent Rocket Q4 2TB – Live Pricing
Power Supply: be quiet! Dark Power Pro 13 1600W- Live Pricing
Case: Primochill Wetbench - Live Pricing
OS: Windows 11 Pro 64-bit - Live Pricing
|
Our Testing Procedures |
|
|
3DMark |
All 3DMark-based tests are done using the most recent version. We test using all three versions of Fire Strike, Both Time Spy and Time Spy Extreme, and Speed Way. Tests to look at ray tracing performance are done with Port Royal when supported and for Nvidia cards that support DLSS, the DLSS subtest is also done at 1440p with the performance setting and DLSS 2.0 as well as a look at DLSS 1, 2, and 3 at 4K. |
|
Unigine Superposition |
1080p Extreme and 4k Optimized benchmarks along with the VR Future test are done. The VR test is done at the Oculus resolution |
|
VRMark |
Only the Blue room test is run |
|
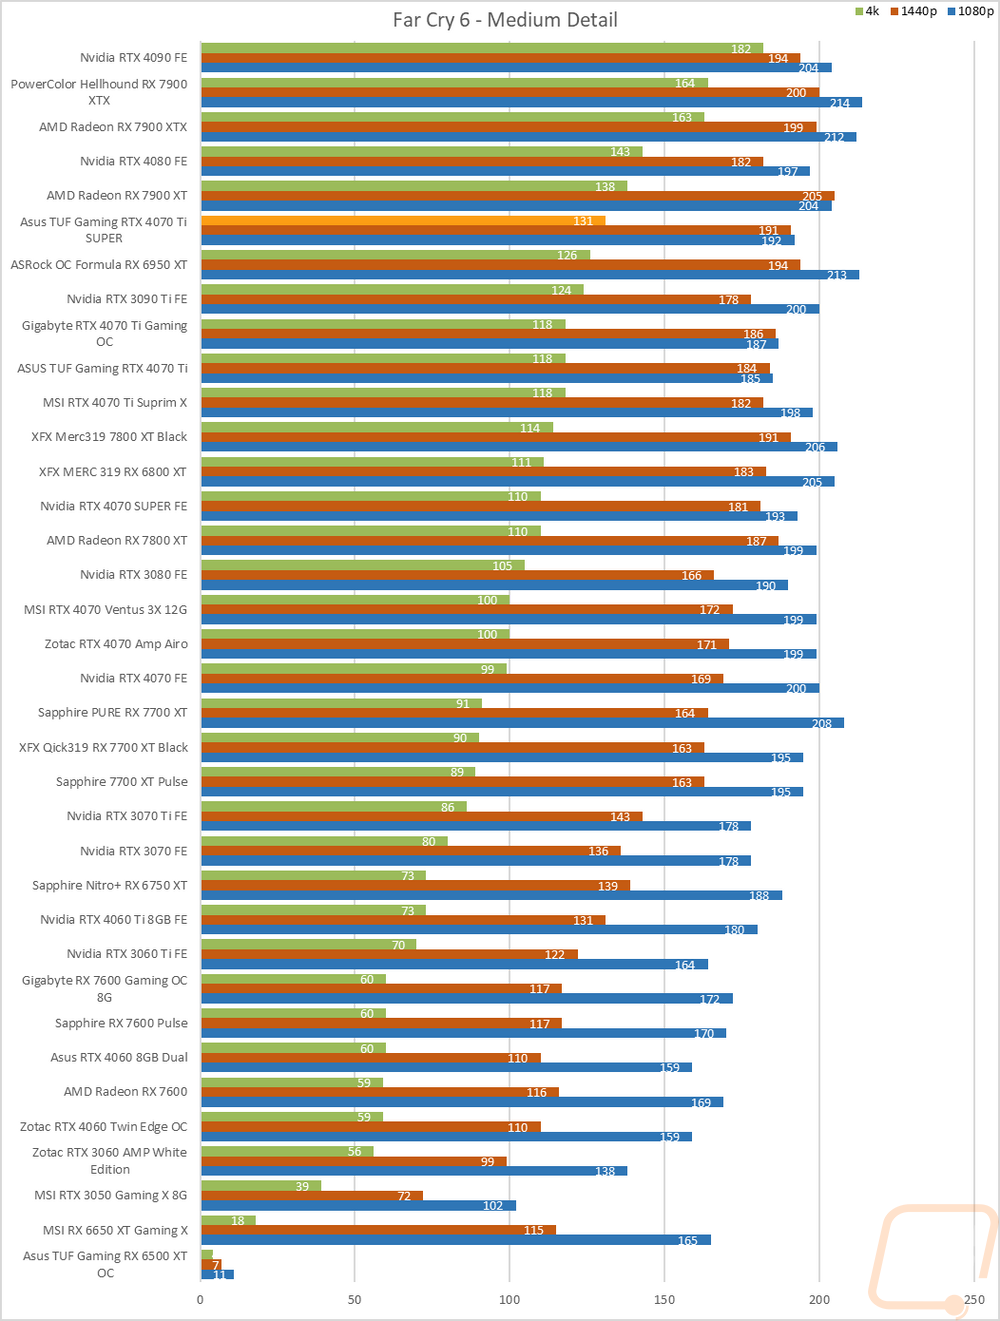
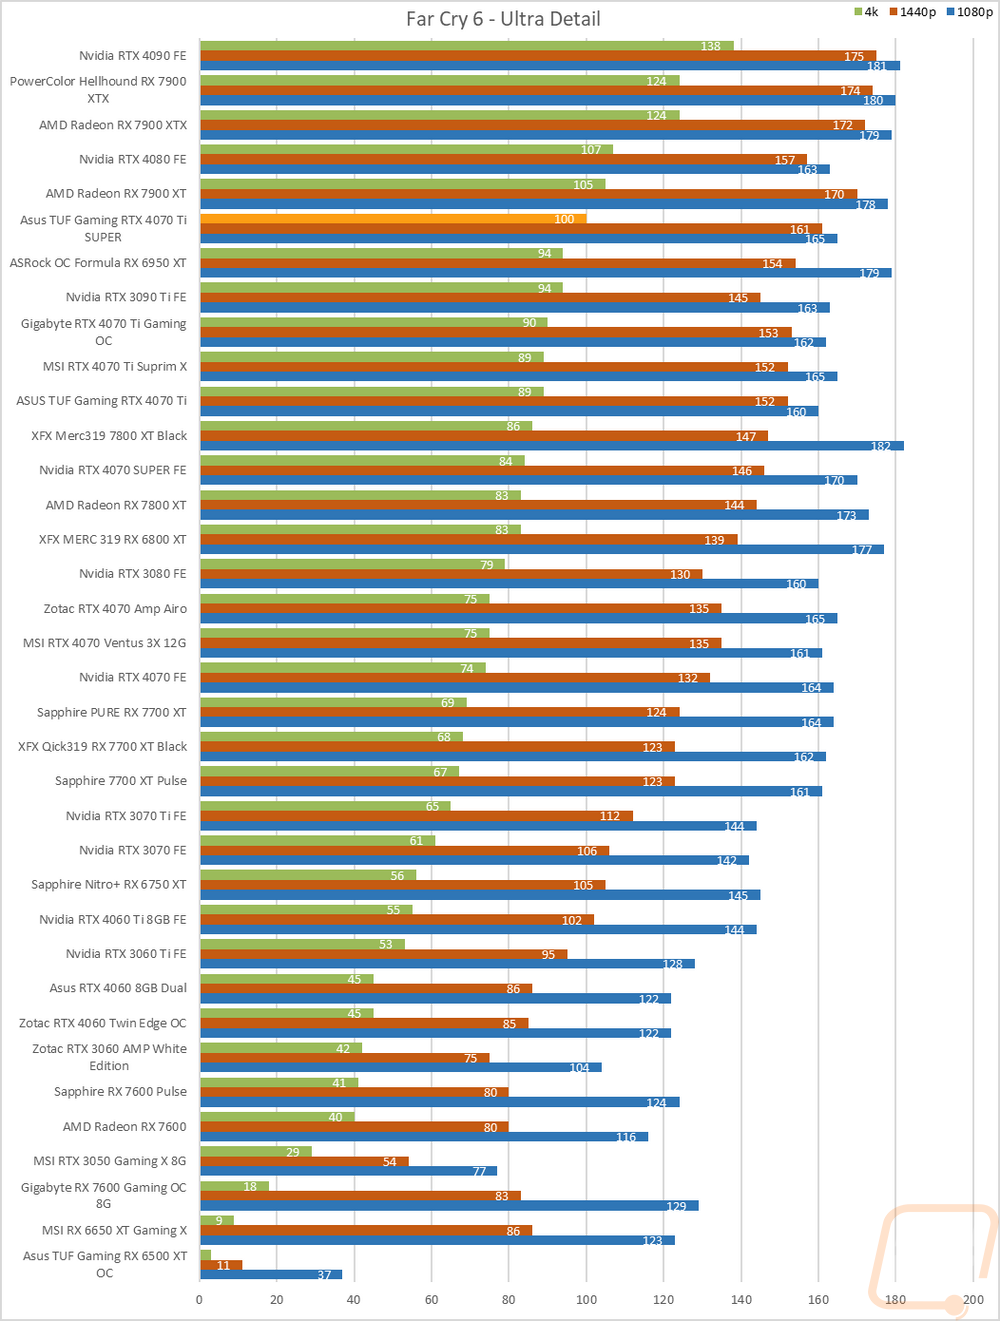
Far Cry 6 |
Built-in benchmark tested at 1080p, 1440p, and 4k with the Ultra and Medium detail settings |
|
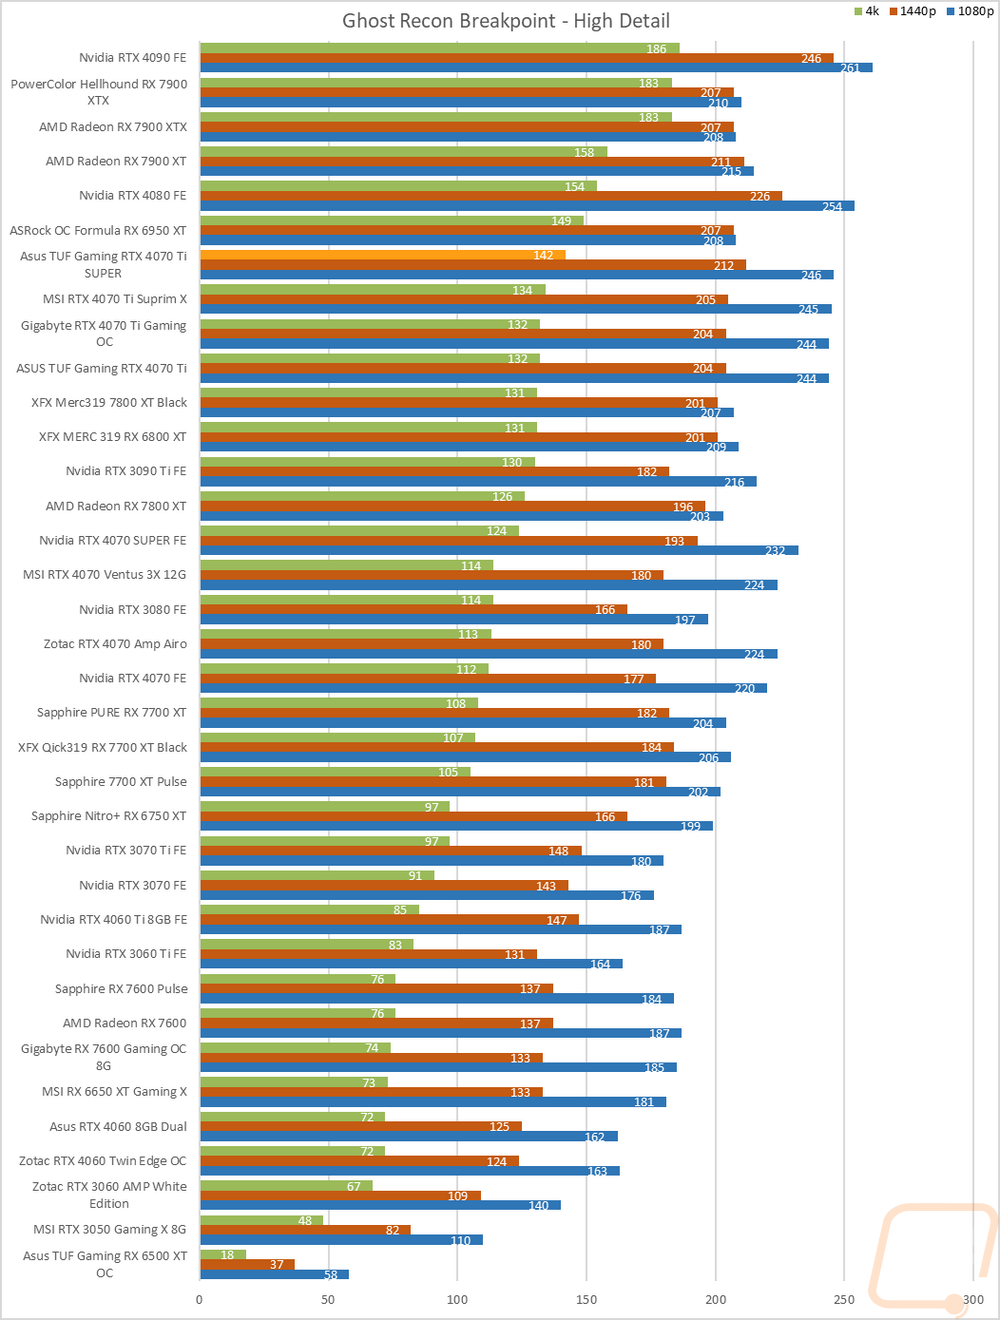
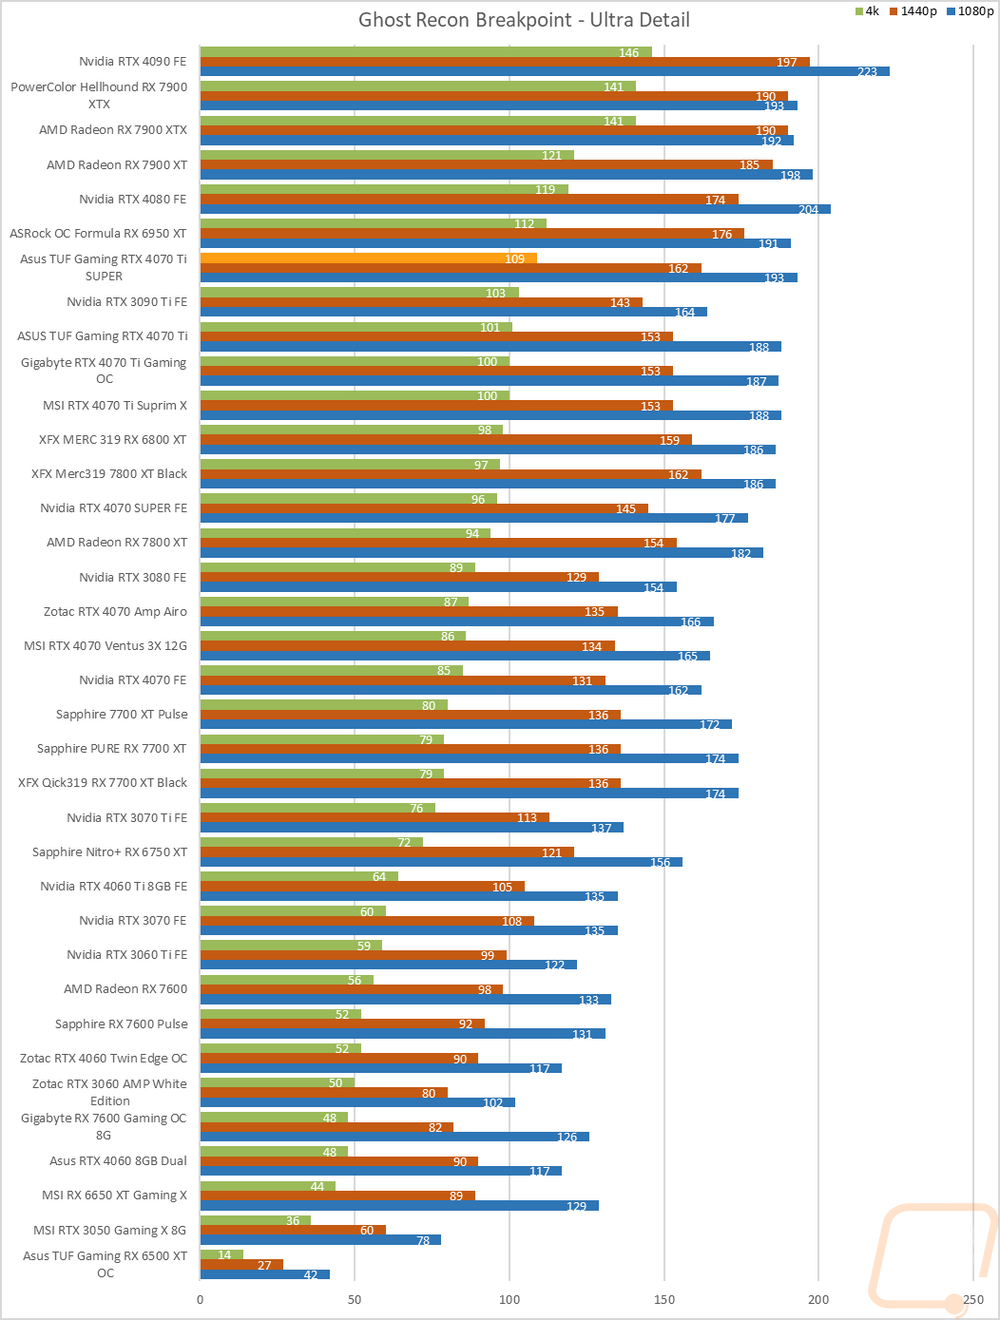
Ghost Recon Breakpoint |
Built-in benchmark tested at 1080p, 1440p, and 4k with the Ultra and Medium detail settings. Texture quality always set to high |
|
Watch Dogs: Legion |
Built-in benchmark testing at ultra and high details. Tested at 1080p, 1440p, and 4k. I also do RTX and DLSS testing on Nvidia cards at 4K using the Ultra detail settings as a base as well. |
|
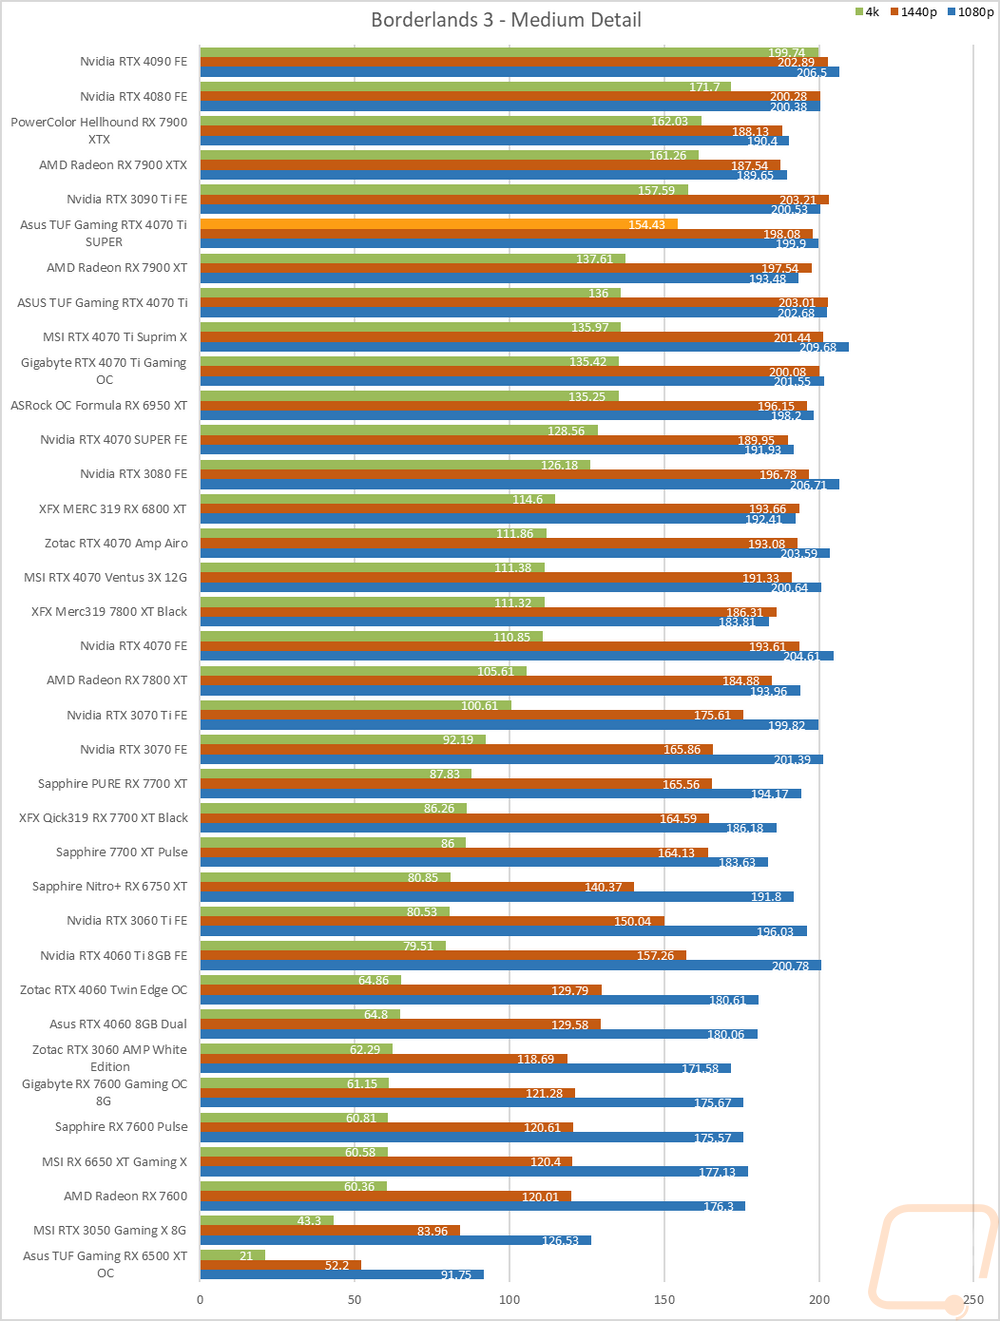
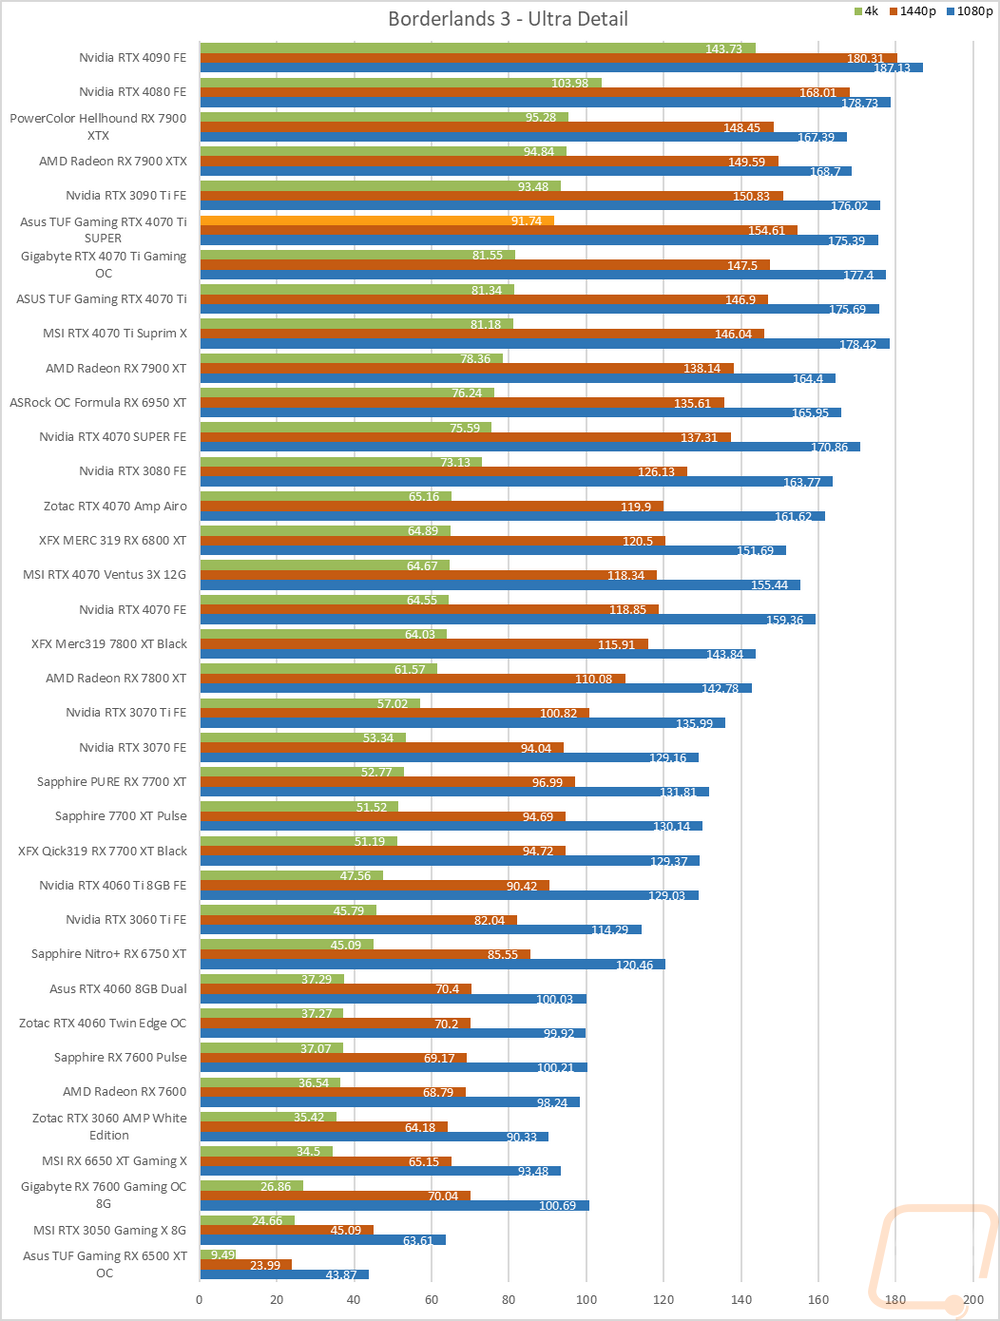
Borderlands 3 |
Built-in benchmark testing with the ultra detail setting and medium detail setting, done at full screen with default settings at 1080p, 1440p, and 4k on DX11 |
|
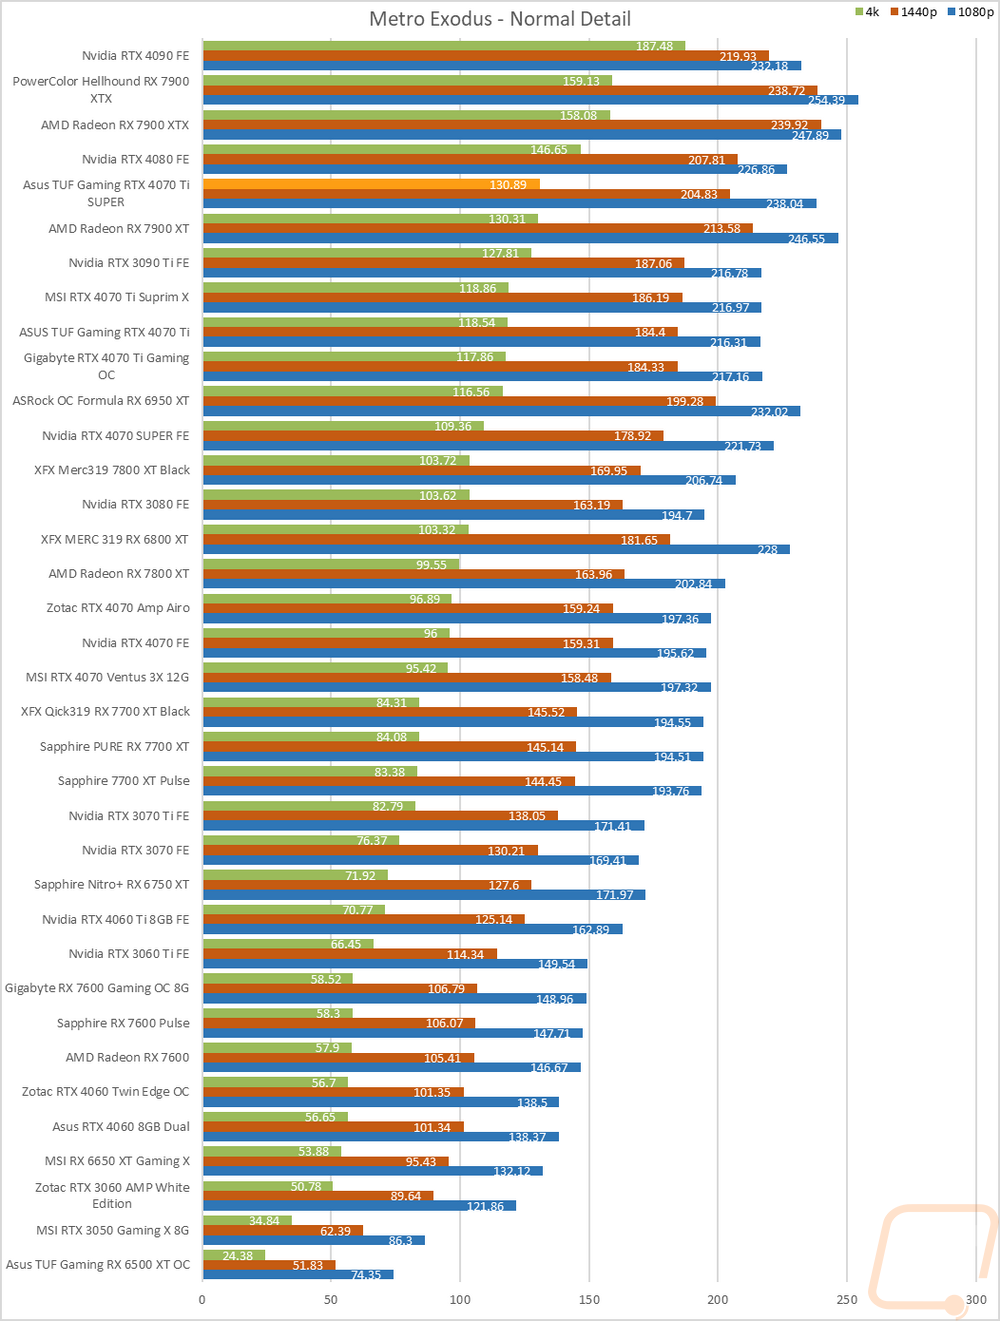
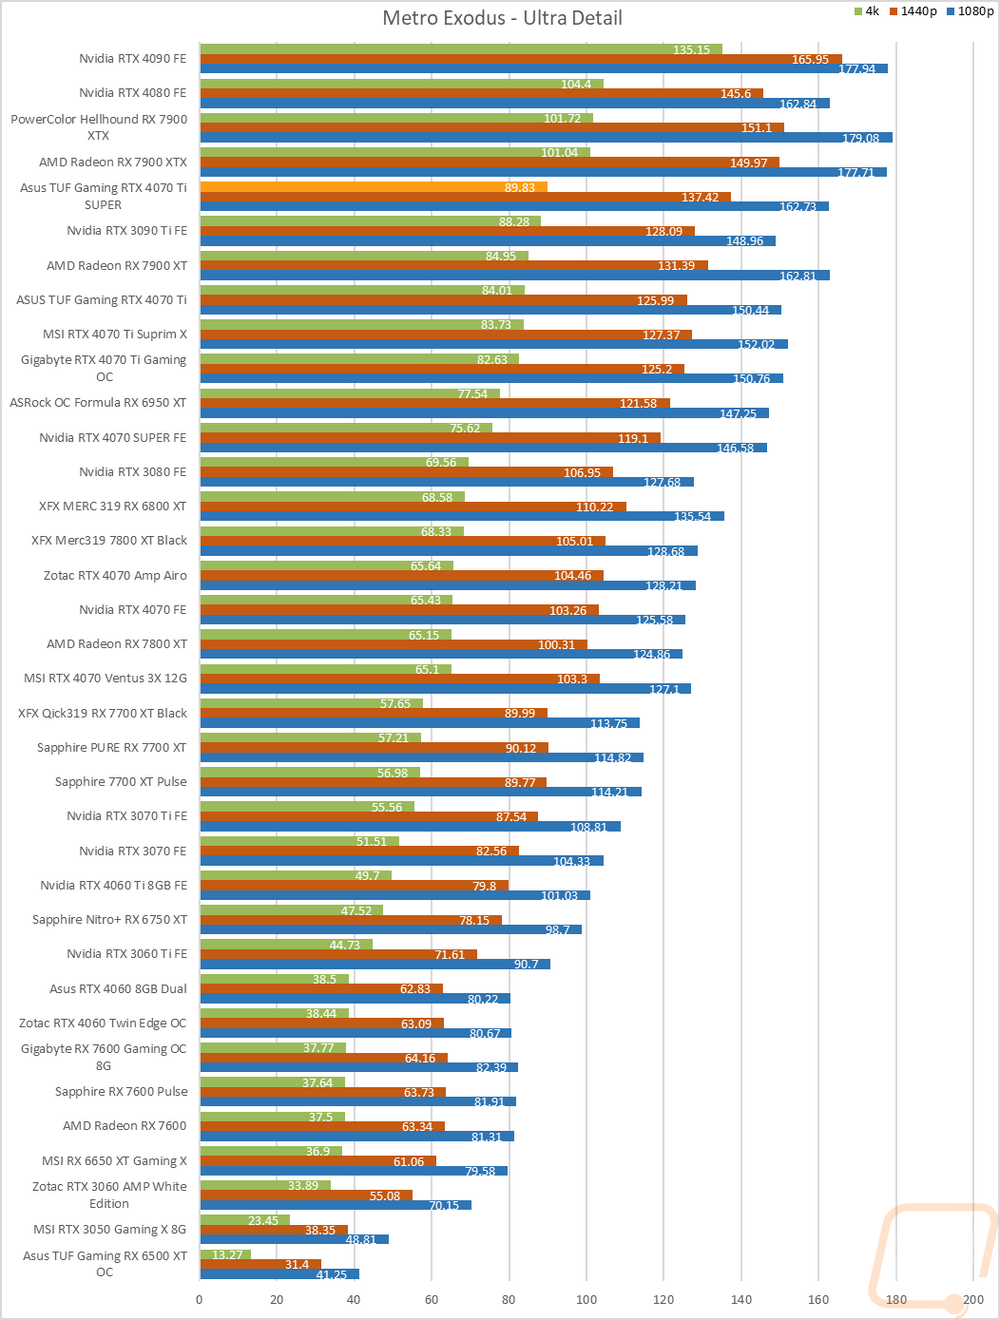
Metro Exodus |
Using built-in benchmark, testing at ultra and normal details at 1080p, 1440p, and 4k. I also do RTX and DLSS testing at 4K with the ultra-detail base settings for Nvidia cards as well. |
|
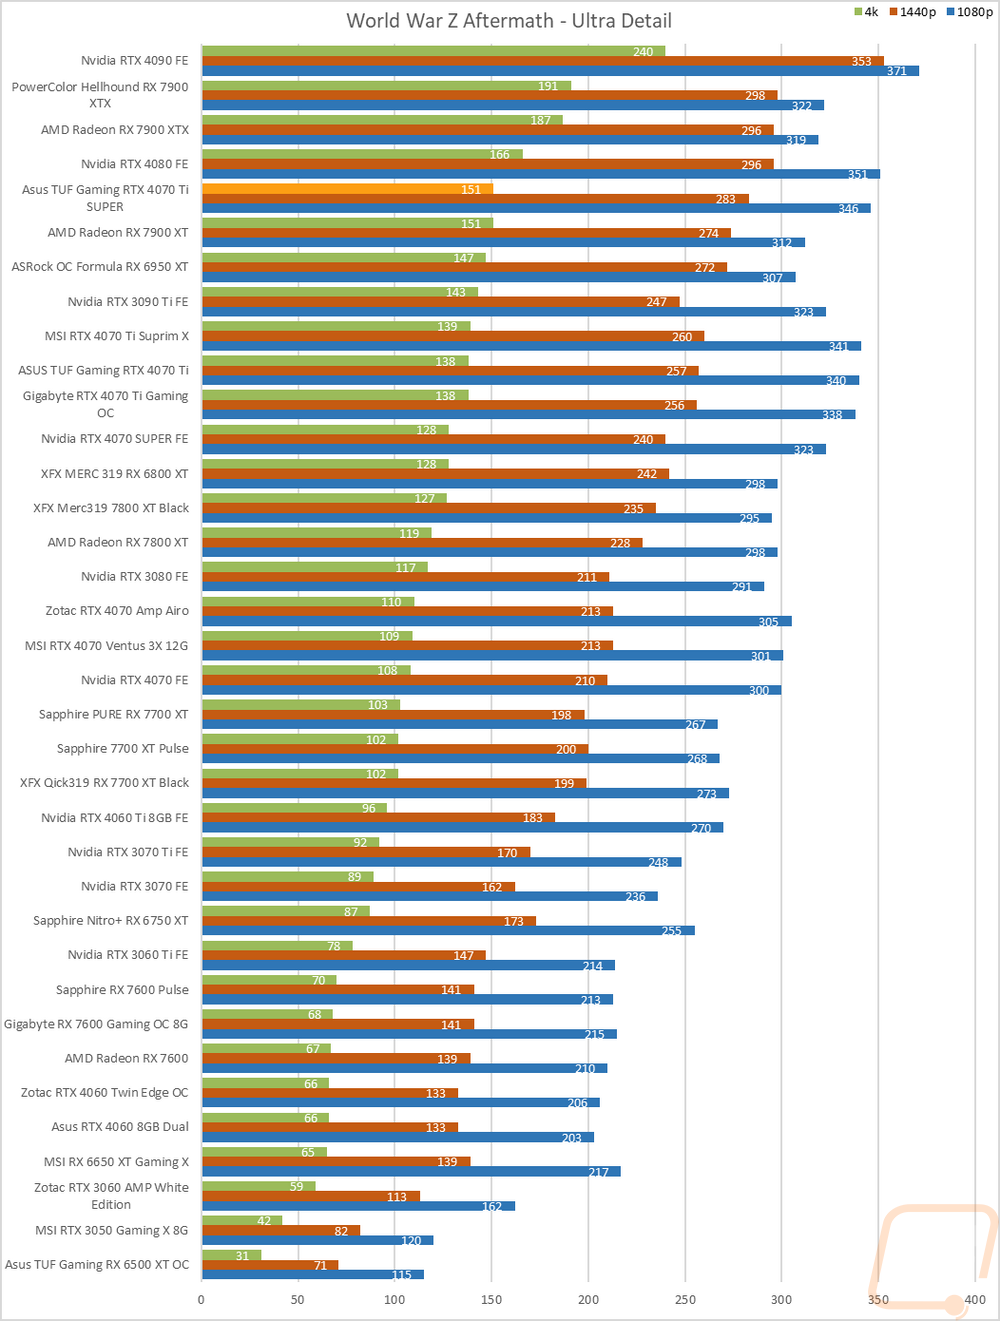
World War Z Aftermath |
Built-in benchmark in DX11 testing both the Ultra detail and Medium detail levels at 1080p, 1440p, and 4K resolutions |
|
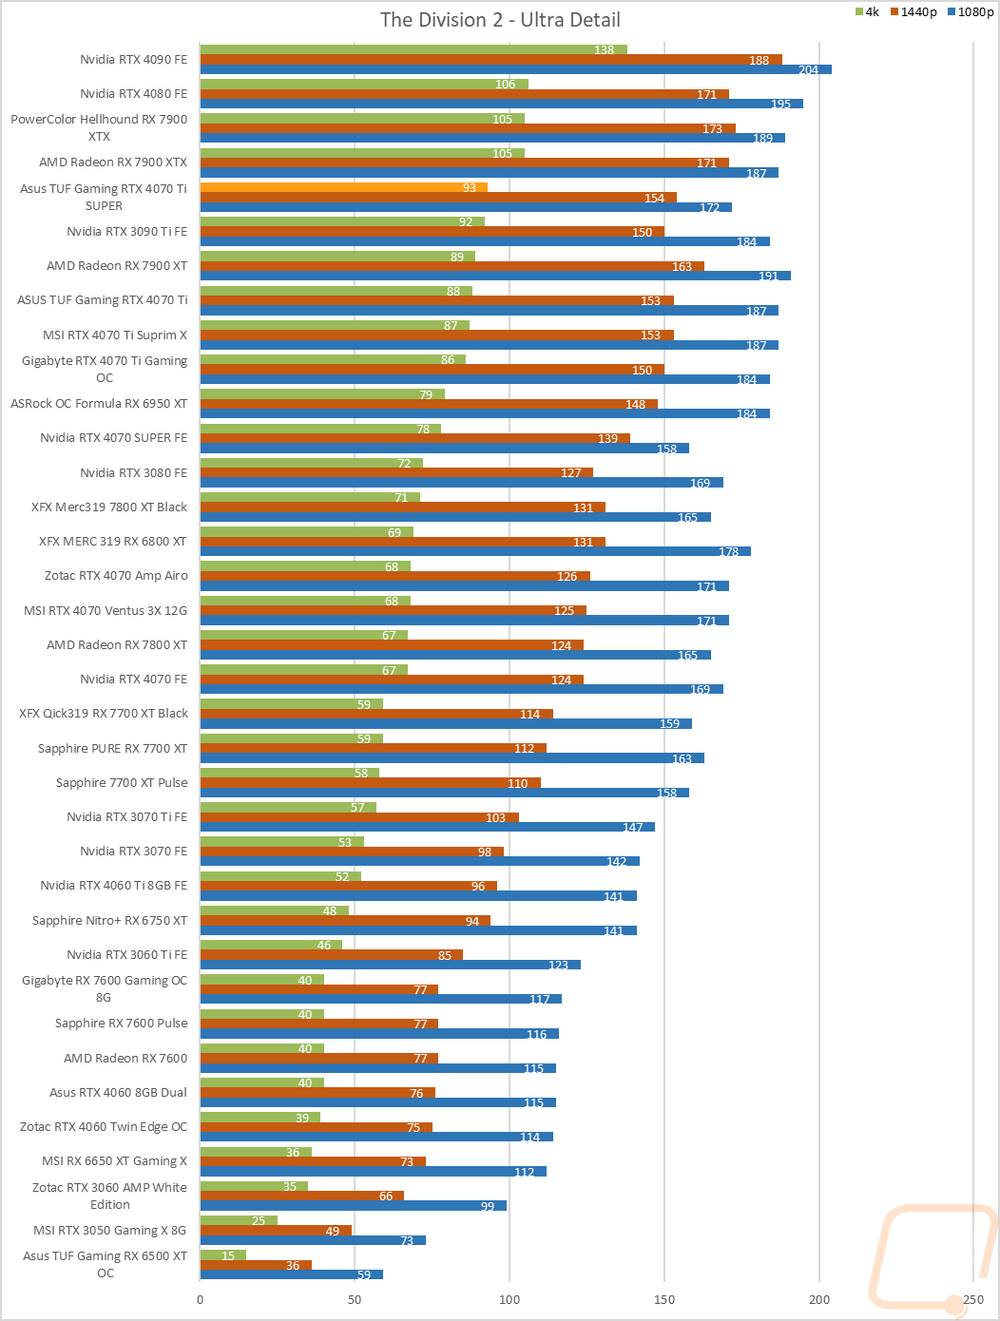
The Division 2 |
Built-in benchmark at Ultra detail with V-Sync turned off at 1080p, 1440p, and 4k resolutions. |
|
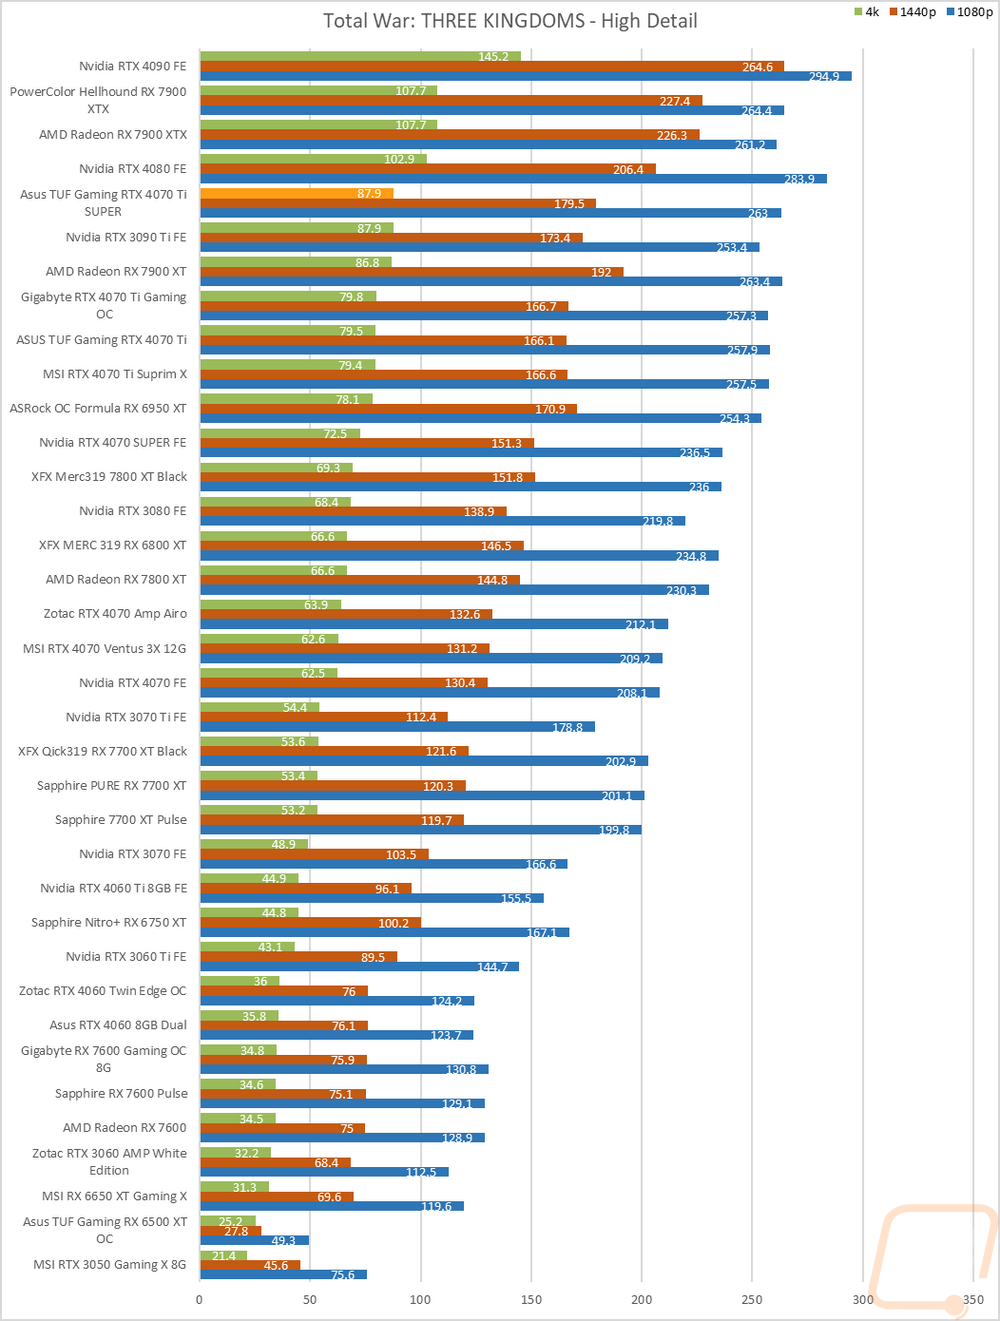
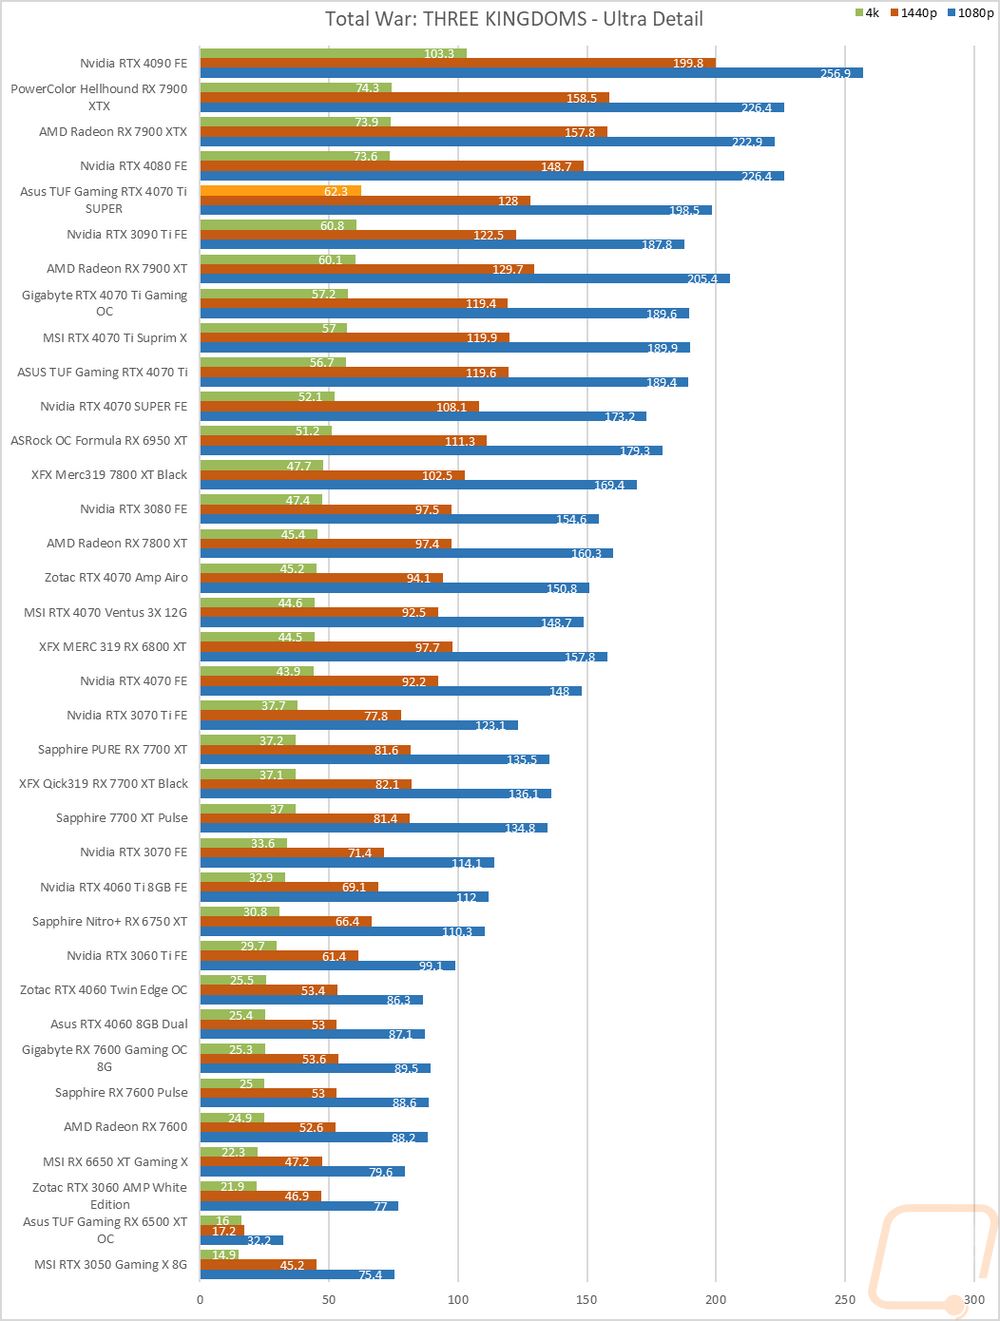
Total War: Three Kingdoms |
Built-in benchmark using the Battle Benchmark setting. Tested at 1080p, 1440p, and 4k at both high and ultra detail settings |
|
OctaneBench 2020.1 |
OctaneBench is designed to test rendering in OctaneRender. RTX and non-RTX are both ran. This is a CUDA-only test so only Nvidia cards are tested |
|
V-Ray 5 |
V-Ray 5 benchmark us run with CUDA and RTX settings on cards that support it |
|
Boundary Benchmark |
Testing different DLSS detail levels on cards that support it. All testing is done at 4k with RTX on |
|
Bright Memory Infinite RTX Benchmark |
Benchmark all of the different RTX detail levels. Resolution at 4k and DLSS on balanced for each test |
|
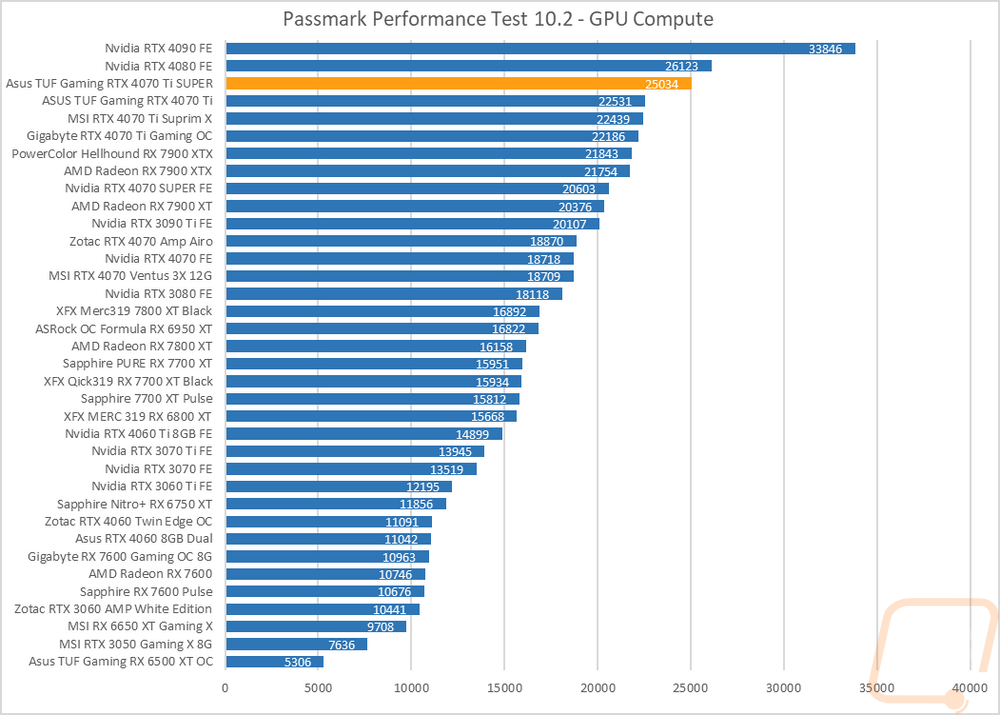
Passmark Performance Test 10.2 |
Test using the GPU Compute Score inside of PassMark's Performance Test 10.2 |
|
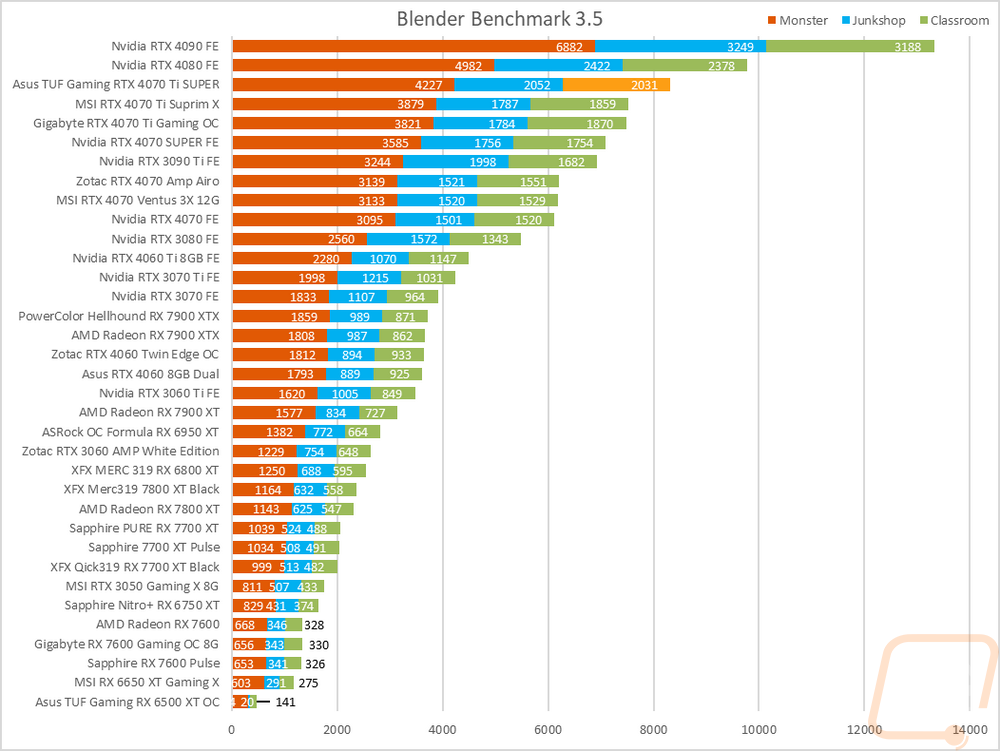
Blender |
Using the standard Blender Benchmark I run the test using the Blender 3.4 setting which tests using the Monster, Junkshop, and Classroom tests. |
|
Temperature Testing |
Using AIDA64, the GPU stress test is run for 30 minutes or until the result has leveled off. The test is run twice, once with the stock fan profile and a second time with 100% fan speed. During this, I also document the 100% fan speed RPM and document the delta between the fan profile and 100% fan speed as well as get thermal images. |
|
Power Testing |
Using a PCat v2 to monitor power between the PCIe slot and the card as well as power through the power cables I test the peak power when running ADIA64, 3DMark Speed Way, 3DMark Time Spy Extreme, FarCry 6 at 4k and Ultra Detail, Watch Dogs Legion at 4K and Ultra detail, and Blender 3.4.0. The results are then averaged as well as the highest result. |
|
Noise Testing |
Our Noise testing is done using a decibel meter 18 inches away from the video card on the bottom/fan side of the card. We test at 50% and 100% fan speeds as well as a third test while under load using AIDA64's stress test. This is done using a Protmex PT02 Sound Meter that is rated IEC651 type 2 and ANSI S1.4 type 2. Tests are done set weighted to A and set to a slow response using the max function. The ambient noise level in the testing area is 33.3 decibels. |
Synthetic Benchmarks
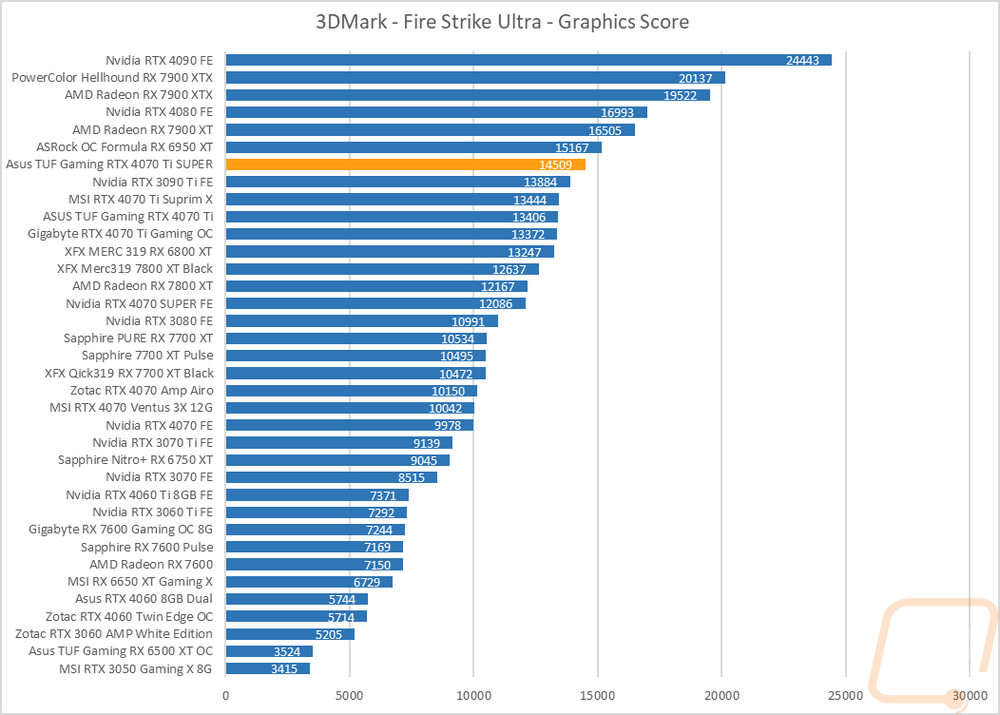
As always I like to start my testing with a few synthetic benchmarks. 3DMark especially is one of my favorites because it is very optimized in both Nvidia and AMD drivers. It's nice to not have to worry about it being favored too much either way and the repeatability of the results makes it a nice chance to compare from card to card, especially when comparing with the same GPU. For the TUF Gaming RTX 4070 Ti SUPER, this is our first look at an RTX 4070 Ti SUPER but my main focus when comparing with other Nvidia cards will be seeing how the new card compares to the RTX 4070 Ti that it is replacing, the new RTX 4070 SUPER, and the RTX 4080 and then from AMD I want to see how it compares to the RX 7900 XT.
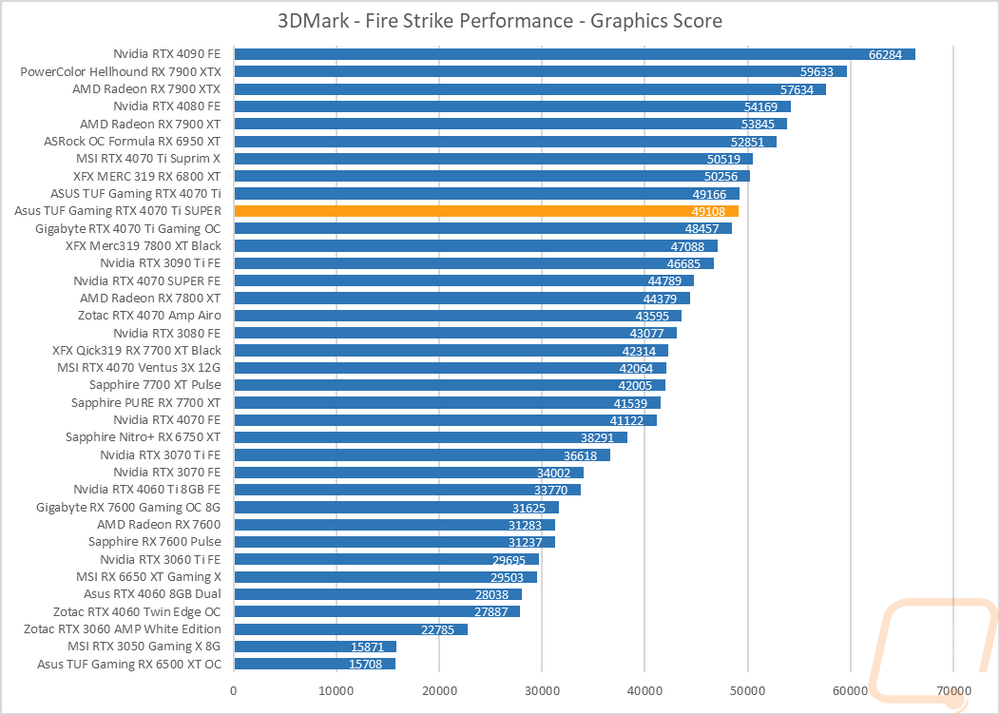
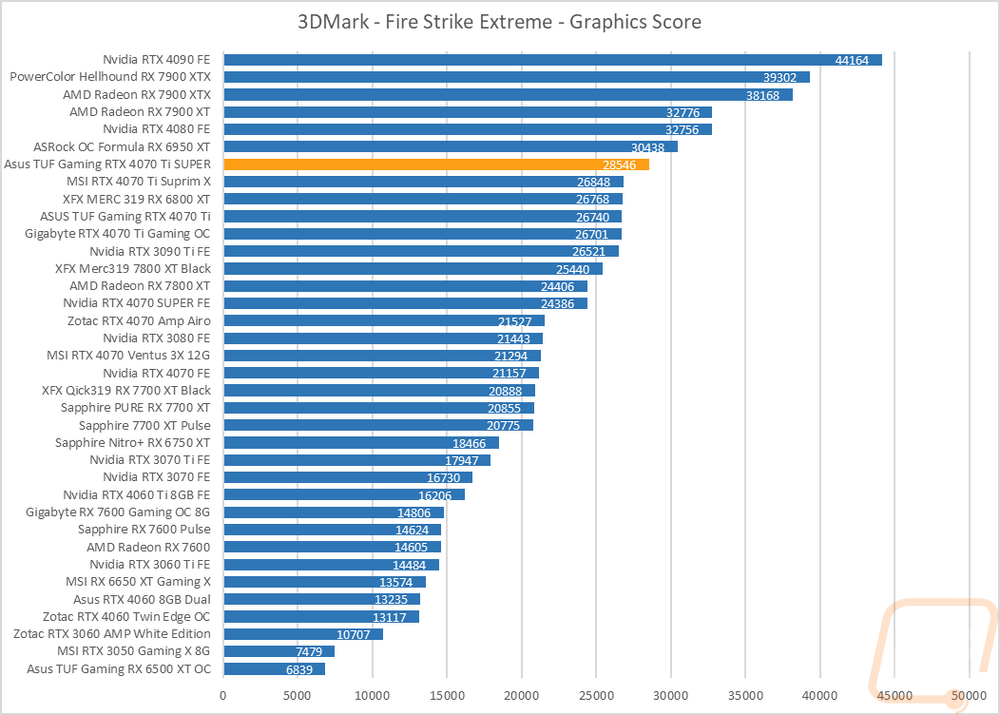
The first round of tests were done in the older Fire Strike benchmark which is a DX11 test. There are three detail levels, performance, extreme, and ultra. The TUF Gaming RTX 4070 Ti SUPER, like the other 4000 Series cards, is a little behind in these tests compared to what AMD has going on with the 6800 XT even outperforming the TUF Gaming RTX 4070 Ti SUPER in the base Fire Strike and the 6950 XT being ahead in the other two. I was surprised that in the base Fire Strike, the TUF Gaming RTX 4070 Ti SUPER also is basically tied with the original RTX 4070 Ti as well but it did pull ahead in the Extreme and Ultra tests.
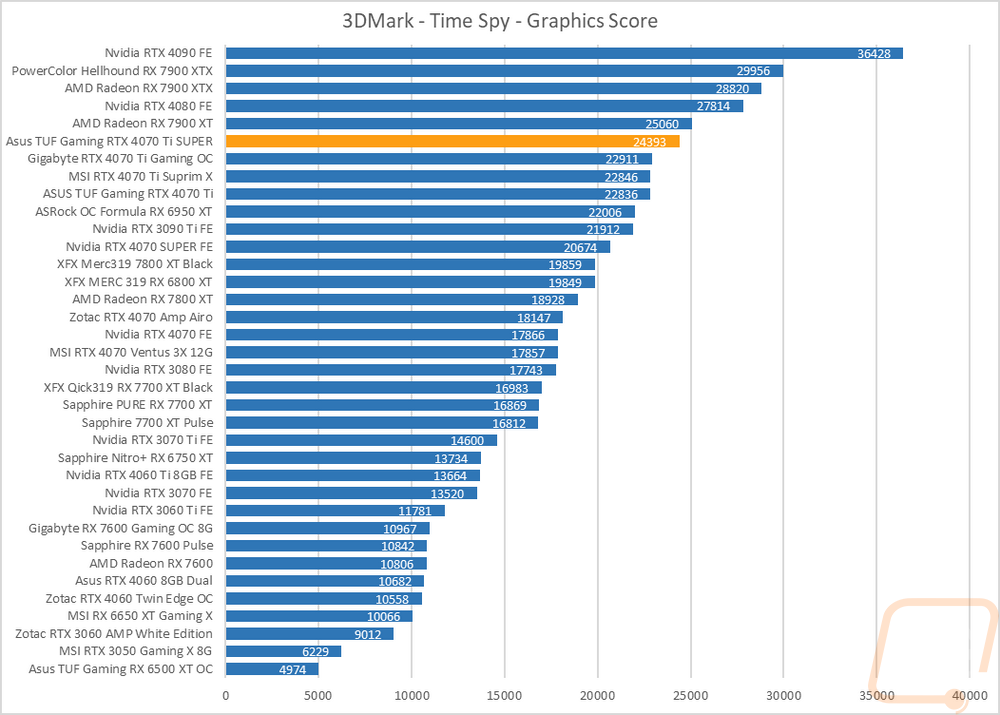
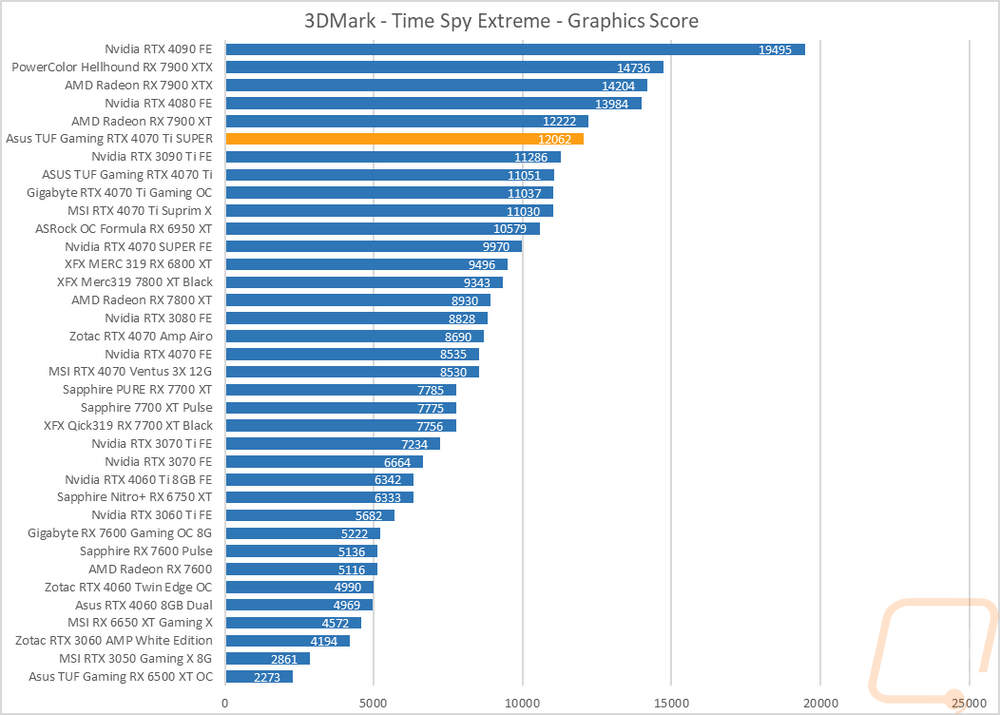
The next two were both based on the Time Spy benchmark. One is the standard test and then there is the extreme detail level. The Time Spy tests favor the Nvidia cards more when compared to the Fire Strike results and here in the base Time Spy the TUF Gaming RTX 4070 Ti SUPER is running with but still behind the RX 7900 XT in both tests. It improved on the original TUF RTX 4070 Ti by 6.8% in the base Time Spy and 9.1% in Time Spy Extreme which helped close the gap on the 7900 XT but wasn’t enough to surpass it.
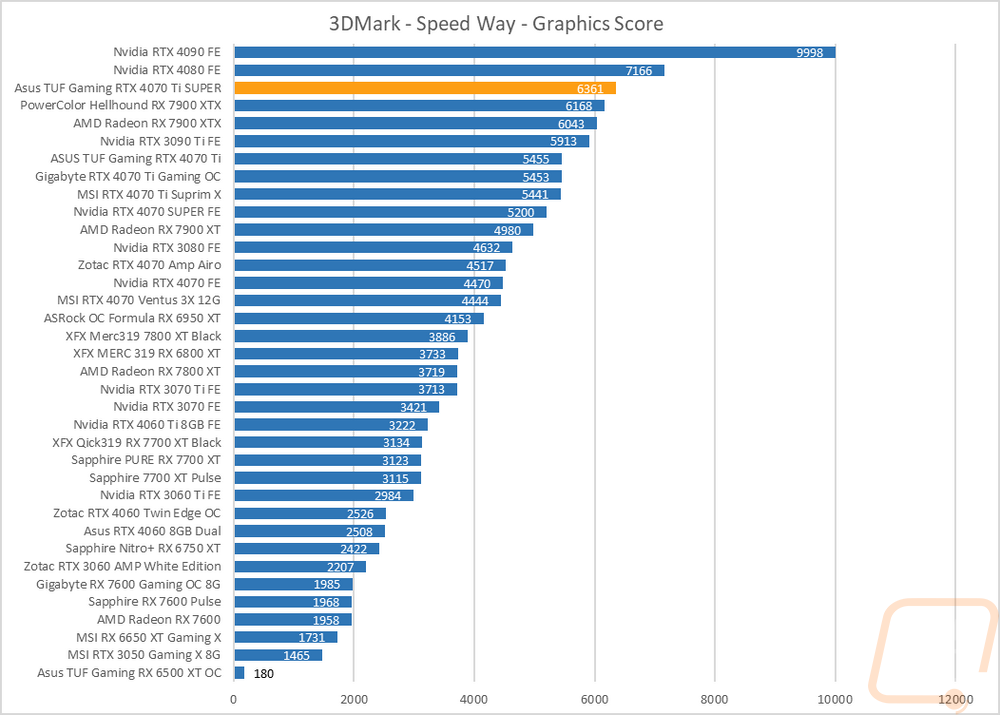
I did also test using the new 3DMark Speed Way which is their latest benchmark. Speed Way is DX12 as well but combines more future-focused tech like Ray Tracing which up until now 3DMark has only used in feature tests. Here the TUF Gaming RTX 4070 Ti SUPER outperformed even the RX 7900 XTX and is way out in front of the RX 7900 XT, outperforming it by 27.7%. The RTX 4080 is still 12.6% ahead of the TUF Gaming RTX 4070 Ti SUPER however showing that the 15% larger core count does mean something.
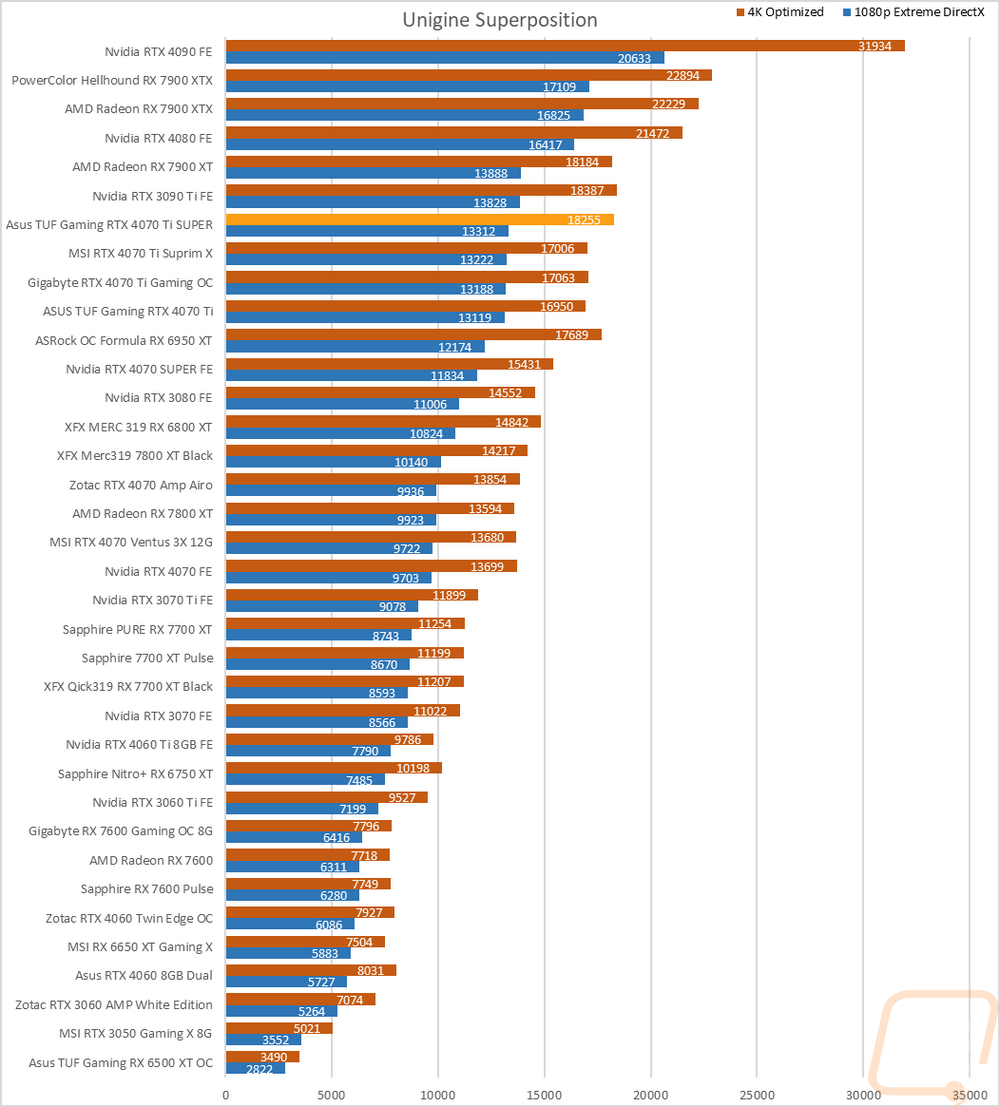
The last test was using the Unigine-based Superposition benchmark and I tested at 1080p with the extreme detail setting as well as the 4K optimized setting. In the extreme detail setting which is what I have this graph sorted as the TUF Gaming RTX 4070 Ti SUPER is sitting behind the RTX 3090 Ti and RX 7900 XT which are nearly tied and ahead of the overclocked RTX 4070 Ti’s that were previously tested with a small improvement. The 4K optimize test does a better job of showing the performance improvement including surpassing the RX 7900 XT.
VR Benchmarks
As for Virtual Reality, I love it but it is more demanding than traditional gaming. This is partially because of the resolutions needed to render for two eyes and because they render more than what is immediately visible. But also because of post effects to get the proper “fisheye” effect for it to look proper in your eyes with the HMD. You also have to have much higher expectations for frame rates in VR, skipping frames or lower FPS can cause motion sickness in VR. Because of that, I ran a few tests.
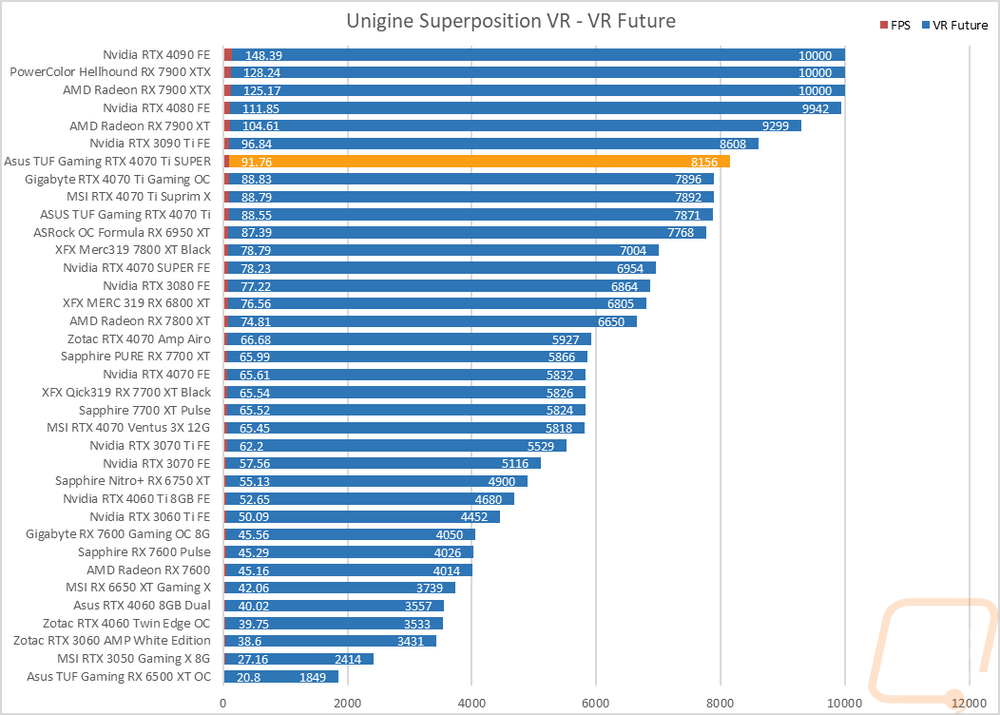
My first test was again in Superposition. This time I tested the VR Future test using the Oculus resolution. I have also included the average frame rate as well which is important for the cards at the top of the chart because for some reason Superposition is capped at 10,000 for its scores and that doesn’t show the performance gap in those cards at the top. The TUF Gaming RTX 4070 Ti SUPER improved on the original TUF 4070 Ti by 3.6% here which wasn’t as good as I expected. With that, it is also behind the 3090 Ti and way behind the RX 7900 XT which scored a 9299 to the 8156 of the 4070 Ti SUPER.
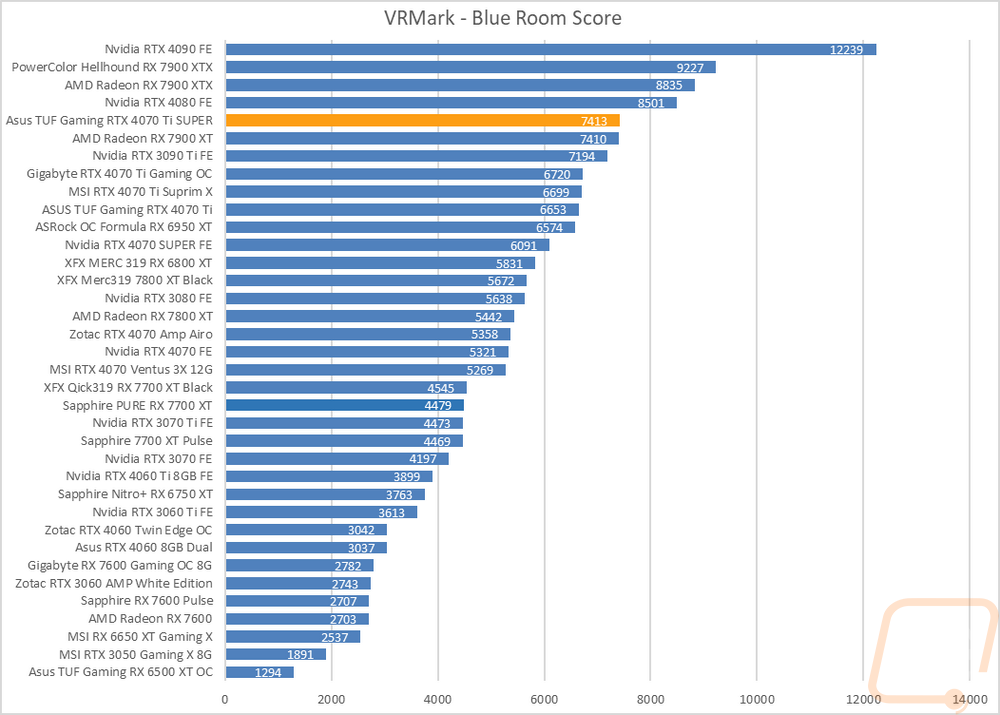
My second round of VR testing was in VRMark which has three tests that are similar to the VR tests in Superposition. I only focused on just the most demanding test called Blue Room which is looking more at future VR performance. The TUF Gaming RTX 4070 Ti SUPER did better here matching the RX 7900 XT’s score and edging ahead slightly with three more points. The RTX 4080 is still out in front of course but the performance improvement for the SUPER here helped jump up past the RTX 3090 Ti and was 11.4% faster than the original non-SUPER model.
In-Game Benchmarks
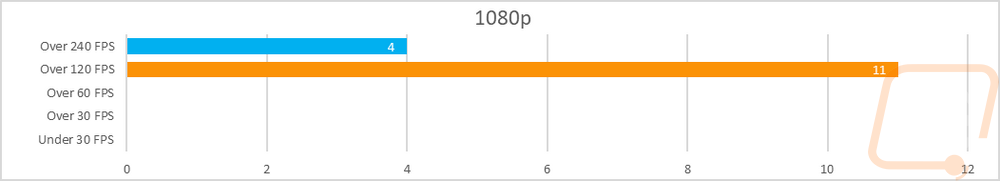
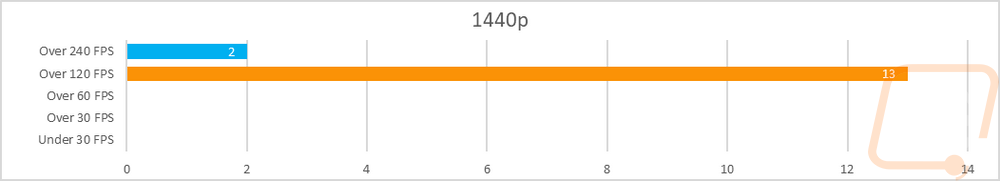
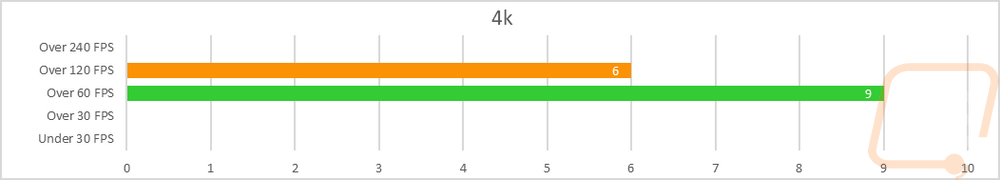
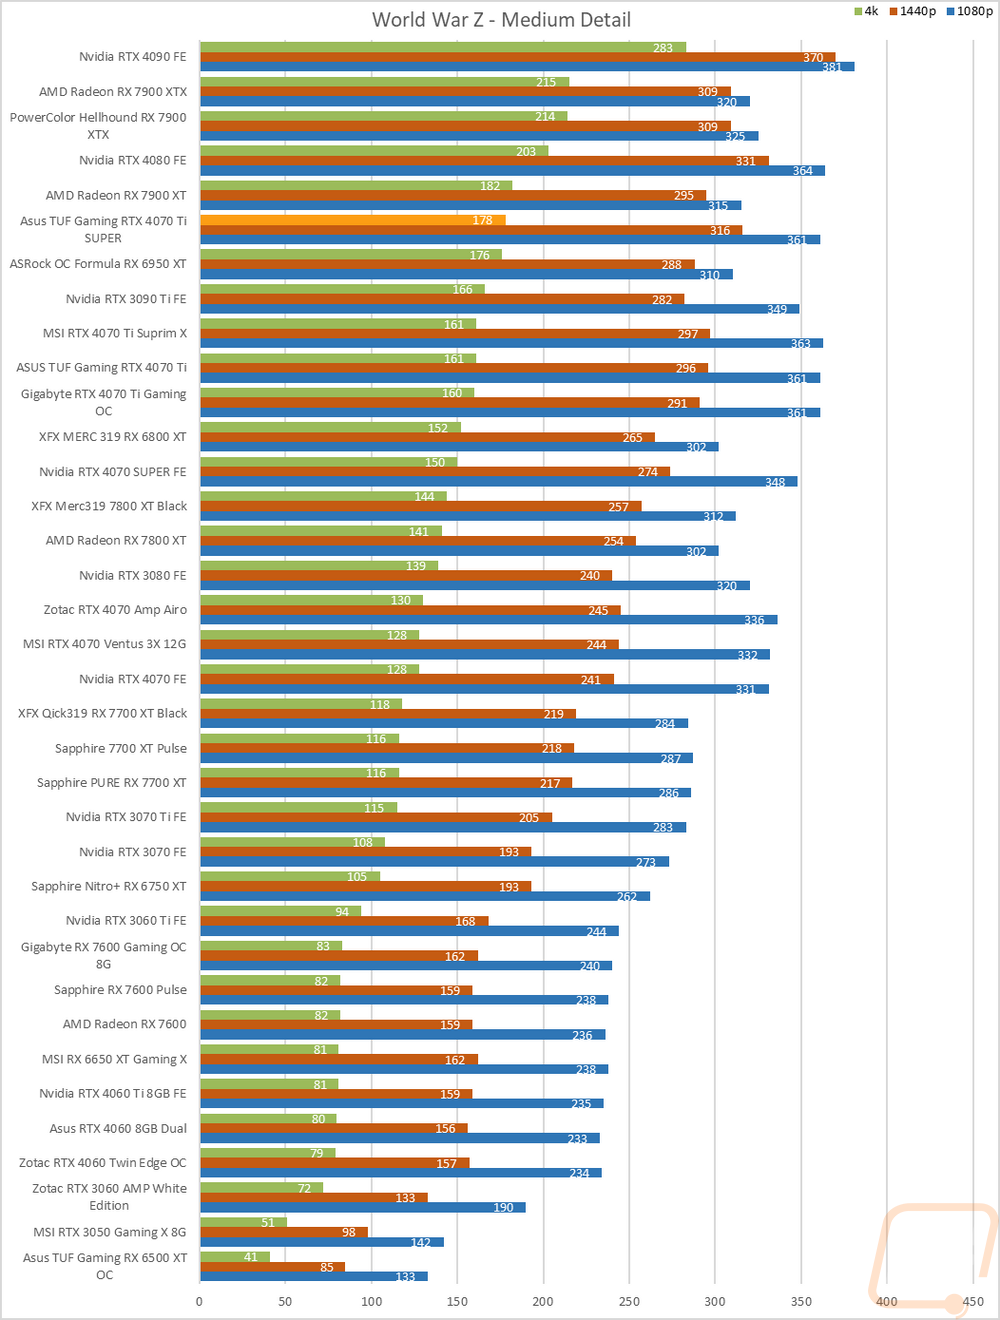
Now we finally get into the in game performance and that is the main reason people pick up a new video card. To test things out I ran through our new benchmark suite that tests 8 games at three different resolutions (1080p, 1440p, and 4k). Most of the games tested have been run at the highest detail setting and a mid-range detail setting to get a look at how turning things up hurts performance and to give an idea of if turning detail down from max will be beneficial for frame rates. In total, each video card is tested 45 times and that makes for a huge mess of results when you put them all together. To help with that I like to start with these overall playability graphs that take all of the results and give an easier-to-read result. I have one for each of the three resolutions and each is broken up into four FPS ranges. Under 30 FPS is considered unplayable, over 30 is playable but not ideal, over 60 is the sweet spot, and then over 120 FPS is for high refresh rate monitors.
So how did the TUF Gaming RTX 4070 Ti SUPER do? Well at 1080p it breezed through all of the tests with none of the results below 120 FPS and four up over 240 FPS as well. 1440p was similar with 13 out of the 15 results in the 120-239 FPS range and two results over 240 FPS. Finally, at 4k the TUF Gaming RTX 4070 Ti SUPER did start to see some sort of a challenge but even still everything was smooth and over 60 FPS with 9 results in the 60-119 FPS range and then 6 results over 120 FPS.
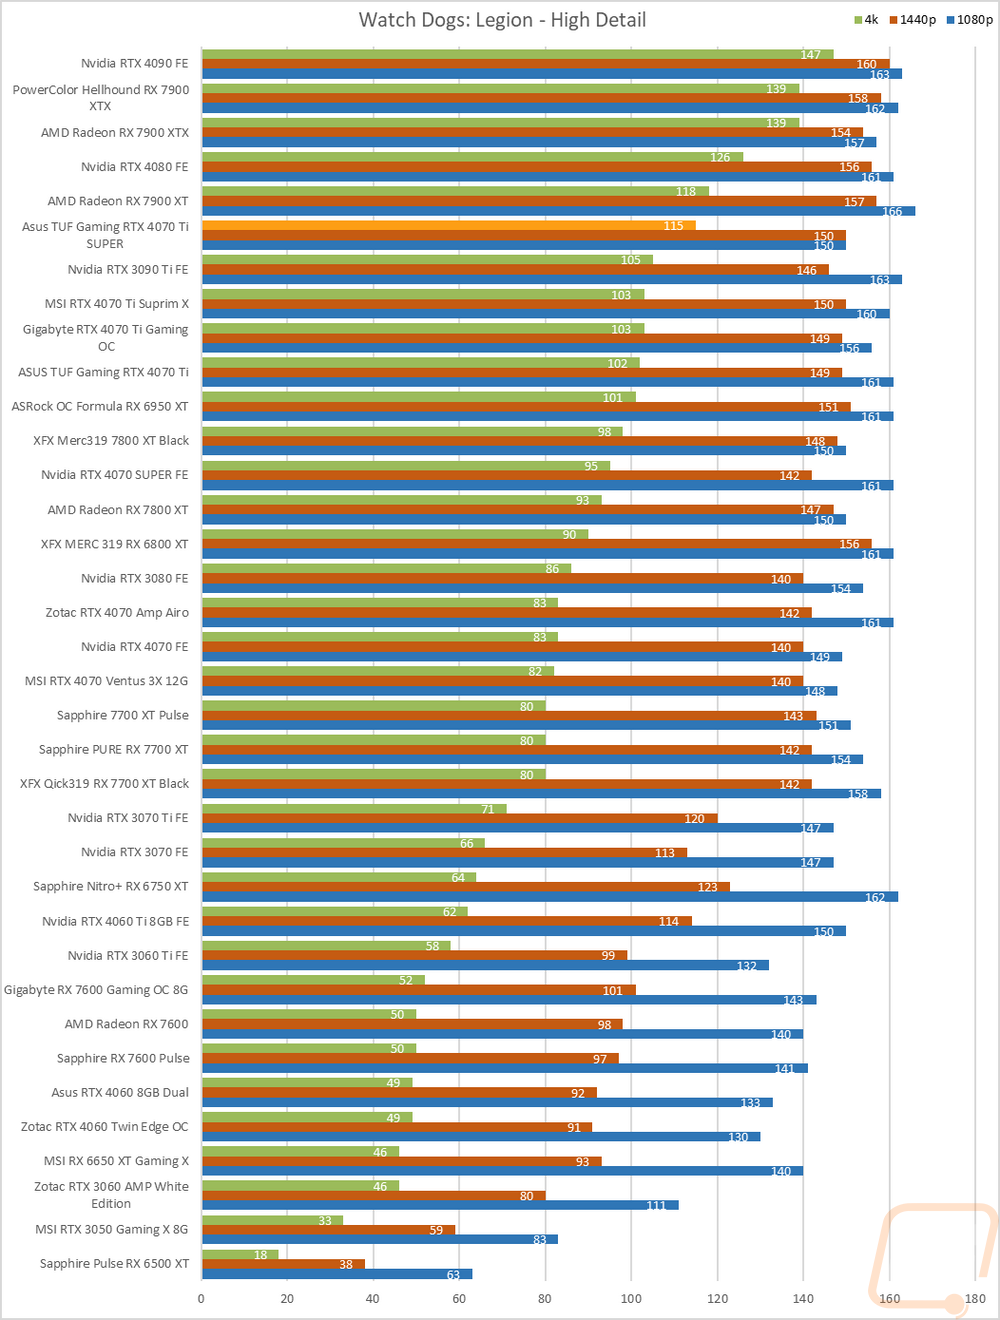
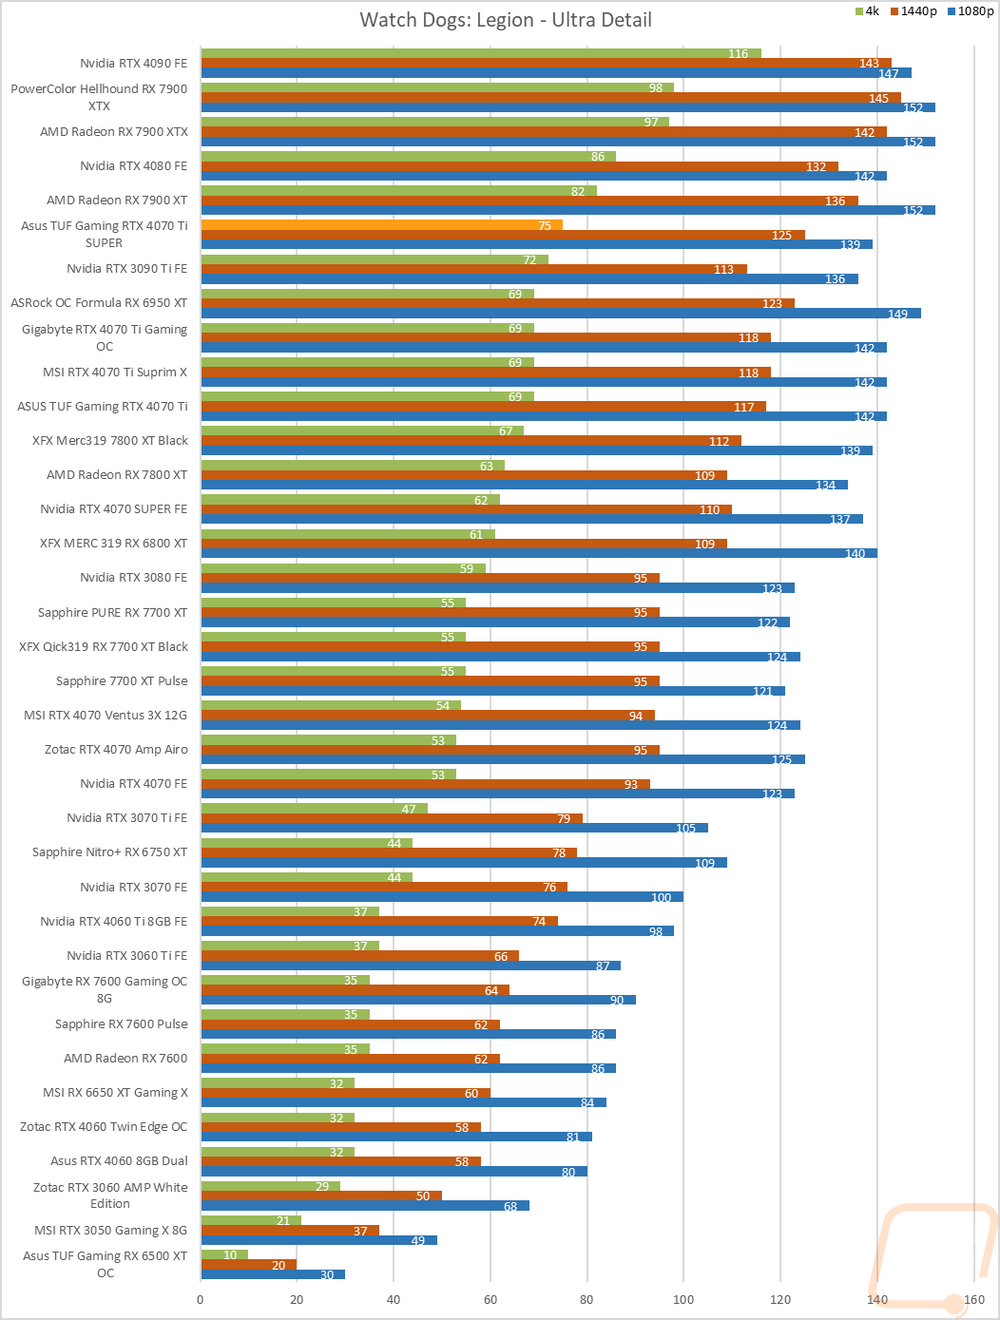
Of course, I have all of the actual in game results as well for anyone who wants to sort through the wall of graphs below. I have also put together the average frame rates for the TUF Gaming RTX 4070 Ti SUPER alongside of the original TUF Gaming RTX 4070 Ti, the RTX 4080, and the AMD RX 7900 XT. This way we can see how the cards all compare. No big surprises of course when we compare the original 4070 Ti to the 4070 Ti SUPER. At 4k there was a 10% improvement and a 5.5% improvement at 1440p. That gets smaller at 1080p where a majority of the results are CPU limited. The improved core count help but seeing the performance difference at 4k, some of that is related to the larger VRAM as well which the TUF Gaming RTX 4070 Ti SUPER has 16GB to the 12 of the original 4070 Ti. The RTX 4080 is still way out in front. Then we have the RX 7900 XT which is a few FPS lower at 1080p but does beat the TUF Gaming RTX 4070 Ti SUPER at 1440p by 3 FPS and at 4k they are similar.
|
|
1080p |
1440p |
4k |
|
ASUS TUF Gaming RTX 4070 Ti |
210.7 |
174.1 |
103.6 |
|
ASUS TUF Gaming RTX 4070 Ti SUPER |
213.4 |
183.8 |
114.1 |
|
AMD Radeon RX 7900 XT |
211.1 |
186.6 |
114.8 |
|
Nvidia RTX 4080 FE |
220.7 |
193.5 |
127.5 |
Compute Benchmarks
Now some people don’t need a video card for gaming, they need the processing power for rendering or 2D/3D production, or in some cases, people who game also do work on the side. So it is also important to check out the compute performance on all of the video cards that come in. That includes doing a few different tests. My first test was a simple GPU Compute benchmark using PassMark's Performance Test 10.2 and the TUF Gaming RTX 4070 Ti SUPER was surprisingly close to the RTX 4080 here, really putting a gap between it and the original RTX 4070 Ti as well with an 11% improvement. The RX 7900 XT and even the RX 7900 XTX are both well below the original 4070 Ti here.
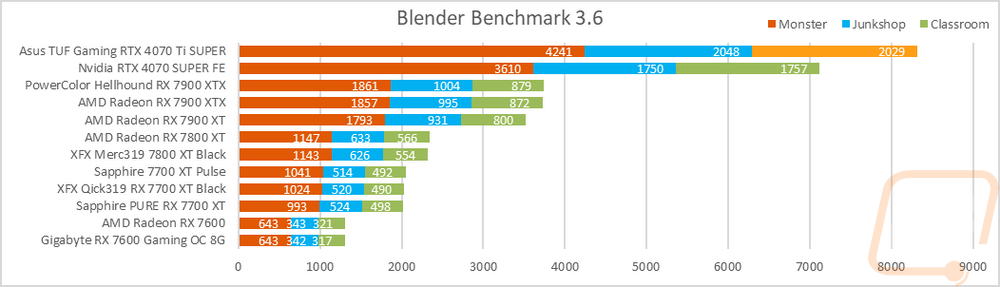
Blender is always my favorite compute benchmark because the open-source 3D rendering software is very popular and it isn’t a synthetic benchmark. With the latest version of Blender, they redid the benchmark so we now have a new test that runs three different renderings and gives each a score. I have all three stacked together so we can see the overall performance. The TUF Gaming RTX 4070 Ti SUPER improved on the original RTX 4070 Ti but still has a big gap between it and the RTX 4080. AMD isn’t really in the picture here with the 7900 XT running behind the 3060 Ti and even the 7900 XTX is behind the RTX 3070.
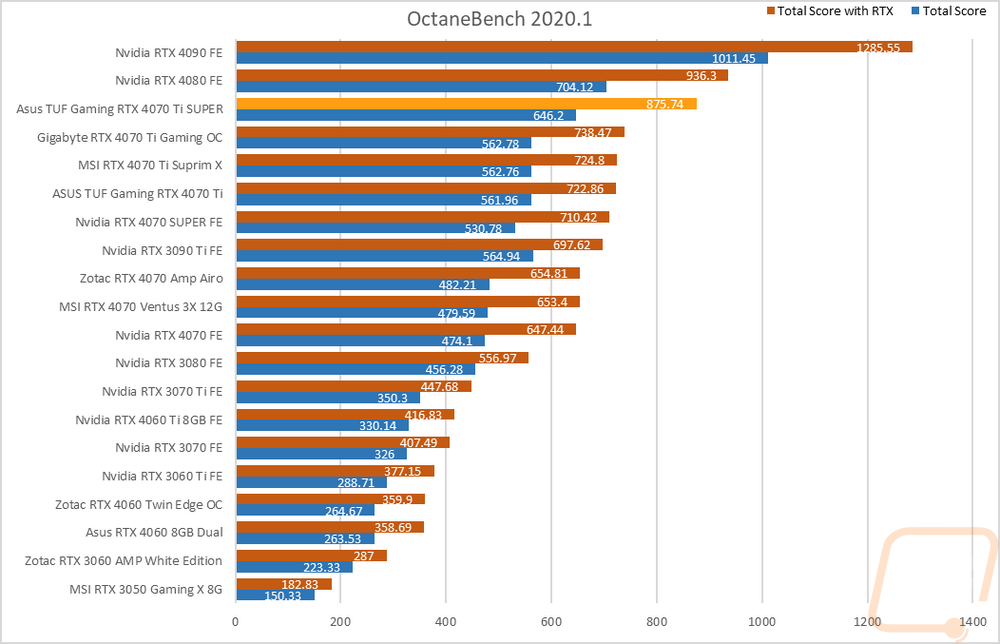
For CUDA-based cards, I also check out OctaneRender performance using their OctaneBench 2060.1 benchmark which allows me to check out both RTX and non-RTX rendering performance. Here the TUF Gaming RTX 4070 Ti SUPER beat the original TUF 4070 Ti by 21% on the RTX score and 15% on the non-RTX test. This put it up close to the RTX 4080 but there is still a gap there.
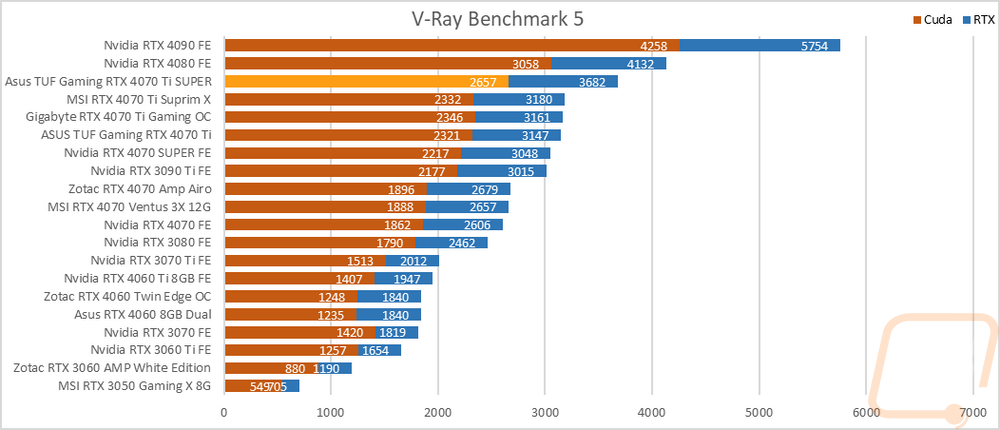
For an additional CUDA-based test I also ran V-Ray Benchmark 5 to check out CUDA and RTX performance in the 3D rendering and simulation software. The TUF Gaming RTX 4070 Ti SUPER improved on the original TUF 4070 Ti by 17% in its RTX on result putting a big gap between the 4070 Ti SUPER and the card it replaces.
RTX and DLSS
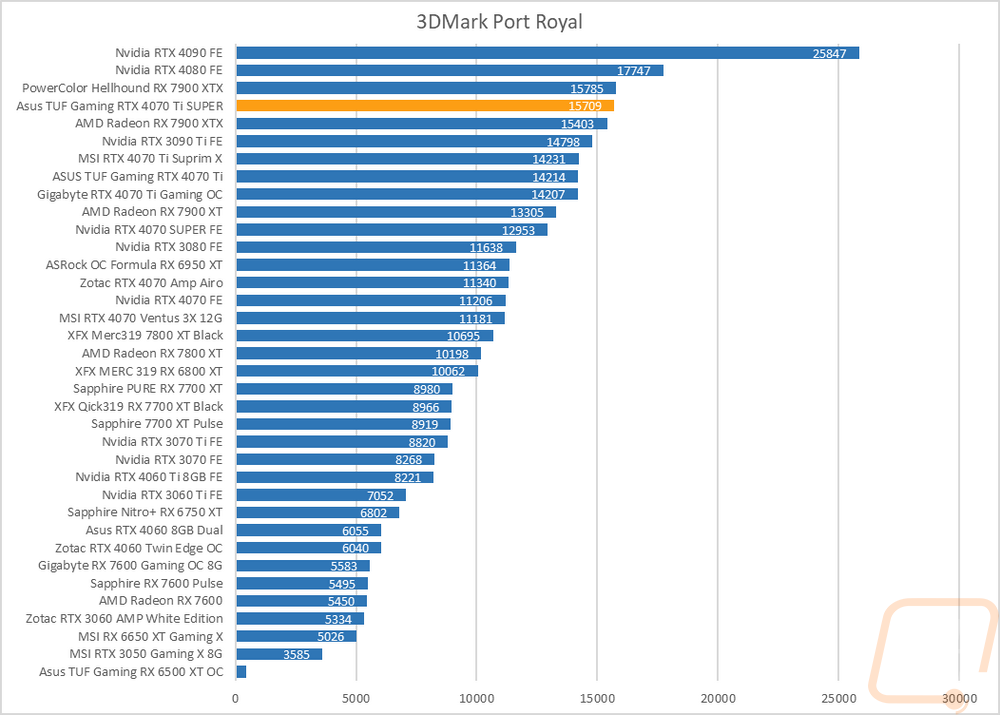
Being an RTX card I also like checking out the performance of some of Nvidia’s features. Namely the ray tracing performance and the performance improvements you can see by using DLSS combined with the tensor cores. My first test goes back to our synthetic benchmarks with 3DMark where I check out their Port Royal benchmark. This is the one test that also has AMD Ray Tracing support which is great for getting a look at how different cards including older non-RTX cards perform. The TUF Gaming RTX 4070 Ti SUPER ties with the RX 7900 XTX here with the overclocked 7900 XTX ahead and the stock-clocked 7900 XTX behind it. The RTX 4080 and RTX 4090 are still way out in front here but the improvement for the RTX 4070 Ti SUPER gave a nice performance bump that helped pass up the RTX 3090 Ti as well.
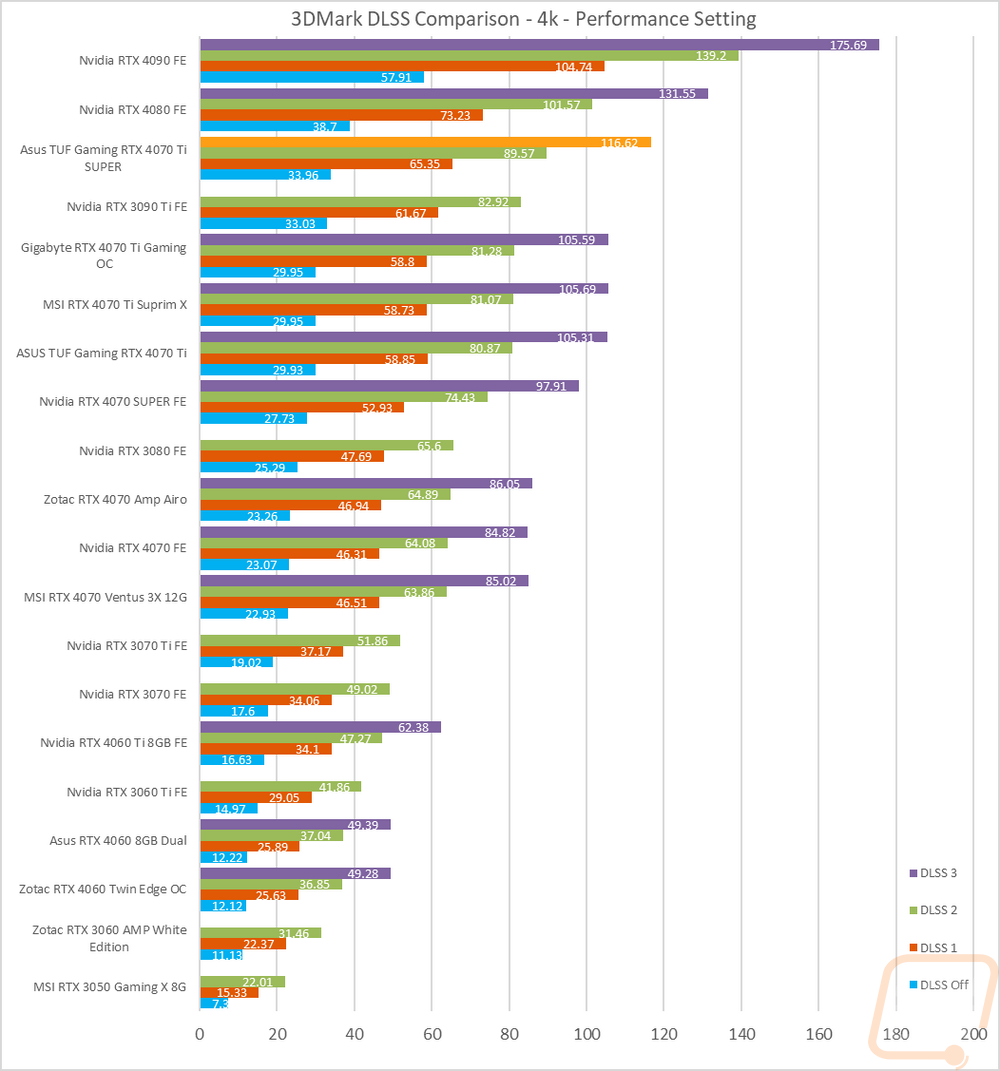
3DMark also has added in a few feature tests, one being a look at DLSS performance. For this one, I have the resolution set to 4K and I test with all three versions of DLSS as well as with it off completely. All DLSS are set to their performance setting as well to keep the results comparable. This gives us a great look at the performance improvements that DLSS has given with DLSS 3 also including frame generation. The TUF Gaming RTX 4070 Ti SUPER is sitting below the RTX 4080 and ahead of the older but still powerful RTX 3080 Ti here. The big story though is how LDSS improved on the base average FPS of 33.96 up to 65 FPS for DLSS 1, 89 FPS for DLSS 2, and then 116 FPS for DLSS 3 which added in frame generation.
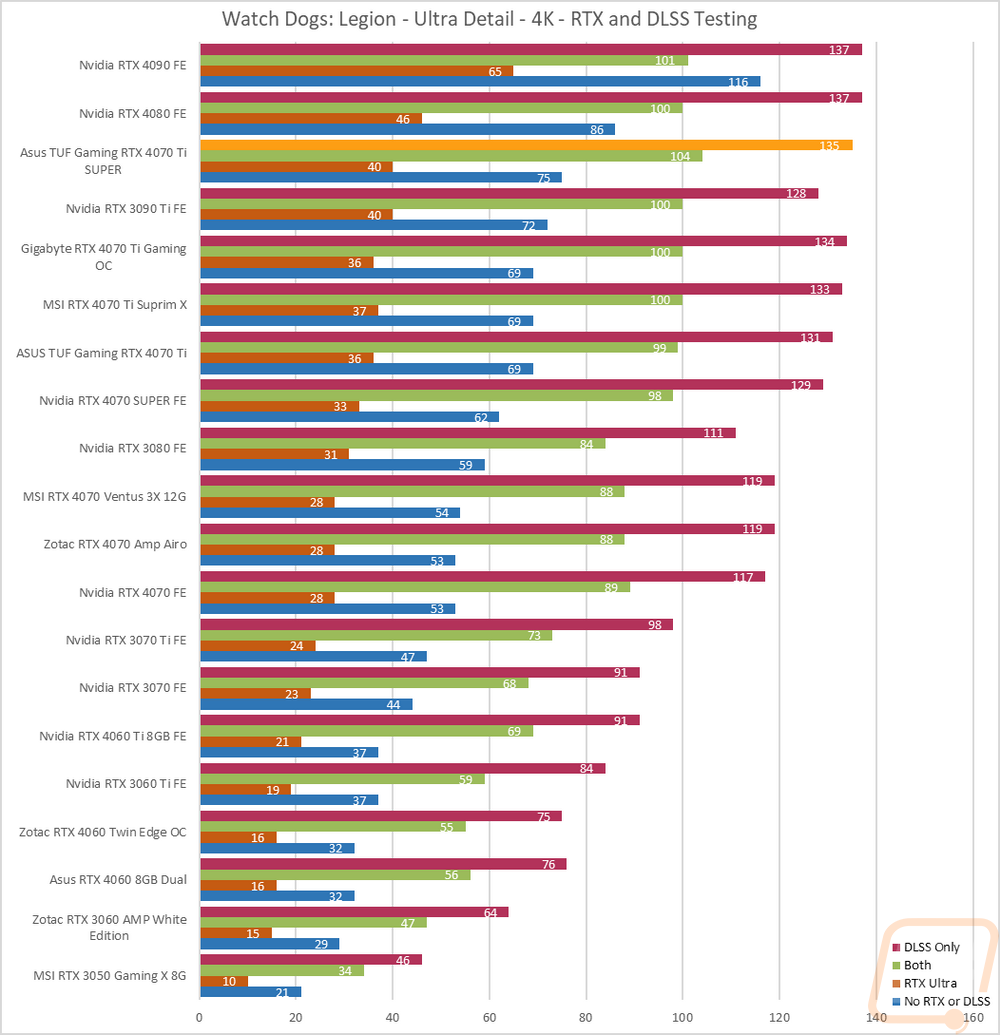
I then jumped into game tests, this time with Watch Dogs: Legion. For this one, I wanted to get an idea of the performance you will see when taking advantage of Nvidia’s RTX and DLSS features. I tested at 4k with the ultra detail setting and with ultra being the setting for DLSS and RTX when they are on as well. I then test with no RTX or DLSS on and then with RTX DLSS on and off and on together. Here the TUF Gaming RTX 4070 Ti SUPER matched the 3090 Ti for its RTX-only score but did a better job when DLSS was added into the mix.
I also wanted to take a look at DLSS 3 performance as well a little more than my initial look at it with 3DMark’s benchmark. For this, I put Nvidias Frameview to the test to run a few benchmarks using the games that currently support DLSS 3. For games with a built-in benchmark, I ran the benchmark but used frameview so we could get the FPS and 1% lows and because with some of the game's frame generation is messing up their in game FPS readouts. V-Sync was turned off on all of the tests because it currently causes problems with frame generation and all of the tests were done at 1080p, 1440p, and 4k with the highest detail settings including the highest RTX settings. DLSS 3 when there is an option was set to performance.
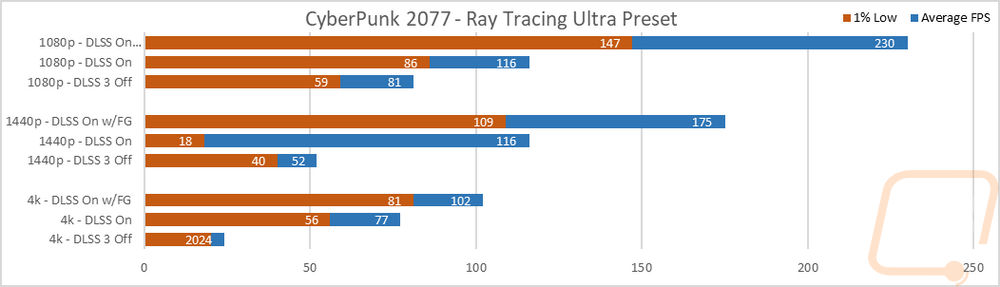
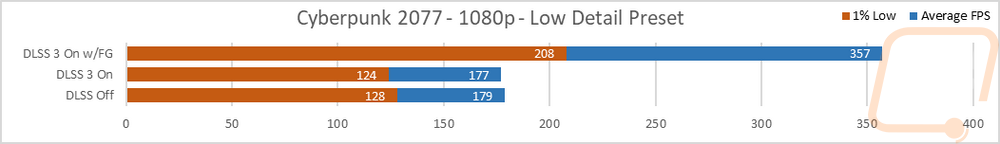
The first game tested was Cyberpunk 2077 and for this one, I tested at 1080p, 1440p, and 4K. I also did a fourth test at 1080p and low settings to get a look at how frame generation helps when CPU limited. At 1080p and 1440p the TUF Gaming RTX 4070 Ti SUPER gets a huge performance improvement with frame generation turned on taking the 1080p performance from 81 FPS up to 116 with DLSS and a staggering 230 FPS with frame generation. 1440p was similar, pushing performance up into something smooth with DLSS and ideal for a high refresh rate display with frame generation on. Then for 4k, the TUF Gaming RTX 4070 Ti SUPER struggled with it all turned off but with DLSS gameplay was smooth. Going back to 1080p and running low detail is a great example of how frame generation can improve performance in situations where you are CPU-limited. The DLSS on and off results were nearly identical, in fact, DLSS on was a hair slower but adding in frame generation we went from 177 to 357 FPS.
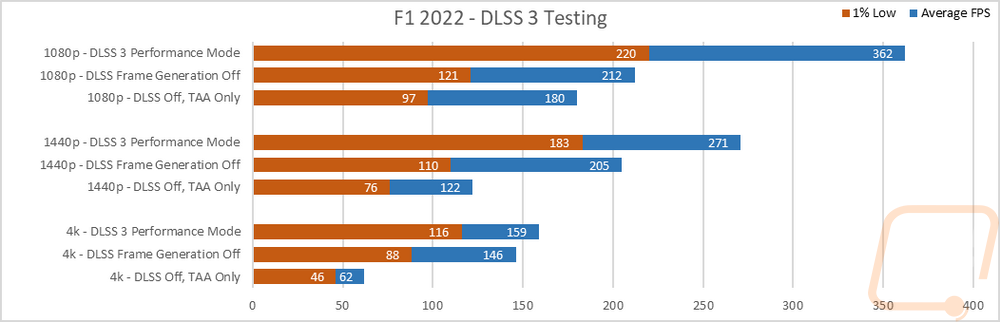
In F1 2022 I ran three tests. I tested with full DLSS, I did it again but turned off frame generation, and then tested with DLSS off and TAA on. Frame generation here was a big improvement at 1080p and 1440p but I did still see that performance issue at 4k that I have seen on all of the cards. That said at 4K DLSS itself was still enough to go from a nice solid 62 FPS up to 146 FPS and improved on the 1% lows. At 1440p and 1080p it was more about getting up into the high refresh range reaching 362 at 1080p and 271 at 1440p which are both great fits for what you can find for display refresh rates at those resolutions.
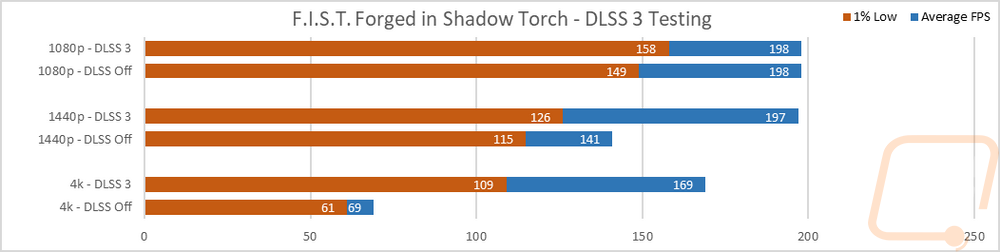
In the side scroller Forged in Shadow Torch, DLSS 3 helped at 1440p and 4k but at 1080p even without DLSS and frame generation, the TUF Gaming RTX 4070 Ti SUPER performed well enough to reach a frame rate limit for the game or our CPU with both results at the same 198 FPS average though it did help the 1% lows slightly. 4k on the other hand shows a huge 100 FPS improvement from turning it on.
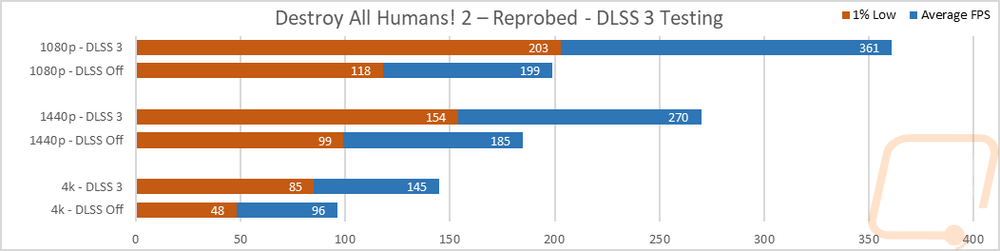
Next up was Destroy All Humans! 2 – Reprobed. The TUF Gaming RTX 4070 Ti SUPER performed well in all three of the base DLSS off tests honestly with the lowest being 96 FPS at 4K. But turning DLSS on stilled offered a big jump even with the 1% lows to help smooth things out even more if your display can handle it.
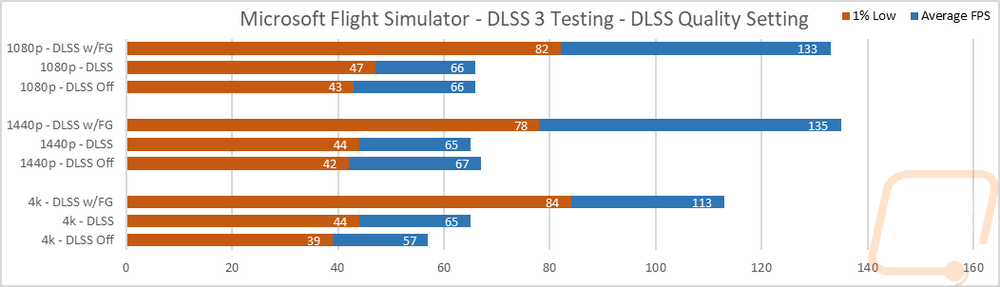
Last I look at Microsoft Flight Simulator and this is an interesting case because this is a well-known CPU-limited game. To keep things consistent the test used the landing test run over Sydney With DLSS off and again with DLSS and frame generation. This included having DLSS on the quality setting, you can get even better performance by changing that and with the detail settings on their highest settings. I tested at 1080p, 1440p, and 4k. This is another situation where we are CPU-limited at 1080p and 1440p. You can see it with the DLSS on and off results being the same and at 1440p with it dropping performance slightly. But turning frame generation on does get you a big performance improvement in a situation where an even better GPU just isn’t going to change that much.
Cooling Noise and Power
For my last few tests, rather than focusing on in game performance, I like to check out other aspects of video card performance. These are also the most important ways to differentiate the performance between cards that have the same GPU. To start things off I took a look at power usage.
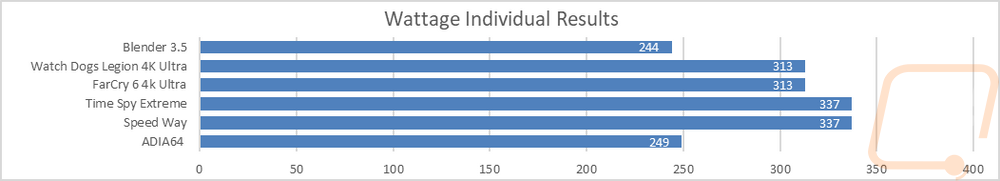
For this, our new test setup utilizes the Nvidia-designed PCat v2 along with cables to handle both traditional 6 or 8-pin connections as well as the new 12VHPWR. The PCat also utilizes a PCIe adapter to measure any power going to the card through the PCIe slot so we can measure the video card wattage exclusively, not the entire system as we have done in the past. I test with a mix of applications to get both in game, synthetic benchmarks, and other workloads like Blender and AIDA64. Then everything is averaged together for our result. I also have the individual results for this specific card and I document the peak wattage result as well which is almost always Time Spy Extreme. The TUF Gaming RTX 4070 Ti SUPER averaged 299 watts and peaked at 337 watts. This was still better than the RTX 3070 Ti by 9 watts on the average and 11 watts on the peak. While officially the TGP didn’t change from Nvidia between the RTX 4070 Ti and the RTX 4070 Ti SUPER, the TUF card did average 9 watts more than the original TUF 4070 Ti but did better on the peak. Bringing in the RX 7900 XT for comparison because they are so close in overall performance, Nvidia is still well ahead in power efficiency with the stock-clocked 7900 XT averaging 56 watts more and peak being 52 watts higher.
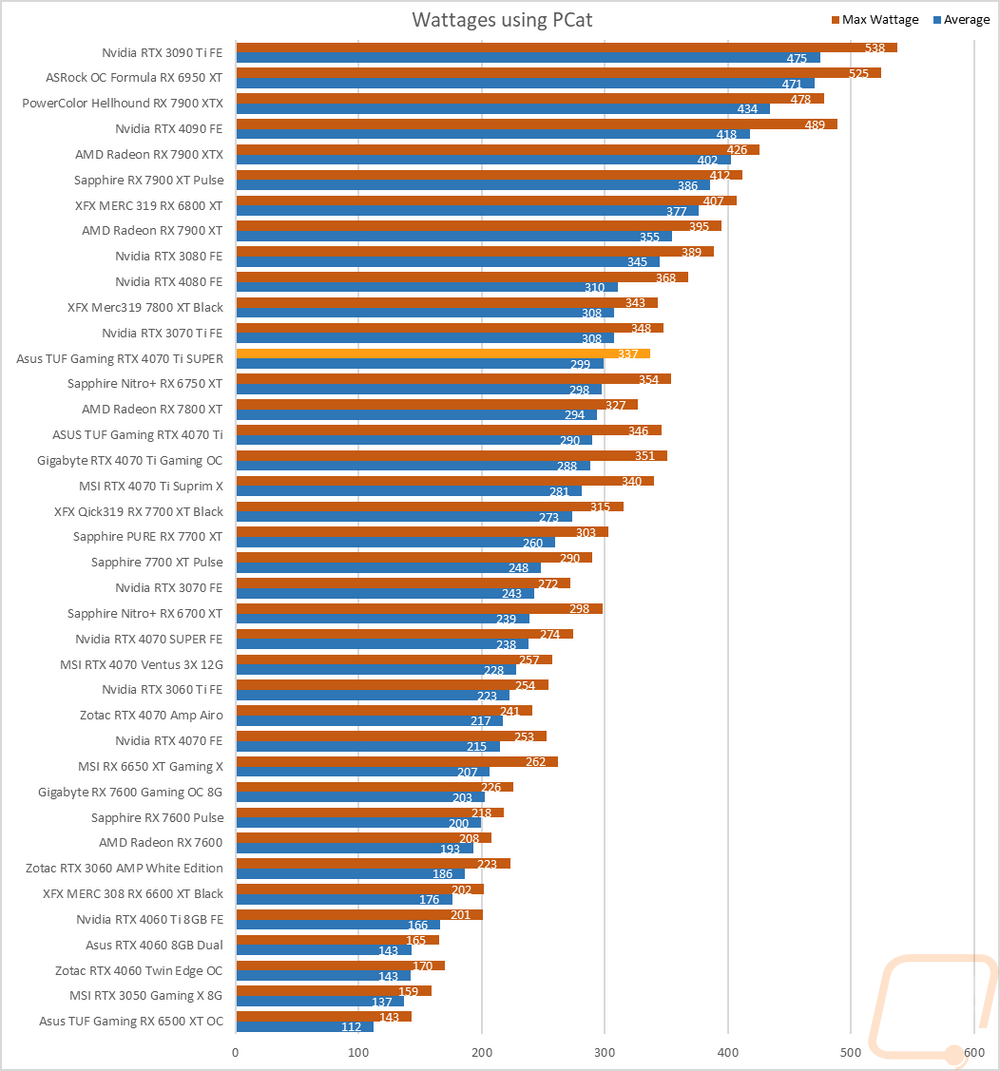
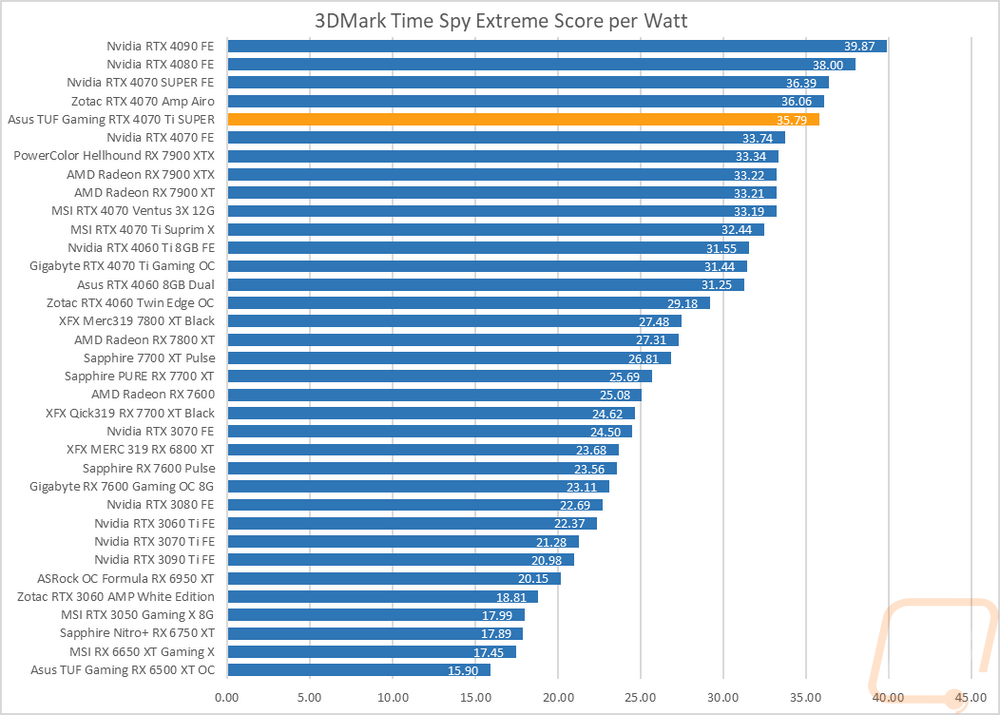
With having exact peak wattage numbers when running Time Spy Extreme I was also able to put together a graph showing the total score for each watt that a card draws which gives us an interesting look at overall power efficiency in the popular and demanding benchmark. The TUF Gaming RTX 4070 Ti SUPER scored 35.79 points per watt which is better than the original 4070 Ti but still just shy of the impressive efficiency that I saw last week on the RTX 4070 SUPER Founders Edition or the 4080 and 4090 which top the chart. This is 2.58 points per watt better than the 7900 XT however.
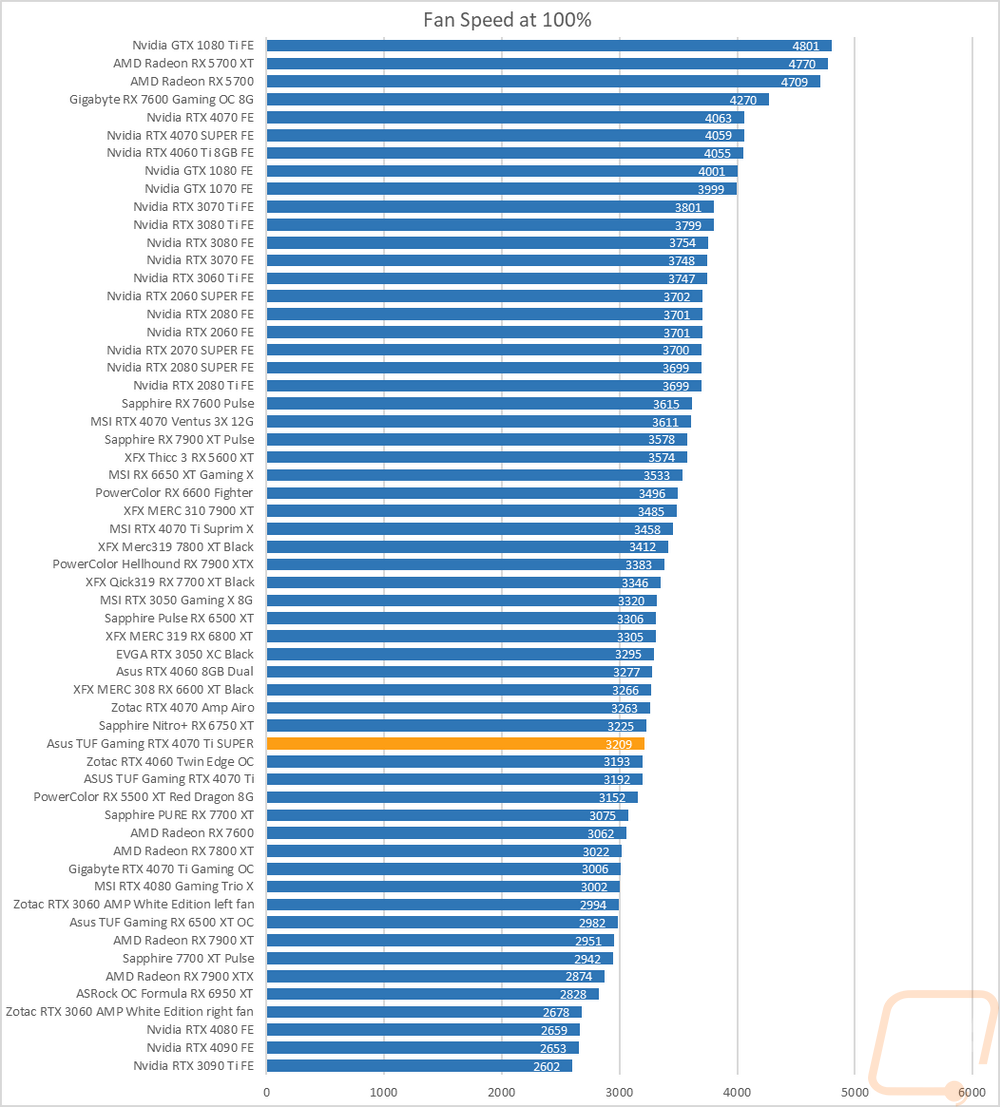
My next round of tests were looking at noise levels. These are especially important to me because I can’t stand to listen to my PC whirling. Especially when I’m not in game and other applications are using the GPU. For my testing, though I first tested with the fan cranked up to 100% to get an idea of how loud it can get, then again at 50% to get an idea of its range. The TUF Gaming RTX 4070 Ti SUPER is down in the bottom of our 50% fan speed chart and even at 100% fan speed was in the bottom 1/3 in that chart as well which is impressive, especially for a 3-fan card. The 100% performance was right in line with where the card falls on the RPM charts and was also right with the original TUF Gaming RTX 4070 Ti that I took a look at last year which has the same cooler.
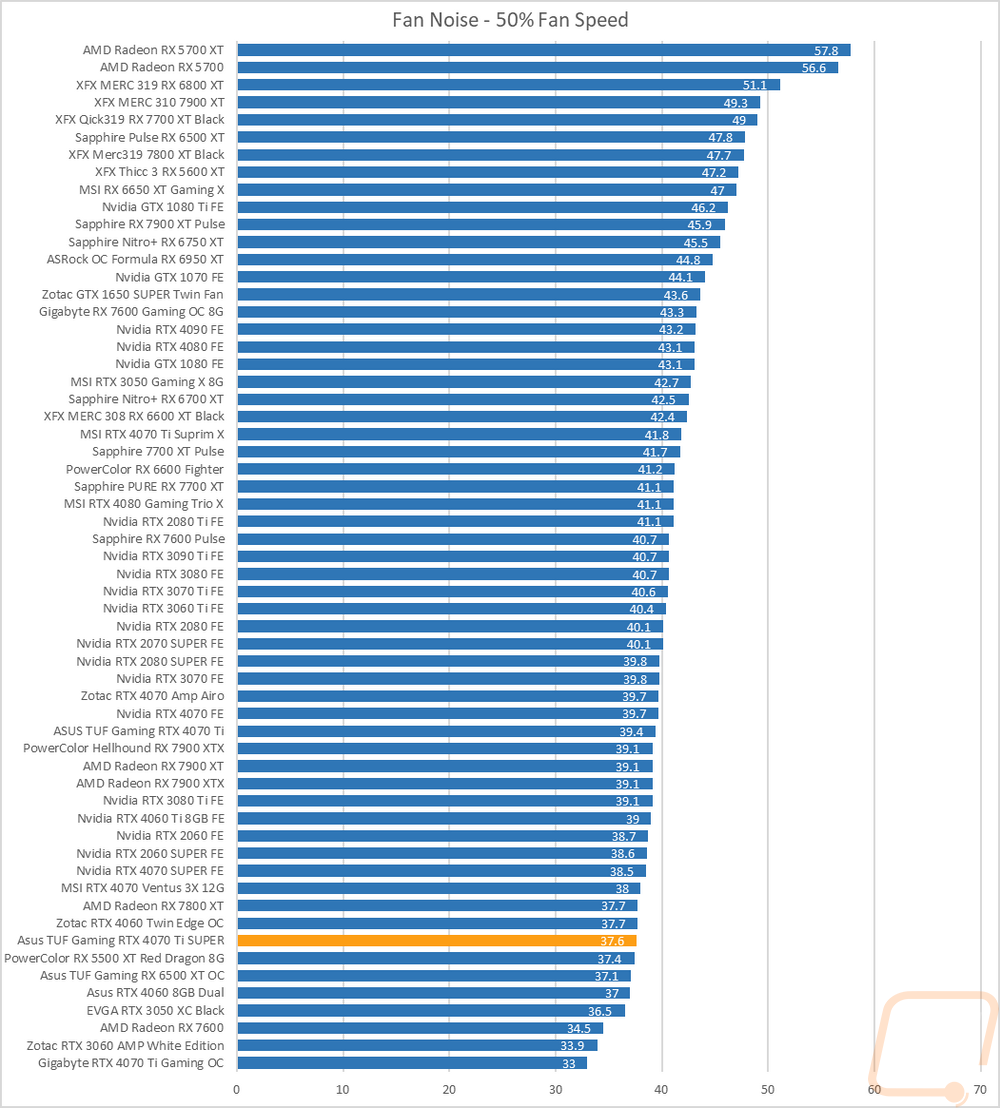
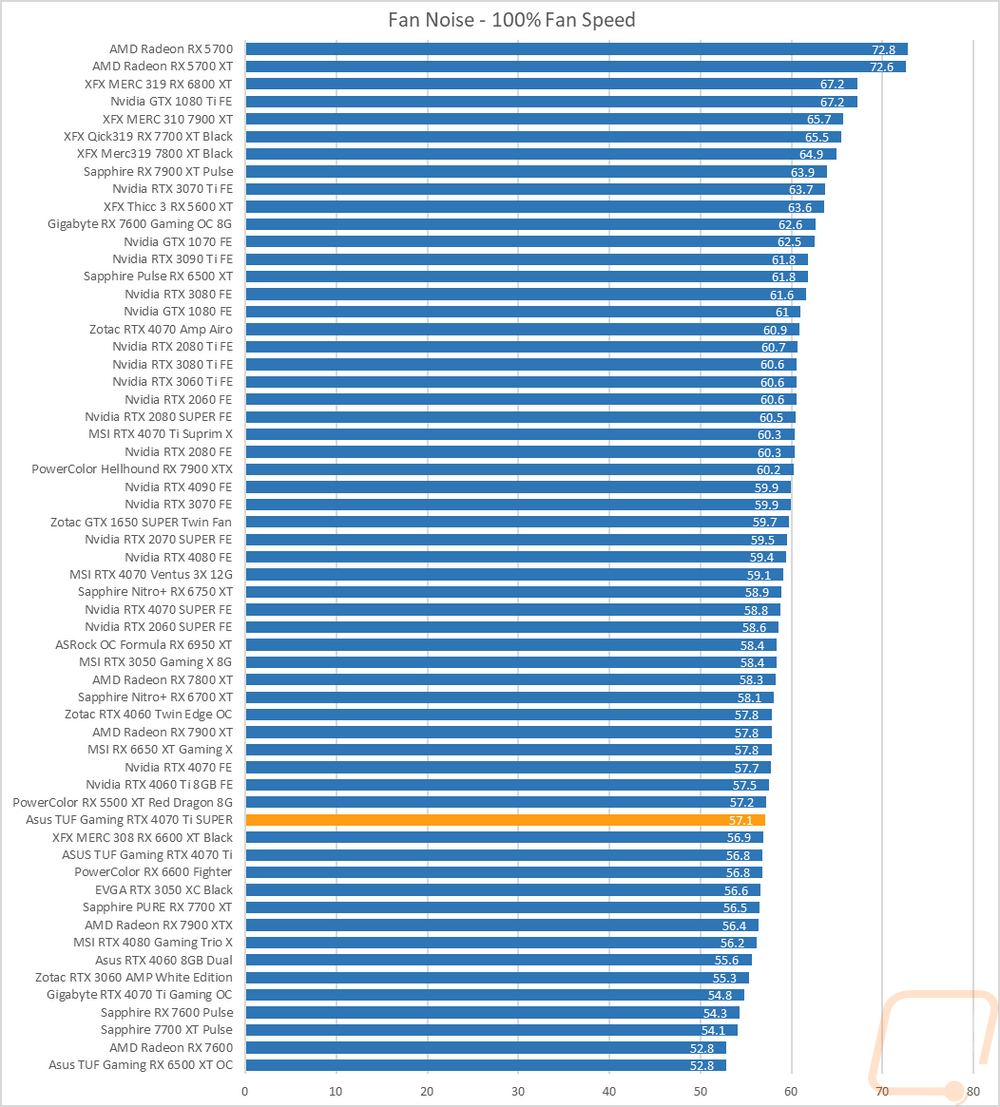
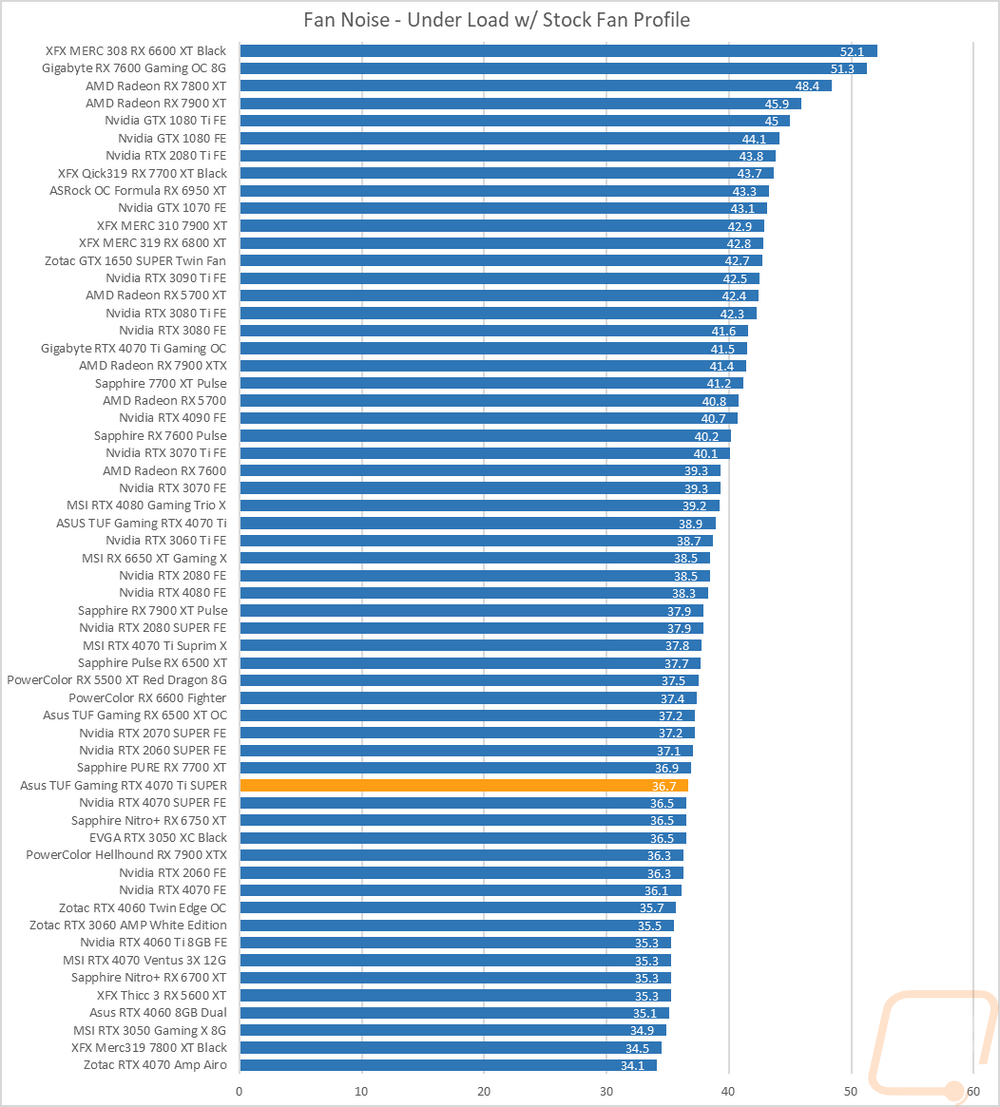
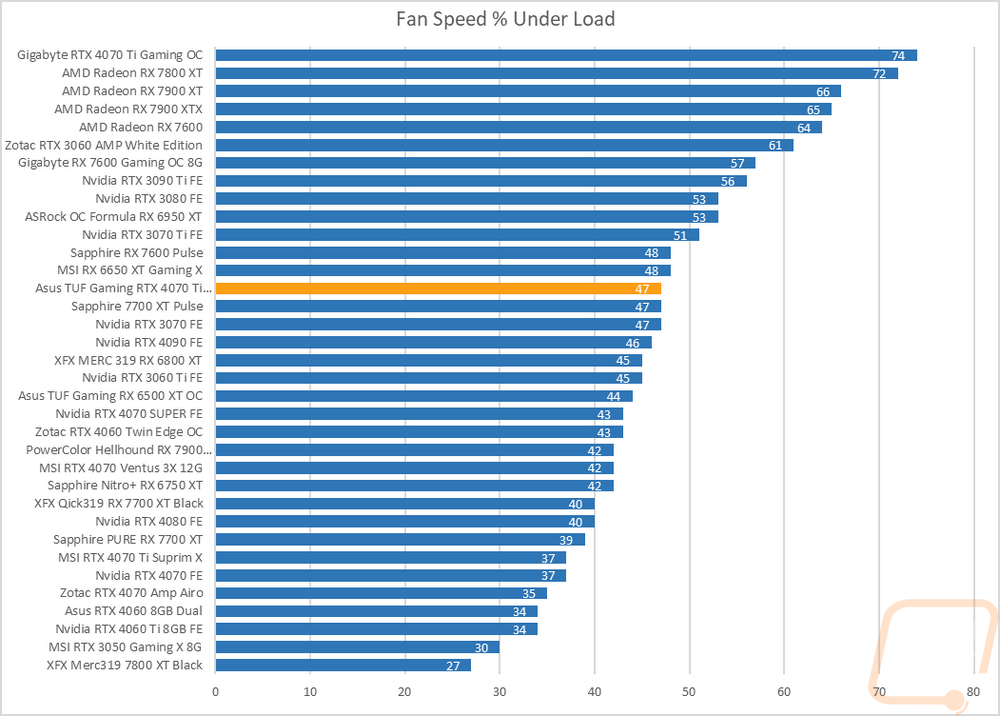
I also take a look at noise performance while under load. For that when running AIDA64’s stress test I wait until the temperature of the card has leveled off and then measure how loud things are when the card is at its worst-case scenario with the stock fan profile. Once again the TUF Gaming RTX 4070 Ti SUPER did well here sitting in the bottom 1/3 of the chart with its 36.7 dB result. When under load it was running at 47% of the total fan speed which makes sense, putting it just behind the 37.6 dB result we saw at 50% fan speed.
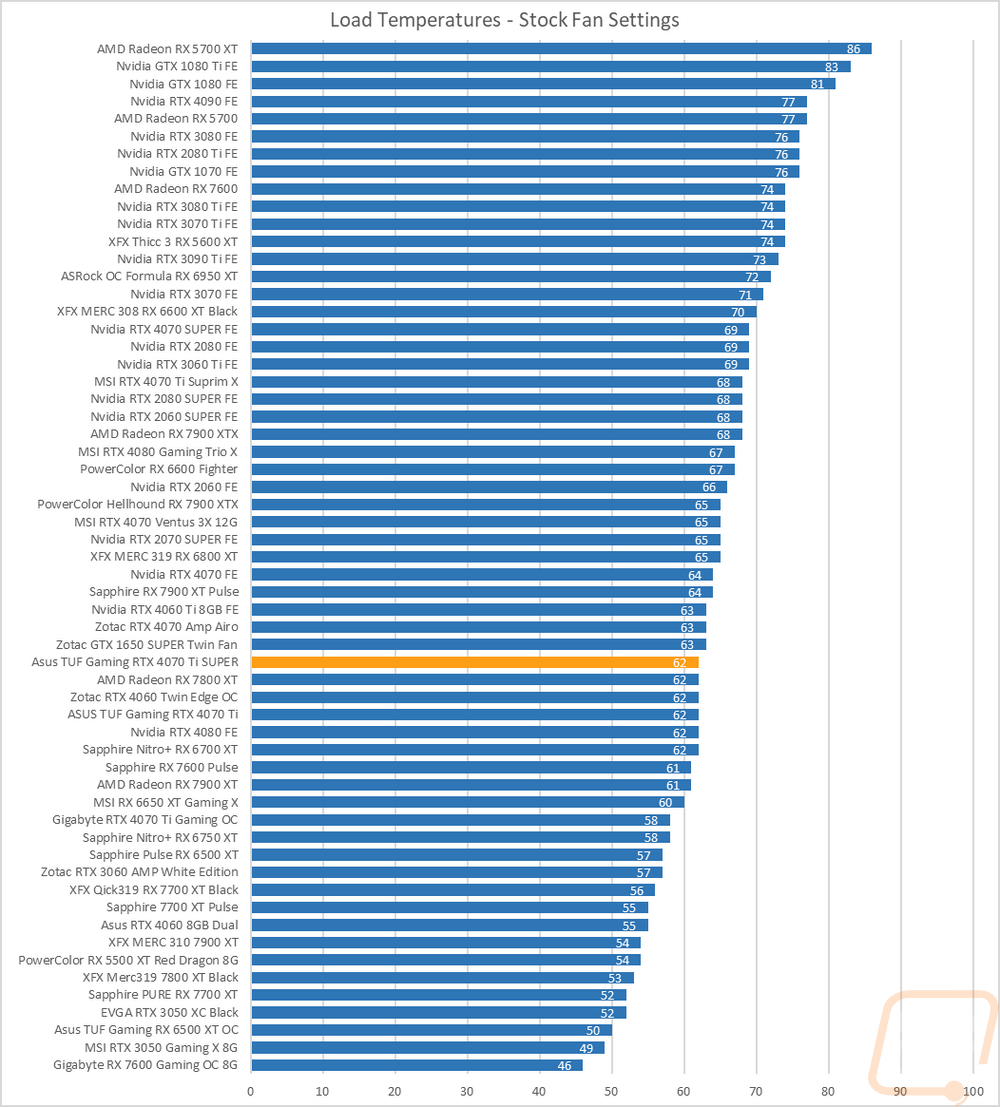
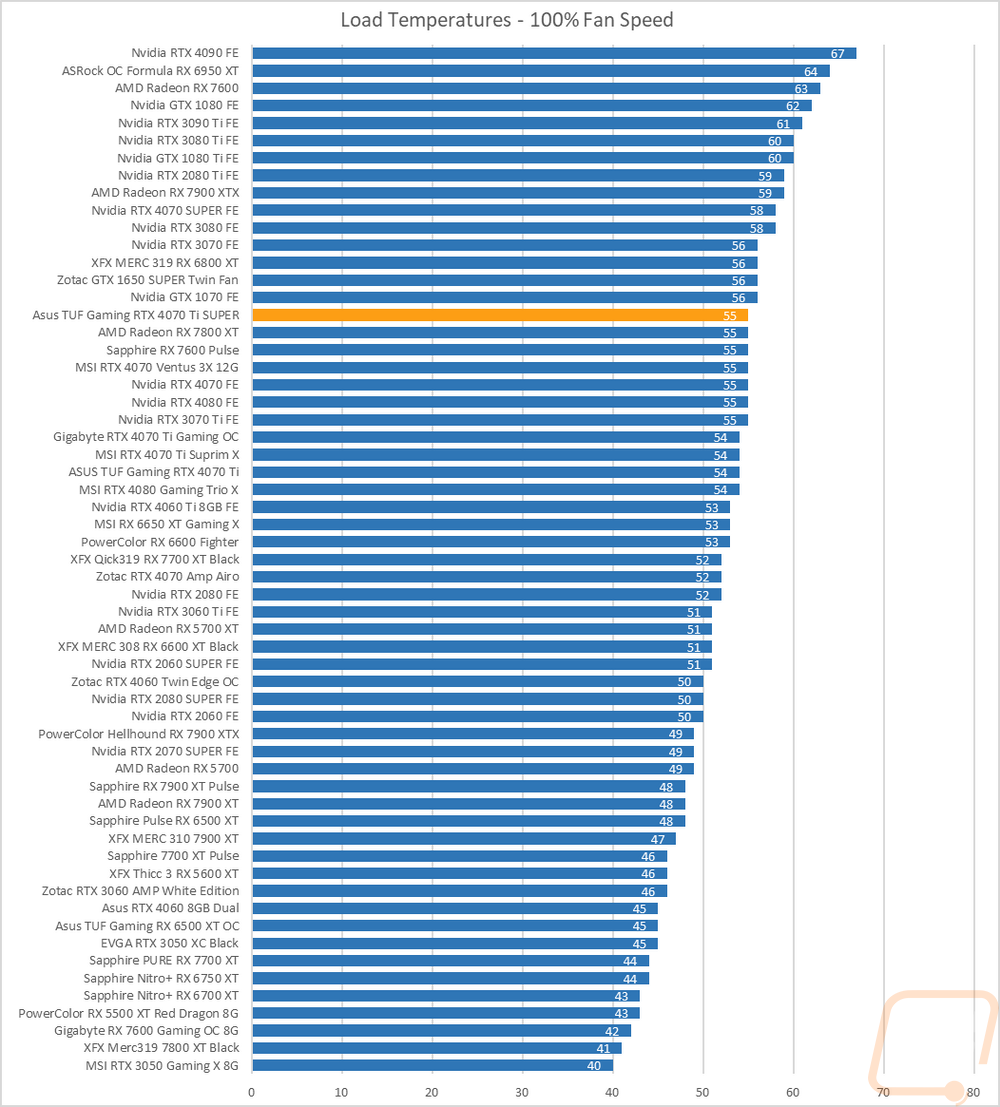
To finish up my testing I of course had to check out the cooling performance. To do this I ran two different tests. I used AIDA64’s Stress Test run for a half-hour each to warm things up. Then I documented what temperature the GPU leveled out at with the stock fan profile and then again with the fans cranked up to 100%. With the stock profile, the TUF Gaming RTX 4070 Ti SUPER leveled off at 62c when under load. This was exactly the same as the original TUF 4070 Ti. The GPU hotspot was 78c and the memory temperature was 60c.
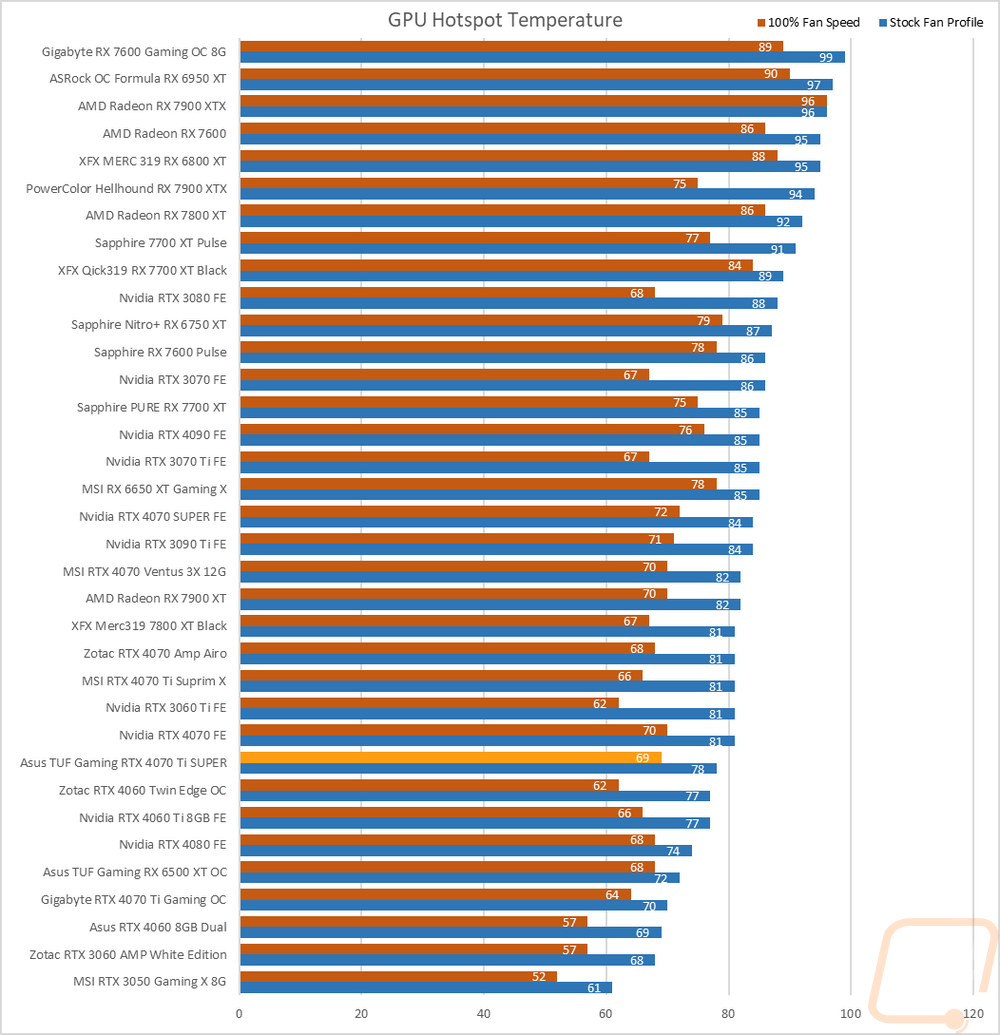
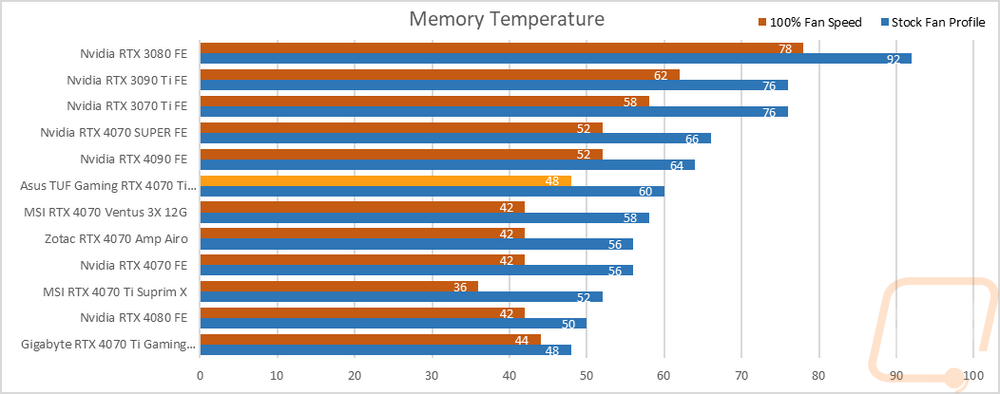
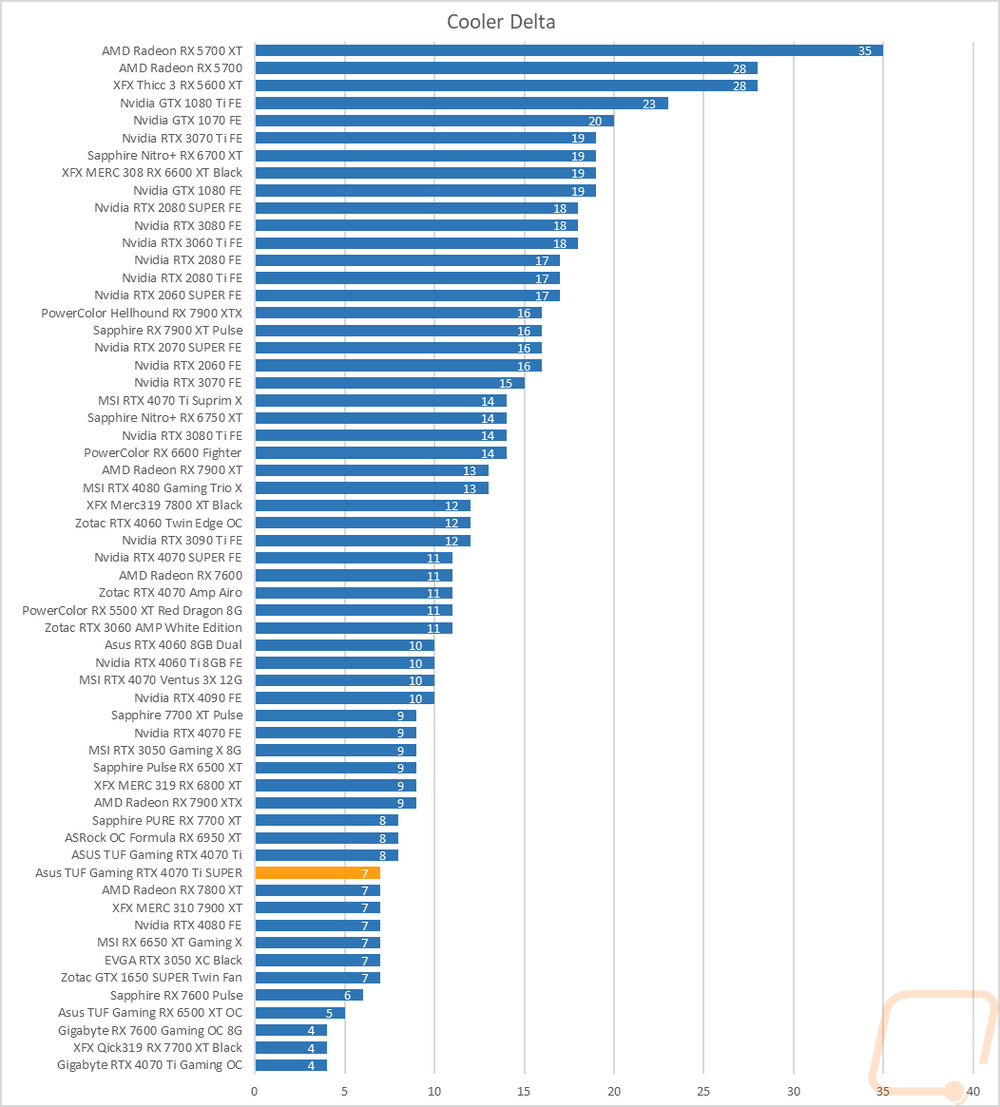
Then with the fans cranked up, the TUF Gaming RTX 4070 Ti SUPER ran at 55c which is a little on the higher side compared to the other cards on our chart. This was 1 degree warmer than the non-SUPER 4070 Ti so there wasn’t too much of a change there. Overall the delta between the stock fan profile and 100% tests was 7 degrees which doesn’t leave a tone of headroom but isn’t concerning at all. At 100% fan speed the GPU hotspot cooled down from 78c to 69c. The memory was affected more dropping from 60c down to 48c.
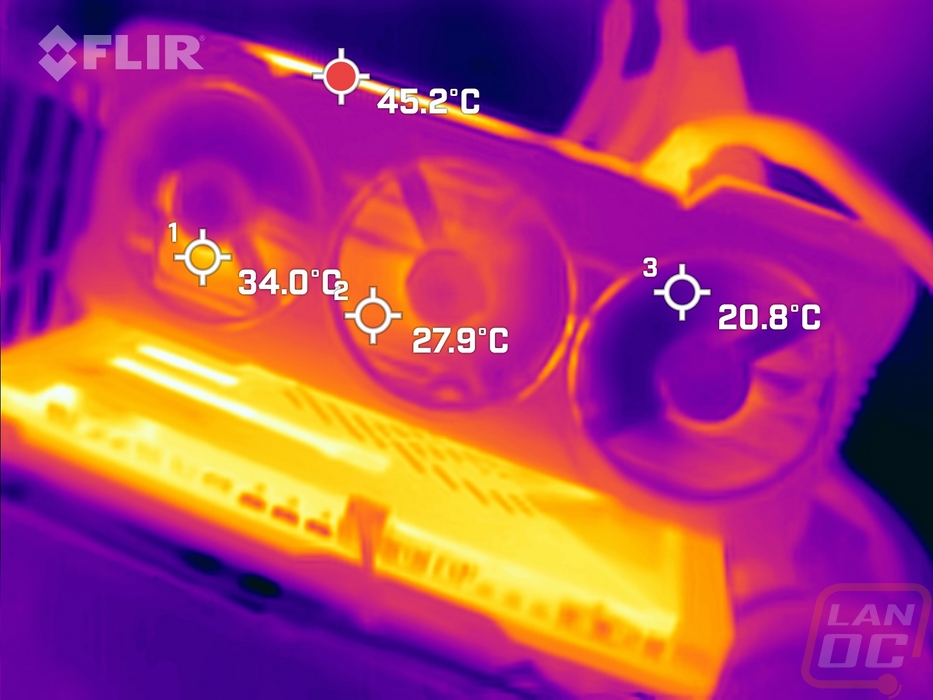
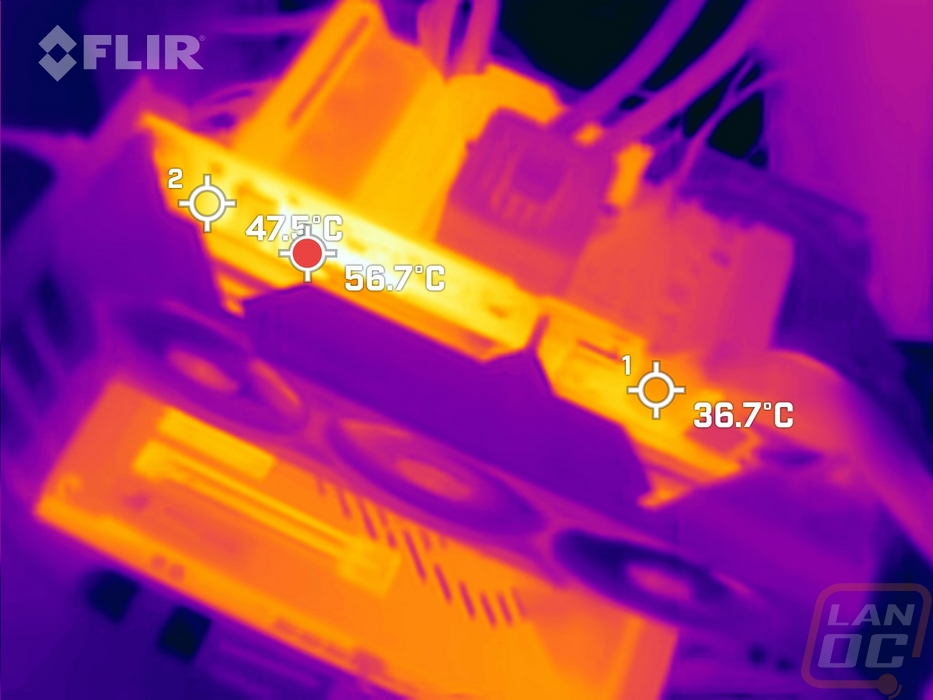
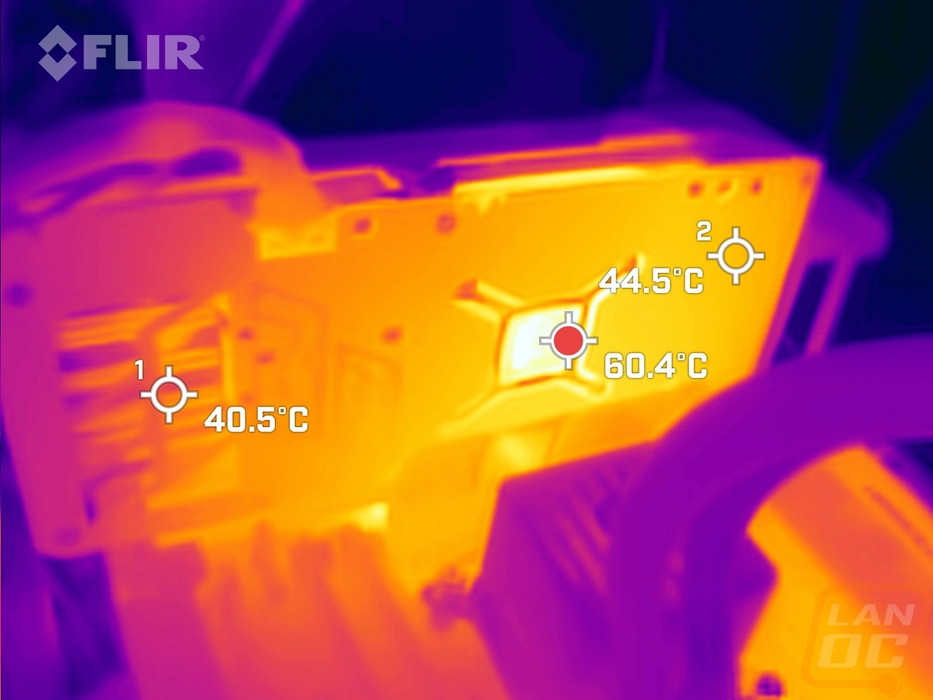
While running the stock fan profile testing I also took the time to get a few thermal images so we could see what is going on. The fan side of the TUF Gaming RTX 4070 Ti SUPER is running nice and cool, this includes the diecast metal fan shroud which I would have thought might start to hold some heat but the triple fan design is keeping things nice and cool there with the hottest spots being behind the far left fan at 34c and the coolest at 20.8c on the far right blow-through fan which is basically room temperature. The top of the card does have some warmer areas with the hotspot at 56.7c. This has the exposed PCB and is also where the heatsink is venting most of its air. Then on the back, the hottest spot on the whole card is the back of the PCB in the one exposed area directly behind the GPU at 60.4c. The left side of the back is a lot cooler with the blow-through area cooling things but even on the right, it was only 44.5c.
Overall and Final Verdict
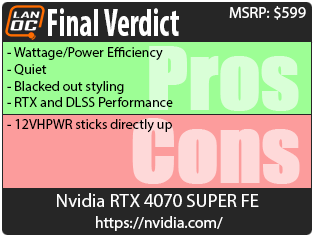
With our testing out of the way and having taken a closer look at the TUF Gaming RTX 4070 Ti SUPER we can finally step back and start to put everything together. For the RTX 4070 Ti SUPER Nvidia doesn’t have a Founders Editon card, so all of the MSRP-focused cards will be cards like the TUF Gaming I took a look at today. That said I was impressed with Asus’s design which while being their MSRP option isn’t designed like a budget card, the entire fan shroud is all metal, diecast just like with Nvidia’s Founders Edition cards. This gives the TUF Gaming RTX 4070 Ti SUPER that solid construction that fits perfectly with the TUF branding. The card design hasn’t changed from when I took a look at the overclocked TUF Gaming RTX 4070 Ti last year, but I’m not complaining because then and now I like the relatively clean design of the card. My only complaint with the aesthetics was that I wouldn’t mind seeing a little more of the accent lighting, but I was also happy that Asus didn’t just have backlit branding and nothing else, so even there it was an improvement over what you see from a lot of card designs. The TUF Gaming RTX 4070 Ti SUPER does fall into the larger side of things with its 3.25 slot width, 300 mm length, and extra height. It also has its 12VHPWR connection right up on top sticking straight up, so in tighter cases that is going to be strained.
As for its performance, the RTX 4070 Ti SUPER has 10% more CUDA cores and Nvidia has also increased the video memory up from 12 GB to 16 GB which should help at high resolutions and help keep the card relevant in the future for longer. In my testing, this translated to a 6-10% increase in performance depending on the testing. In game at 1440p it was 5.5% faster than the overclocked TUF Gaming RTX 4070 Ti that I tested previously but at 4K this ramped up to 10% and I saw similar numbers in synthetic benchmarks like Time Spy and Time Spy Extreme which it improved 6.8% on Time Spy and 9.1% on Time Spy Extreme. This helped it catch up with AMDs RX 7900 XT, especially at 4k but the 7900 XT was on average still 3 FPS faster at 1440p. Where the 7900 XT didn’t keep up was with ray tracing performance and once you figure in DLSS which the games you are playing support it is a huge improvement. The performance improvement also helped with overall efficiency. While it has the same TGP our TUF Gaming RTX 4070 Ti SUPER did pull a hair more than our overclocked TUF Gaming RTX 4070 Ti did for power, but with the performance improvement its already great power to performance was even better. The cooler for the TUF Gaming RTX 4070 Ti SUPER ran surprisingly quiet in my testing as well and while I wouldn’t say the cooling performance was the best it did perform well keeping the card more than cool enough which when combined with how quiet it was would make me happy.
As for pricing the TUF Gaming RTX 4070 Ti SUPER is launching at the RTX 4070 Ti SUPER launch MSRP of $799. This fits right in at the same MSRP as last year's RTX 4070 Ti which is it replacing. There aren’t any game partnerships right now however which is a bummer given that AMDs RX 7900 XT does come with Avatars Frontiers or Pandora. AMD did also just recently dropped the pricing on a few of their cards including the 7900 XT which now has an MSRP of $749 in response to Nvidia’s SUPER cards announcement. This does put the 7900 XT as the better value if you are looking only at raster performance, but I do think that the ray tracing and DLSS performance have a lot of value as well and that $50 difference still makes this a good pickup if you are looking for high-end performance without spending RTX 4080 or RX 7900 XTX numbers. The TUF Gaming RTX 4070 Ti SUPER specifically is looking especially appealing this time around given that there isn’t a Founders Edition for this GPU and its all-metal construction. Asus does have an overclocked model as well which will hit stores at $849.99 and a white overclocked TUF model for $879.99. They will also have a Pro Art card for that same $879.99 price point and then a Strix model as well which has a hefty $949.99 price point which is WAY too close to the announced MSRP of the RTX 4080 SUPER in my opinion.

Live Pricing: HERE


