Synthetic Benchmarks
As always I like to start my testing with a few synthetic benchmarks. 3DMark especially is one of my favorites because it is very optimized in both Nvidia and AMD drivers. It's nice to not have to worry about it being favored too much either way and the repeatability of the results makes it a nice chance to compare from card to card, especially when comparing with the same GPU. For the TUF Gaming RTX 4070 Ti SUPER, this is our first look at an RTX 4070 Ti SUPER but my main focus when comparing with other Nvidia cards will be seeing how the new card compares to the RTX 4070 Ti that it is replacing, the new RTX 4070 SUPER, and the RTX 4080 and then from AMD I want to see how it compares to the RX 7900 XT.
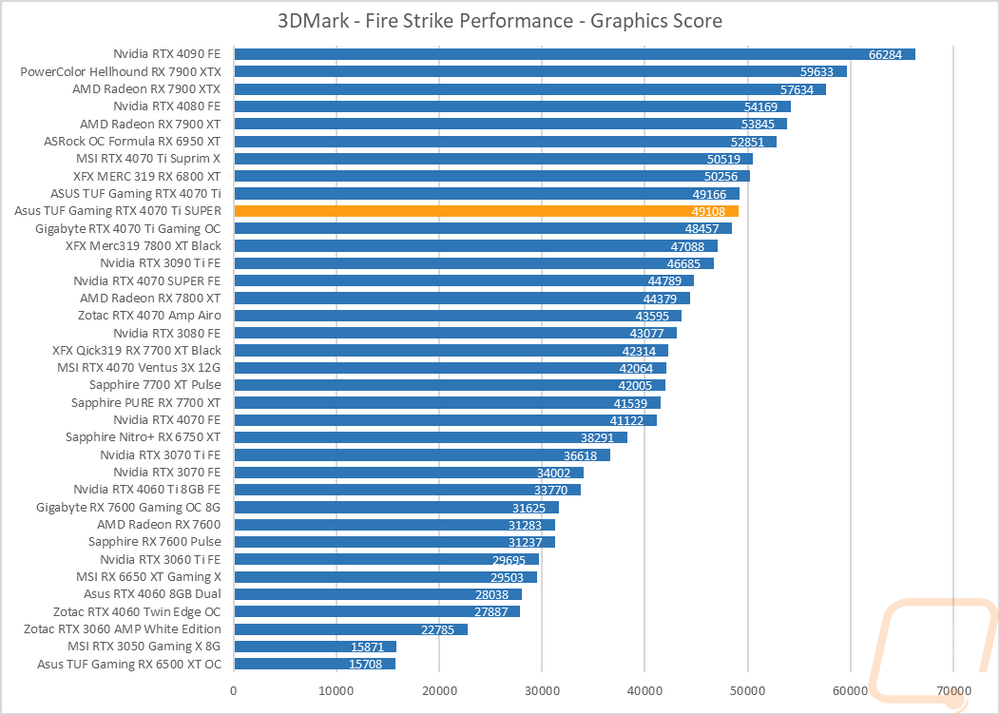
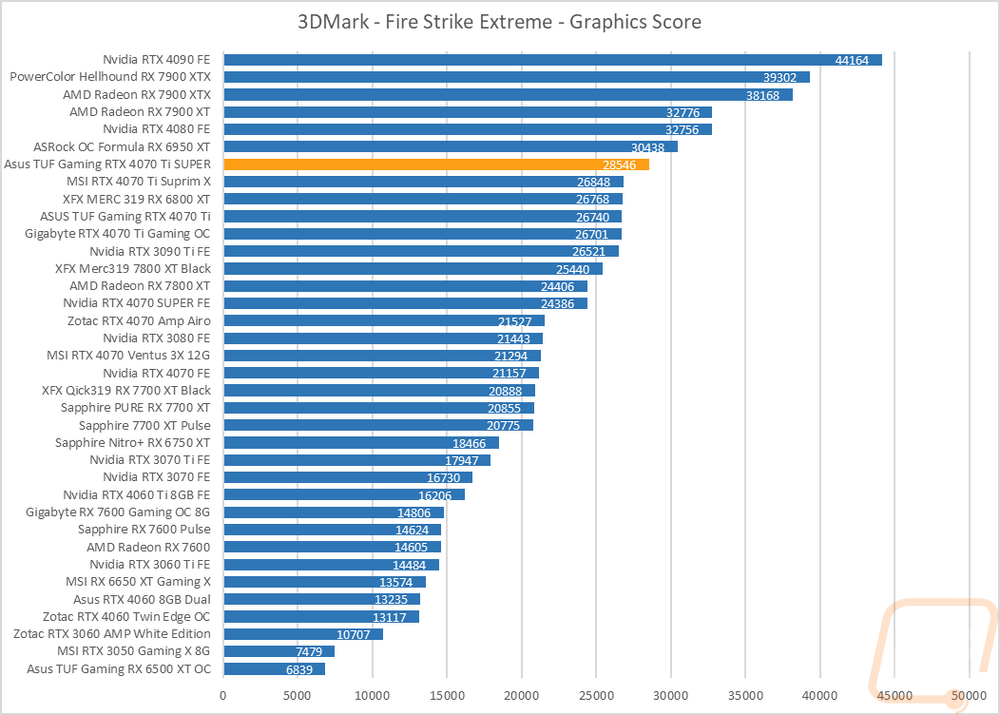
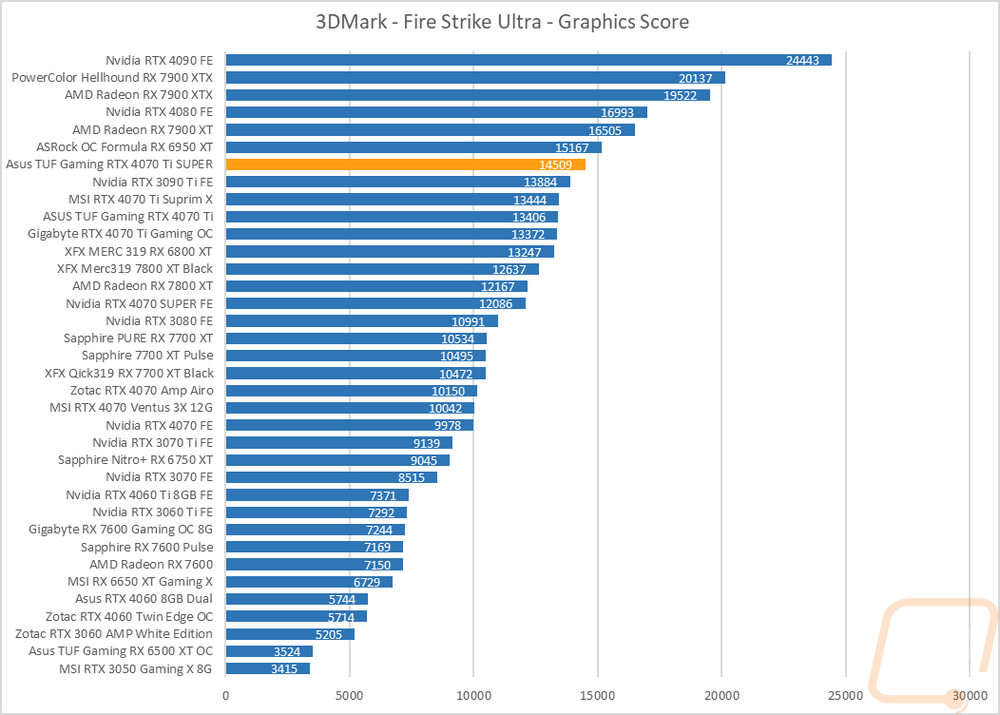
The first round of tests were done in the older Fire Strike benchmark which is a DX11 test. There are three detail levels, performance, extreme, and ultra. The TUF Gaming RTX 4070 Ti SUPER, like the other 4000 Series cards, is a little behind in these tests compared to what AMD has going on with the 6800 XT even outperforming the TUF Gaming RTX 4070 Ti SUPER in the base Fire Strike and the 6950 XT being ahead in the other two. I was surprised that in the base Fire Strike, the TUF Gaming RTX 4070 Ti SUPER also is basically tied with the original RTX 4070 Ti as well but it did pull ahead in the Extreme and Ultra tests.
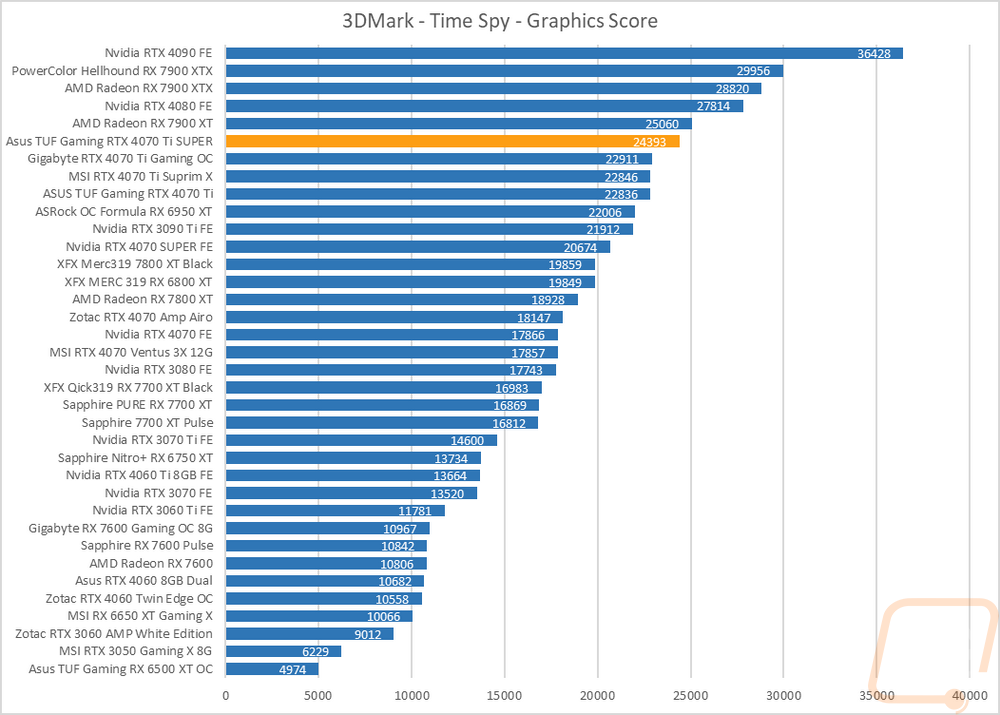
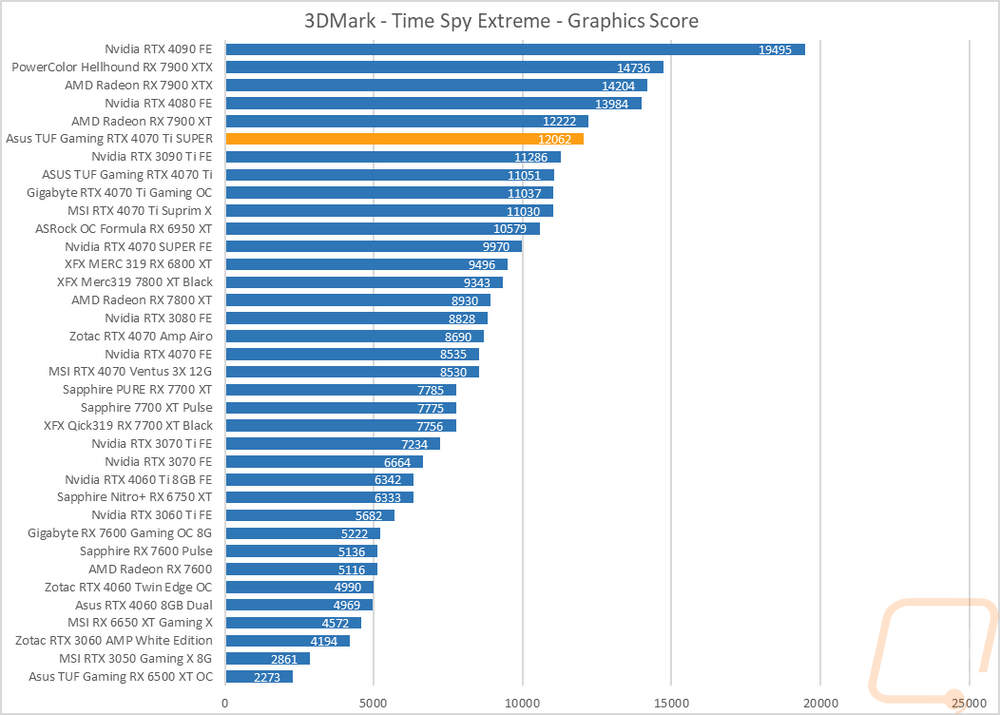
The next two were both based on the Time Spy benchmark. One is the standard test and then there is the extreme detail level. The Time Spy tests favor the Nvidia cards more when compared to the Fire Strike results and here in the base Time Spy the TUF Gaming RTX 4070 Ti SUPER is running with but still behind the RX 7900 XT in both tests. It improved on the original TUF RTX 4070 Ti by 6.8% in the base Time Spy and 9.1% in Time Spy Extreme which helped close the gap on the 7900 XT but wasn’t enough to surpass it.
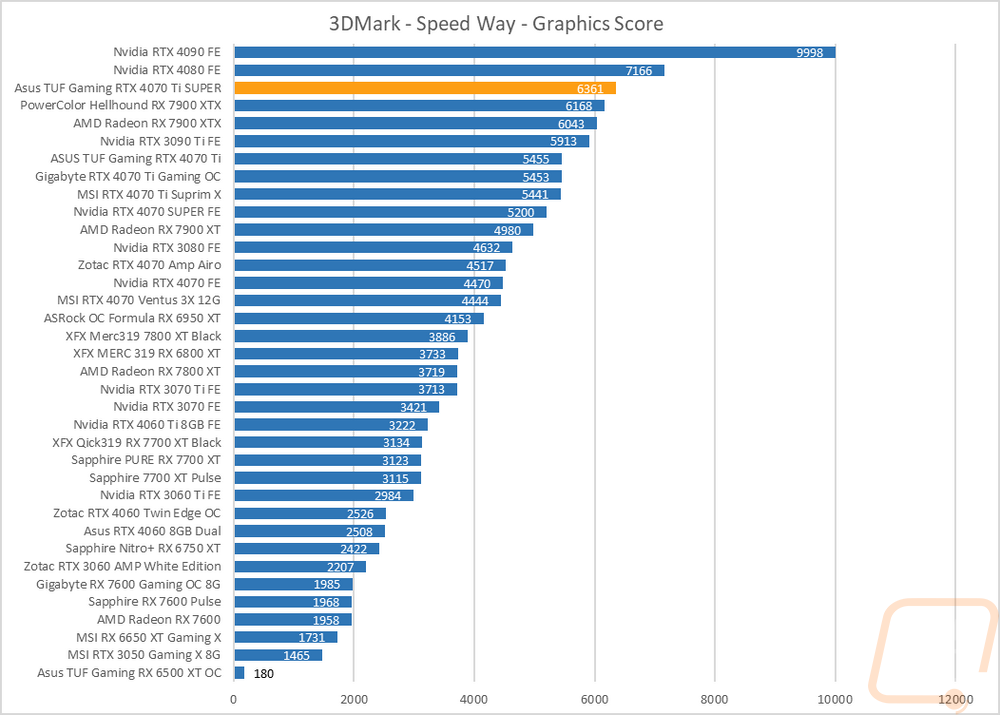
I did also test using the new 3DMark Speed Way which is their latest benchmark. Speed Way is DX12 as well but combines more future-focused tech like Ray Tracing which up until now 3DMark has only used in feature tests. Here the TUF Gaming RTX 4070 Ti SUPER outperformed even the RX 7900 XTX and is way out in front of the RX 7900 XT, outperforming it by 27.7%. The RTX 4080 is still 12.6% ahead of the TUF Gaming RTX 4070 Ti SUPER however showing that the 15% larger core count does mean something.
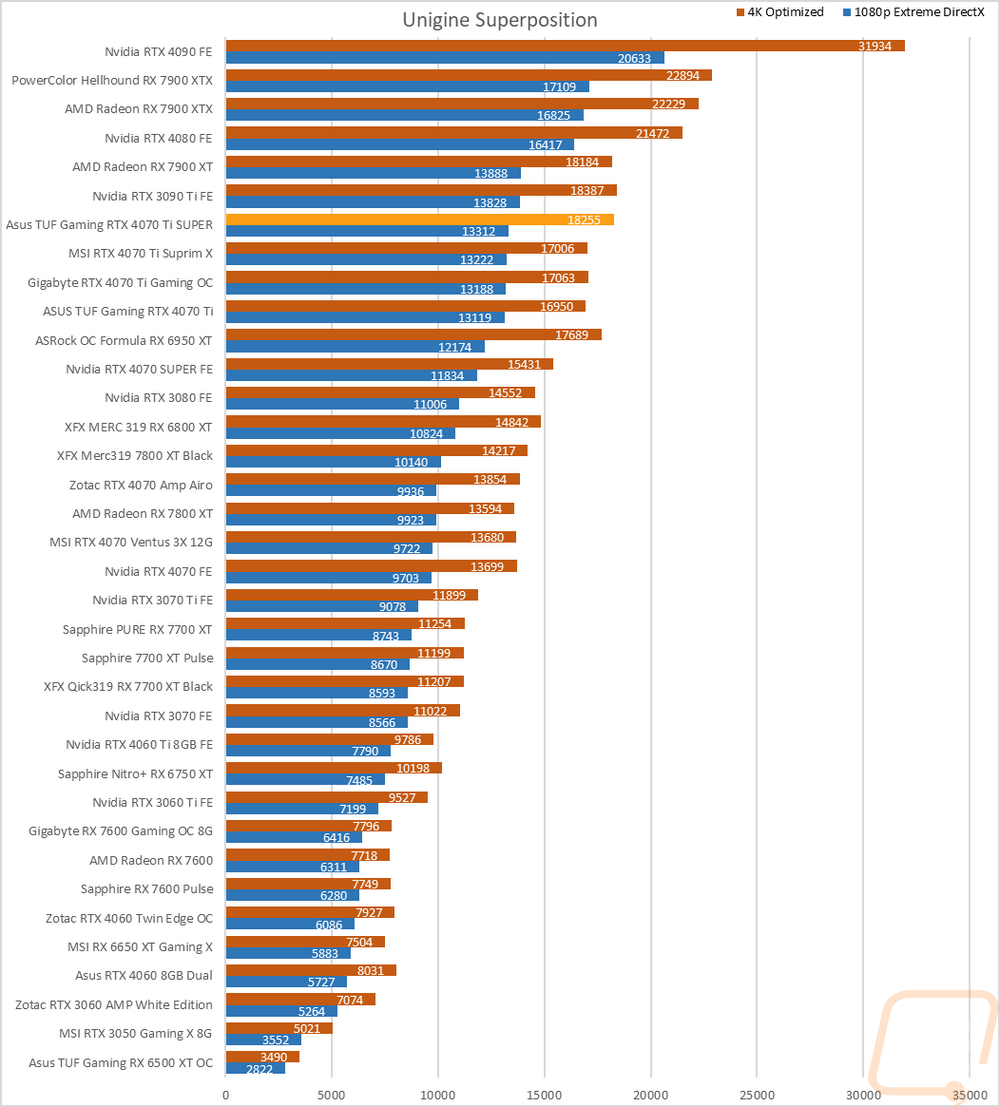
The last test was using the Unigine-based Superposition benchmark and I tested at 1080p with the extreme detail setting as well as the 4K optimized setting. In the extreme detail setting which is what I have this graph sorted as the TUF Gaming RTX 4070 Ti SUPER is sitting behind the RTX 3090 Ti and RX 7900 XT which are nearly tied and ahead of the overclocked RTX 4070 Ti’s that were previously tested with a small improvement. The 4K optimize test does a better job of showing the performance improvement including surpassing the RX 7900 XT.