Compute Benchmarks
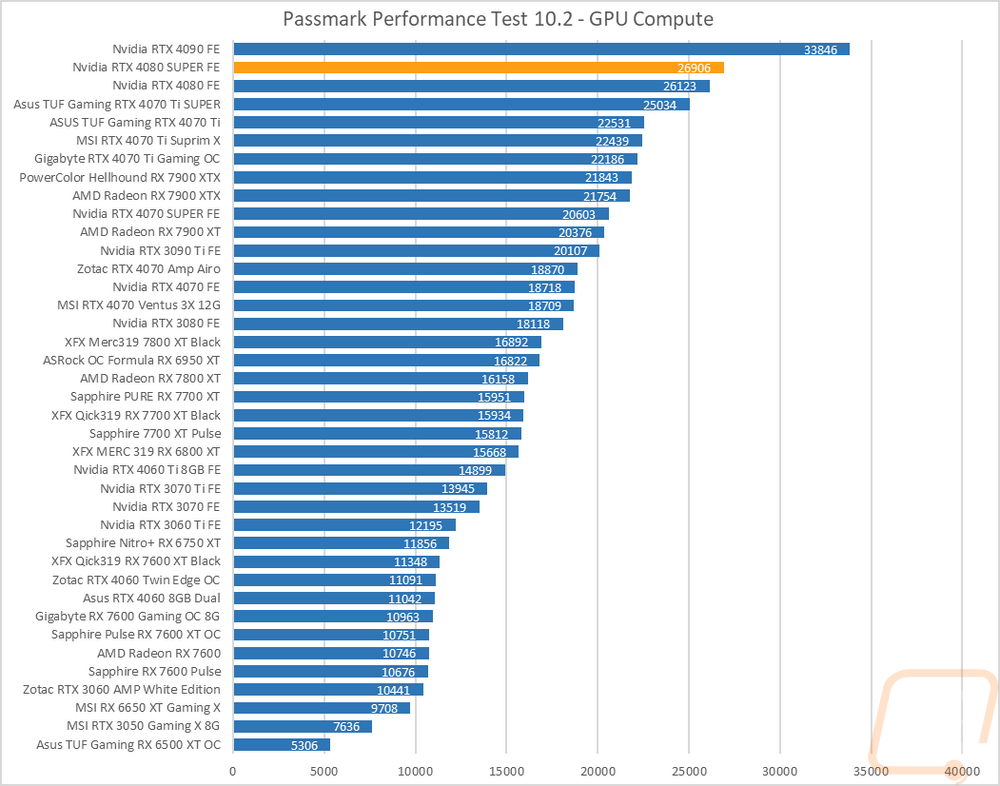
Now some people don’t need a video card for gaming, they need the processing power for rendering or 2D/3D production, or in some cases people who game also do work on the side. So it is also important to check out the compute performance on all of the video cards that come in. That includes doing a few different tests. My first test was a simple GPU Compute benchmark using PassMark's Performance Test 10 and the RTX 4080 SUPER Founders Edition came in second place to the RTX 4090. The RTX 4080 SUPER Founders Edition improved on the RTX 4080 score by 3% which is in line with what we have seen in other tests.
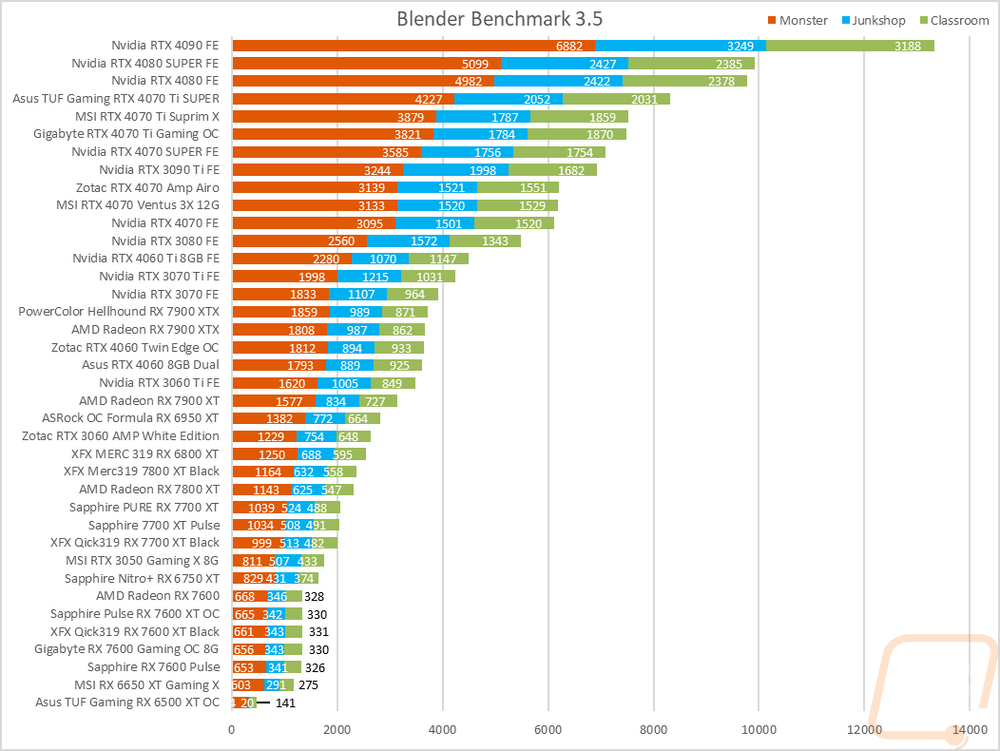
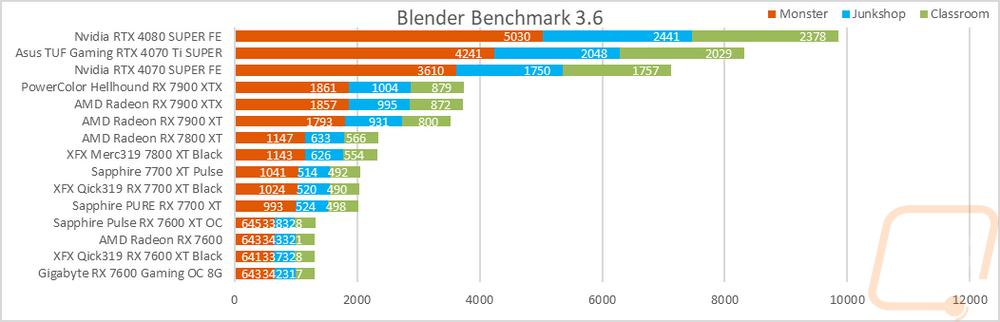
Blender has always been my favorite compute benchmark because the open-source 3D rendering software is very popular and it isn’t a synthetic benchmark. With the latest version of Blender, they redid the benchmark so we now have a new test that runs three different renderings and gives each a score. I have all three stacked together so we can see the overall performance. The RTX 4080 SUPER Founders Edition does improve on the RTX 4080 slightly but the big news here is just how far out in front the Nvidia cards are in general with even the flagship 7900 XTX back behind the RTX 3070.
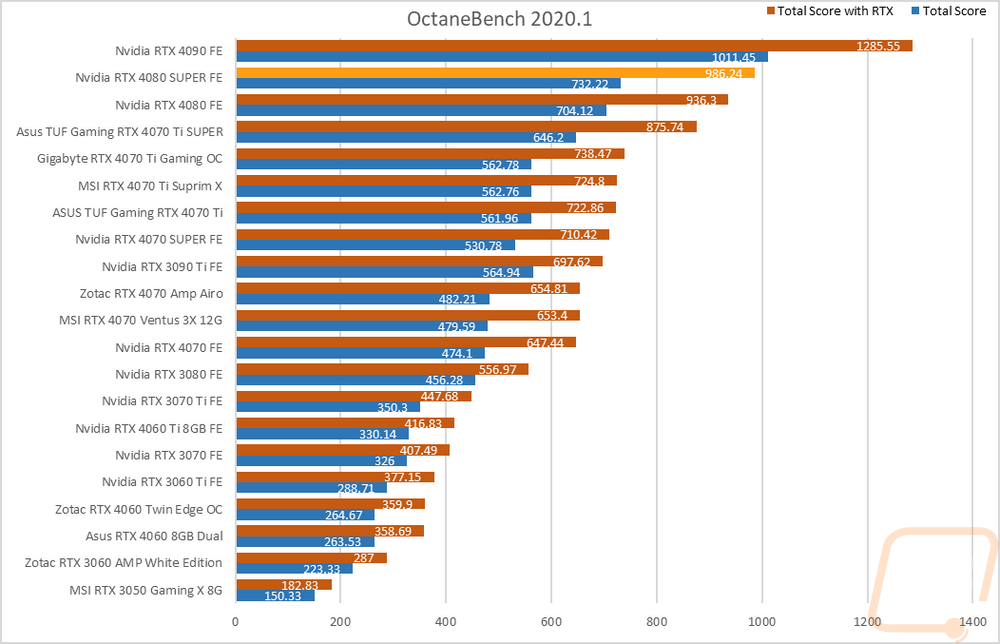
For CUDA-based cards, I also check out OctaneRender performance using their OctaneBench 2060.1 benchmark which allows me to check out both RTX and non-RTX rendering performance. Here the RTX 4080 SUPER Founders Edition improved on the RTX 4080 score by 5.3% on the RTX result and 4% on the non-RTX test.
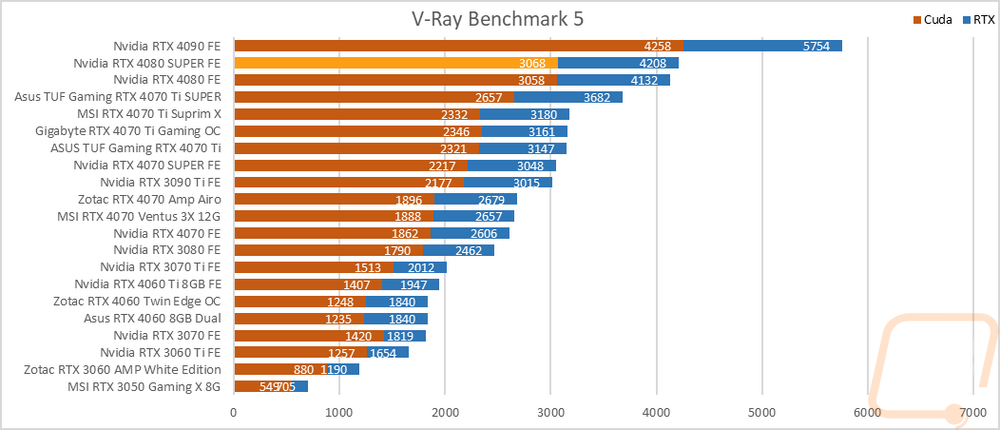
An additional CUDA-based test I also ran V-Ray Benchmark 5 to check out CUDA and RTX performance in the 3D rendering and simulation software. The RTX 4080 SUPER Founders Edition didn’t pull away from the RTX 4080 as much here with just a 1.8% improvement with RTX and just .3% on the CUDA test.