With Nvidia’s CES announcements, they announced three different GPUs all with the previously used SUPER designation. I took a look at the RTX 4070 SUPER as well as the RTX 4070 Ti SUPER but the crown jewel in all of this was of course the RTX 4080 SUPER. The RTX 4090 is still the flagship GPU from Nvidia nothing has changed there, but the RTX 4080 has always really been the gaming flagship with the RTX 4090 being there for people who want to show off and anyone who needs mind-blowing compute performance. So the introduction of the RTX 4080 SUPER was an exciting one especially with the new model coming in $200 less than the RTX 4080’s launch price which was a point of contention for a lot of people at its launch. So today I’m excited to dig in and see what sets the Nvidia RTX 4090 SUPER Founders Edition apart and see how it performs before we figure out how it fits in the ever-changing GPU market.
Product Name: Nvidia RTX 4080 SUPER Founders Edition
Review Sample Provided by: Nvidia
Written by: Wes Compton
Amazon Affiliate Link: HERE
What’s so SUPER
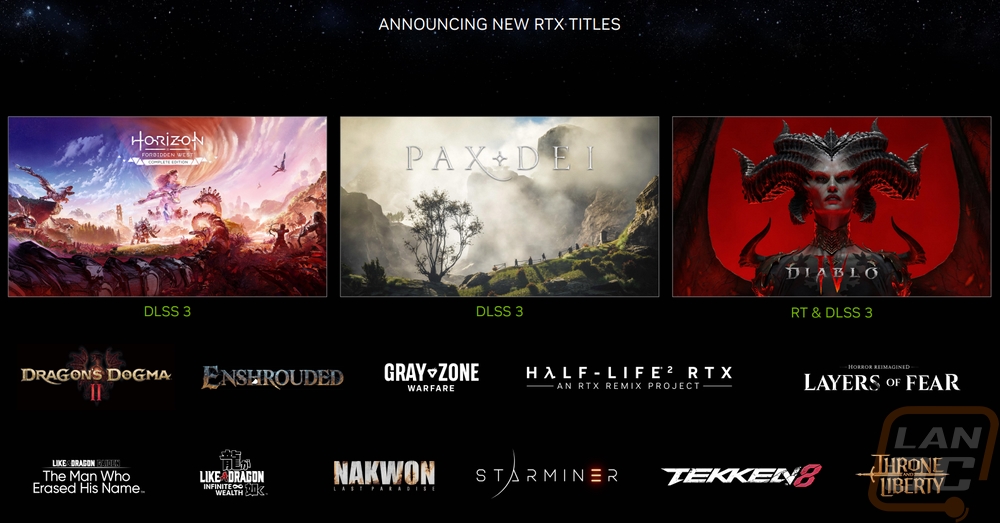
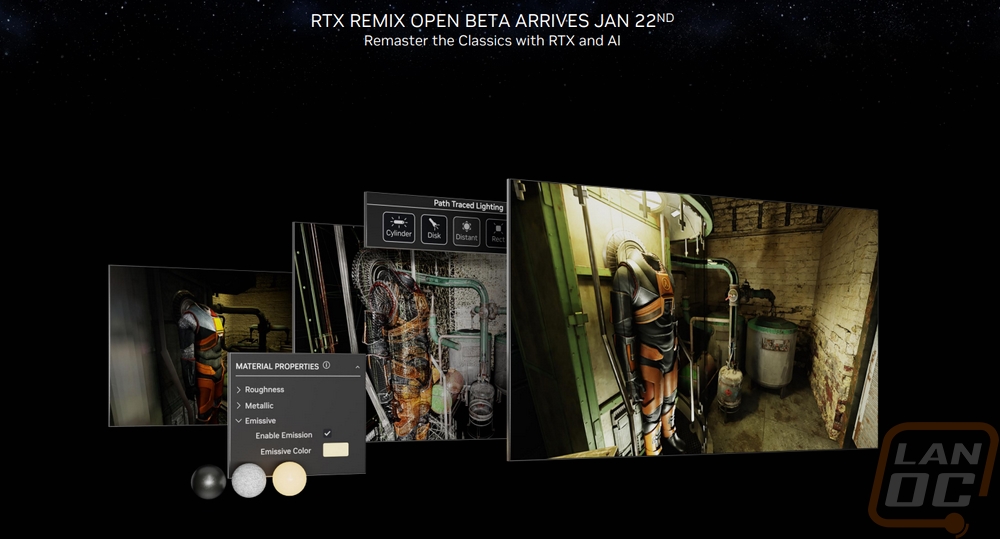
Nvidia’s CES announcements were all covered in their video but to hit a few highlights before getting into what the three new SUPER cards have to offer. They touched on a few new upcoming RTX supported titles. One of those is Half-Life 2 RTX which was done using the RTX Remix tool. That tool is going into open beta offering an easy way for modders and developers to upgrade past and current games to utilize RTX technology. Anything that makes it easier to do will only help get more support and in this case, we can potentially see upgraded games that we would have never seen otherwise which is exciting.
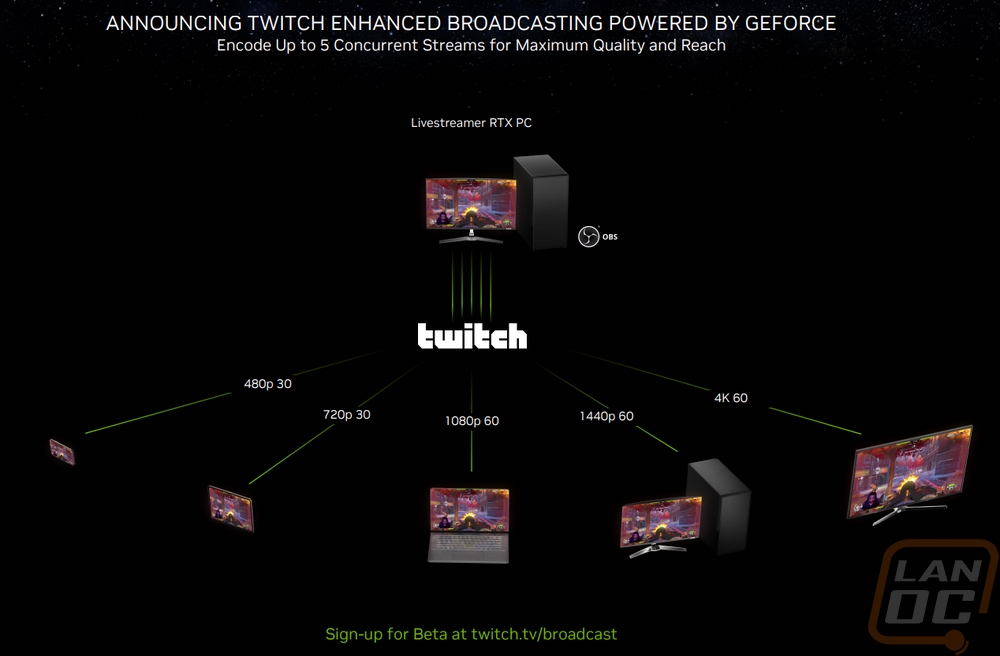
Nvidia and Twitch announced a new way for Twitch streamers to now offer a better range of resolutions. In the past, for anyone who isn’t one of their main partnered streamers you are stuck with just one resolution. This way you will be able to stream at a range of resolutions and frame rates. Viewers who have the bandwidth can enjoy better quality 4k 60 FPS streams but users on mobile or lower-performing internet connections will still be able to watch as well.
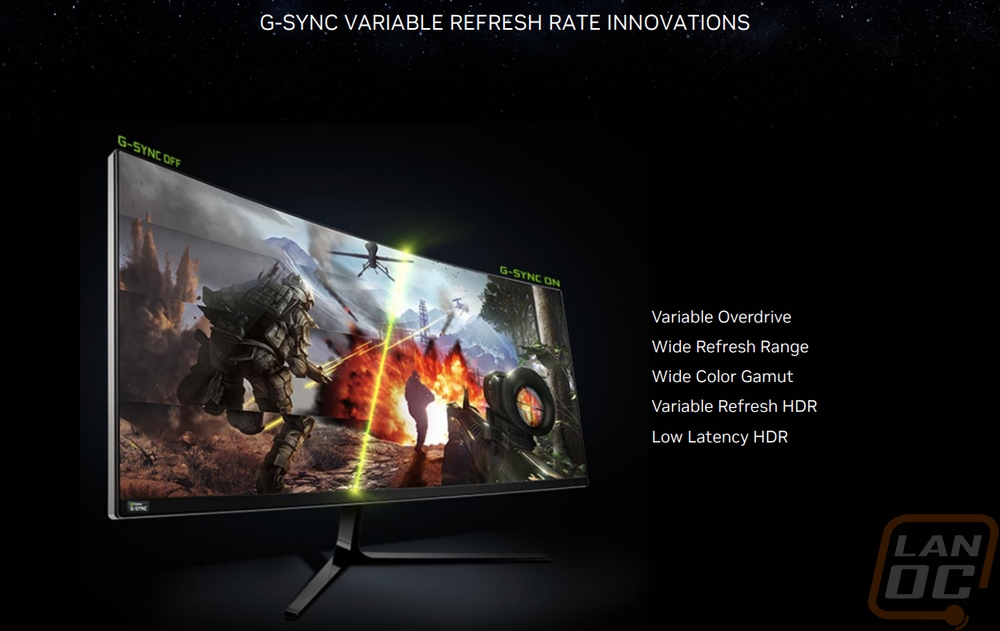
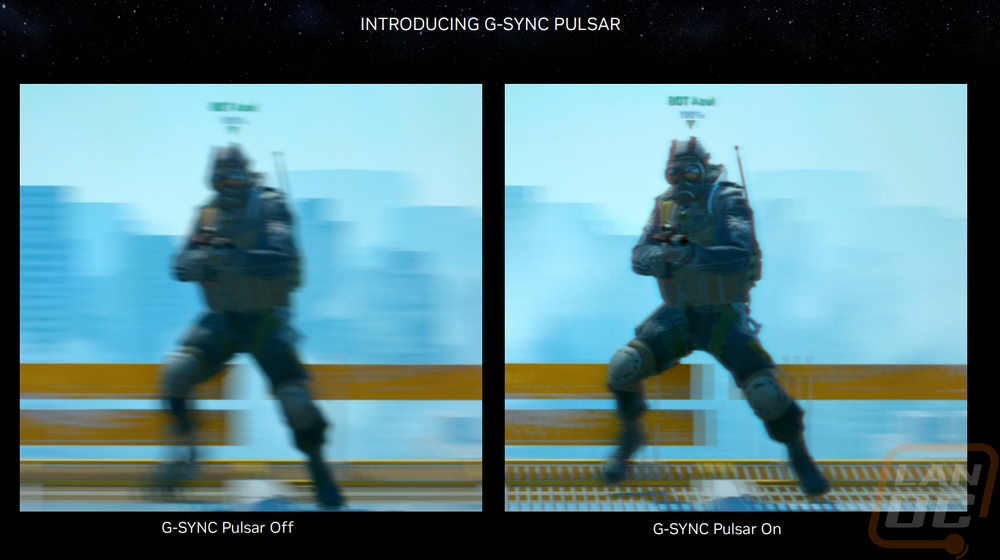
They announced improvements in G-Sync variable refresh rate. Along with that, they covered G-Sync Pulsar which is part of their VRR or variable refresh rate technology. Pulsar bridges the gap between using variable refresh rate and ultra low motion blur to get a smooth experience but cut out the blur that you can get with it.
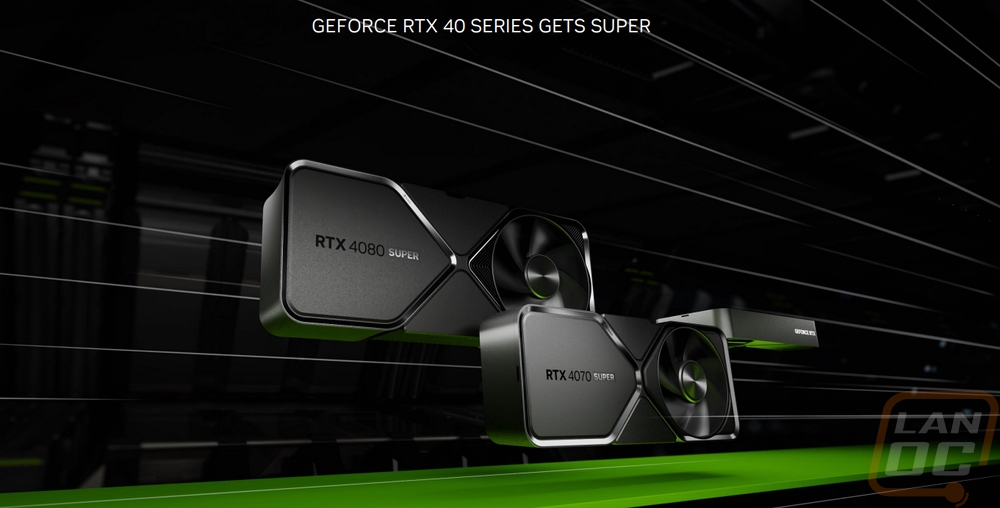
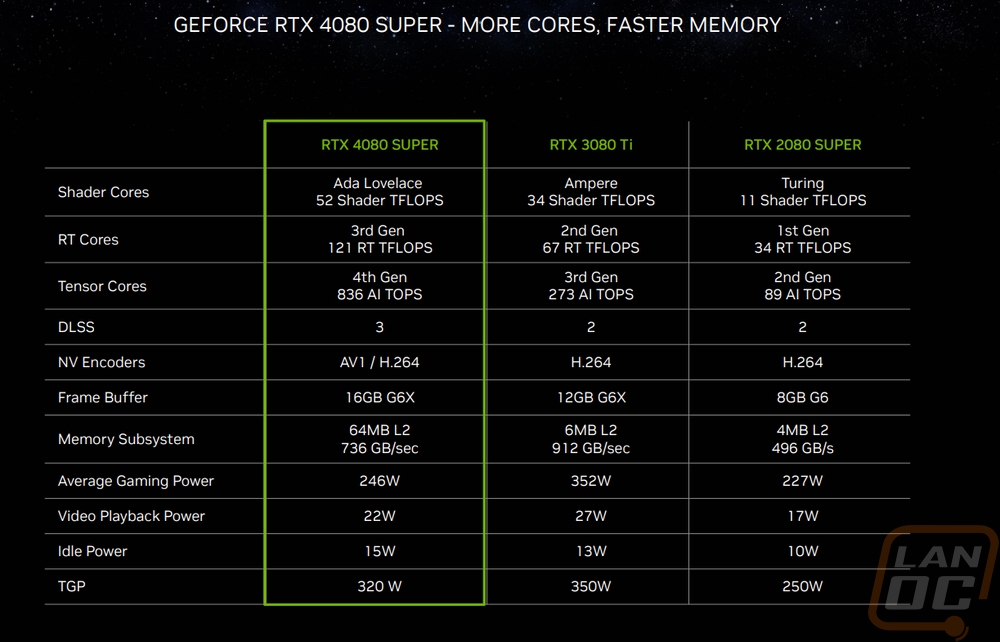
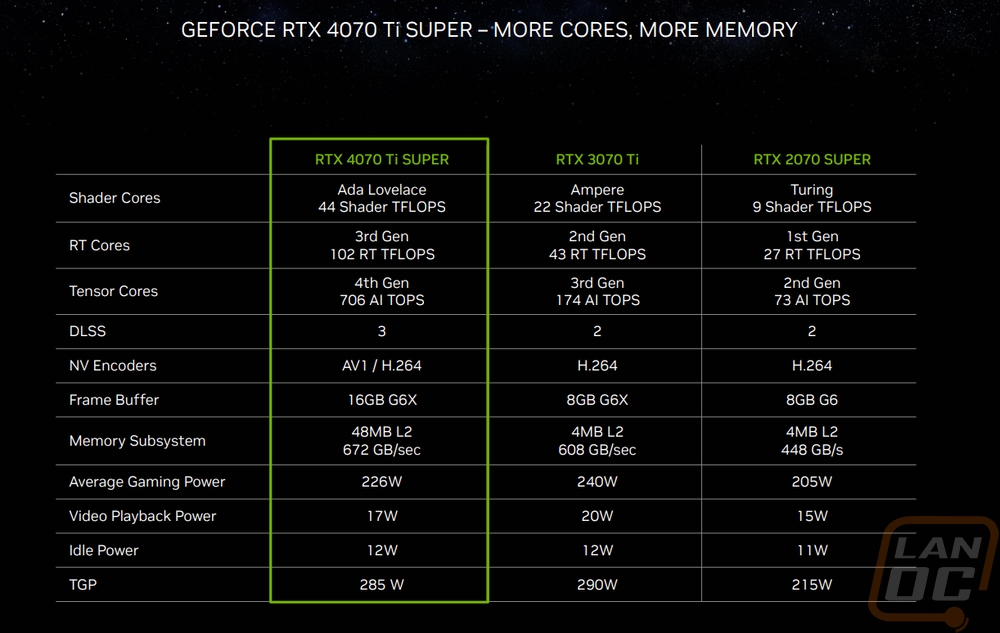
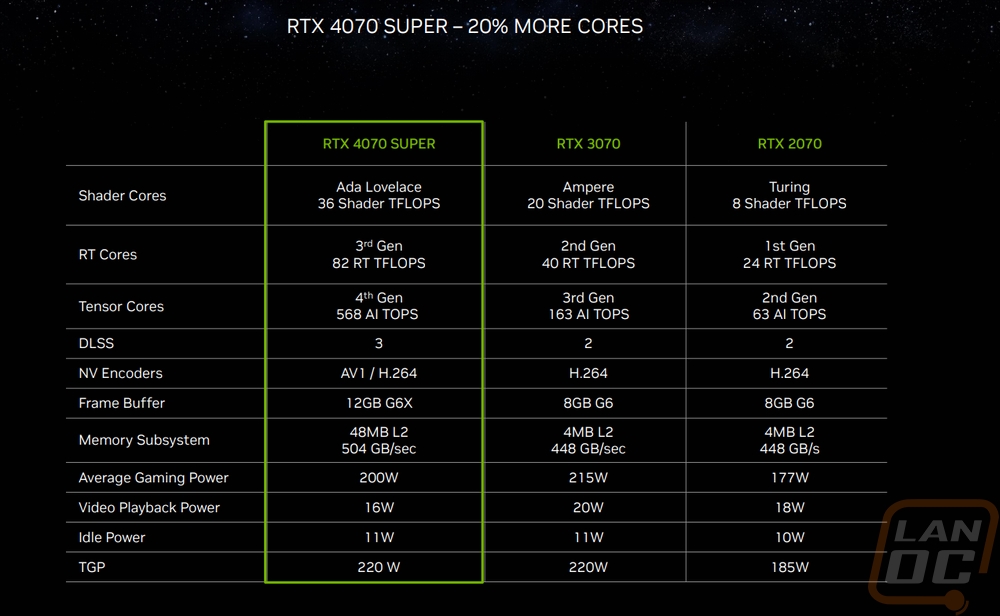
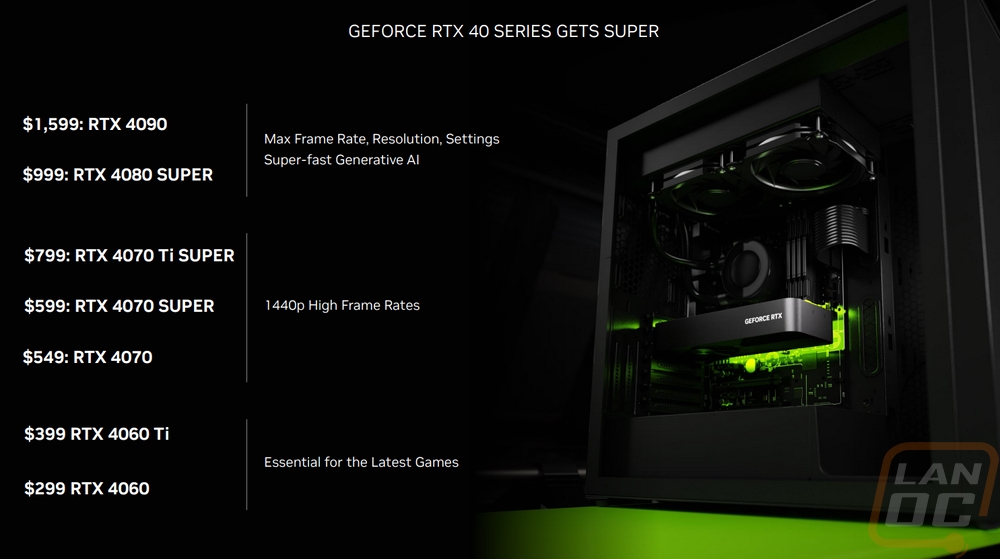
They then of course announced the three new SUPER cards and showed where all three will fit in their updated lineup. The RTX 4080 SUPER will replace the RTX 4080 and sit behind the RTX 4090 still. That will have an MSRP of $999, $200 less than the original MSRP of the RTX 4080. The new card has a faster base clock of 2295 MHz vs 2205 MHz on the 4080 and 40 MHz more on the boost clock with it now at 2550 MHz. The real improvement comes from more cores going from 9728 CUDA cores up to 10240. The RTX 4070 Ti SUPER replaces the RTX 4070 and has an MSRP of $799, the same as the original launch price of the RTX 4070. It gets a memory clock speed improvement but like with the 4080 SUPER, it's big improvements with the CUDA core count jumping up from 7680 up to 8448 which is a big improvement. With all of these cards, the tensor cores and RT cores will also scale up at the same rate as the CUDA cores as well. Lastly the RTX 4070 SUPER doesn’t replace the original RTX 4070, the original is staying in the lineup. The 4070 will now be $549, $50 less than its launch price and the RTX 4070 SUPER takes up that $599 price point and fits in between the 4070 and 4070 Ti SUPER. The CUDA core count goes from 5888 up to 7168, a 21.7% improvement and the same boost and memory clock speeds. Nvidia did bump up the power usage slightly with the 4070 SUPER now having a TGP of 220 Watts to the 200 Watts on the 4070, the 4080 SUPER and 4070 Ti SUPER both stay the same at 285 Watts and 320 watts respectively. Overall though I like that as a refresh the focus is on adding more cores, not cranking up clock speeds which we have seen with things like the RX 480 to RX 580.
|
Specifications |
RTX 4070 Ti SUPER |
RTX 4080 |
RTX 4080 SUPER |
RTX 4090 |
|
Graphics Processing Clusters |
6 |
7 |
7 |
11 |
|
Texture Processing Clusters |
33 |
38 |
40 |
64 |
|
Streaming Multiprocessors |
66 |
76 |
80 |
128 |
|
CUDA Cores |
8448 |
9728 |
10240 |
16384 |
|
Tensor Cores |
264 (4th Gen) |
304 (4th Gen) |
320 (4th Gen) |
512 (4th Gen) |
|
RT Cores |
66 (3rd Gen) |
76 (3rd Gen) |
80 (3rd Gen) |
128 (3rd Gen) |
|
Texture Units |
264 |
304 |
320 |
512 |
|
ROPs |
96 |
112 |
112 |
176 |
|
Boost Clock |
2610 MHz |
2505 MHz |
2295 MHz |
2520 MHz |
|
Memory Clock |
1313 MHz |
1400 MHz |
1438 MHz |
1313 MHz |
|
Memory Data Rate |
21 Gbps |
22.4 Gbps |
23 Gbps
|
21 Gbps |
|
L2 Cache Size |
48 MB |
64 MB |
64 MB |
72 MB |
|
Total Video Memory |
16 GB GDDR6X |
16 GB GDDR6X |
16 GB GDDR6X |
24 GB GDDR6X |
|
Memory Interface |
256-bit |
256-bit |
256-bit
|
384-bit |
|
Total Memory Bandwidth |
672 GB/sec |
1008 GB/sec |
736 GB/s |
1008 GB/s |
|
Texture Rate (Bilinear) |
689 GigaTexels/second |
761.5 GigaTexels/second |
816 GigaTexels/second |
1290.2 GigaTexels/second |
|
Fabrication Process |
4N NVIDIA Custom Process |
TSMC 4N NVIDIA Custom Process |
4N NVIDIA Custom Process |
TSMC 4 nm NVIDIA Custom Process |
|
Transistor Count |
45.9 Billion |
45.9 Billion |
45.9 Billion
|
76.3 Billion |
|
Connectors |
3 x DisplayPort 1 x HDMI |
3 x DisplayPort 1 x HDMI |
3 x DisplayPort 1 x HDMI
|
3 x DisplayPort 1 x HDMI
|
|
Power Connectors |
2x PCIe 8-pin cables (adapter in box) OR 300 W or greater PCIe Gen 5 cable |
3x PCIe 8-pin cables (adapter in box) OR 1x 450 W or greater PCIe Gen 5 cable |
3x PCIe 8-pin cables (adapter in box) OR 450 W or greater PCIe Gen 5 cable |
3x PCIe 8-pin cables (adapter in box) OR 450 W or greater PCIe Gen 5 cable |
|
Minimum Power Supply |
700 Watts |
750 Watts |
750 Watts |
850 Watts |
|
Total Graphics Power (TGP) |
285 Watts |
320 Watts |
320 Watts |
450 Watts |
|
Maximum GPU Temperature |
90° C |
90° C |
90° C
|
90° C
|
|
PCI Express Interface |
Gen 4 |
Gen 4 |
Gen 4 |
Gen 4 |
|
Launch MSRP |
$799 |
$1199 |
$999 |
$1599 |
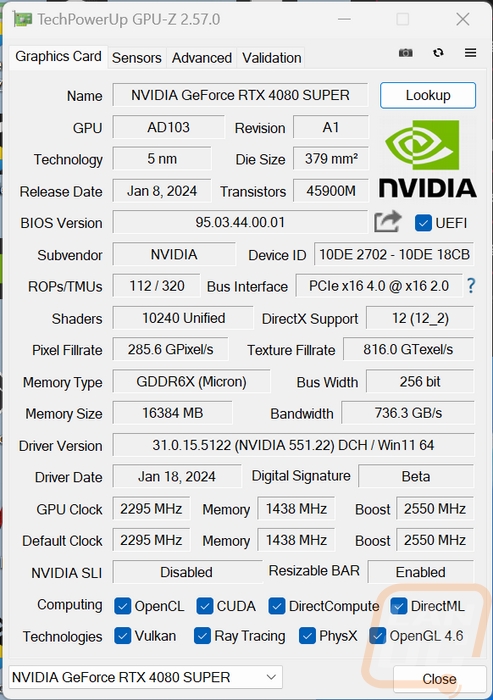
Before getting into testing I also ran GPUz to double-check that our clock speeds match up with the specifications. In this case, the RTX 4080 SUPER Founders Edition is of course the stock clocks but I did want to double check to make sure. GPUz also documents the driver used for testing which is 551.22 and the BIOS version as well in case that is needed in the future.
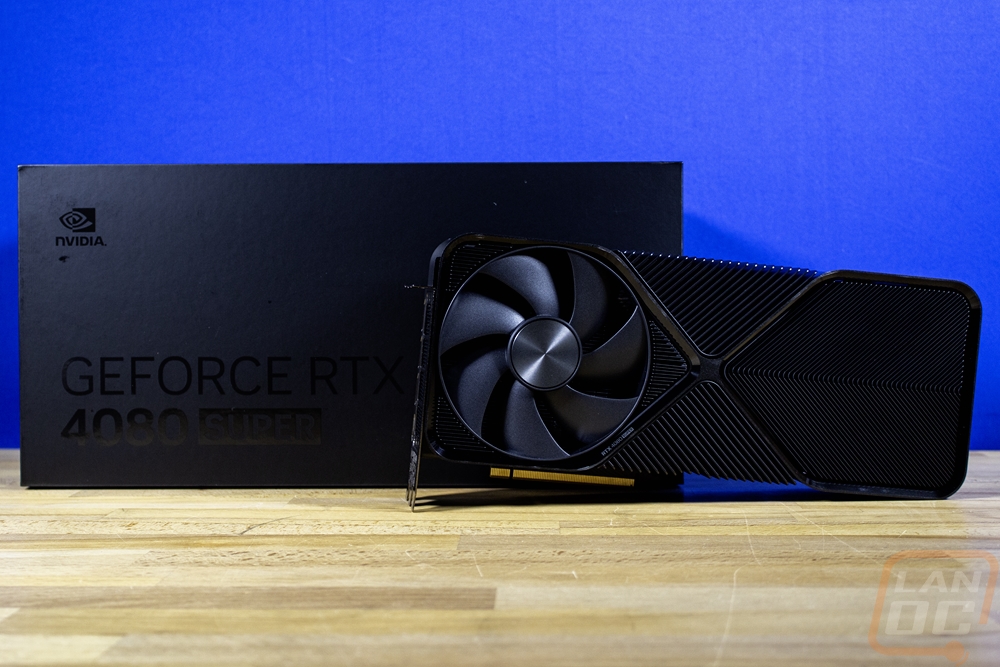
Packaging
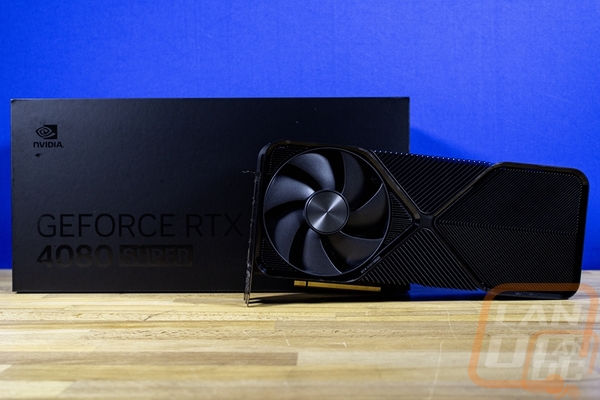
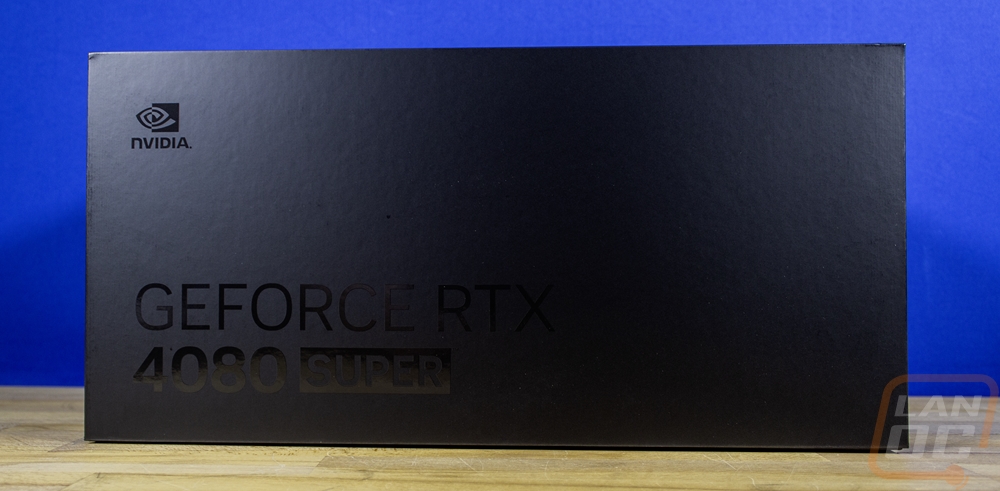
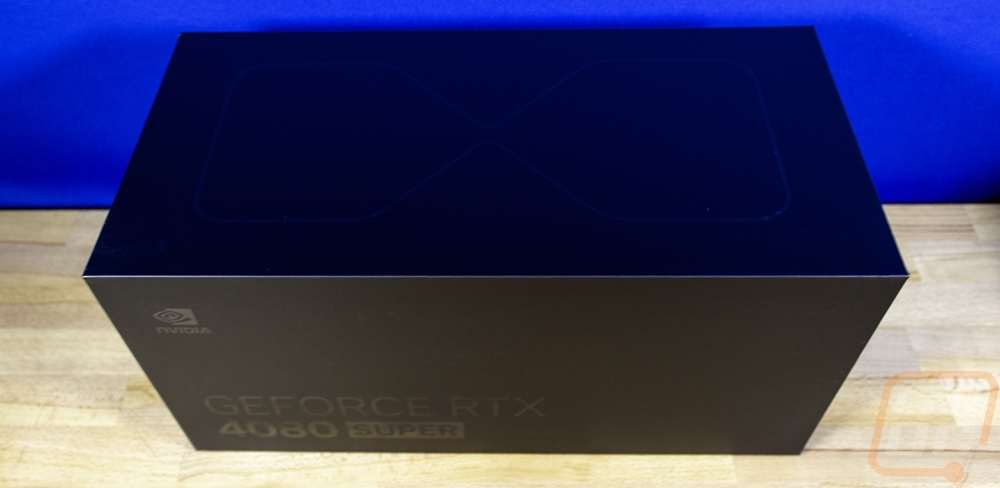
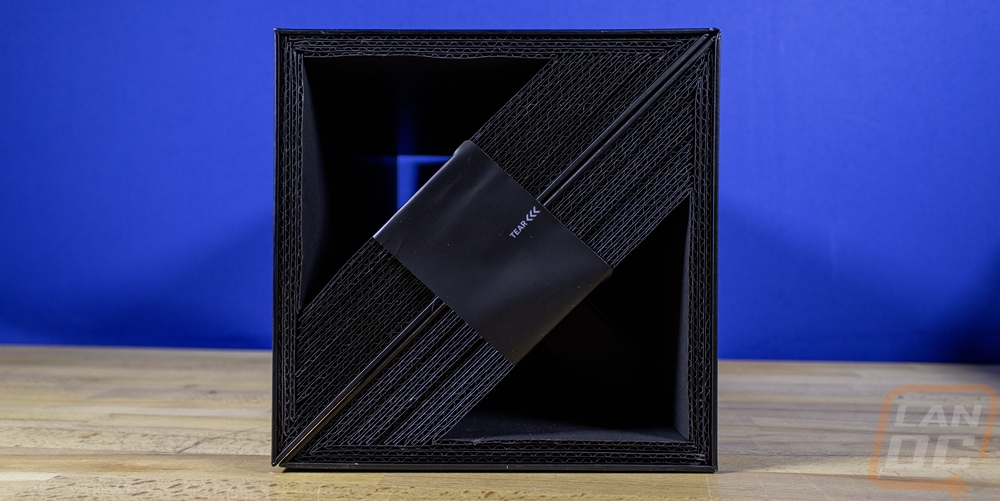
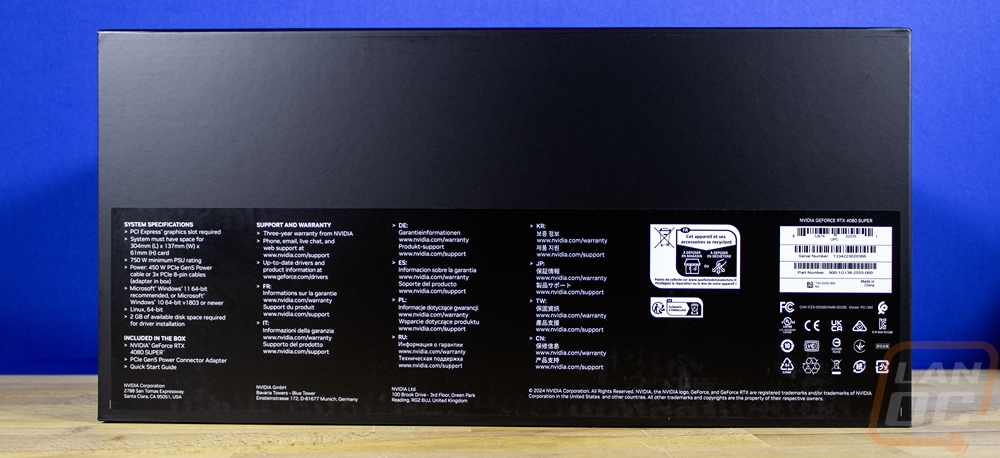
The box for the Nvidia RTX 4080 SUPER Founders Edition isn’t any different than the rest of the 4000 series Founders Editon cards. But even still each time I see them is still as exciting. With Nvidia being able to not have the bright green wrap around and their unique packaging that is nothing like any other cards you get the full experience when you get a Founders Edition card. The box is black and the front has the Nvidia logo and 4080 SUPER branding but all of that is printed in gloss black so it is only visible when the light hits it. Up on top, they have the hourglass shape of the card. Then on the back, they have a black sticker with the system requirements, a list of what is in the box, the certification logos, and of course the UPC and serial number bar codes. What makes this box different though is the view from the side. You can see it is all made out of corrugated plastic and there are large holes where you can see all the way through the box. Each side has a tear-off sticker which is the only thing keeping you from opening up the box. Even the box that Nvidia ships this in is custom fit to the box size and opens up differently with the thick slide-open sides.
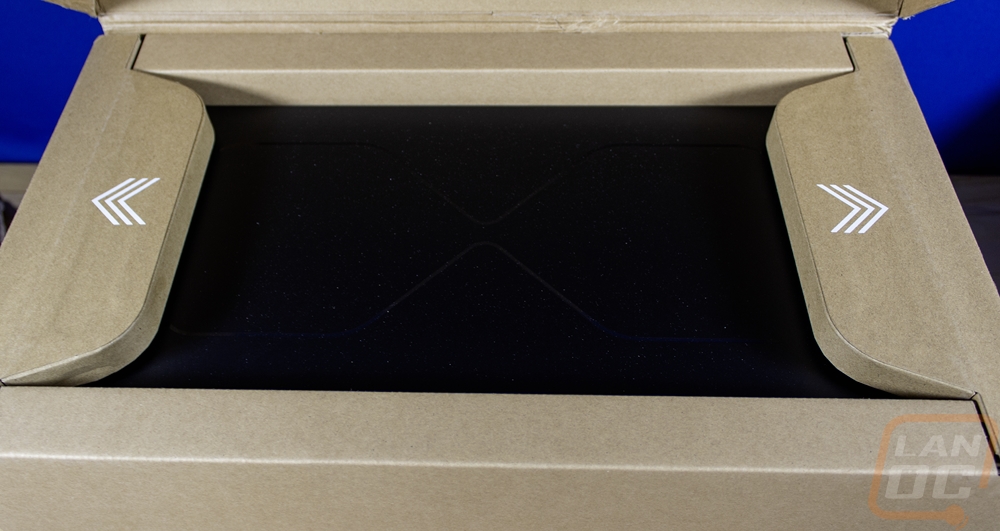
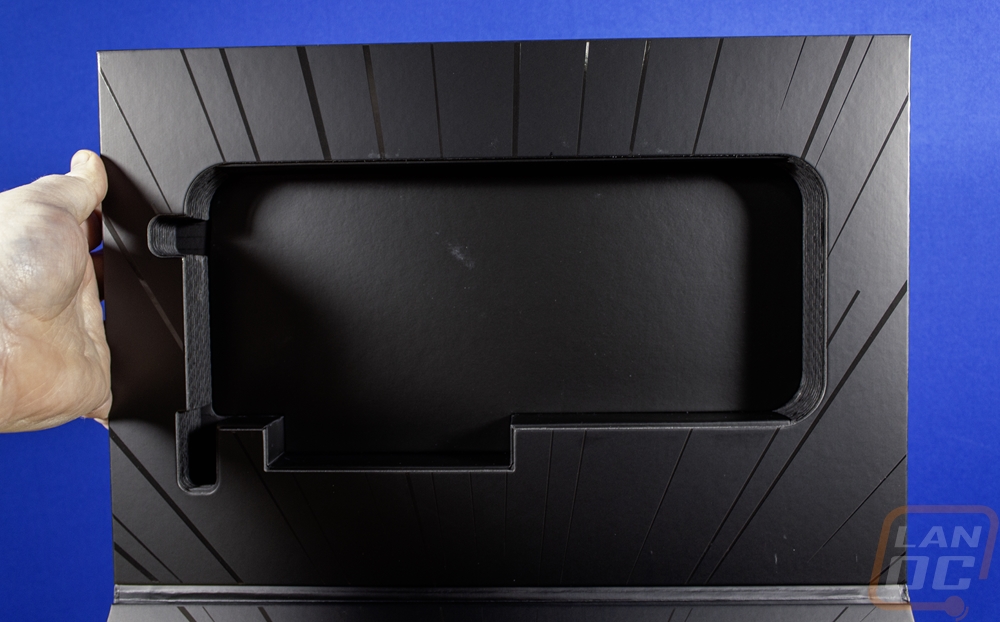
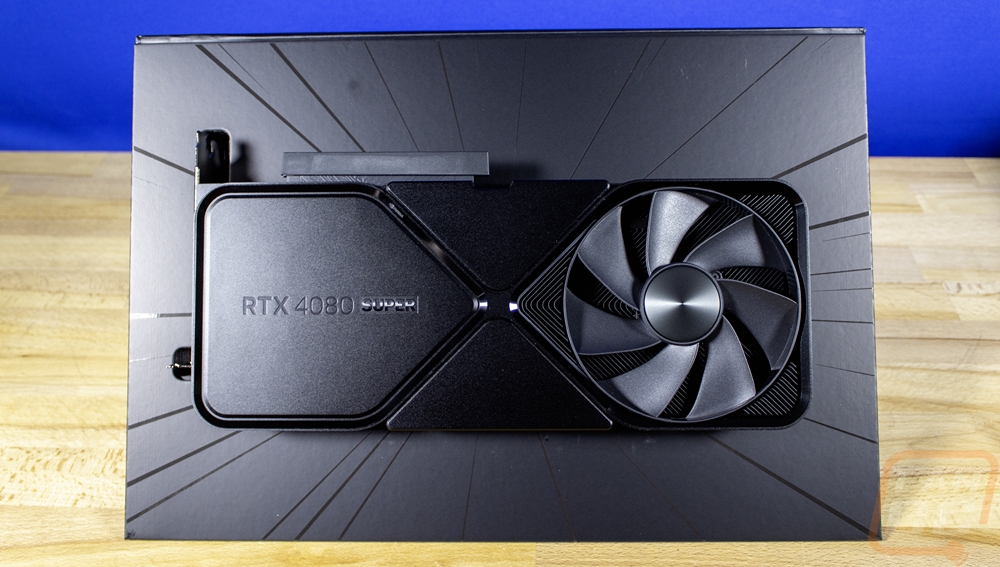
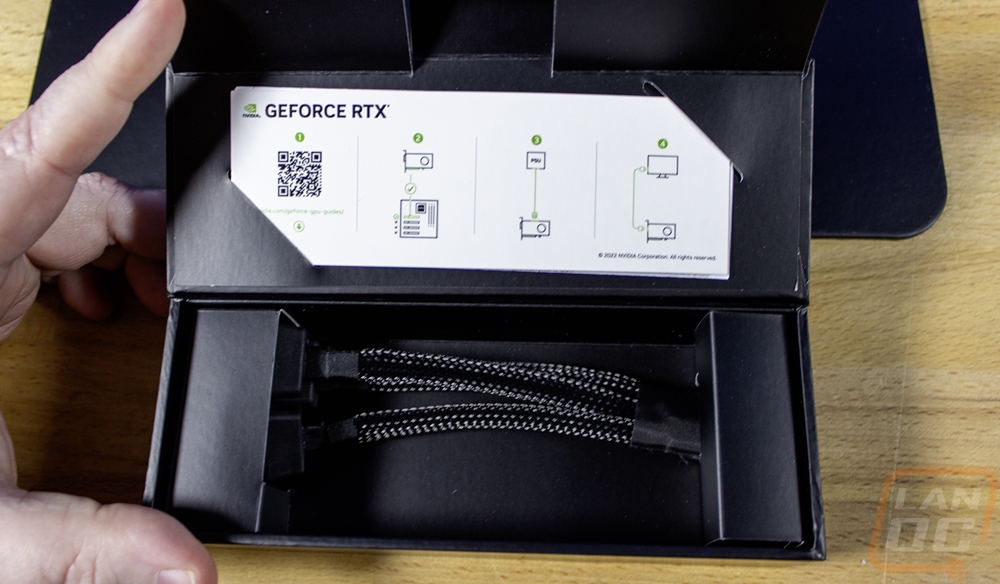
When you open the box up there are two halves, both have a cutout shaped to the card with cardboard on the inside which is black with gloss black streaks across it. When you open it all up the RTX 4080 SUPER Founders Edition is sitting right there without any static protective bags or anything around it like it is being displayed. The PCIe slot does have a cover on it and the display connections have plugs in them, that’s about it. When when you pull the card out there is another cardboard panel and a pull tab that pulls out a small box with the accessories and documentation inside.
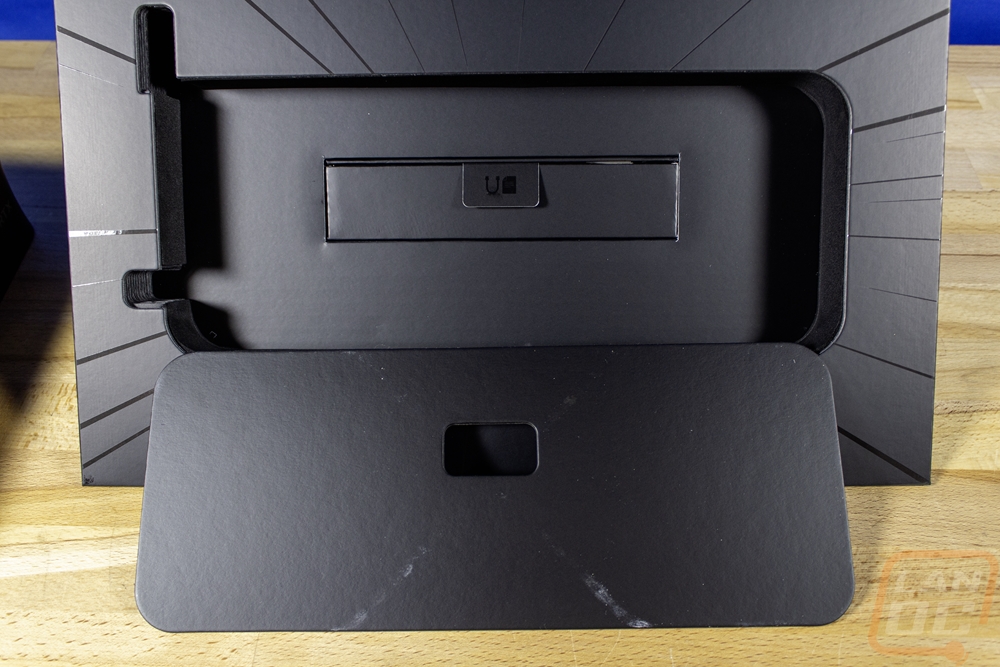
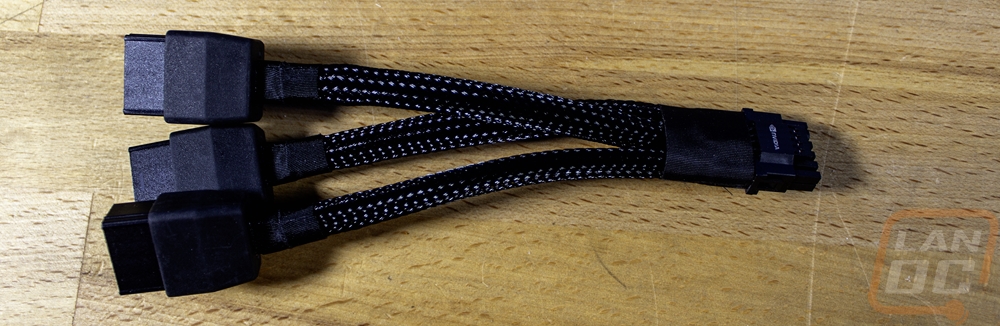
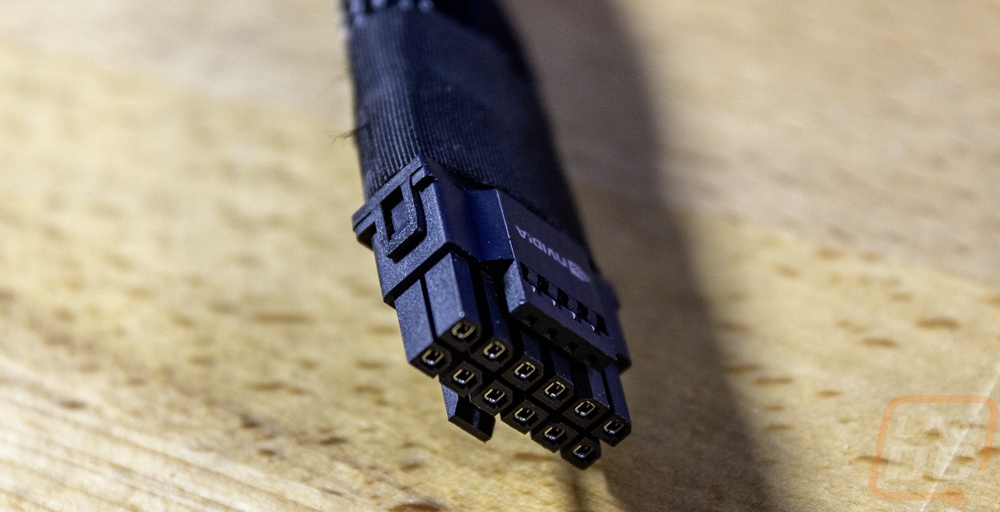
The RTX 4080 SUPER Founders Edition doesn’t come with much but that small box has a drawing showing basic steps on installing the card and has a QR code to get drivers and better installation instructions. Then inside of the box is the single accessory, the power adapter. This one has three 8-pin PCIe plugs on one end and the new 12VHPWR connection that the RTX 4080 SUPER Founders Edition uses on the other end. Each cable is sleeved in black sleeving and behind the plug it has been taped.
Card Layout and Photos
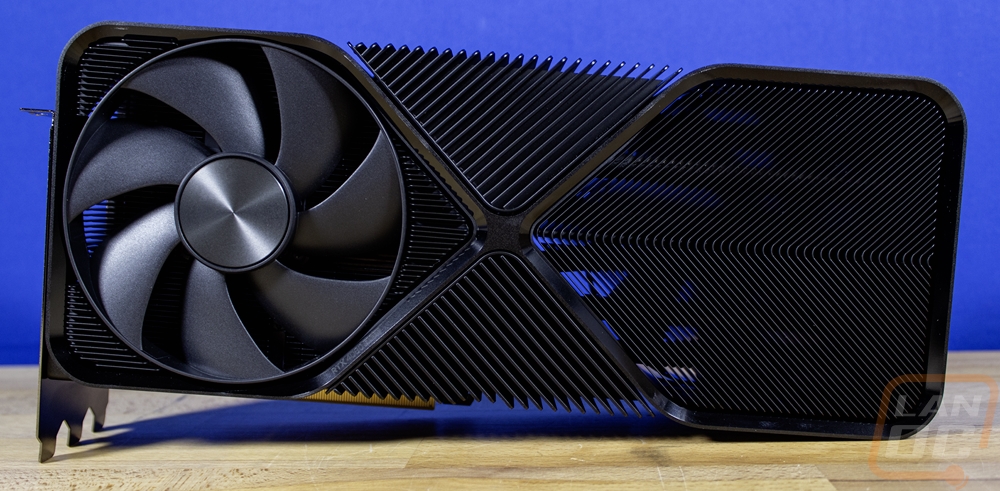
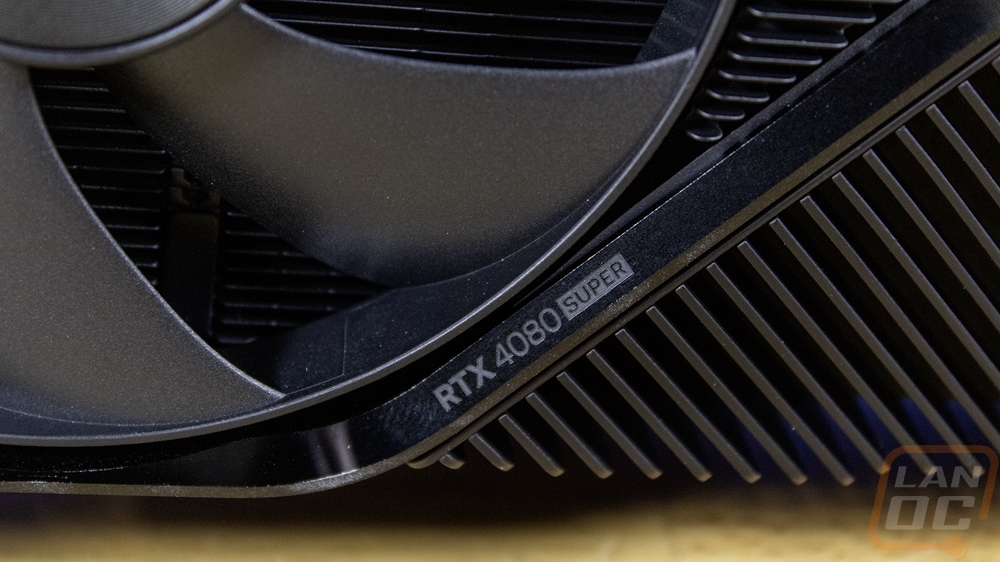
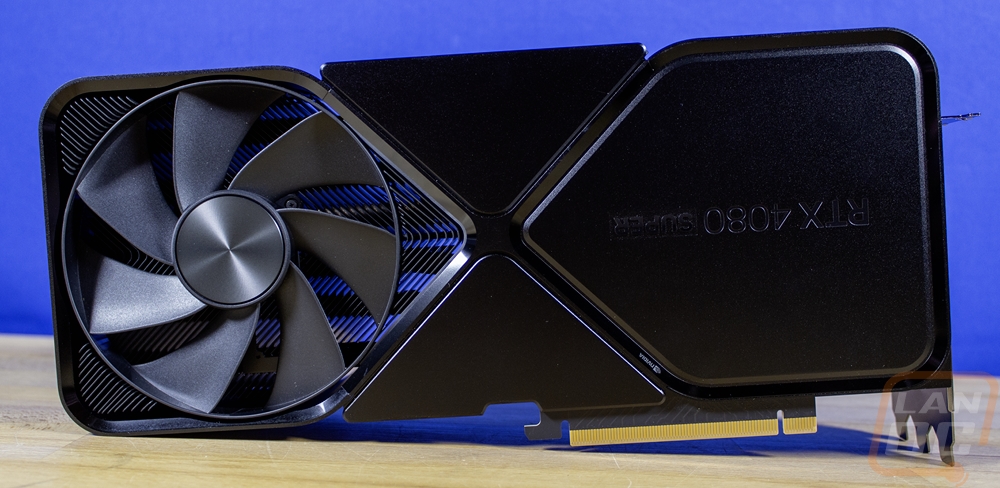
Well here is it in all of its glory, the new RTX 4080 SUPER Founders Edition, and like with the RTX 4070 SUPER Founders Edition Nvidia hasn’t changed much at all. In fact with the exception of the model number changing on the card, visually this is the same design that the RTX 4080 and RTX 4090 coolers have. The one big change of course is the card being blacked out. Where the non-SUPER cards have had a dark silver or grey combined with black heatsinks the RTX 4080 SUPER Founders Edition has it all blacked out. I mentioned it in the 4070 SUPER coverage but while I love this in black, it does really make me want to see what an all-white Founders Edition would look like as well. I’m not sure that I could handle adding another adjective to the model name to get that sort of special edition.
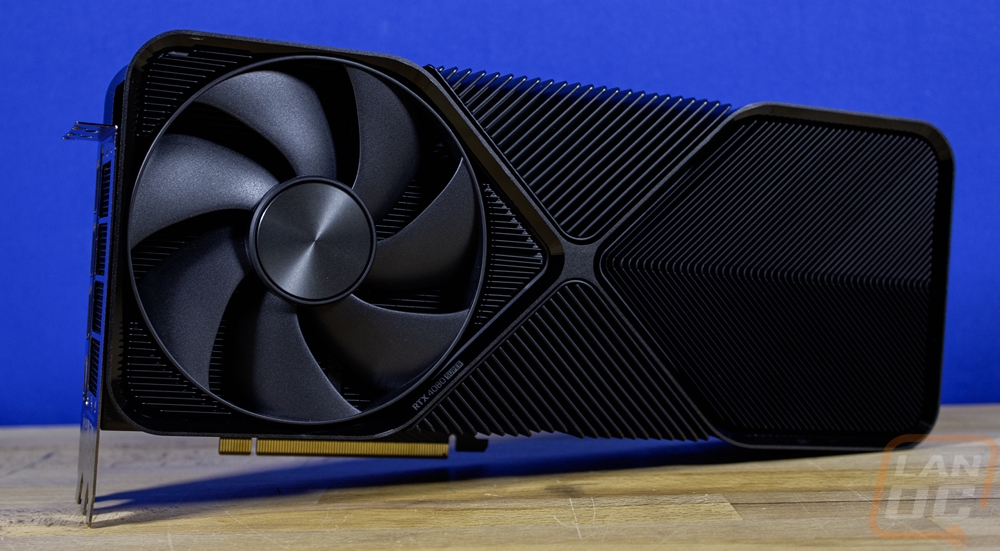
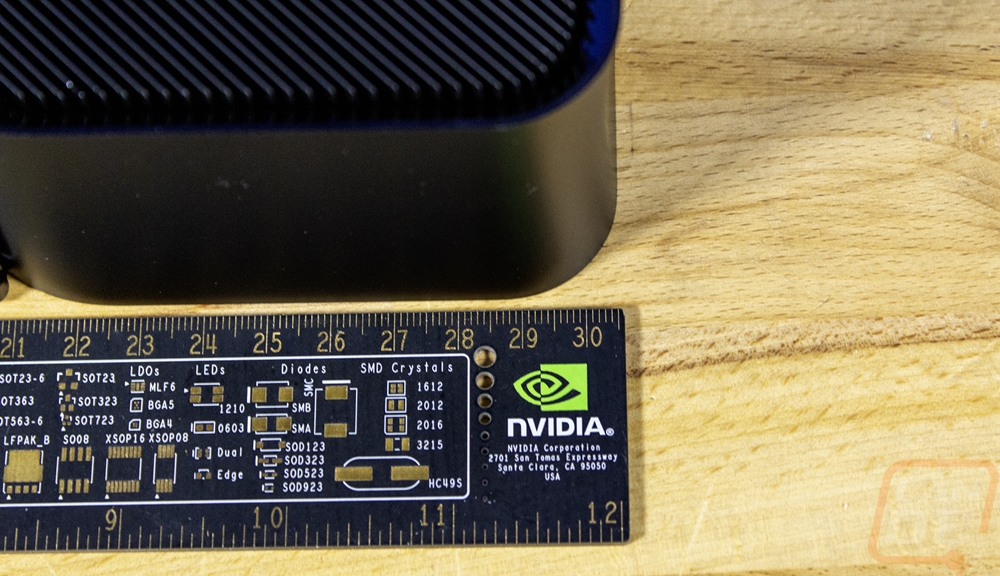
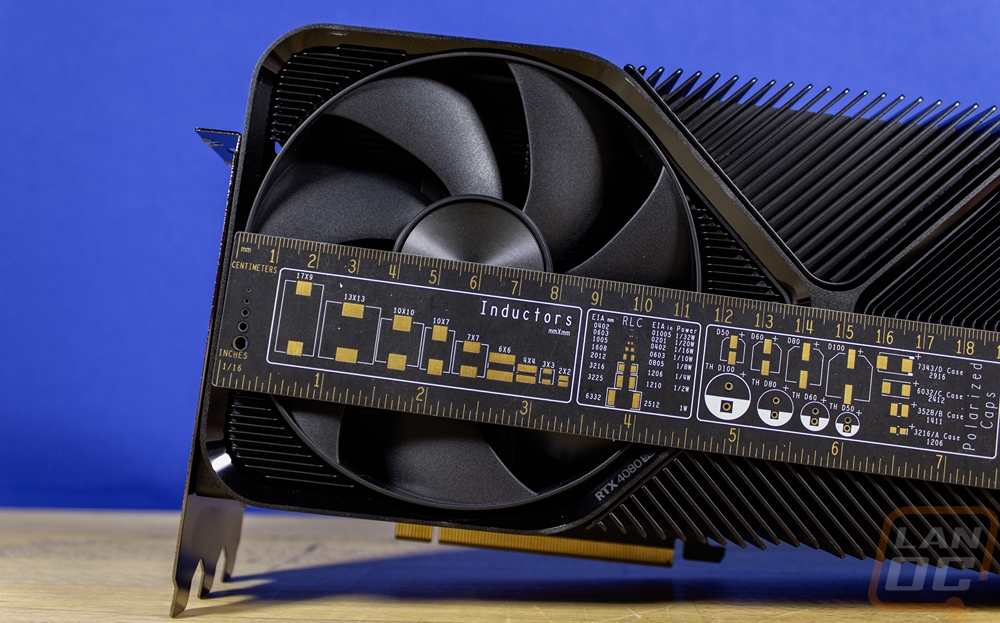
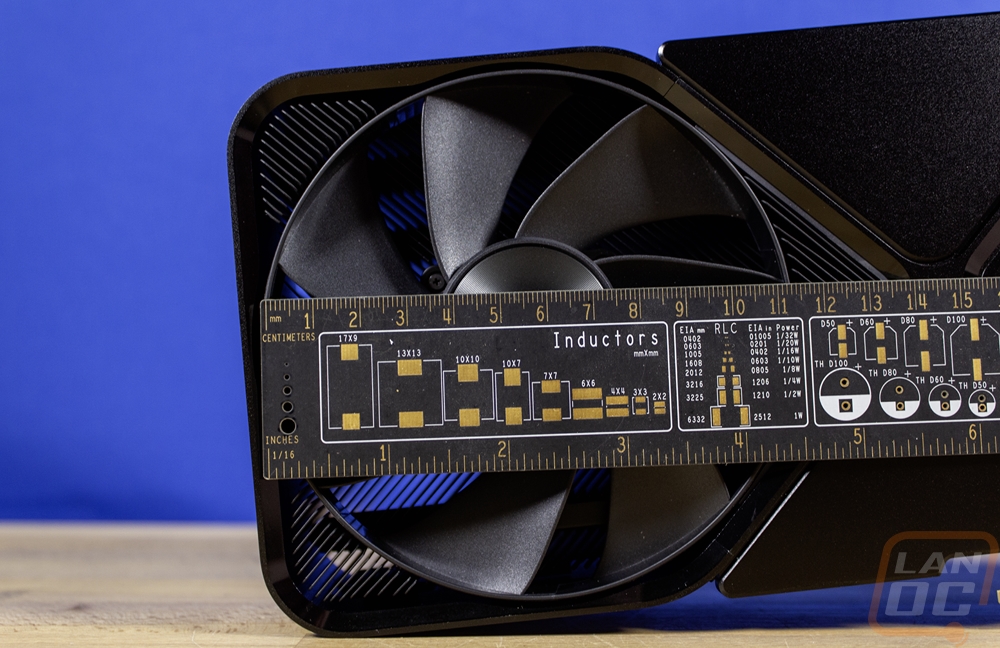
The RTX 4080 SUPER Founders Edition has the exact same dimensions as the RTX 4080 and RTX 4090 and if you haven’t seen these cards before they are very large. It is 310 mm long, 140 mm tall, and 61 mm thick. This is just a hair past the standard triple slot thickness but the extra thickness is on the back of the card so if you needed to put something close it shouldn’t be an issue. The height shows with the 25mm above the PCIe bracket which by the way you can spot Nvidia being sneaking with their cooling by slipping in a hole there above the bracket. Then the card length is beyond the length of our 12-inch long ruler just barely. Interestingly though the card doesn’t lose its scale, because it is larger in every dimension it just looks like one of the smaller Founders Edition cards has grown up.
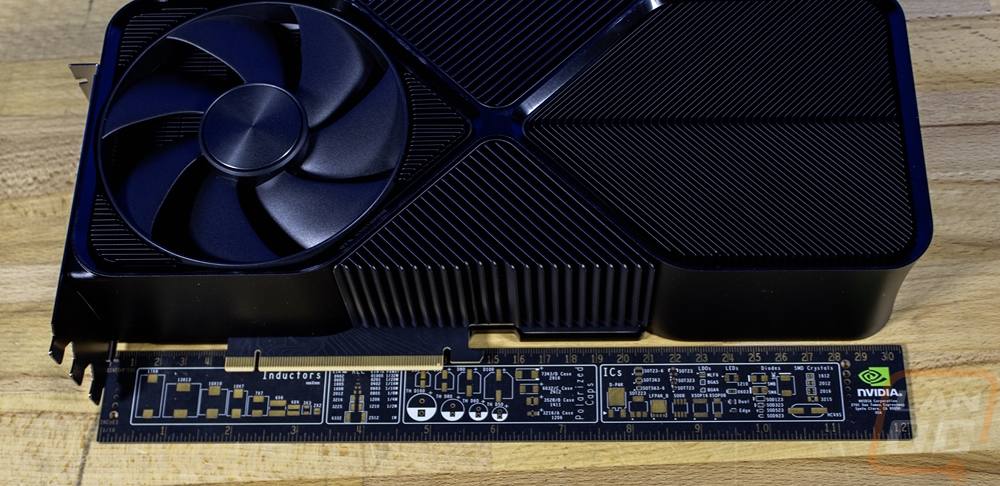
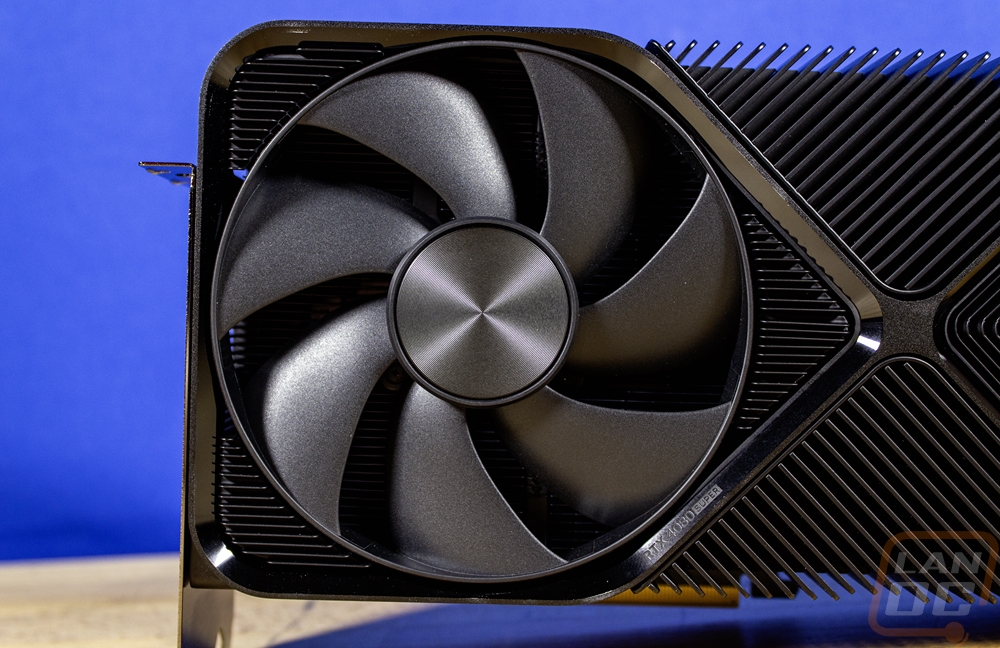
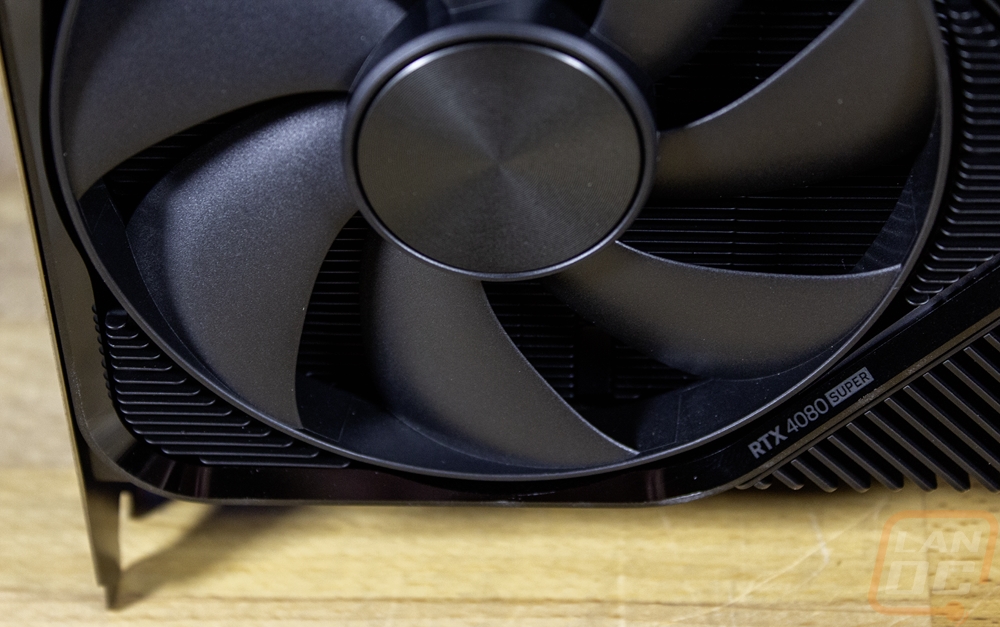
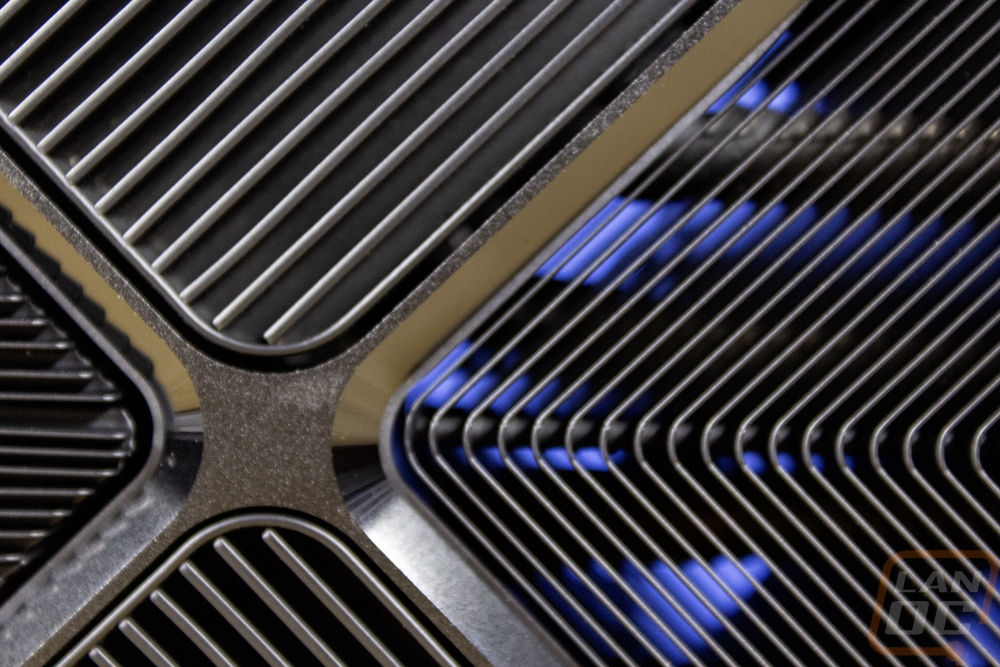
So the packaging hints at it and all of the 3000 and 4000 Series Founders Edition cards have had it but the card design has an hourglass shape designed into the heatsink and housing along with a completely exposed heatsink. The hourglass shape can be seen on the sides as a ring around the outside that dives in with the X shape in the middle. This has the RTX 4080 SUPER model name up under the fan laser etched into it. This is more than a ring though, at the top, bottom, and ends the ring carries through and to the back. The heatsink consists of two different kinds of heatsinks, a thin aluminum sheetmetal style heatsink which can be seen under the fan and around the fan as well as on the right side. Then in the middle top and bottom, there are two thicker heatsinks which radiate heat out. The thinner heatsinks work with the card's two fans and have heatpipes that pull the heat out across the card. You can see those when looking through the heatsink. Of course, this side of the card only has one fan, and it's on the left side. It has 7 fan blades and an outer ring that gives it more strength and helps direct more air down into the heatsink. The fan has a 118 mm opening and is 115 mm wide from ring to ring.
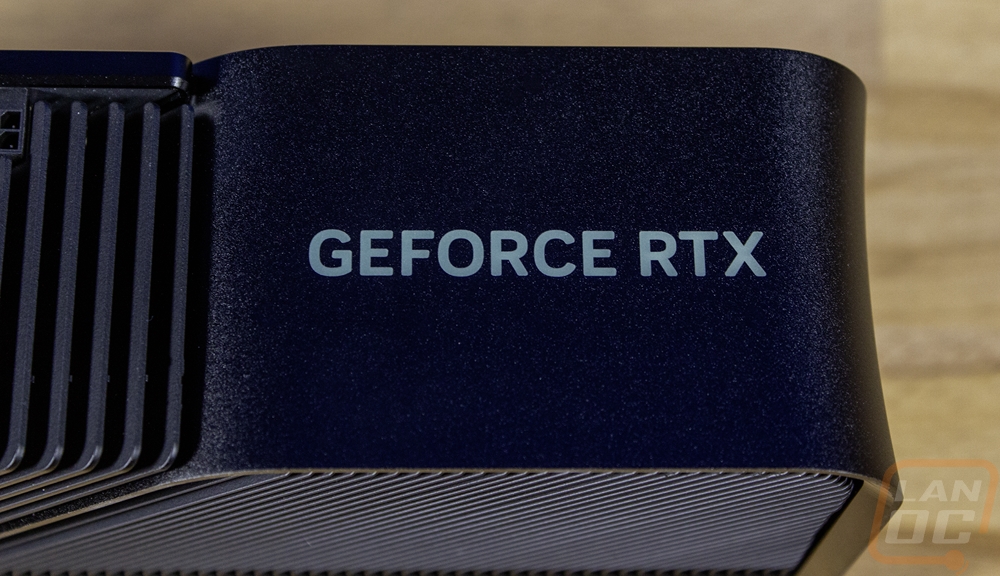
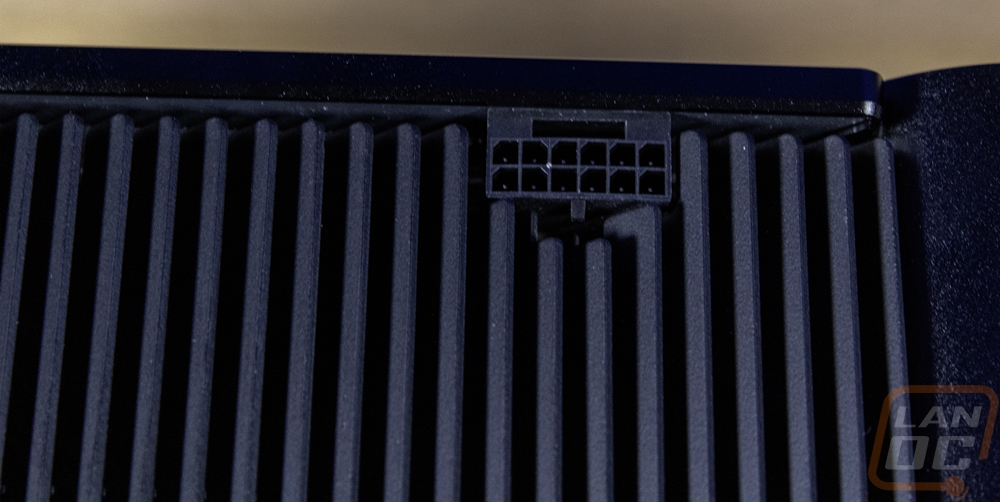
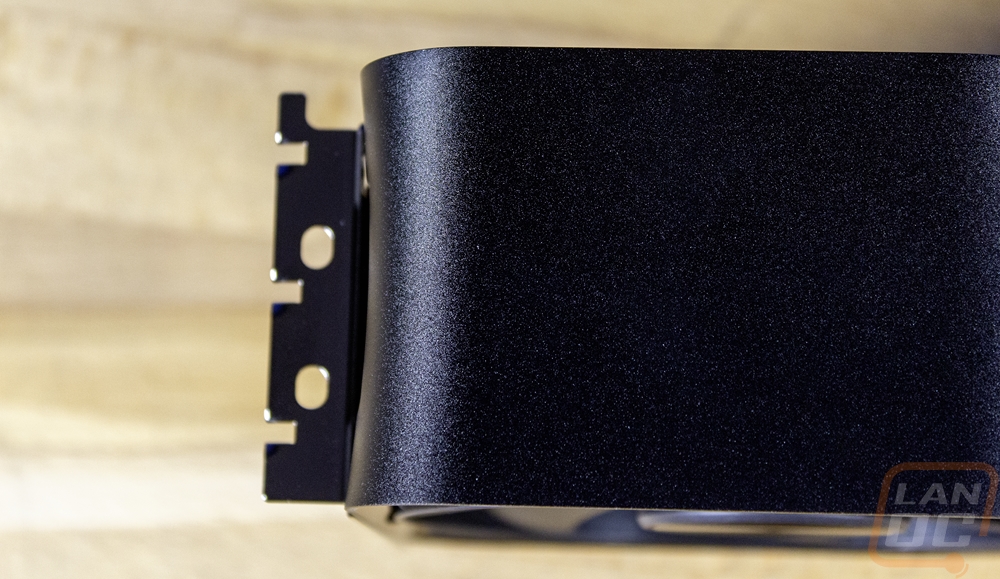
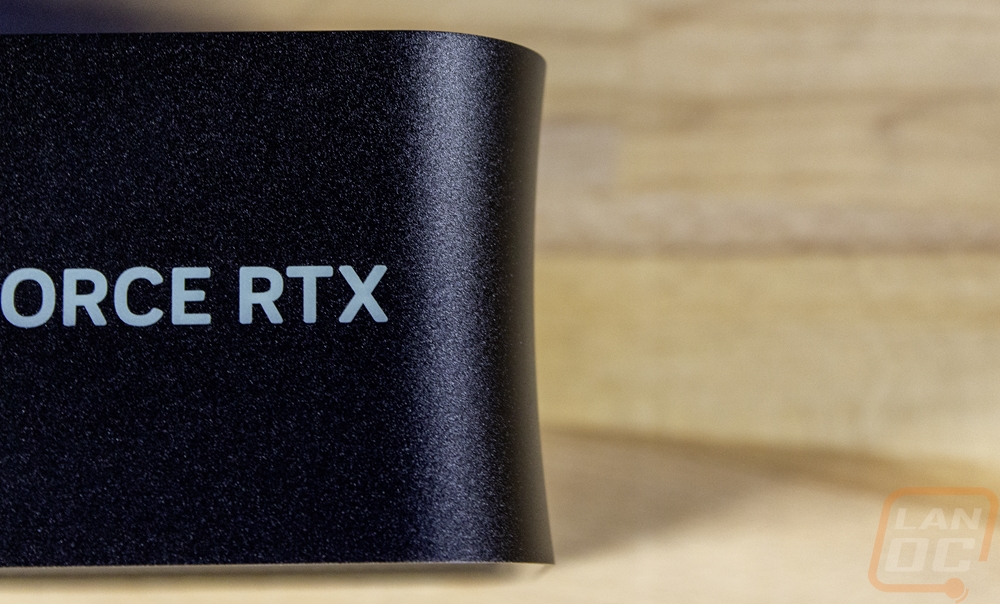
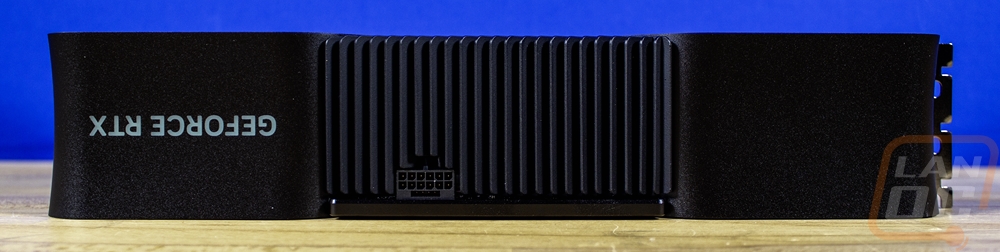
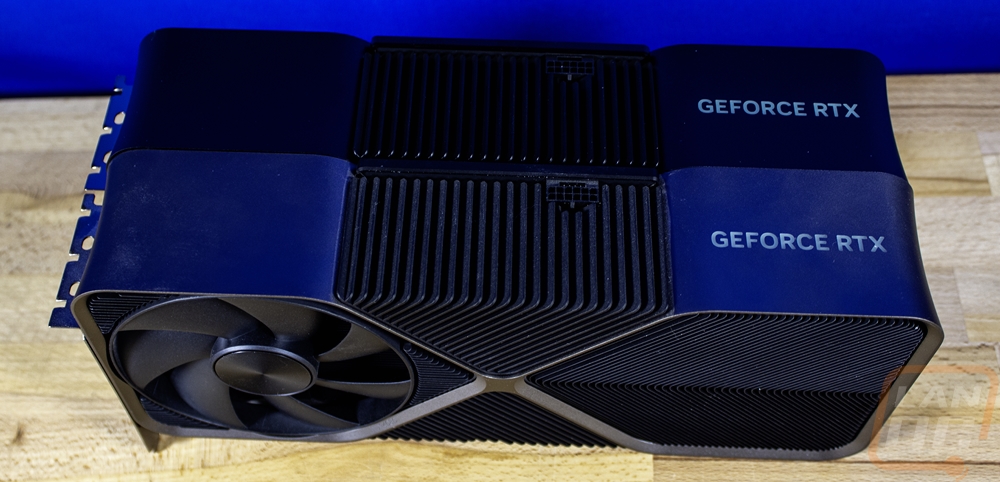
Up on the top edge of the card, the black finish continues. There is also the GeForce RTX branding which is backlit but visible even when the lighting is off with the white diffusers behind it. One thing I wanted to point out here is the concave shape of the RTX 4080 SUPER Founders Edition’s housing. It is hardly visible but the entire top and ends have a small dip to them, you can mostly see it at the ends where it wraps around the front and ends of the card but it’s a nice detail. Also up on top in the middle of that heatsink is the power connection for the RTX 4080 SUPER Founders Edition. It has the same 12VHPWR connection that all of the Founders Edition cards have but we do know that this card has a TGP of 320 watts and the adapter included uses three 8-pin PCIe connections to make sure there is enough power.
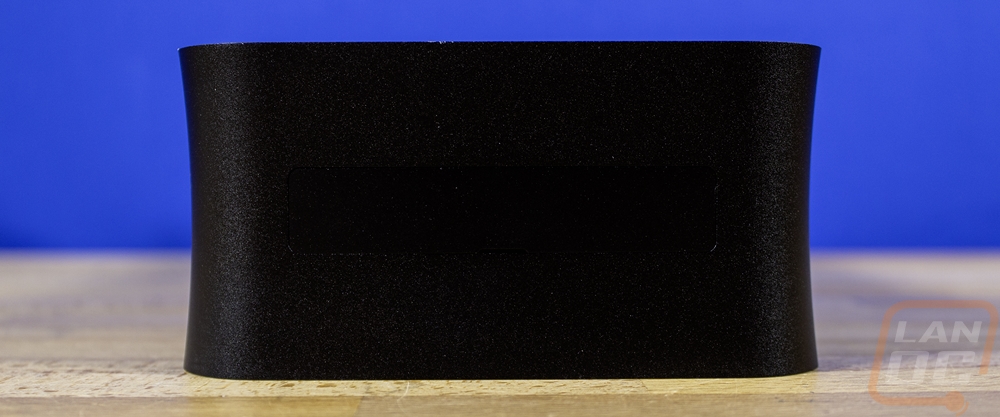
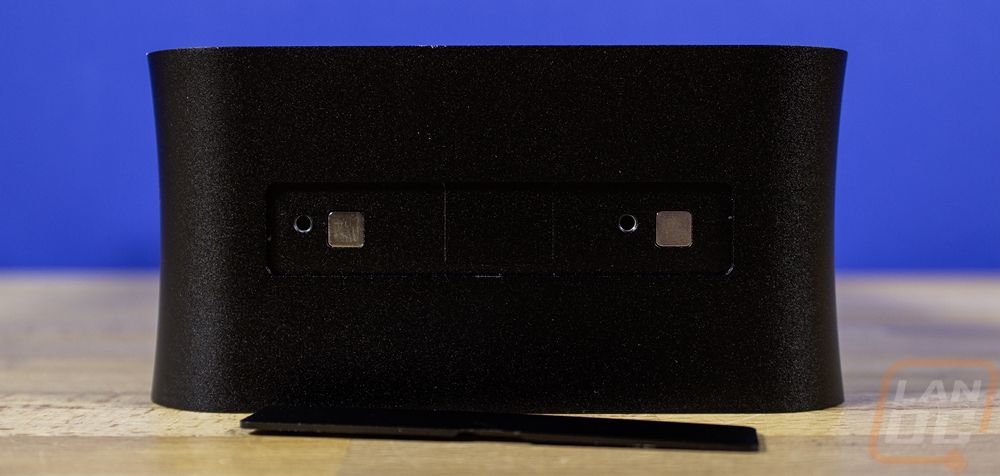
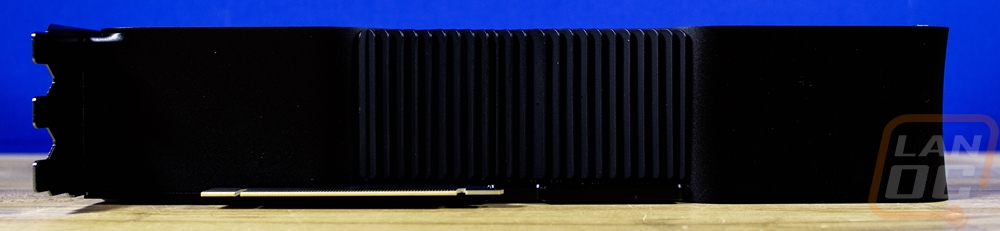
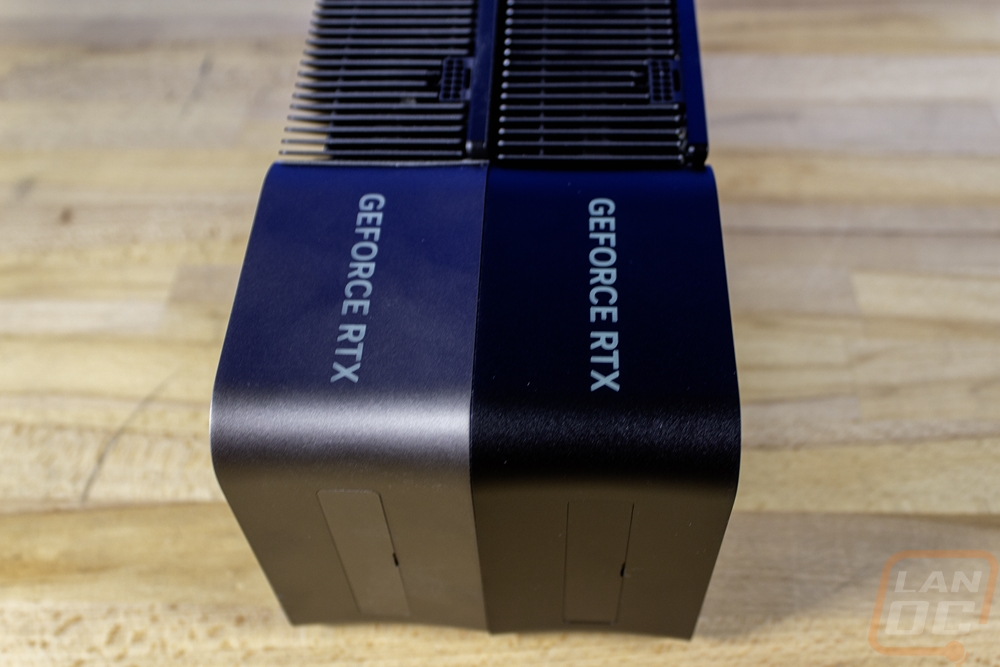
Then top, bottom, and end views of the RTX 4080 SUPER Founders Edition don’t show as much as you might see with a lot of aftermarket cards. The top and bottom are mostly covered in the outer section of the hourglass shape of the card but in the center of both, there is the exposed heatsink which sits at an angle. This is the thicker heatsink, not the thin sheet metal one around the fans because these don’t get that much airflow, they radiate. Then on the end, nothing is exposed, the metal housing wraps completely around the card. There is a small panel you can remove that is held in place by magnets. This hits the threaded mounting points for support brackets that can use them.
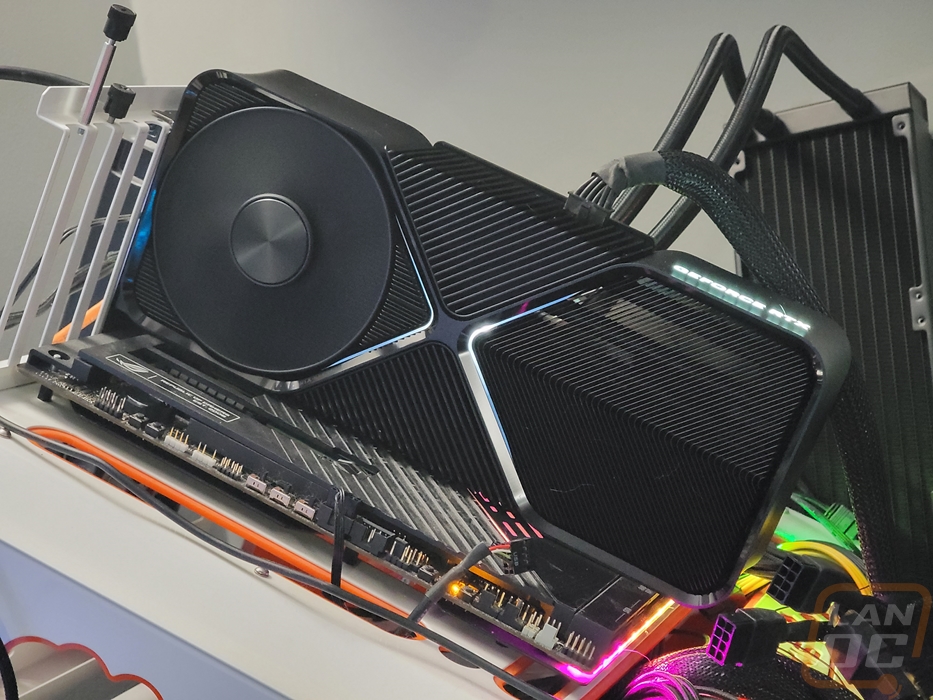
The back of the RTX 4080 SUPER Founders Edition looks very similar to the front in its layout including the single fan which is hiding on this side making the card a dual fan card. This fan however doesn’t blow down into the heatsink, it pulls air through the heatsink. It looks similar to the front fan but because of the pull not push it is closer to what you would see if you looked at the back of the front fan other than it having the same tinted center cap. It is the same size and has an outer ring around it as well. There are small heatsinks that fill the gaps around the fan but beyond that, there aren’t any other visible heatsinks on this side. The rest of the back has a diecast metal backplate shaped with the same hourglass shape and black finish. This gives the card more strength and protects the PCB. It also has the RTX 4080 SUPER Founders Edition model name molded into it sitting upside down so it will be readable when installed.
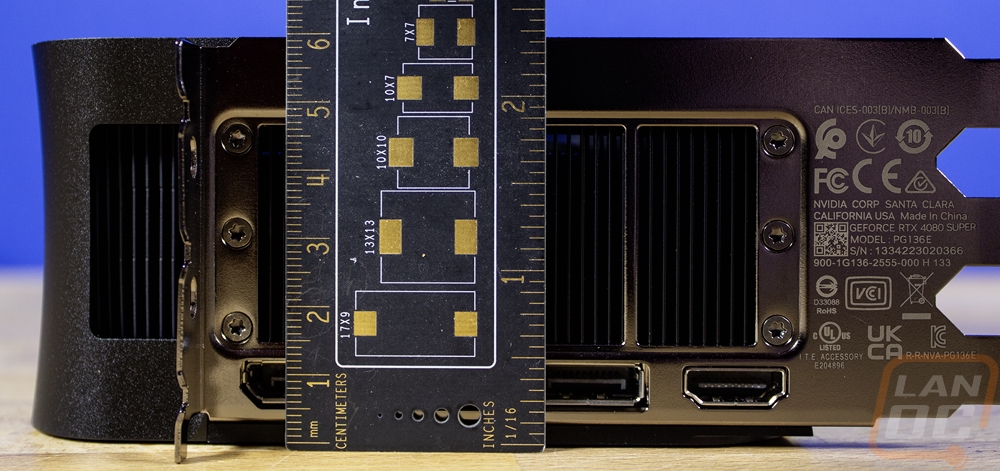
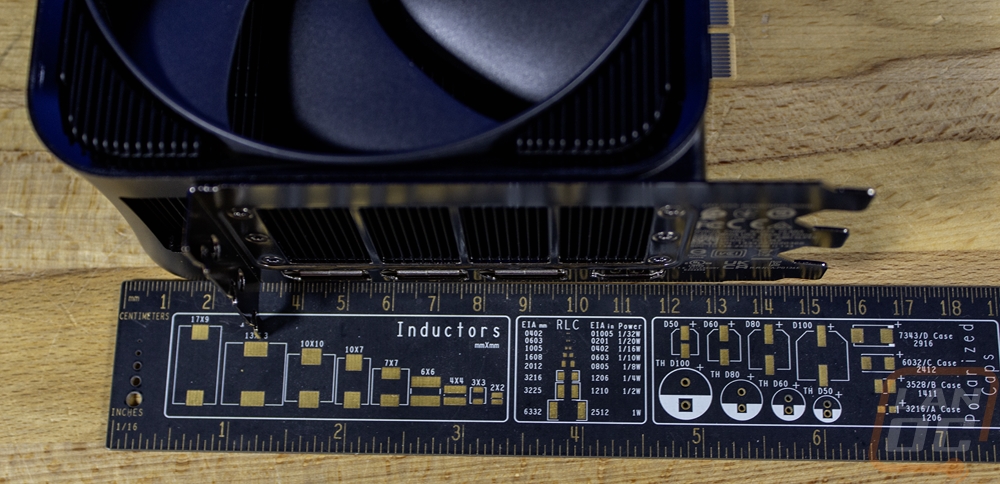
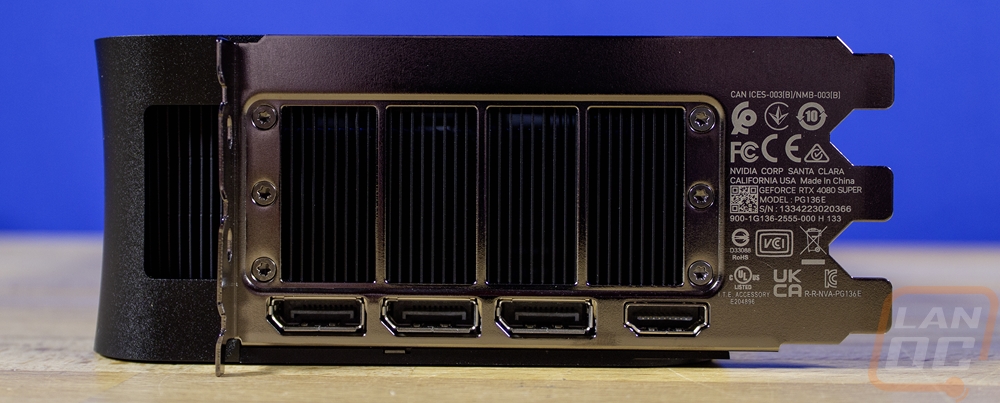
The thickness of the RTX 4080 SUPER Founders Edition leaves a lot of room on the triple slot PCI bracket for the large openings for airflow and we can see that the heatsink here is aimed to push any air that comes into this area out the back bracket. The back bracket also has the required certification logos all laser etched onto it including your model number and serial number as well. Then all of the Display Connections are packed tightly down on the bottom edge of the bracket. The RTX 4080 SUPER Founders Edition has four connections in total and has what I would consider to be the standard layout these days with three DisplayPort connections and one HDMI. Nvidia has put the HDMI down at the bottom which is a nice change from previous generations which had it in the middle.
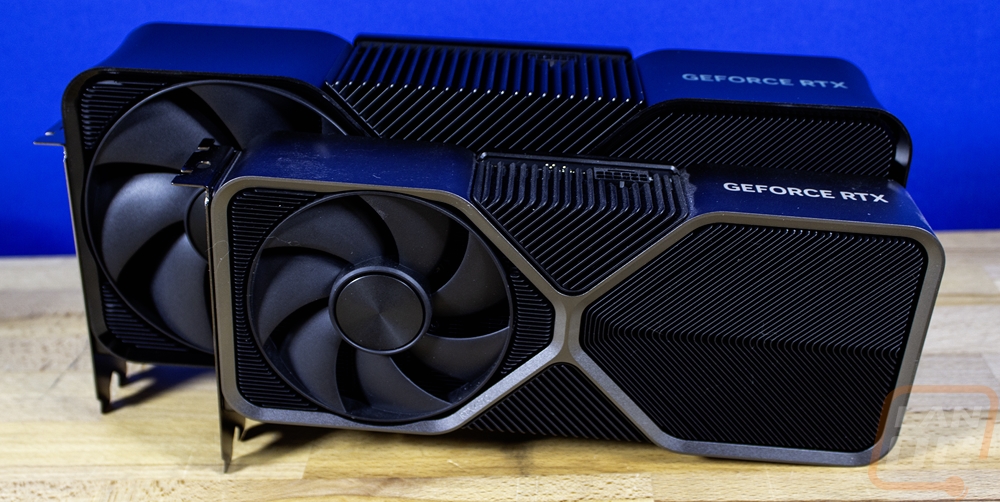
I also snapped a few comparison shots between the RTX 4080 SUPER Founders Edition and the original RTX 4080 Founders Edition to give a better idea of the grey to black change. I also have the RTX 4070 Founders Edition there which if you haven’t seen the RTX 4080, 4080, or 3090 Founders Editions in person, this gives a little more scale to how big they are compared to what would be a large card just a few years ago.
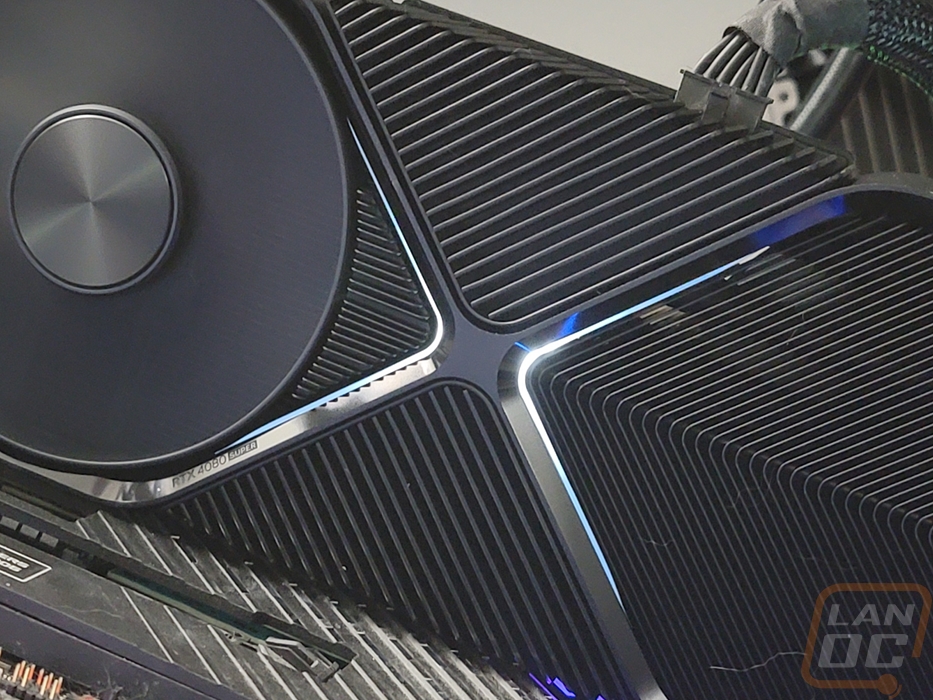
Before getting into testing I did want to check out the lighting on the RTX 4080 SUPER Founders Edition and it might come as a surprise that the card has lighting. Up on the top edge, the GeForce RTX branding is backlit then on the front the X shape in the middle of the hourglass shape also has small hidden slivers of lighting which all light up in white when the card is up and running. This is the same as on the original RTX 4080 and still just as good looking as before.
Test Rig and Procedures
Test System
CPU: Intel Core-i9 13900K – Live Pricing
PL1=PL2: 253, τ: 56 / 307A
Motherboard: Asus Z790 Extreme – Live Pricing
Cooling: Corsair H100i Elite LCD Display - Live Pricing
Noctua NT-H1 Thermal Paste - Live Pricing
Memory: Crucial 32GB Kit (2 x 16GB) DDR5-5600 UDIMM– Live Pricing
Storage: Sabrent Rocket Q4 2TB – Live Pricing
Power Supply: be quiet! Dark Power Pro 13 1600W- Live Pricing
Case: Primochill Wetbench - Live Pricing
OS: Windows 11 Pro 64-bit - Live Pricing
|
Our Testing Procedures |
|
|
3DMark |
All 3DMark-based tests are done using the most recent version. We test using all three versions of Fire Strike, Both Time Spy and Time Spy Extreme, and Speed Way. Tests to look at ray tracing performance are done with Port Royal when supported and for Nvidia cards that support DLSS, the DLSS subtest is also done at 1440p with the performance setting and DLSS 2.0 as well as a look at DLSS 1, 2, and 3 at 4K. |
|
Unigine Superposition |
1080p Extreme and 4k Optimized benchmarks along with the VR Future test are done. The VR test is done at the Oculus resolution |
|
VRMark |
Only the Blue room test is run |
|
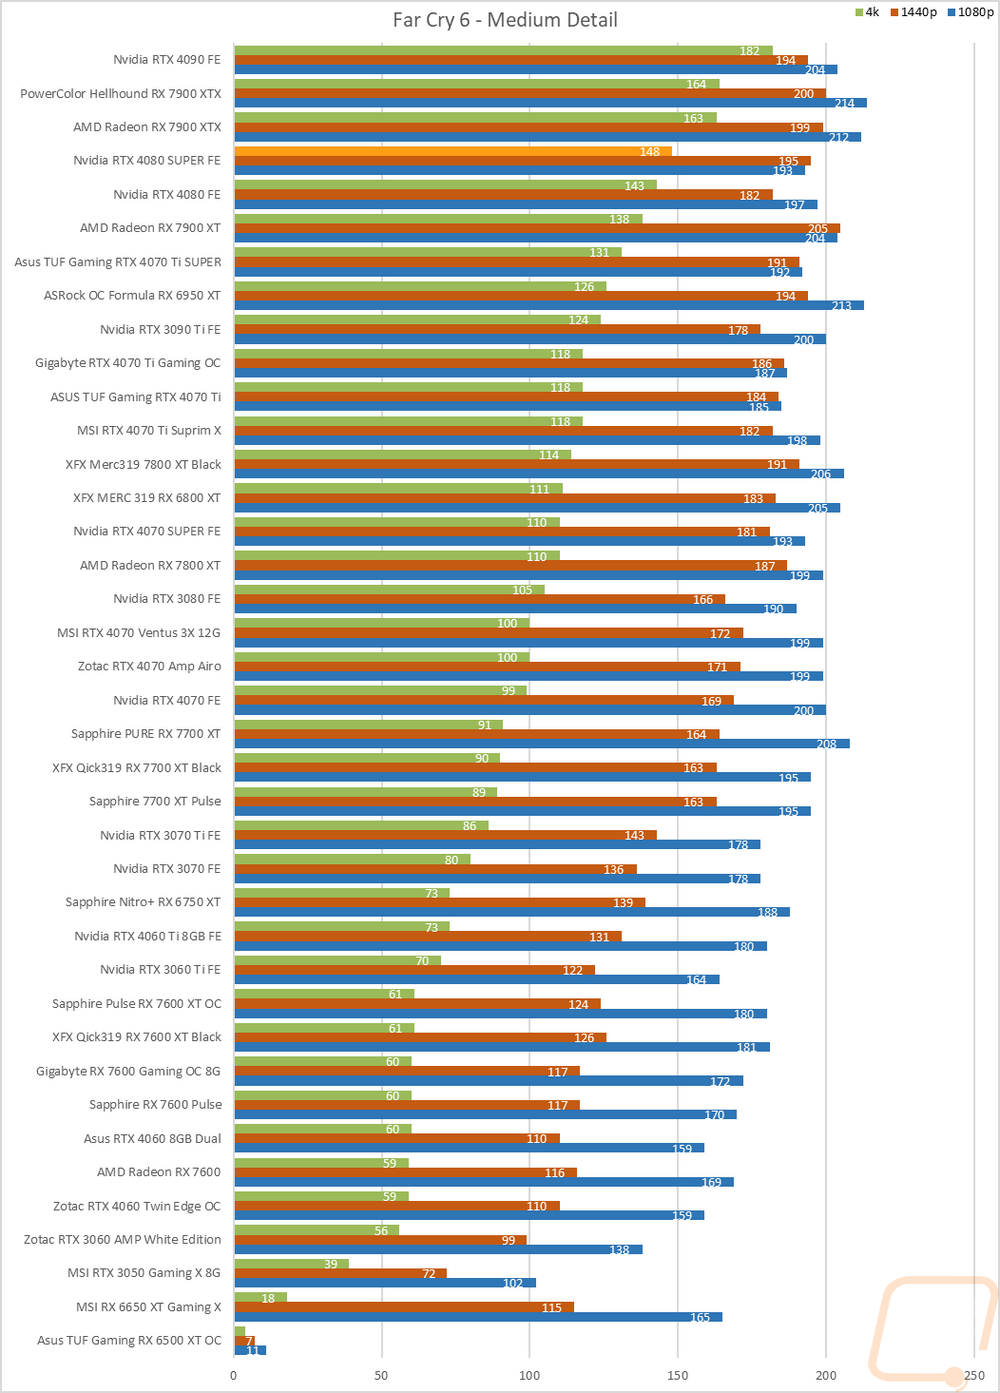
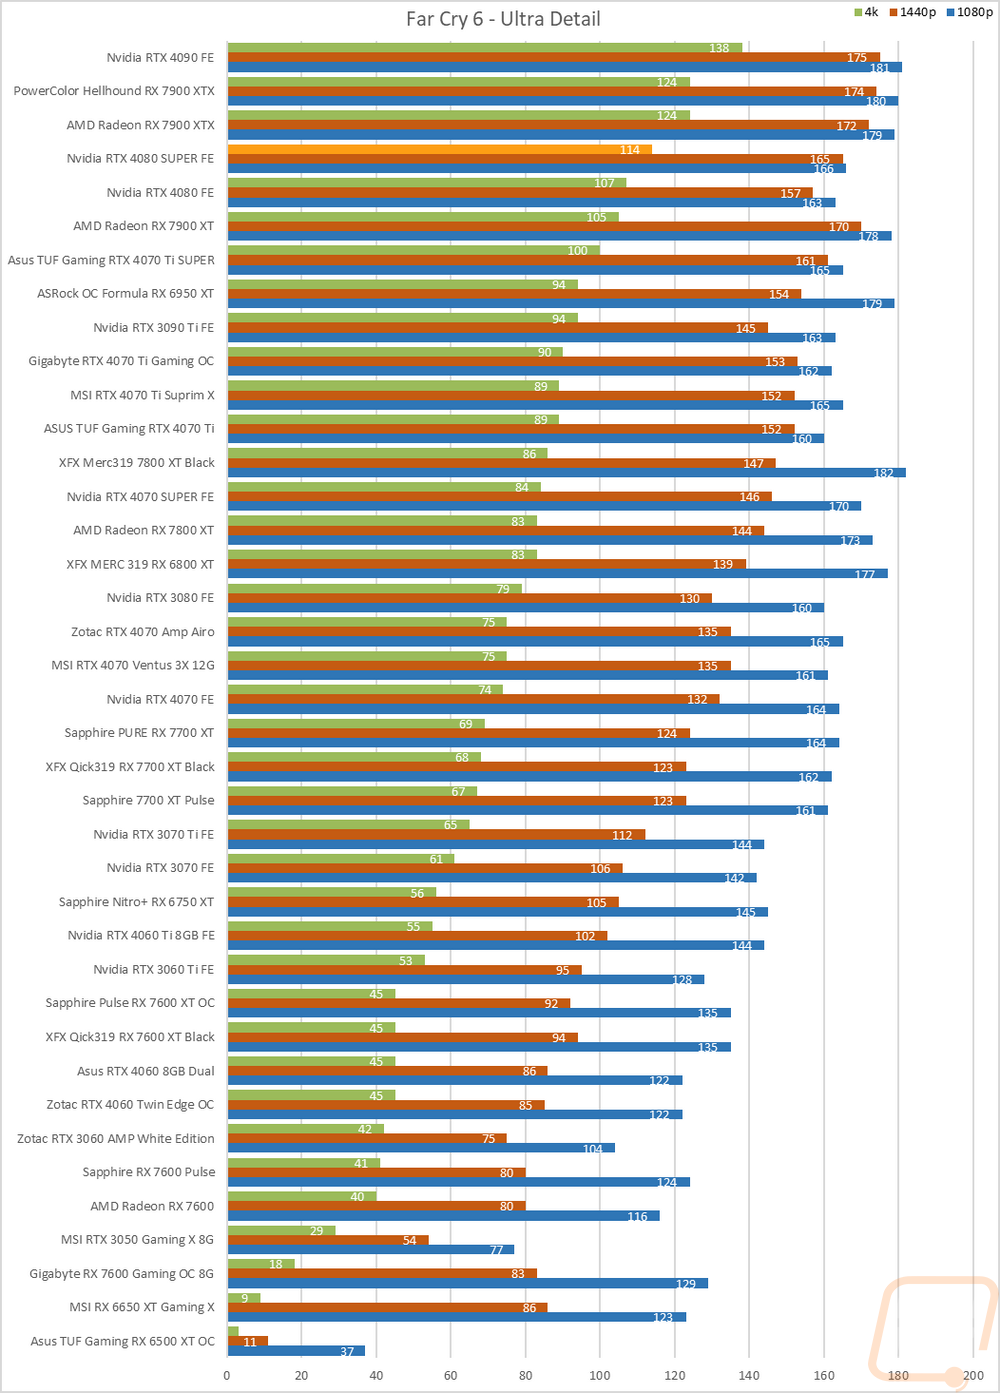
Far Cry 6 |
Built-in benchmark tested at 1080p, 1440p, and 4k with the Ultra and Medium detail settings |
|
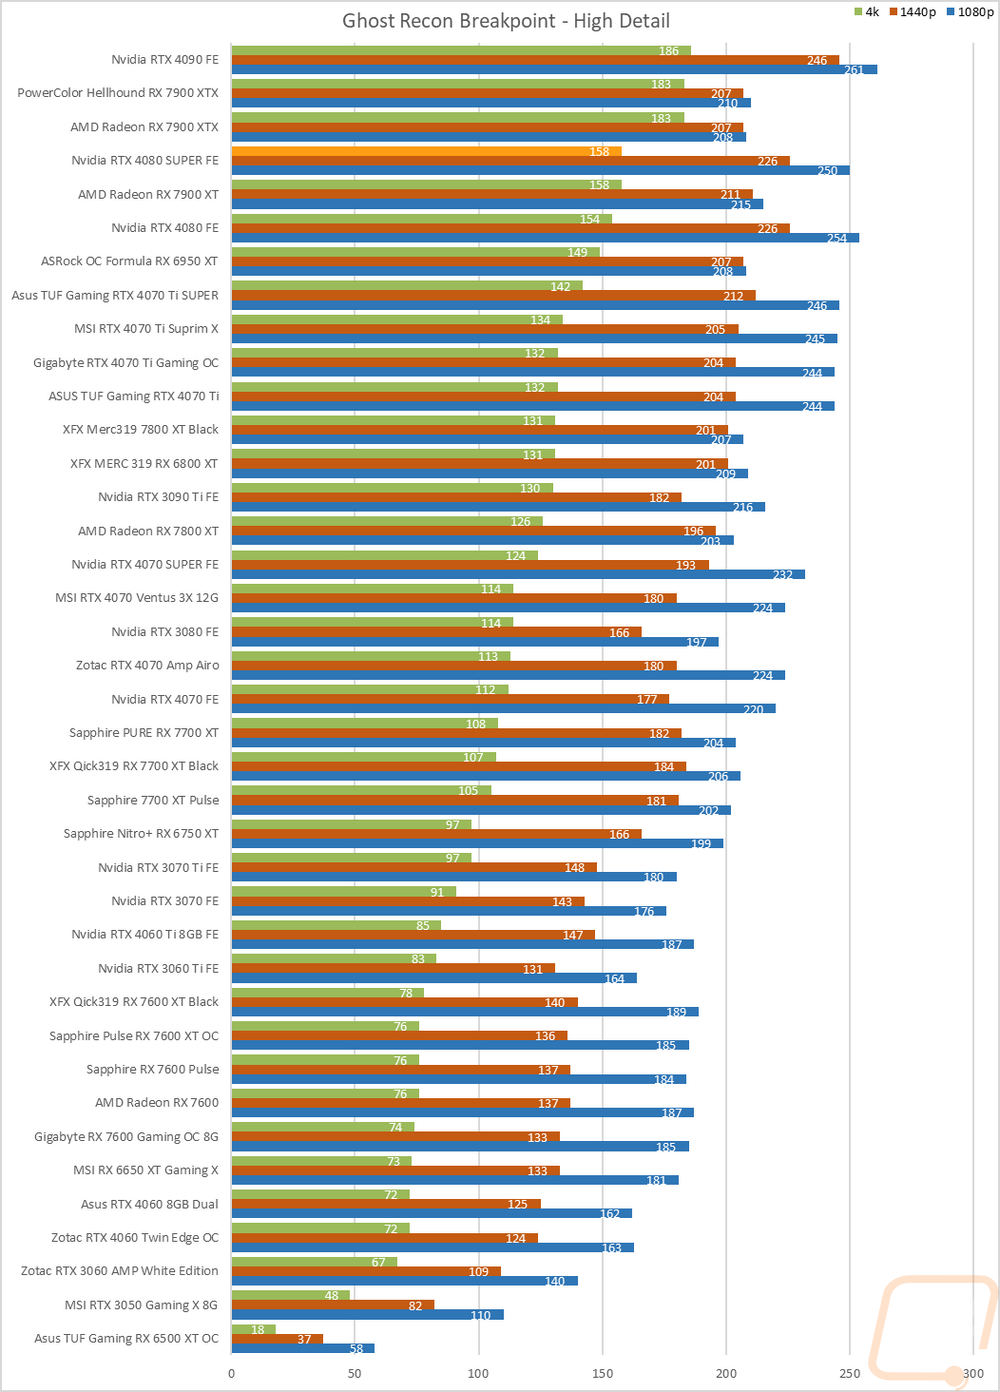
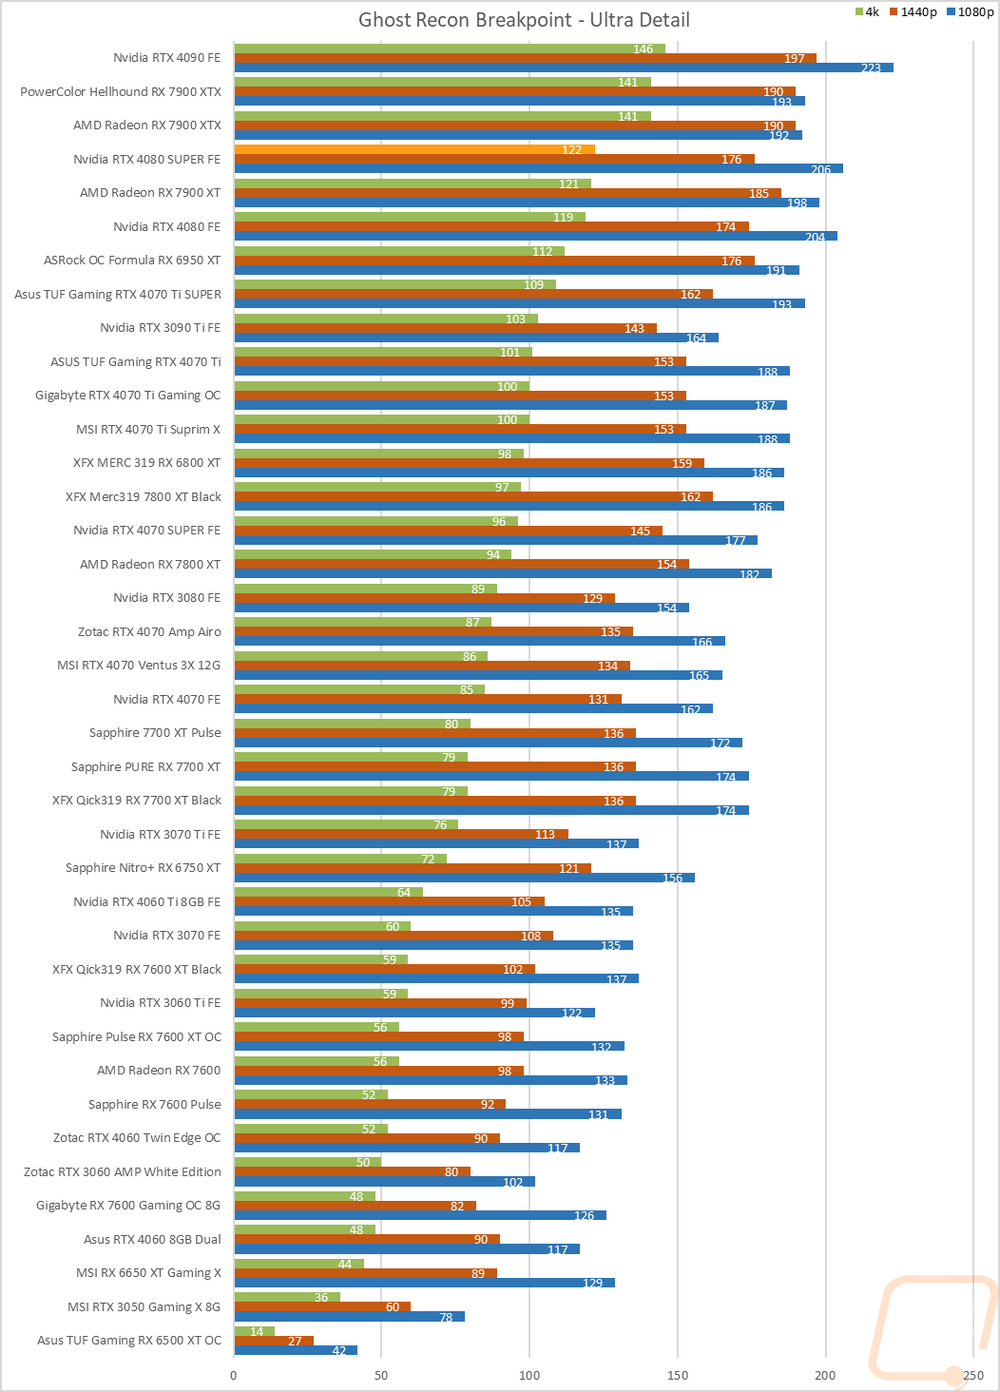
Ghost Recon Breakpoint |
Built-in benchmark tested at 1080p, 1440p, and 4k with the Ultra and Medium detail settings. Texture quality always set to high |
|
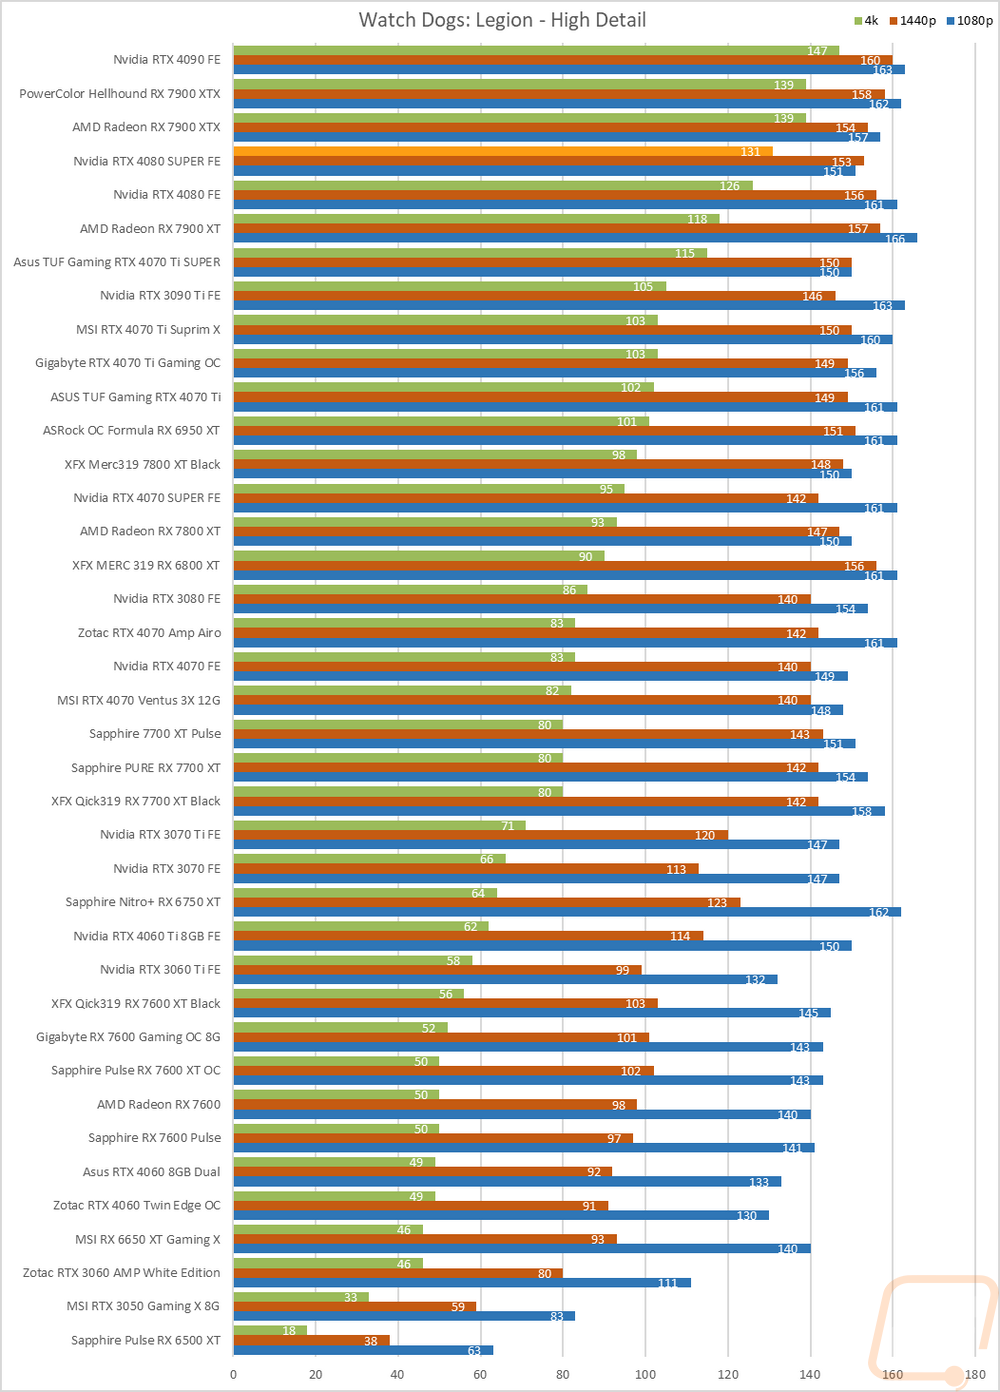
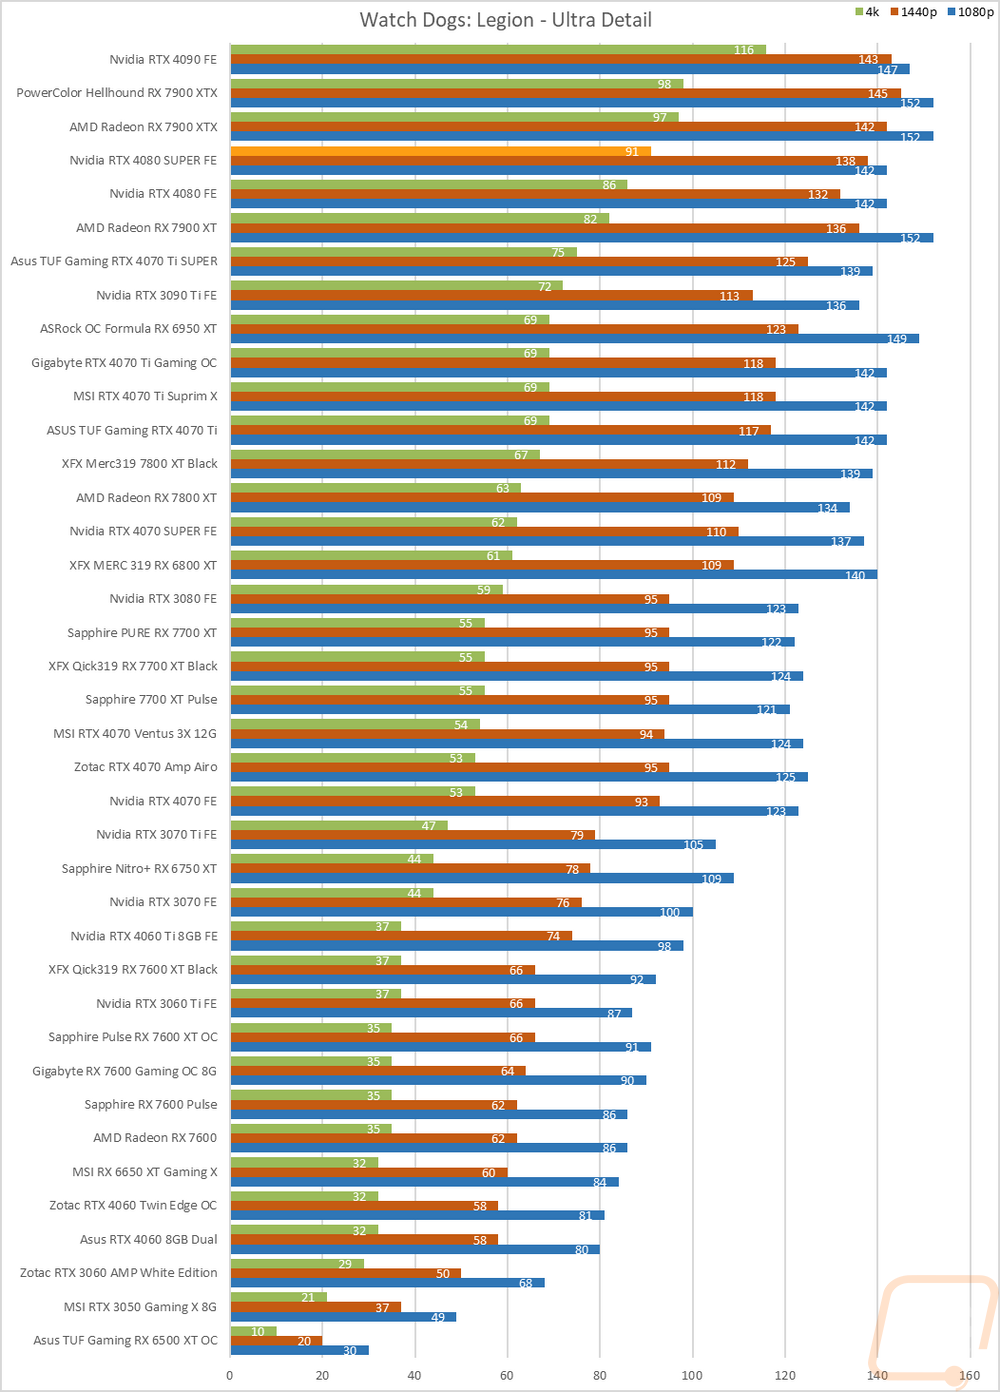
Watch Dogs: Legion |
Built-in benchmark testing at ultra and high details. Tested at 1080p, 1440p, and 4k. I also do RTX and DLSS testing on Nvidia cards at 4K using the Ultra detail settings as a base as well. |
|
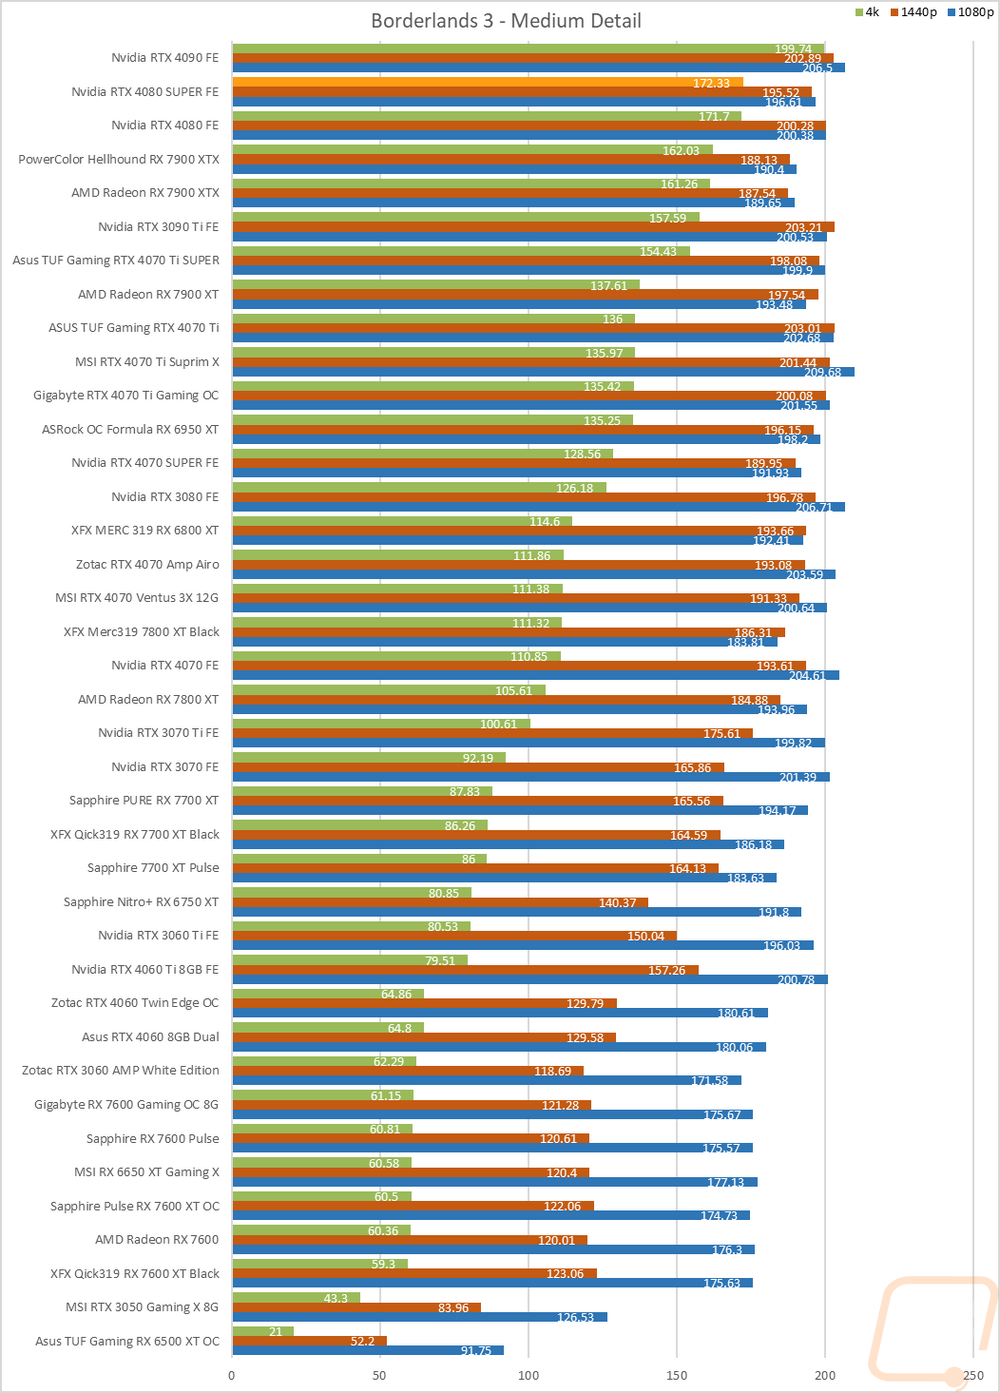
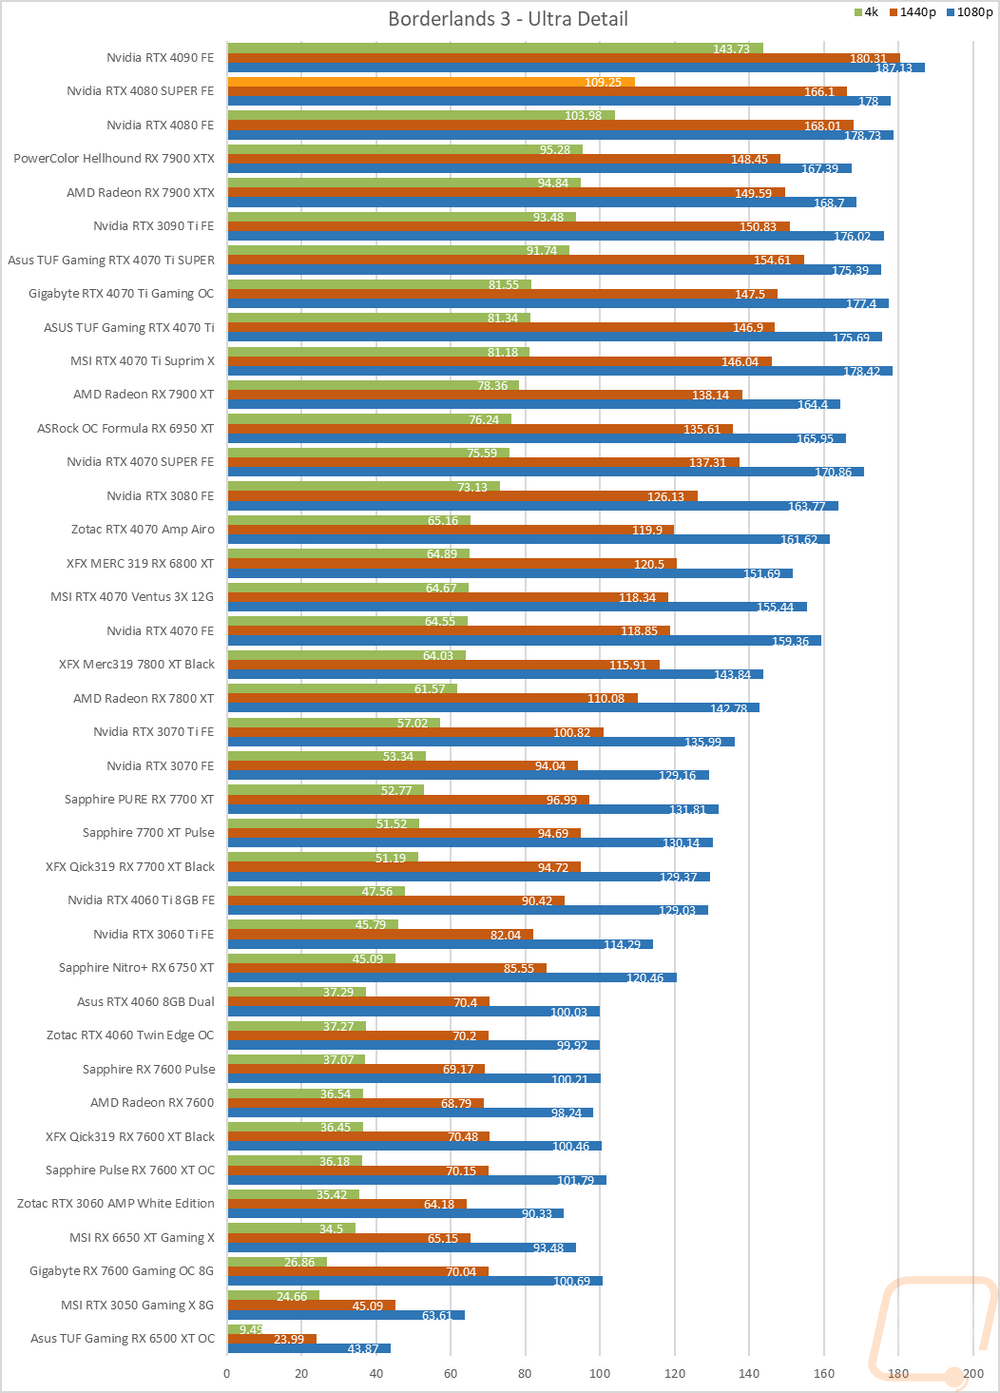
Borderlands 3 |
Built-in benchmark testing with the ultra detail setting and medium detail setting, done at full screen with default settings at 1080p, 1440p, and 4k on DX11 |
|
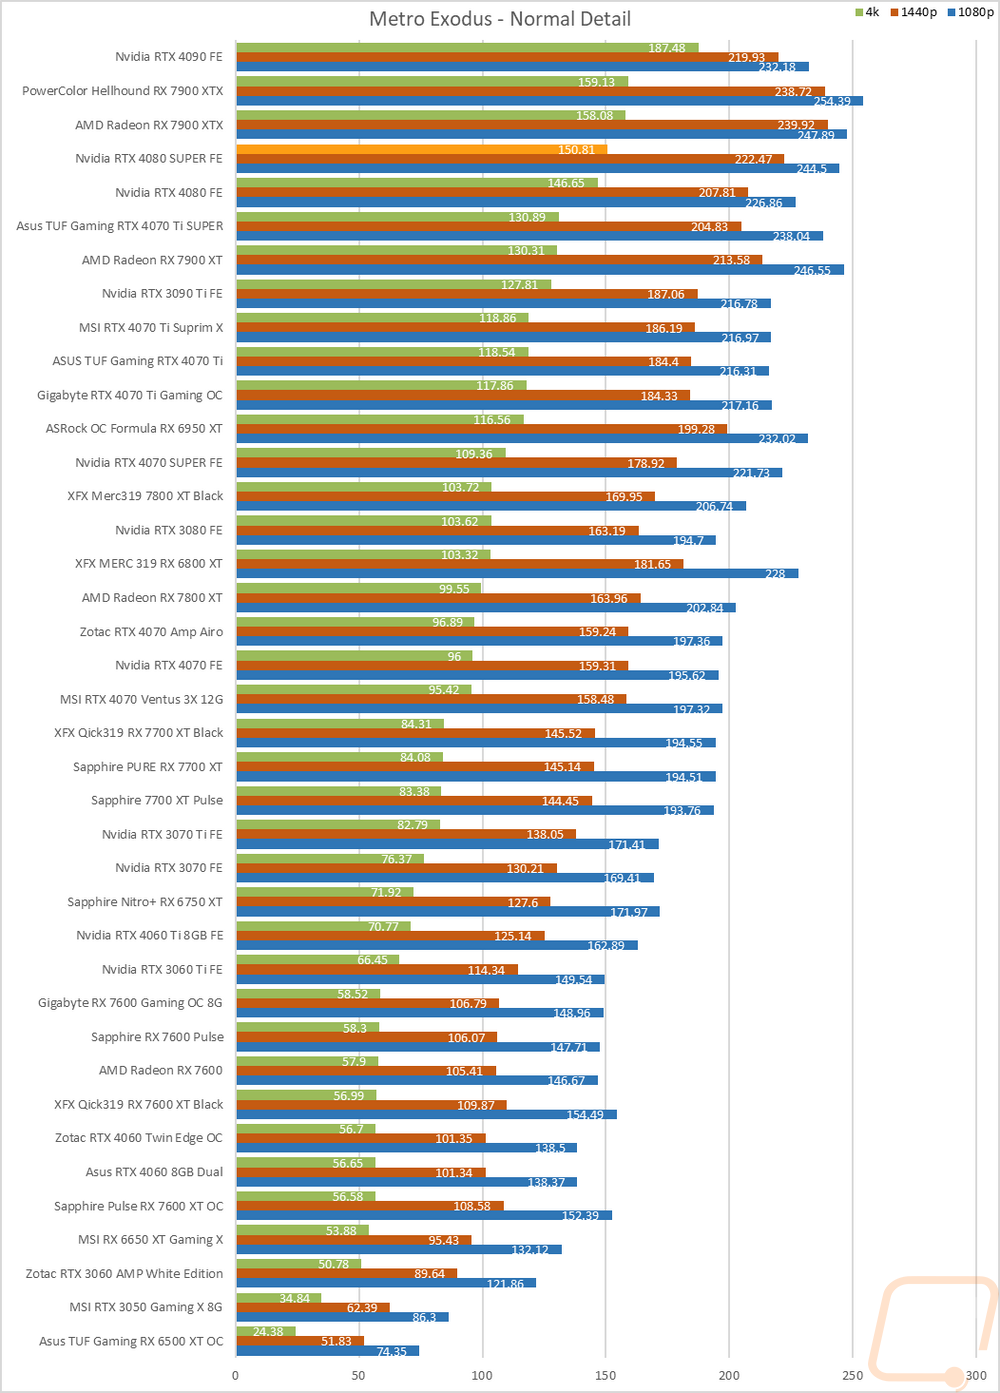
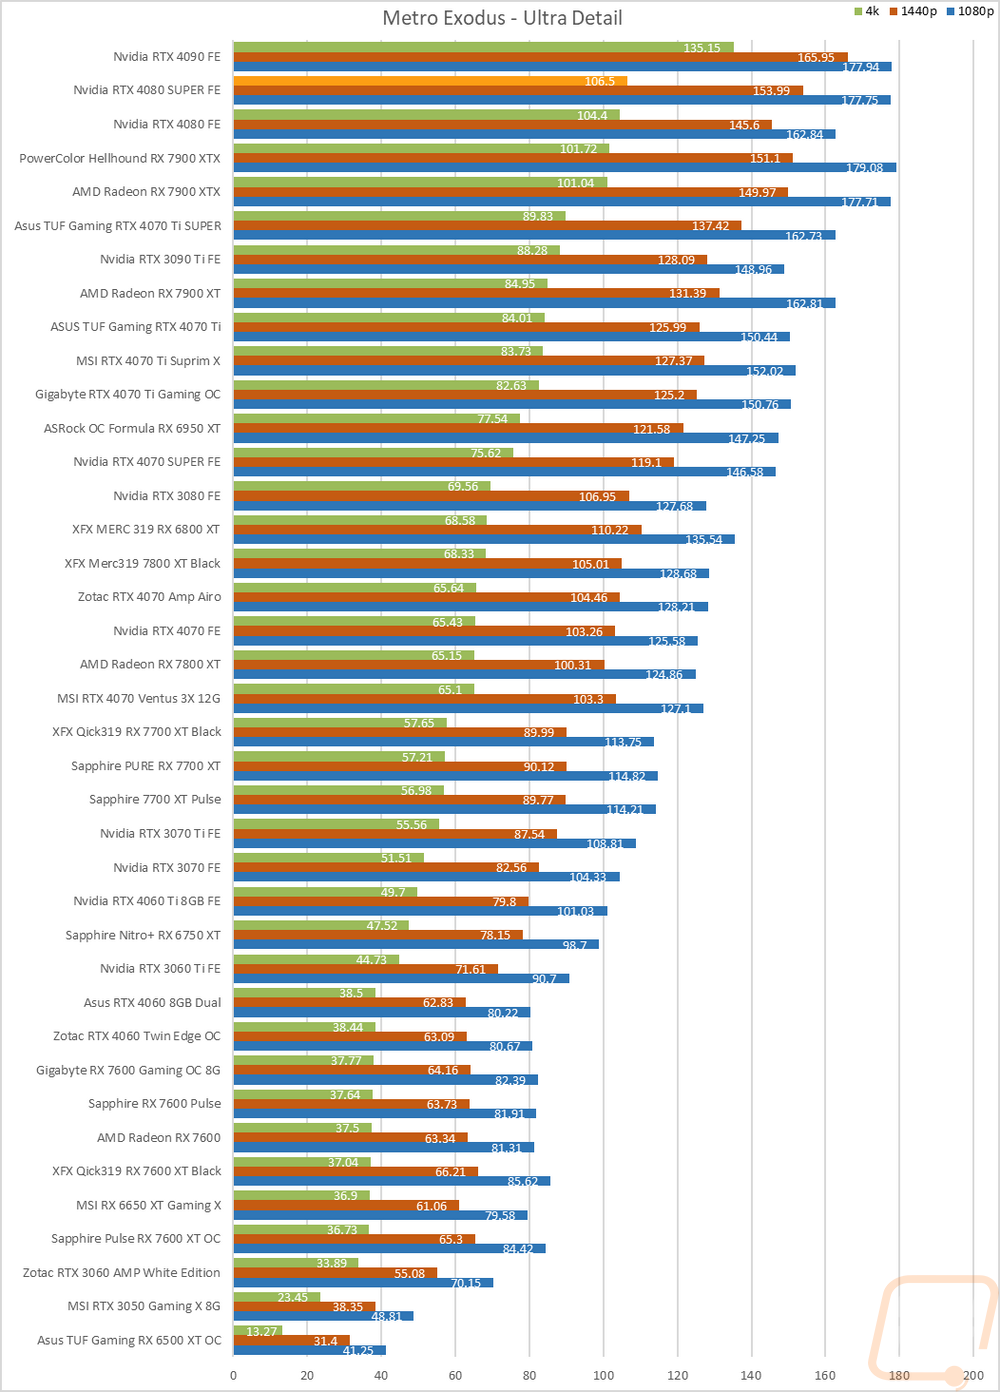
Metro Exodus |
Using built-in benchmark, testing at ultra and normal details at 1080p, 1440p, and 4k. I also do RTX and DLSS testing at 4K with the ultra-detail base settings for Nvidia cards as well. |
|
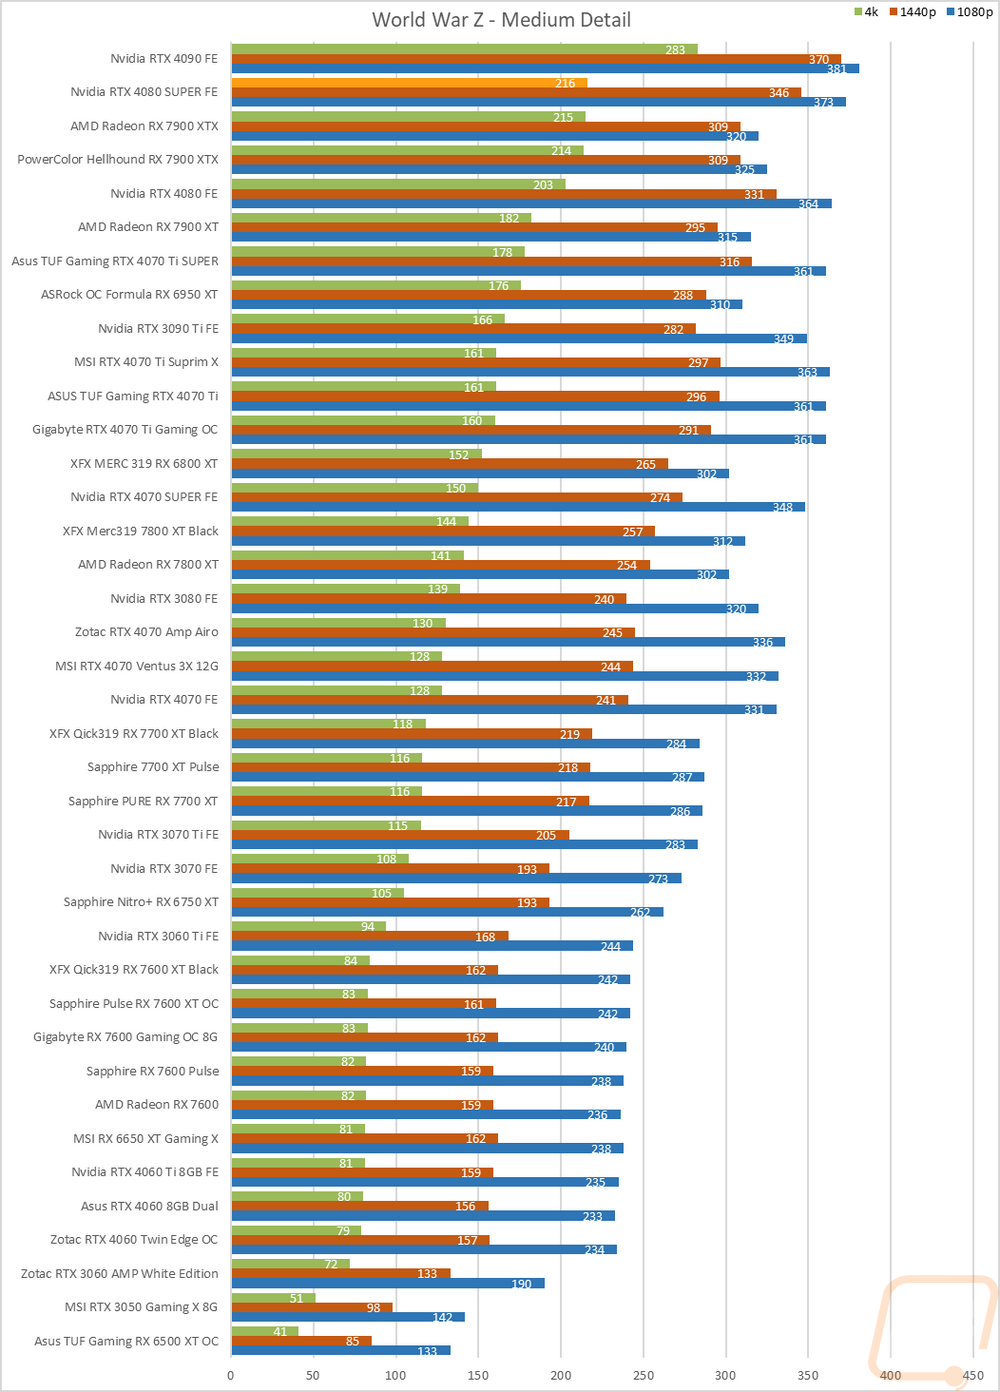
World War Z Aftermath |
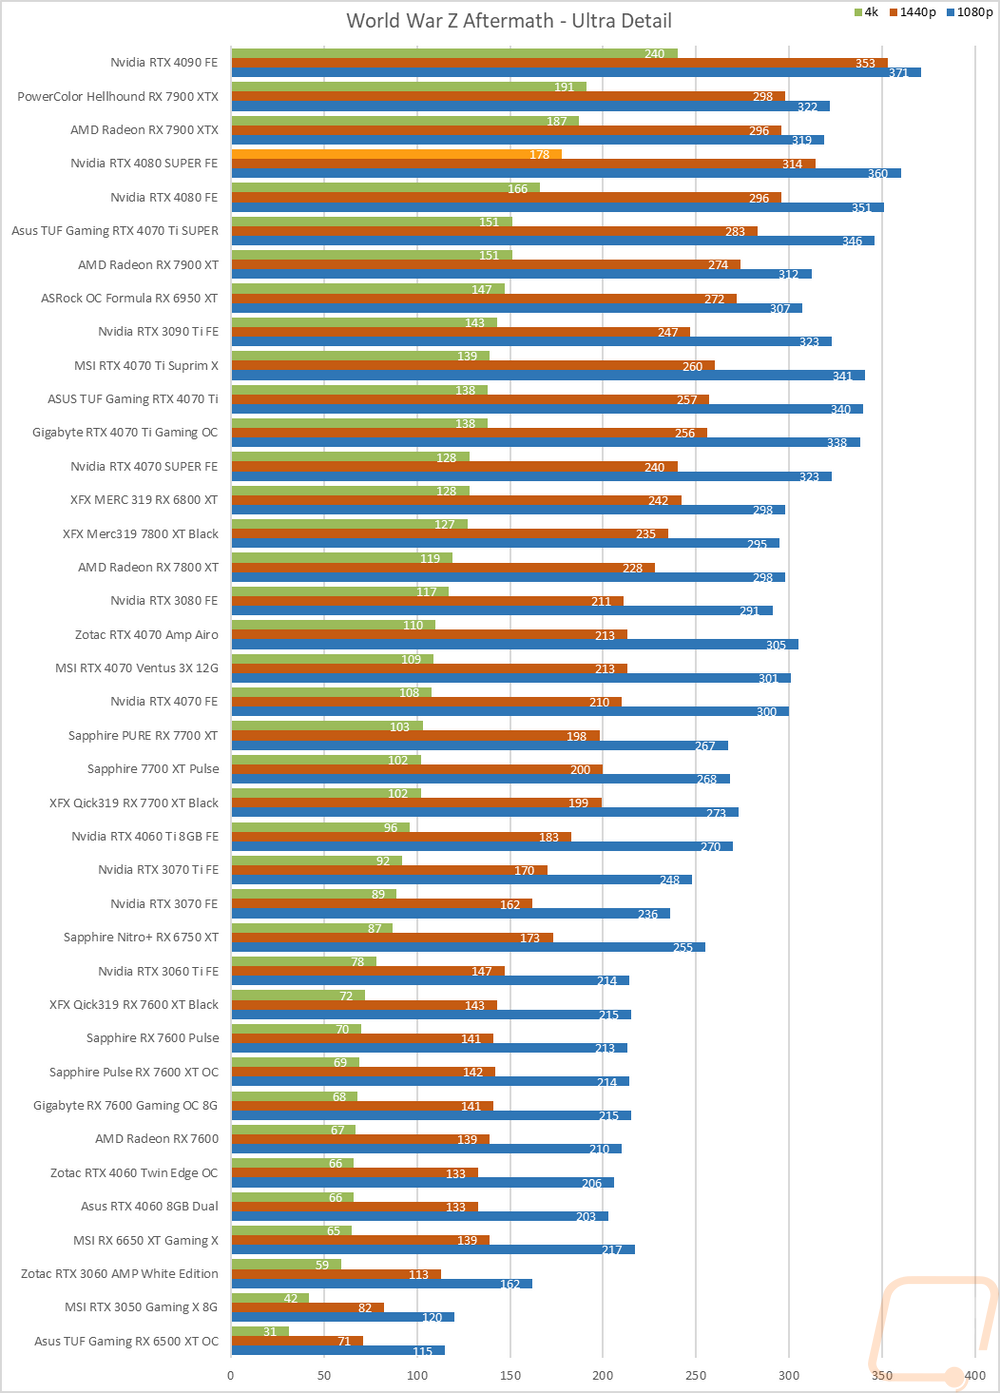
Built-in benchmark in DX11 testing both the Ultra detail and Medium detail levels at 1080p, 1440p, and 4K resolutions |
|
The Division 2 |
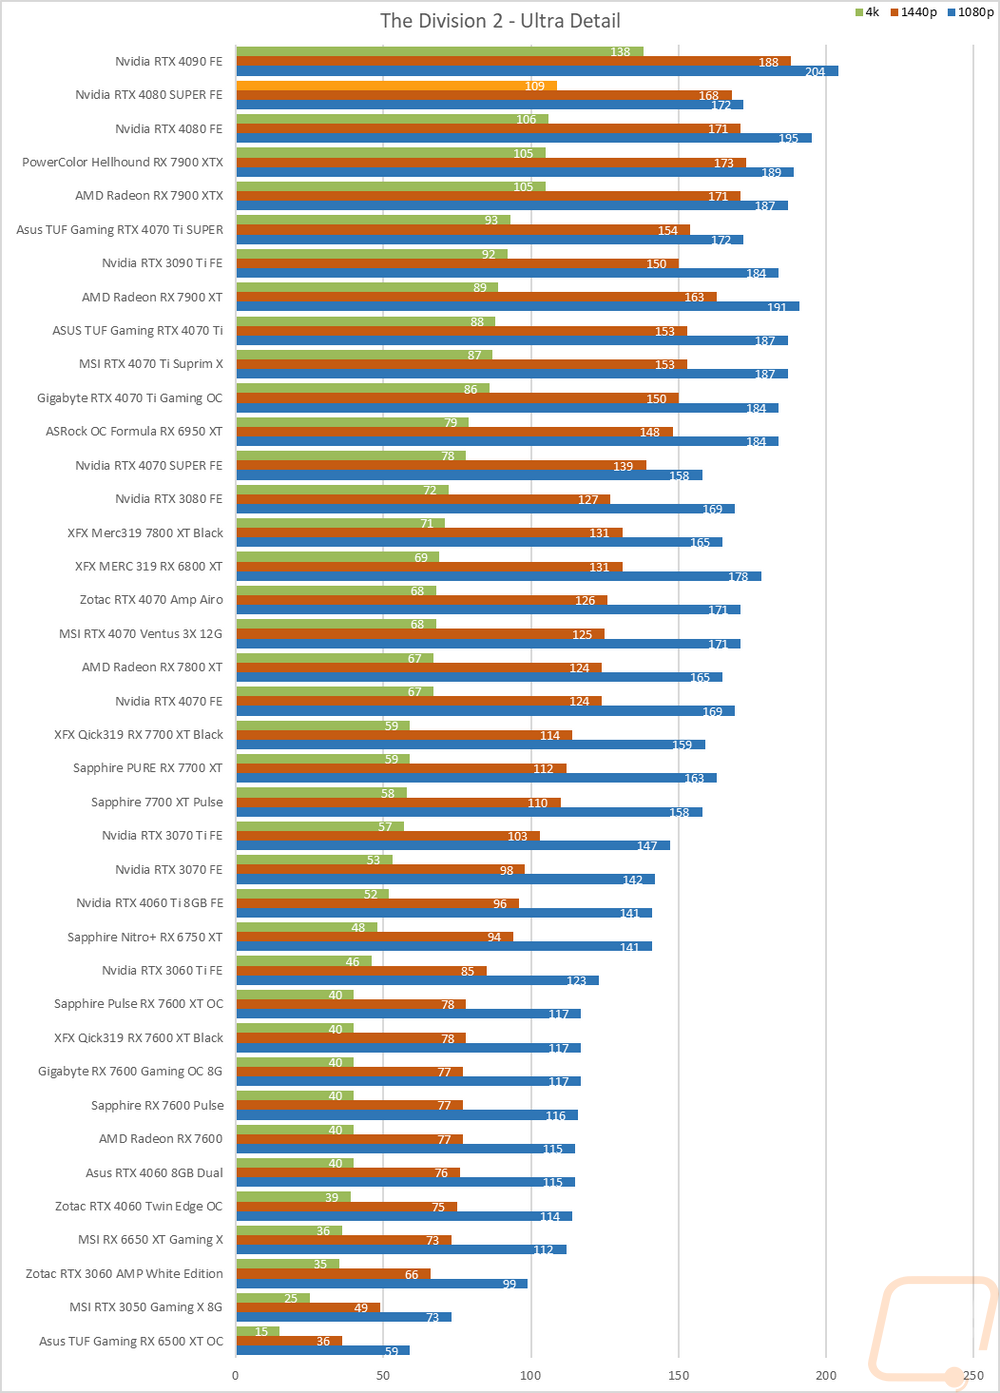
Built-in benchmark at Ultra detail with V-Sync turned off at 1080p, 1440p, and 4k resolutions. |
|
Total War: Three Kingdoms |
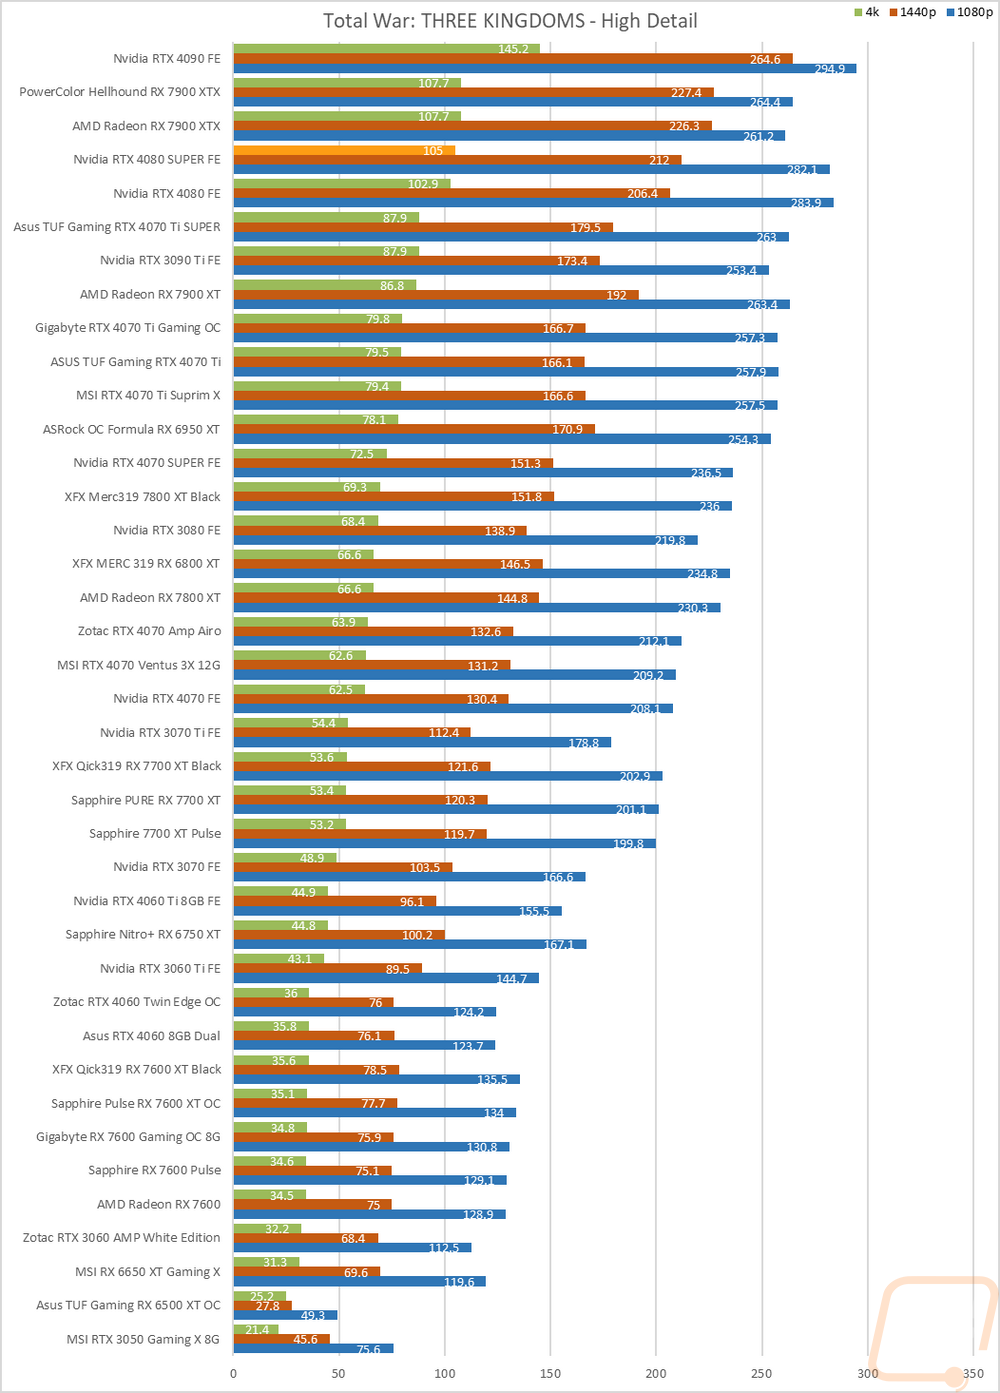
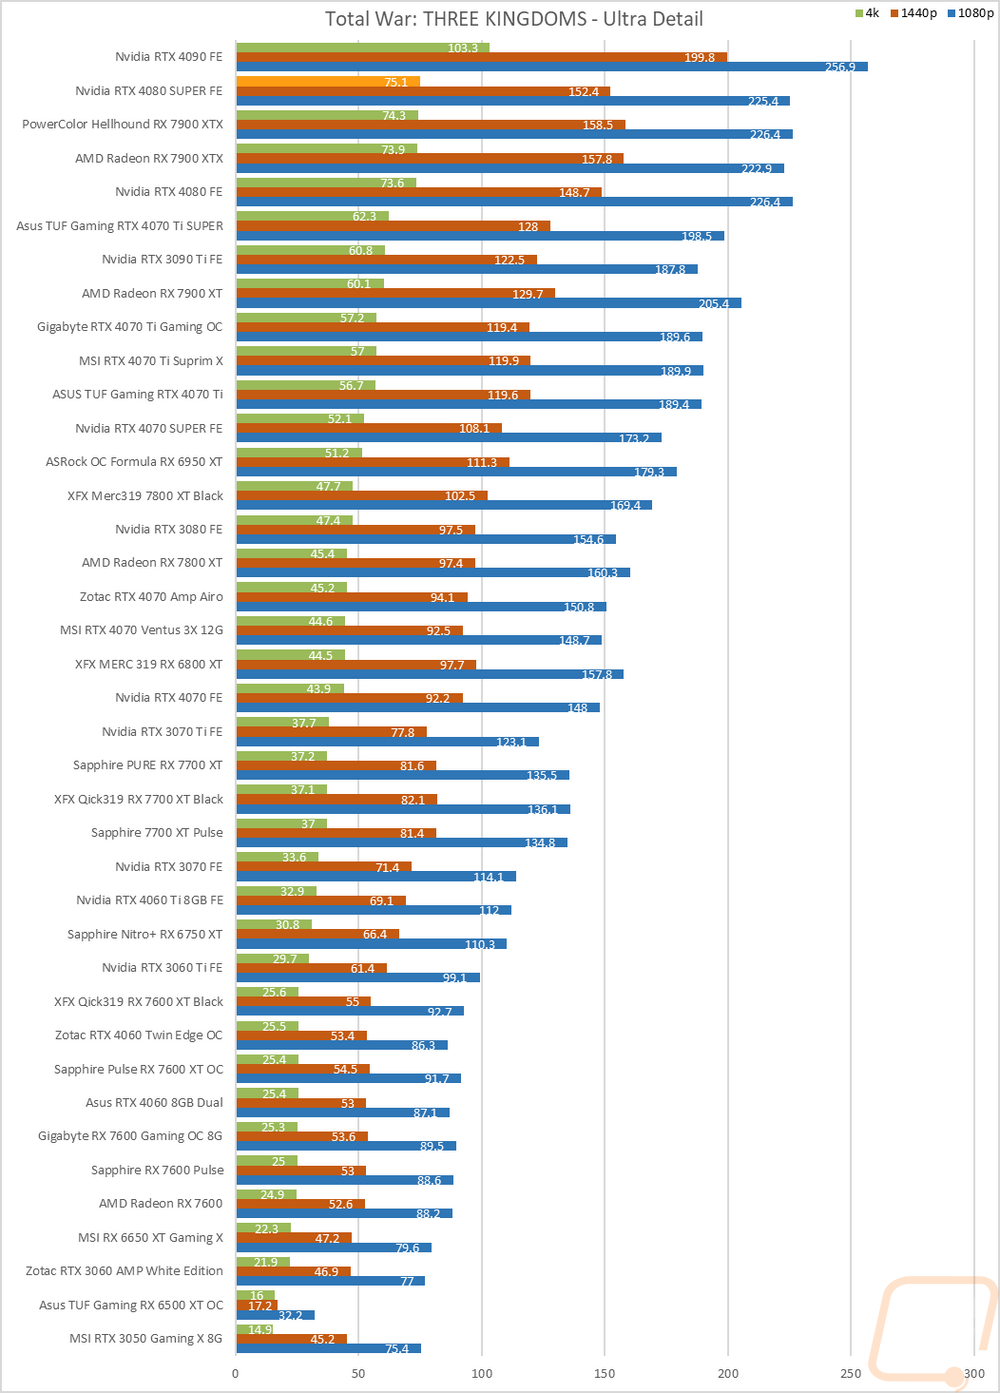
Built-in benchmark using the Battle Benchmark setting. Tested at 1080p, 1440p, and 4k at both high and ultra detail settings |
|
OctaneBench 2020.1 |
OctaneBench is designed to test rendering in OctaneRender. RTX and non-RTX are both ran. This is a CUDA-only test so only Nvidia cards are tested |
|
V-Ray 5 |
V-Ray 5 benchmark us run with CUDA and RTX settings on cards that support it |
|
Boundary Benchmark |
Testing different DLSS detail levels on cards that support it. All testing is done at 4k with RTX on |
|
Bright Memory Infinite RTX Benchmark |
Benchmark all of the different RTX detail levels. Resolution at 4k and DLSS on balanced for each test |
|
Passmark Performance Test 10.2 |
Test using the GPU Compute Score inside of PassMark's Performance Test 10.2 |
|
Blender |
Using the standard Blender Benchmark I run the test using the Blender 3.4 setting which tests using the Monster, Junkshop, and Classroom tests. |
|
Temperature Testing |
Using AIDA64, the GPU stress test is run for 30 minutes or until the result has leveled off. The test is run twice, once with the stock fan profile and a second time with 100% fan speed. During this, I also document the 100% fan speed RPM and document the delta between the fan profile and 100% fan speed as well as get thermal images. |
|
Power Testing |
Using a PCat v2 to monitor power between the PCIe slot and the card as well as power through the power cables I test the peak power when running ADIA64, 3DMark Speed Way, 3DMark Time Spy Extreme, FarCry 6 at 4k and Ultra Detail, Watch Dogs Legion at 4K and Ultra detail, and Blender 3.4.0. The results are then averaged as well as the highest result. |
|
Noise Testing |
Our Noise testing is done using a decibel meter 18 inches away from the video card on the bottom/fan side of the card. We test at 50% and 100% fan speeds as well as a third test while under load using AIDA64's stress test. This is done using a Protmex PT02 Sound Meter that is rated IEC651 type 2 and ANSI S1.4 type 2. Tests are done set weighted to A and set to a slow response using the max function. The ambient noise level in the testing area is 33.3 decibels. |
Synthetic Benchmarks
As always I like to start my testing with a few synthetic benchmarks. 3DMark especially is one of my favorites because it is very optimized in both Nvidia and AMD drivers. It's nice to not have to worry about it being favored too much either way and the repeatability of the results makes it a nice chance to compare from card to card, especially when comparing with the same GPU. For the RTX 4080 SUPER Founders Edition, this is our first look at the new RTX 4080 SUPER but it doesn’t mean we don’t have a few cards that I want to keep an eye on how the card compares. The most obvious is the RTX 4080 which it replaced and of course, the RTX 4090 which is still Nvidia’s flagship. From AMD I’m looking at the RX 7900 XTX which is the only card that is going to be in the performance range of this one.
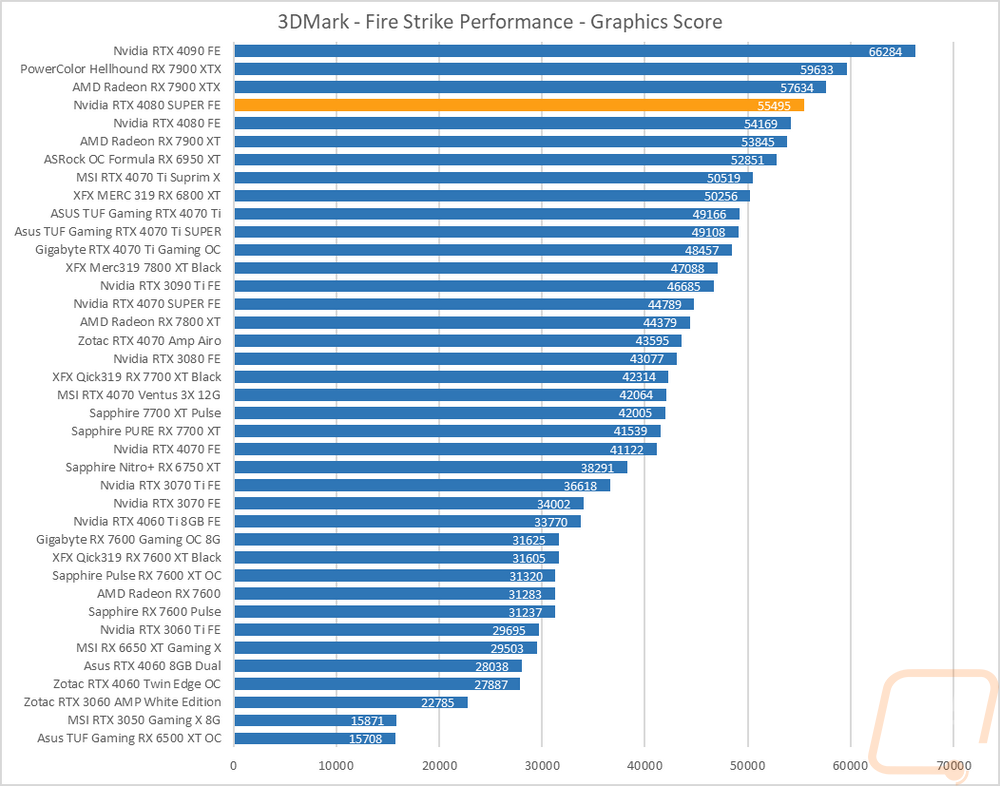
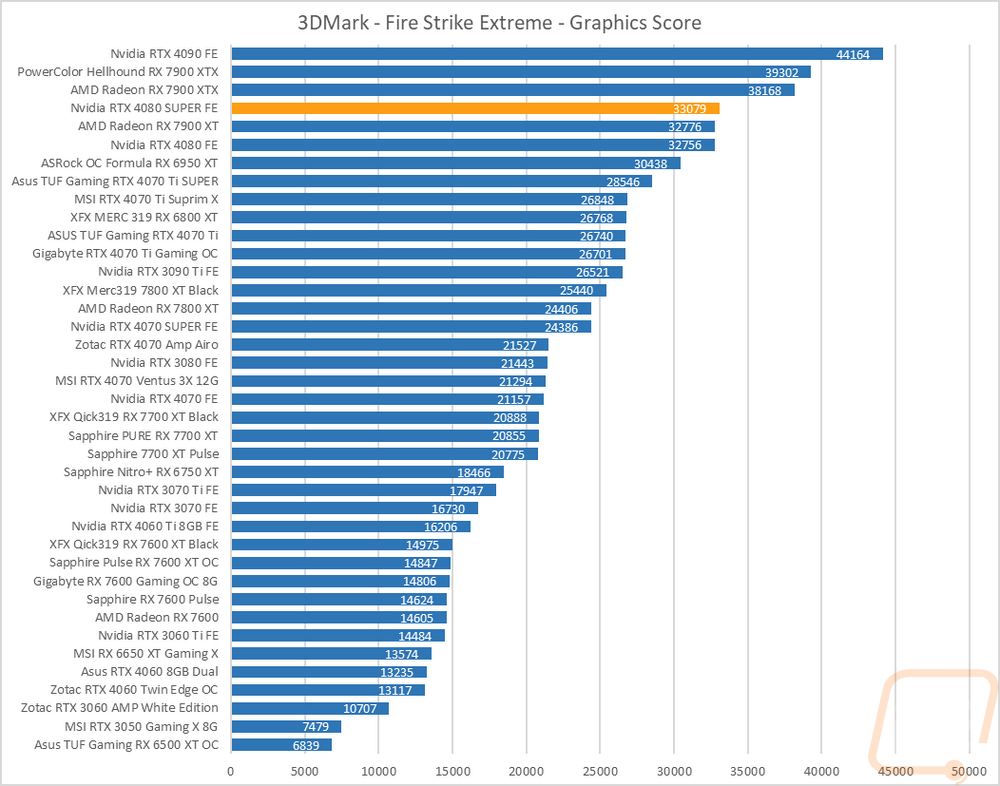
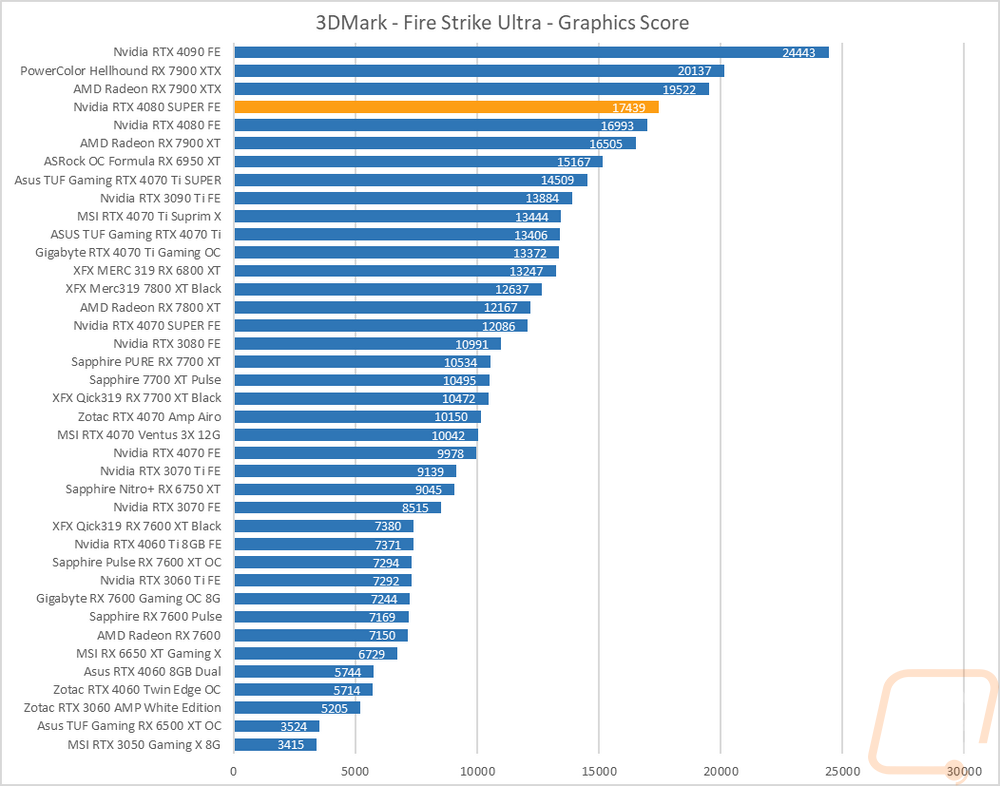
The first round of tests were done in the older Fire Strike benchmark which is a DX11 test. There are three detail levels, performance, extreme, and ultra. The RTX 4080 SUPER Founders Edition in base Fire Strike has improved on the RTX 4080 by 4.4% which isn’t a huge jump and isn’t enough to pass the 7900 XTX. In Fire Strike Extreme that gap is smaller with just 1% between the two cards and because AMD does better on Fire Strike the 7900 XT gets close to catching up. The RTX 4080 SUPER Founders Edition then pulls away again and is 2.6% ahead of the RTX 4080 in Fire Strike Ultra, still not catching up to the 7900 XTX but putting some space between it and the 4080 and 7900 XT.
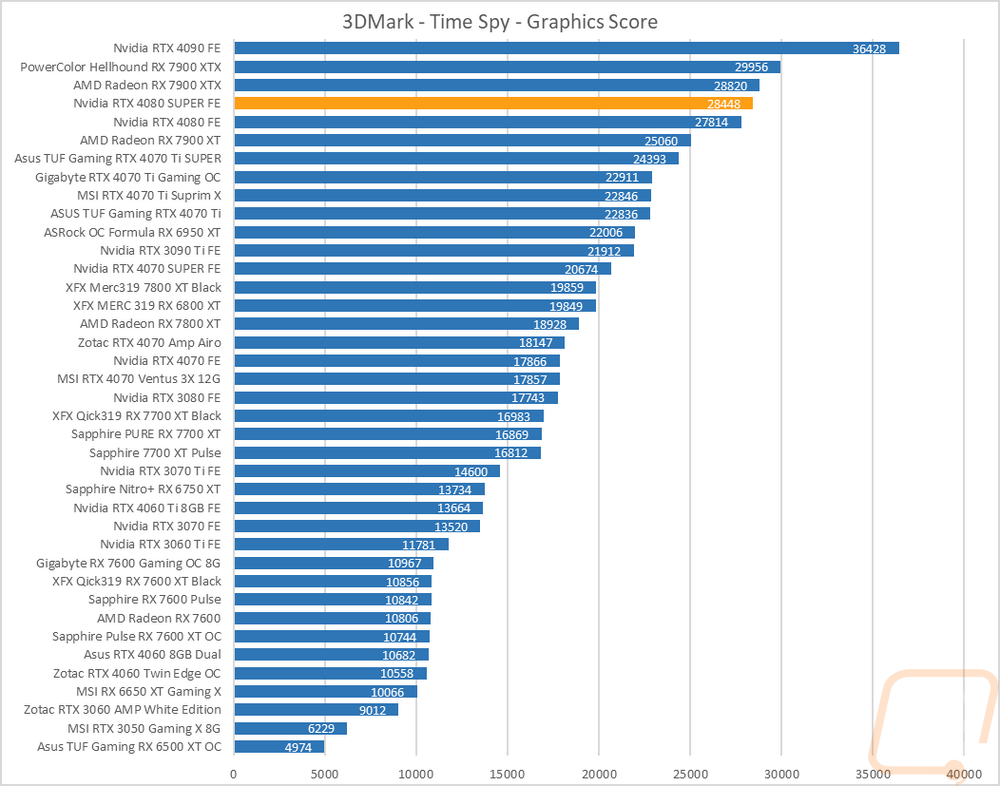
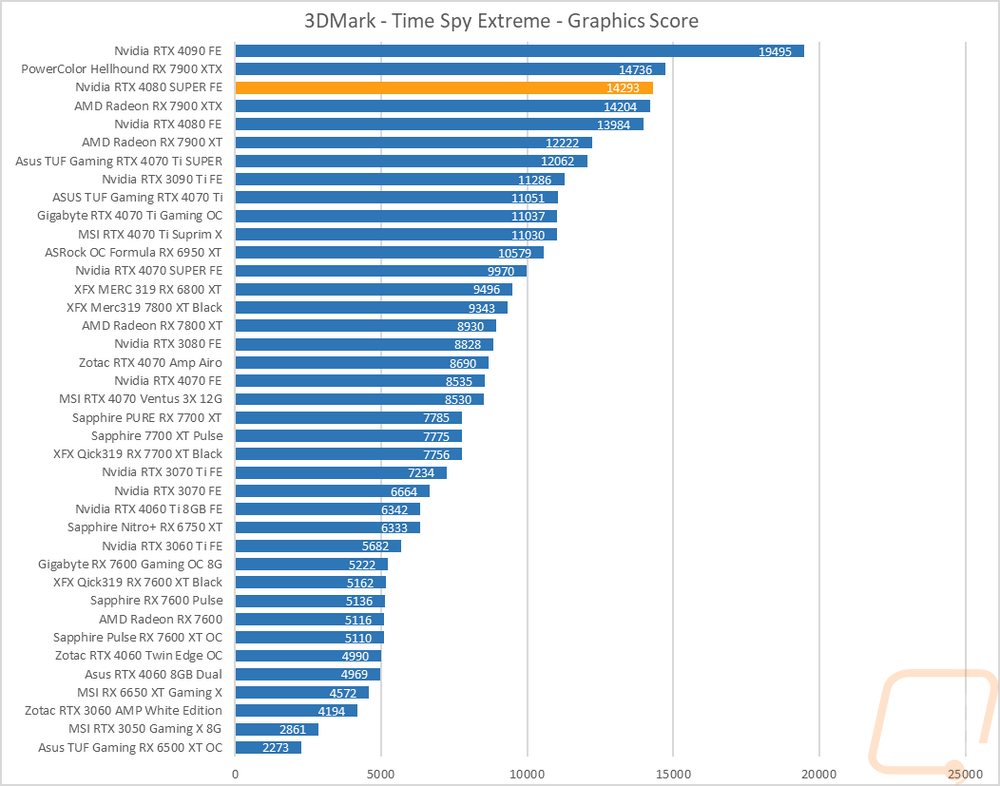
The next two were both based on the Time Spy benchmark. One is the standard test and then there is the extreme detail level. These are both DX12 and with that, the Nvidia cards historically have done a little better. You can see that the RTX 4080 SUPER Founders Edition isn’t too far off from the 7900 XTX in base Time Spy and it has a 2.3% improvement over the RTX 4080. In Time Spy Extreme the gap is similar at 2.2% but it was enough to pass the stock-clocked RX 7900 XTX but not enough to catch up to that Hellhound.
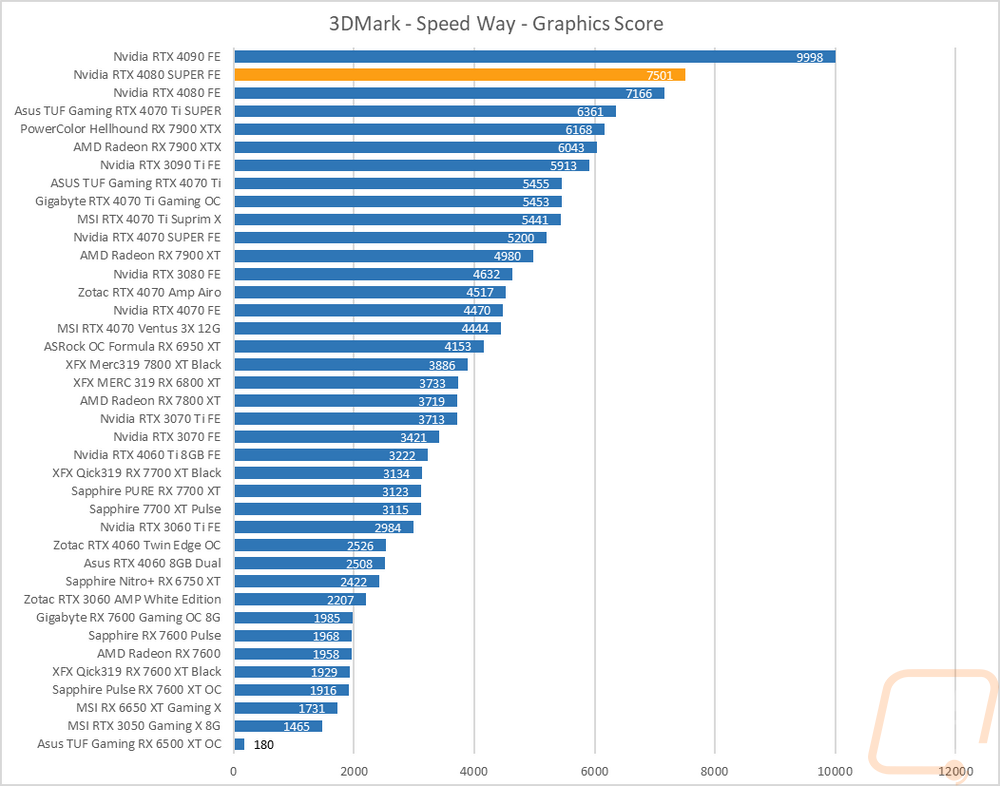
I did also test using the new 3DMark Speed Way which is their latest benchmark. Speed Way is DX12 as well but combines in more future-focused tech like Ray Tracing which up until now 3DMark has only used in feature tests. For this test the AMD cards all drop down significantly, the 4000 Series cards from Nvidia are in their own class when it comes to ray tracing performance it is seen here with the 7070 Ti SUPER even passing the 7900 XTX. The RTX 4080 SUPER Founders Edition gains 4.6% on the RTX 4080 here but that isn’t enough to even get close to the RTX 4090 which is still way out in front.
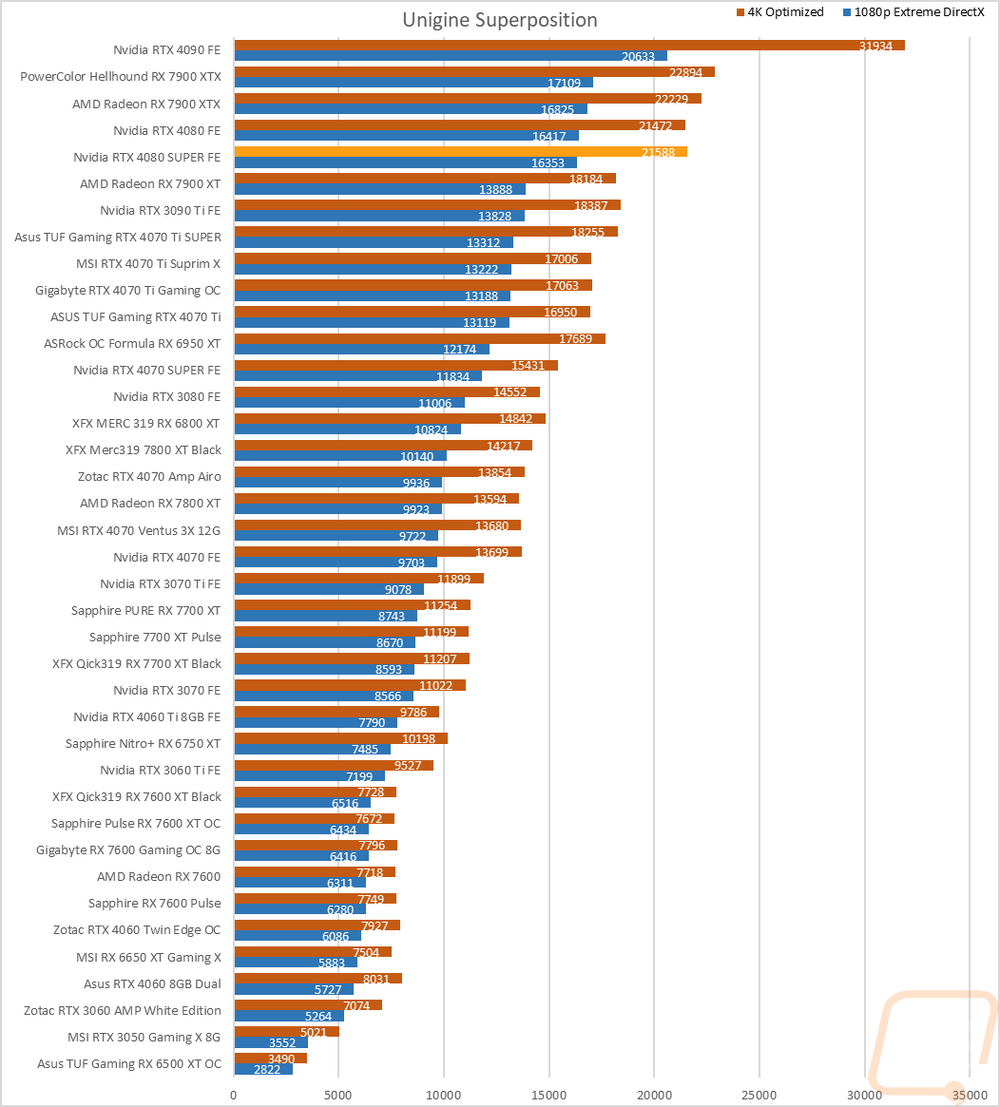
The last test was using the Unigine-based Superposition benchmark and I tested at 1080p with the extreme detail setting as well as the 4K optimized setting. In the extreme detail setting the RTX 4080 SUPER Founders Edition didn’t surpass the RTX 4080 surprisingly. It did on the 4K optimized test which tells us that on the 1080p test, the issue is the CPU being a limitation and some variation on CPU performance. Even at 4k though the RTX 4080 SUPER Founders Edition is just 5% ahead of the RTX 4080 and the RX 7900 XTX is ahead of both.
VR Benchmarks
As for Virtual Reality, I love it but it is more demanding than traditional gaming. This is partially because of the resolutions needed to render for two eyes and because they render more than what is immediately visible. But also because of post effects to get the proper “fisheye” effect for it to look proper in your eyes with the HMD. You also have to have much higher expectations for frame rates in VR, skipping frames or lower FPS can cause motion sickness in VR. Because of that, I ran a few tests.
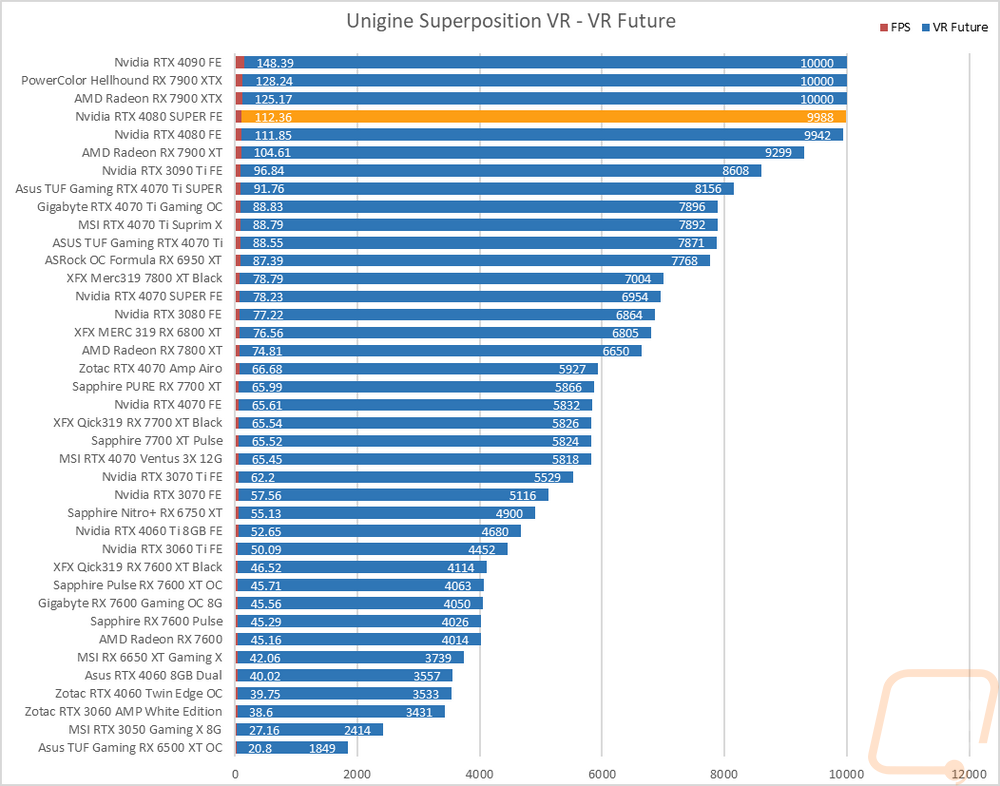
My first test was again in Superposition. This time I tested the VR Future test using the Oculus resolution. I have also included the average frame rate as well which is important for the cards at the top of the chart because for some reason Superposition is capped at 10,000 for its scores and that doesn’t show the performance gap in those cards at the top. The RTX 4080 SUPER Founders Edition and the original RTX 4080 are right on the edge of reaching that 10000 score cap on this benchmark. The RTX 4080 SUPER Founders Edition does edge the RTX 4080 out by 86 points which was half of an FPS when we look at the frame rates. The 7900 XTX and the 4090 though are both up ahead of it.
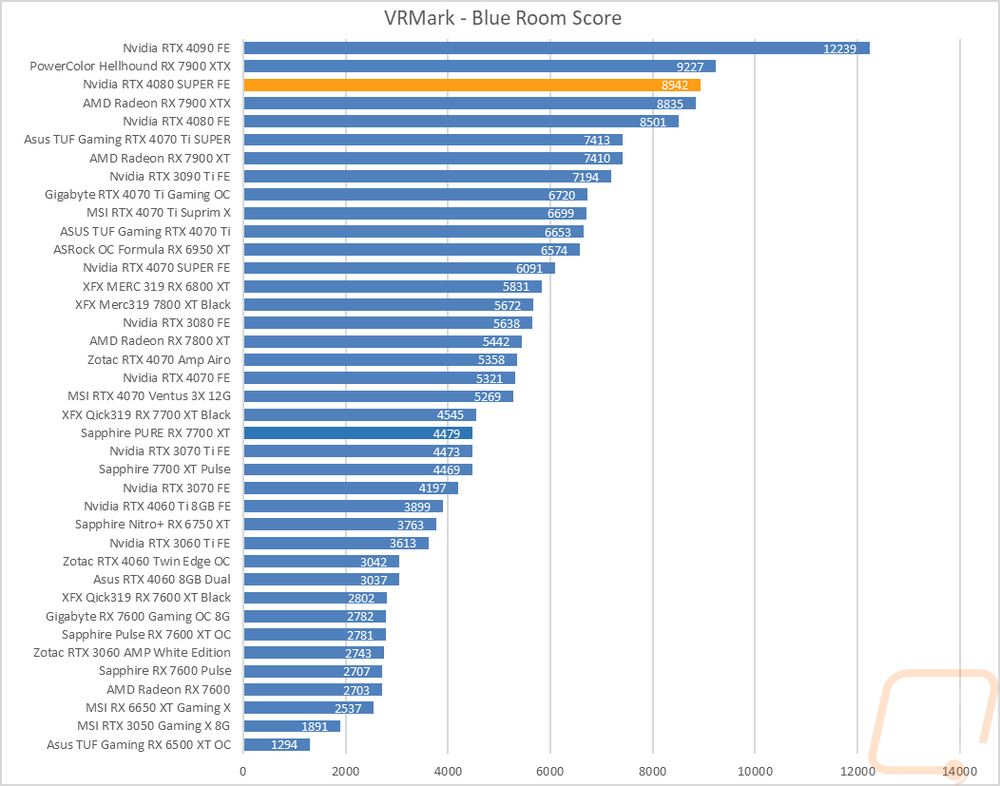
My second round of VR testing was in VRMark which has three tests that are similar to the VR tests in Superposition. I only focused on just the most demanding test called Blue Room which is looking more at future VR performance. The RTX 4080 SUPER Founders Edition improved on the score from the RTX 4080 by 5.2% which was enough to pass the stock clocked 7900 XTX.
In-Game Benchmarks
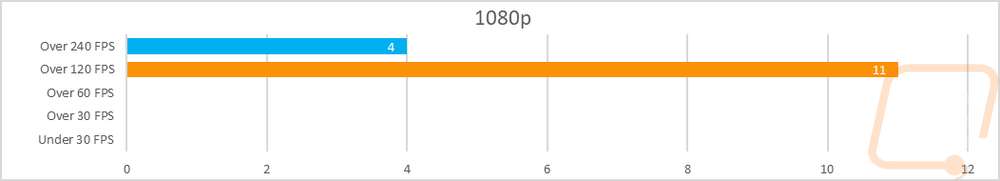
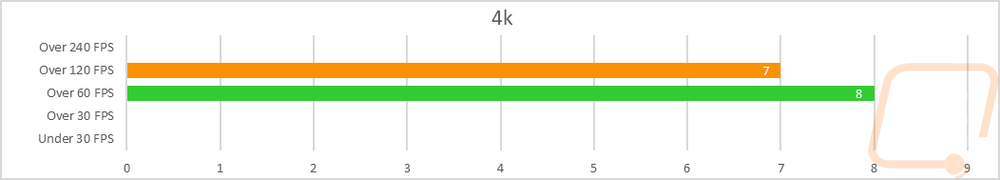
Now we finally get into the in game performance and that is the main reason people pick up a new video card. To test things out I ran through our new benchmark suite that tests 8 games at three different resolutions (1080p, 1440p, and 4k). Most of the games tested have been run at the highest detail setting and a mid-range detail setting to get a look at how turning things up hurts performance and to give an idea of if turning detail down from max will be beneficial for frame rates. In total, each video card is tested 45 times and that makes for a huge mess of results when you put them all together. To help with that I like to start with these overall playability graphs that take all of the results and give an easier-to-read result. I have one for each of the three resolutions and each is broken up into four FPS ranges. Under 30 FPS is considered unplayable, over 30 is playable but not ideal, over 60 is the sweet spot, and then over 120 FPS is for high refresh rate monitors.
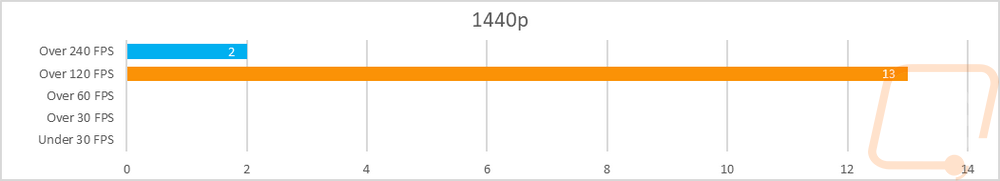
So how did the RTX 4080 SUPER Founders Edition do? Well, this is a card designed for gaming at 4K and we know that a lot of our 1080p tests and some of the 1440p tests reach the limitations of the CPU. But even still at 1080p the RTX 4080 SUPER Founders Edition has all of its results up over 120 FPS with 4 over 240 FPS. 1440p is the same with all of the results over 120 FPS, this time though there were just two up over 240 FPS. Then we get to the 4K where we can finally see the card doing some work but even here none of the games tested averaged under 60 FPS with 8 results between 60-119 FPS and the other 7 were up over 120 FPS.
Of course, I have all of the actual in game results as well for anyone who wants to sort through the wall of graphs below. But to help get a feel for how the RTX 4080 SUPER Founders Edition compares to other cards I have put together averages from all of our tests across all three resolutions comparing the RTX 4080 SUPER Founders Edition to the RTX 4080, RTX 4090, new RTX 4070 Ti SUPER, and the 7900 XT and 7900 XTX from AMD. Like I said before the 1080p results don’t really show just how powerful most of these cards are and the same goes for 1440p as well with a lot of those results being limited by the CPU. It is only the 4K results that let us get a look at things. The RTX 4080 SUPER Founders Edition averaged 3.8% higher FPS than the original RTX 4080 which isn’t a big jump but is a consistent improvement fueled by the higher CUDA core count, even with the clock speeds being lower. The 7900 XTX is still out in front of the RTX 4080 SUPER Founders Edition however sitting 4 FPS higher on the 4k results and the 4090 result is just there to continue to remind people that all of this is just a competition to see what card can come in second place sitting 34 FPS higher than the RTX 4080 SUPER Founders Edition. Interestingly at 1080p and 1440p, the RTX 4080 SUPER Founders Edition did come in higher than the 7900 XTX.
|
Average FPS Across Tested Games |
1080p |
1440p |
4K |
|
ASUS TUF Gaming RTX 4070 Ti SUPER |
213.4 |
183.8 |
114.1 |
|
AMD Radeon RX 7900 XT |
211.1 |
186.6 |
114.8 |
|
Nvidia RTX 4080 FE |
220.7 |
193.5 |
127.5 |
|
Nvidia RTX 4080 SUPER FE |
221.2 |
198.9 |
132.4 |
|
AMD Radeon RX 7900 XTX |
212.9 |
196.7 |
136.7 |
|
Nvidia RTX 4090 FE |
232.7 |
217.3 |
166.0 |
Compute Benchmarks
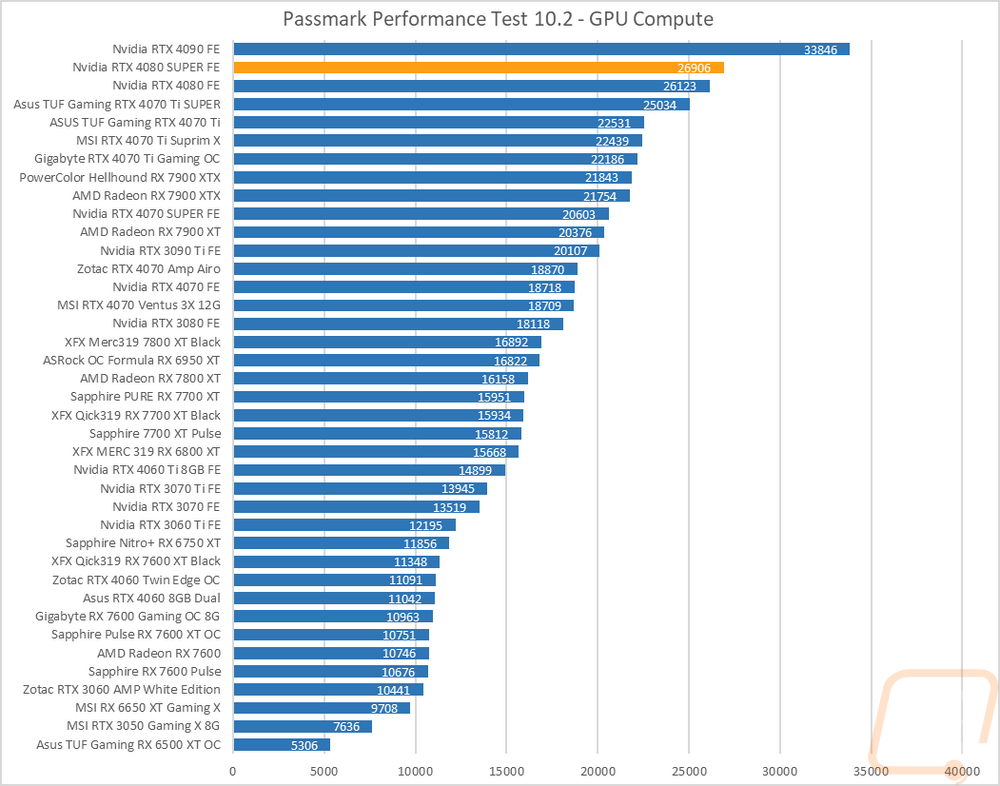
Now some people don’t need a video card for gaming, they need the processing power for rendering or 2D/3D production, or in some cases people who game also do work on the side. So it is also important to check out the compute performance on all of the video cards that come in. That includes doing a few different tests. My first test was a simple GPU Compute benchmark using PassMark's Performance Test 10 and the RTX 4080 SUPER Founders Edition came in second place to the RTX 4090. The RTX 4080 SUPER Founders Edition improved on the RTX 4080 score by 3% which is in line with what we have seen in other tests.
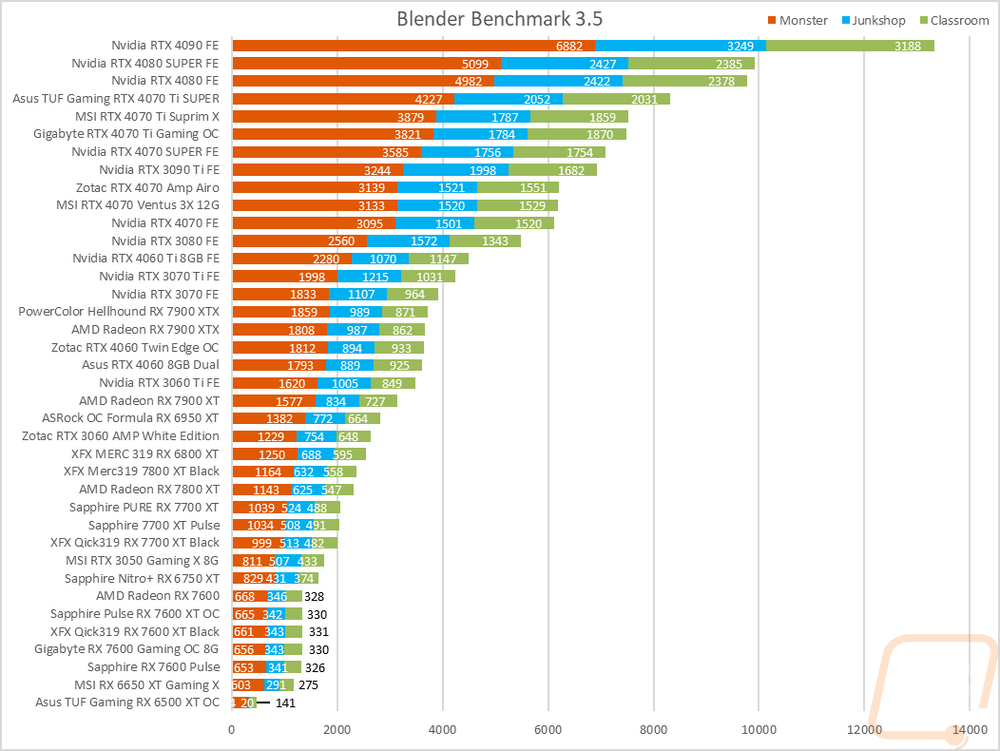
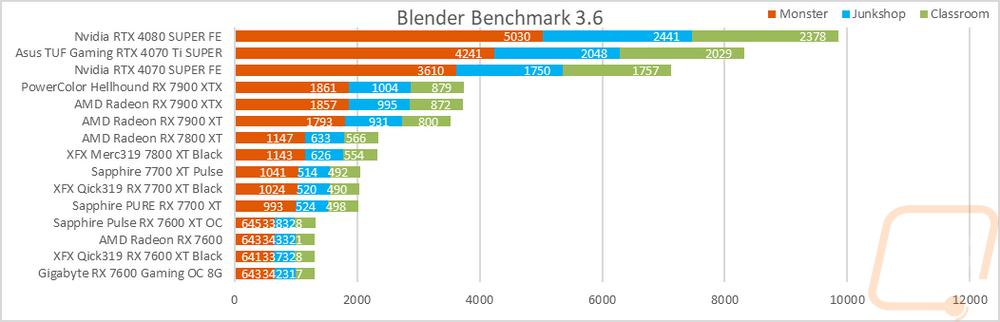
Blender has always been my favorite compute benchmark because the open-source 3D rendering software is very popular and it isn’t a synthetic benchmark. With the latest version of Blender, they redid the benchmark so we now have a new test that runs three different renderings and gives each a score. I have all three stacked together so we can see the overall performance. The RTX 4080 SUPER Founders Edition does improve on the RTX 4080 slightly but the big news here is just how far out in front the Nvidia cards are in general with even the flagship 7900 XTX back behind the RTX 3070.
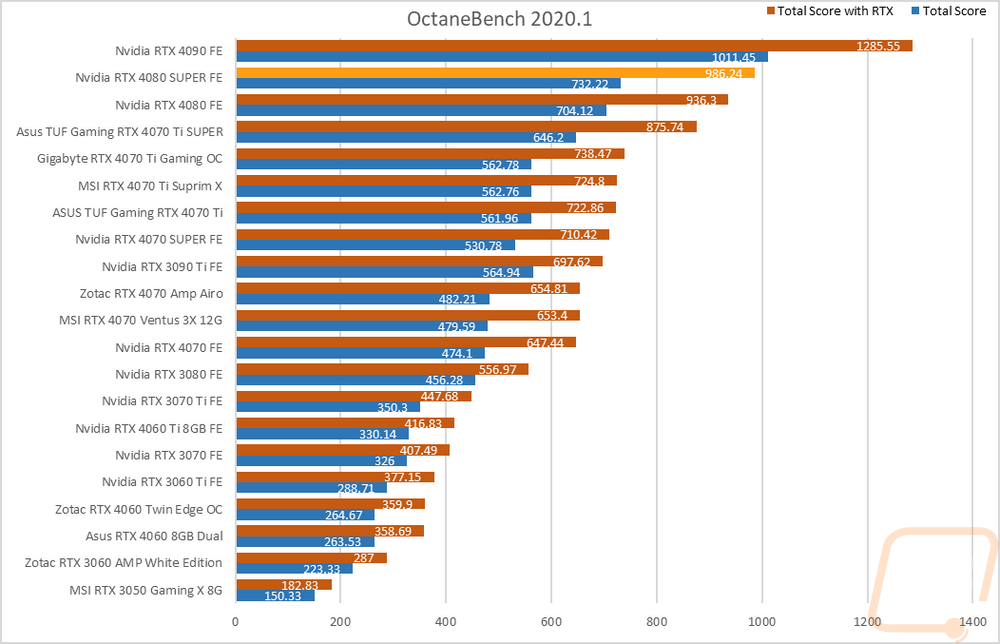
For CUDA-based cards, I also check out OctaneRender performance using their OctaneBench 2060.1 benchmark which allows me to check out both RTX and non-RTX rendering performance. Here the RTX 4080 SUPER Founders Edition improved on the RTX 4080 score by 5.3% on the RTX result and 4% on the non-RTX test.
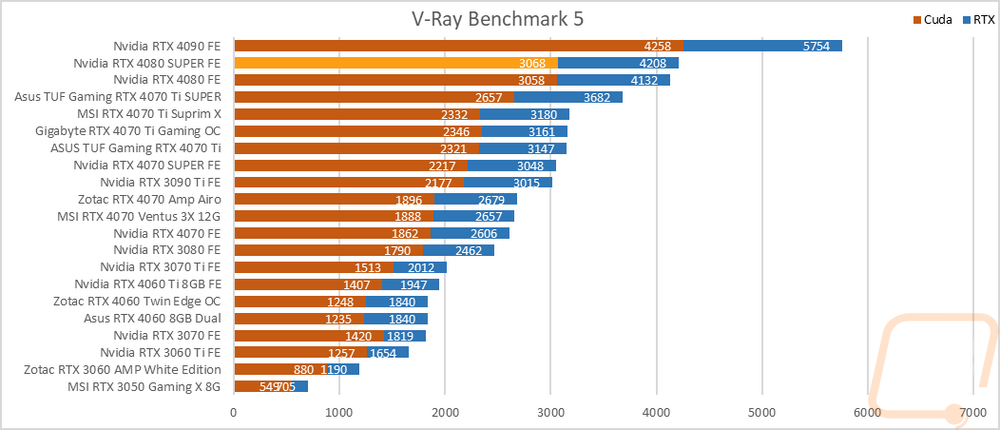
An additional CUDA-based test I also ran V-Ray Benchmark 5 to check out CUDA and RTX performance in the 3D rendering and simulation software. The RTX 4080 SUPER Founders Edition didn’t pull away from the RTX 4080 as much here with just a 1.8% improvement with RTX and just .3% on the CUDA test.
RTX and DLSS
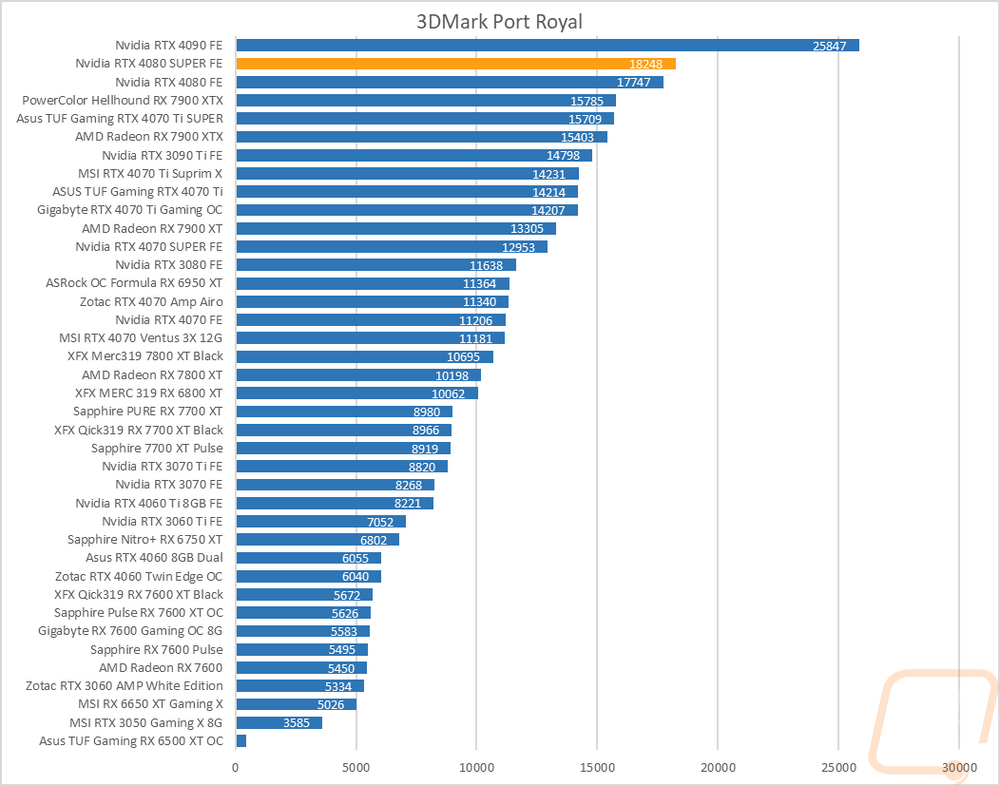
Being an RTX card I also like checking out the performance of some of Nvidia’s features. Namely the ray tracing performance and the performance improvements you can see by using DLSS combined with the tensor cores. My first test goes back to our synthetic benchmarks with 3DMark where I check out their Port Royal benchmark. This is the one test that does also have AMD Ray Tracing support which is great to get a look at how different cards including older non-RTX cards perform. The RTX 4080 SUPER Founders Edition is up at the top here, just like on Speed Way. It has a 2.8% improvement on the original RTX 4080 but is still WAY behind the RTX 4090 which is in its own glass.
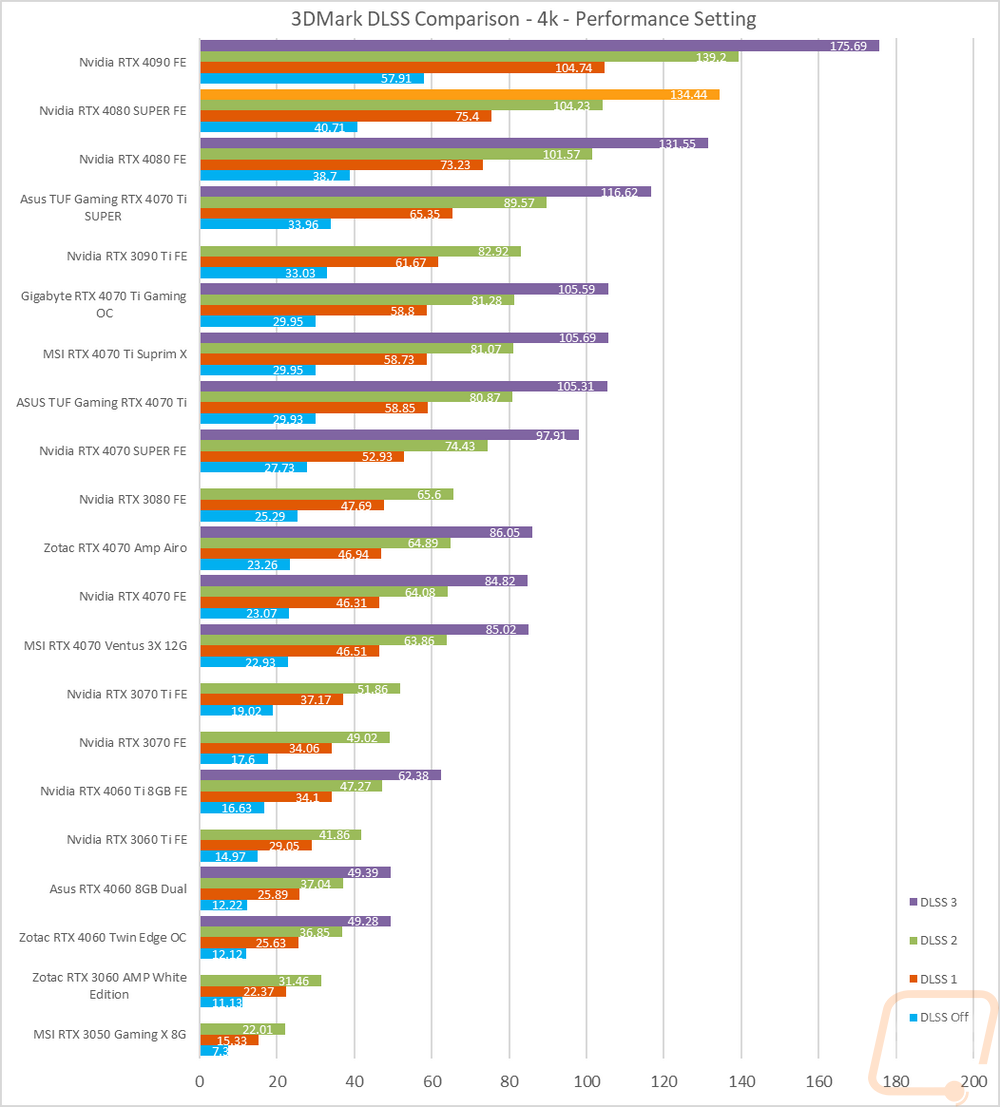
3DMark also has added in a few feature tests, one being a look at DLSS performance. For this one, I have the resolution set to 4K and I test with all three versions of DLSS as well as with it off completely. All DLSS are set to their performance setting as well to keep the results comparable. This gives us a great look at the performance improvements that DLSS has given with DLSS 3 also including frame generation. The RTX 4080 SUPER Founders Edition is up at the top behind the RTX 4090 of course. But this test mostly is here just to show what kind of gains you can see with DLSS depending on which version you are using. The RTX 4080 SUPER Founders Edition goes from 40 FPS without it up to 75 with DLSS 1, 101 FPS with DLSS 2, and 134 FPS with DLSS 3 which has frame generation.
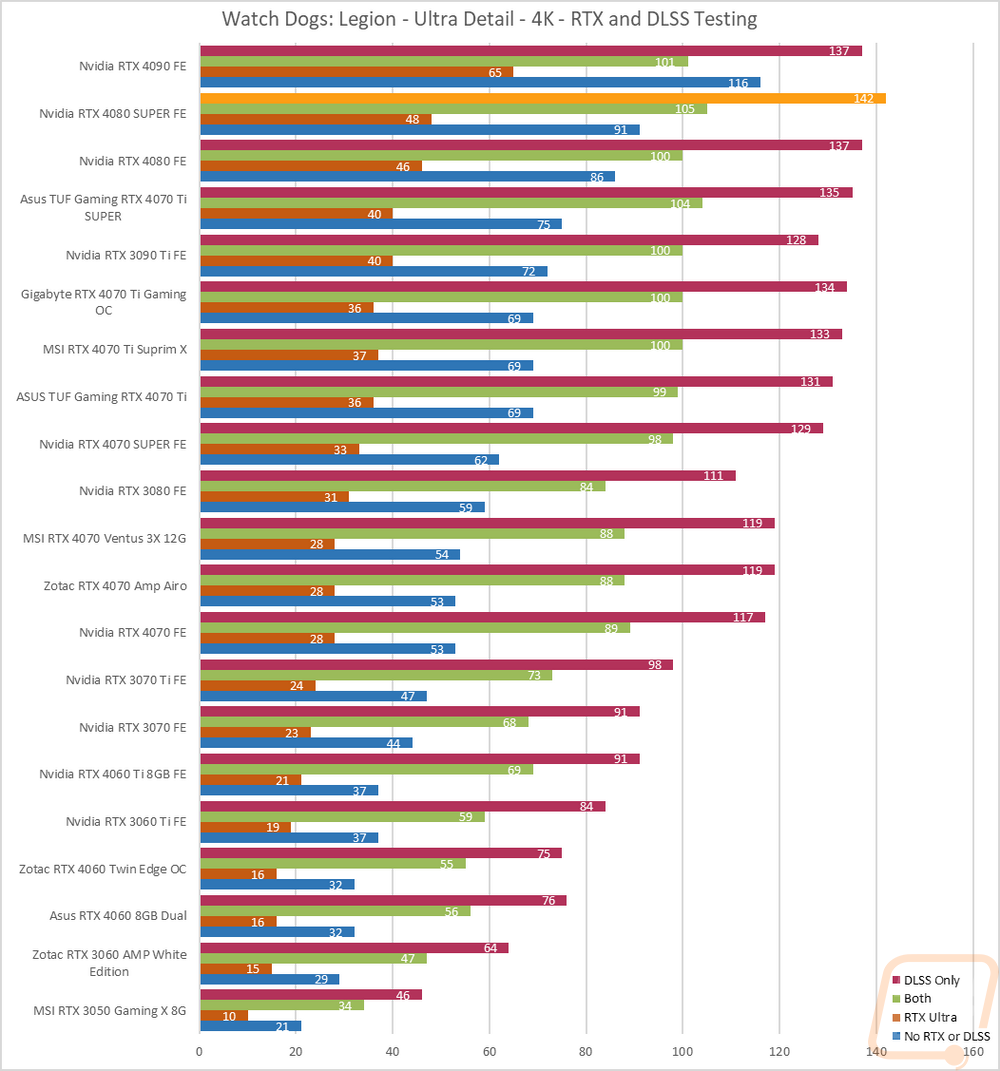
I then jumped into game tests, this time with Watch Dogs: Legion. For this one, I wanted to get an idea of the performance you will see when taking advantage of Nvidia’s RTX and DLSS features. I tested at 4k with the ultra detail setting and with ultra being the setting for DLSS and RTX when they are on as well. I then test with no RTX or DLSS on and then with RTX DLSS on and off and on together. Here the RTX 4080 SUPER Founders Edition did really well, edging out the RTX 4080 by a few FPS with RTX on and 5 FPS with the DLSS only result. This gives a good look at how DLSS pairs up with RTX as well as a way to cover up the performance drops that having RTX on does. With the RTX 4080 SUPER Founders Edition the frame rate went from 91 FPS down to 48 with RTX on but adding DLSS on at the same time gave an average of 105 FPS and 142 FPS with just DLSS on.
I also wanted to take a look at DLSS 3 performance as well a little more than my initial look at it with 3DMark’s benchmark. For this, I put Nvidias Frameview to the test to run a few benchmarks using the games that currently support DLSS 3. For games with a built-in benchmark, I ran the benchmark but used frameview so we could get the FPS and 1% lows and because with some of the games frame generation is messing up their in game FPS readouts. V-Sync was turned off on all of the tests because it currently causes problems with frame generation and all of the tests were done at 1080p, 1440p, and 4k with the highest detail settings including the highest RTX settings. DLSS 3 when there is an option was set to performance.
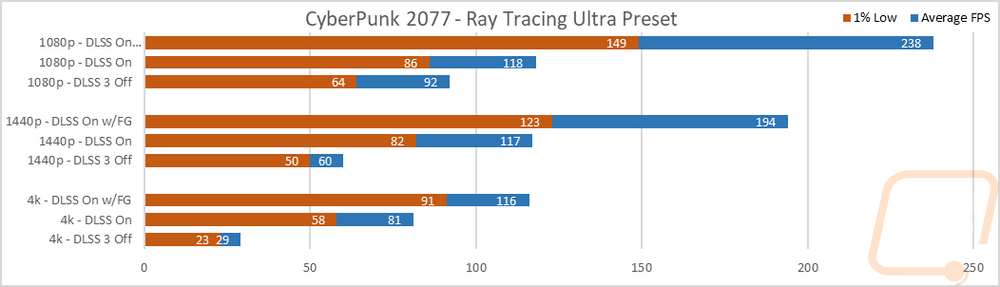
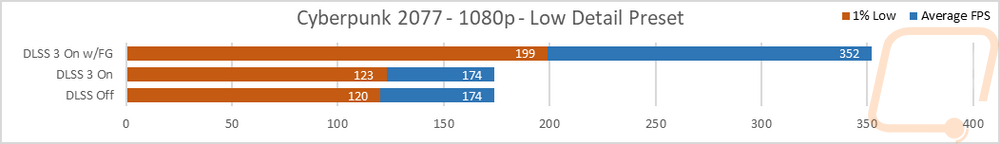
The first game tested was Cyberpunk 2077 and for this one, I tested at 1080p, 1440p, and 4K. I also did a fourth test at 1080p and low settings to get a look at how frame generation helps when CPU limited. At all three resolutions having DLSS on with frame generation puts out crazy performance numbers. With the detail cranked completely up the RTX 4080 SUPER Founders Edition struggled at 4K at just 29 FPS. Adding DLSS improved that up to 81 FPS but with frame generation as well it reached 116 FPS which is up into high refresh rate range. The same can be seen at 1080p and 1440p but because of the power of the RTX 4080 SUPER Founders Edition in those tests frame generation shows an even larger performance improvement because it likes CPU-limited situations. This can be seen when I tested at 1080p on the lowest detail where DLSS on and off made no difference but turning frame generation took it from 174 FPS up to 352 FPS. Twice the performance.
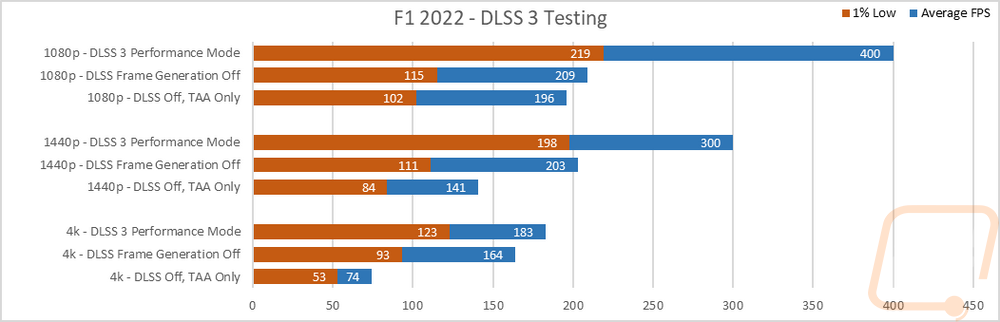
In F1 2022 I ran three tests. I tested with full DLSS, I did it again but turned off frame generation, and then tested with DLSS off and TAA on. Frame generation here was big at 1080p and 1440p but I did once again run into issues with it at 4K which is an issue I’ve seen on all of the cards not just the RTX 4080 SUPER Founders Edition. Frame generation here is a great way to get the refresh rate up into crazy numbers like 360 Hz and higher.
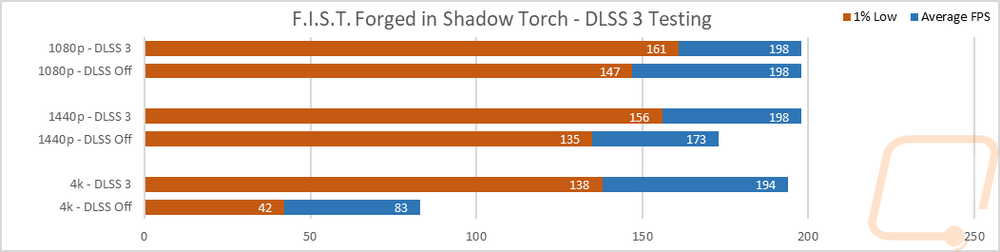
In the side scroller Forged in Shadow Torch, the game has limitations capping it at 198 FPS so the DLSS settings didn’t make much of a difference at 1080p other than the 1% lows, and at 1440p it helped some but not a lot. But at 4k you can see the frame rates jump up from 83 FPS up to 194 with DLSS and frame generation, that’s huge!
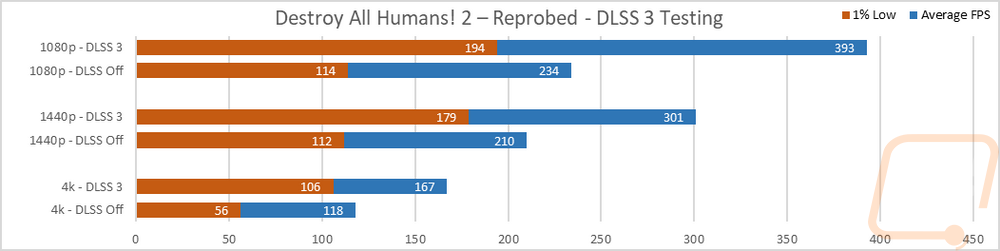
Next up was Destroy All Humans! 2 – Reprobed. The RTX 4080 SUPER Founders Edition performed really well at all three resolutions here and you could argue that DLSS isn’t needed but it does also improve on the 1% lows which should help the game to feel slower even if you aren’t able to take advantage of those crazy high frame rates.
Last I look at Microsoft Flight Simulator and this is an interesting case because this is a well-known CPU-limited game. To keep things consistent the test used the landing test run over Sydney With DLSS off and again with DLSS and frame generation. This included having DLSS on the quality setting, you can get even better performance by changing that and with the detail settings on their highest settings. I tested at 1080p, 1440p, and 4k. You can spot the CPU limitation here as well with all of the DLSS and DLSS off results sitting there at 64 or 65 FPS but look at how much frame generation helps here. Sometimes it just doesn’t matter how powerful your video card is and with some games even the highest-end CPUs are still going to run into a wall. In this case, our test bench has a 13900K which isn’t the flagship anymore but still isn’t slow. But frame generation helped get from playable up into high refresh rate capable frame rates at all three resolutions.
Cooling Noise and Power
For my last few tests, rather than focusing on in game performance, I like to check out other aspects of video card performance. These are also the most important ways to differentiate the performance between cards that have the same GPU. To start things off I took a look at power usage.
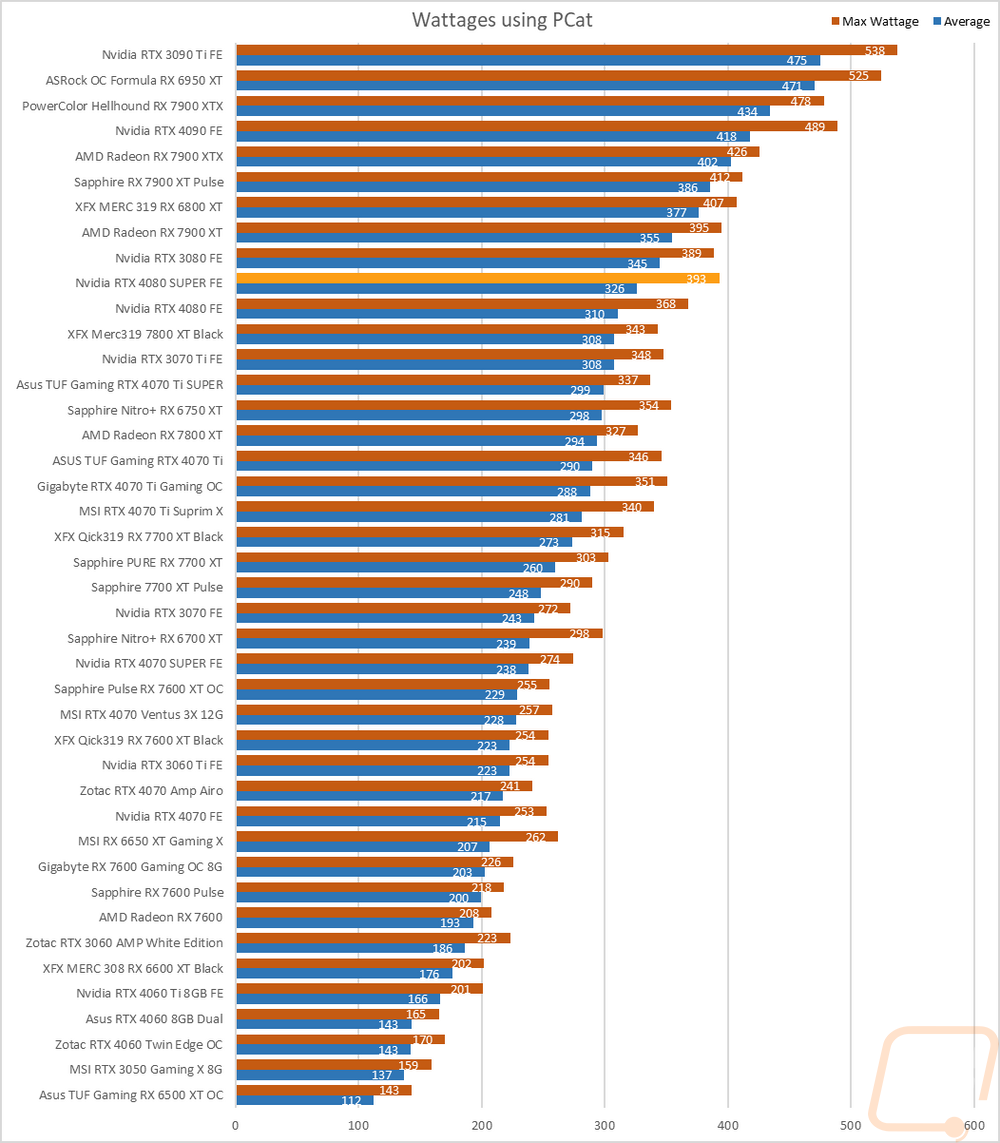
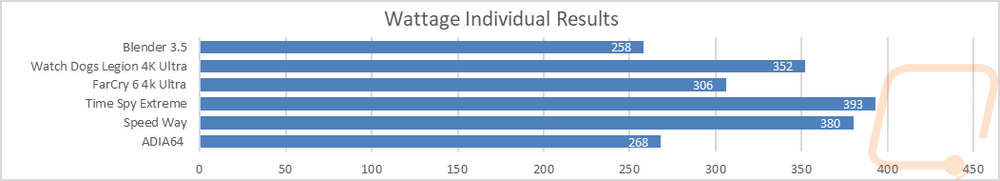
For this, our new test setup utilizes the Nvidia-designed PCat v2 along with cables to handle both traditional 6 or 8-pin connections as well as the new 12VHPWR. The PCat also utilizes a PCIe adapter to measure any power going to the card through the PCIe slot so we can measure the video card wattage exclusively, not the entire system as we have done in the past. I test with a mix of applications to get both in game, synthetic benchmarks, and other workloads like Blender and AIDA64. Then everything is averaged together for our result. I also have the individual results for this specific card and I document the peak wattage result as well which is almost always Time Spy Extreme. The RTX 4080 SUPER Founders Edition averaged 326 watts across the different peak results which is 16 watts higher than the original RTX 4080. The peak power however was higher at 393 watts to 368 watts for the original for a delta of 25 watts. The bump in power still has the RTX 4080 SUPER Founders Edition behind the RTX 3080 and well below the RX 7900 XT let alone the 7900 XTX which was 402 watts on the average, 76 watts above the RTX 4080 SUPER Founders Edition.
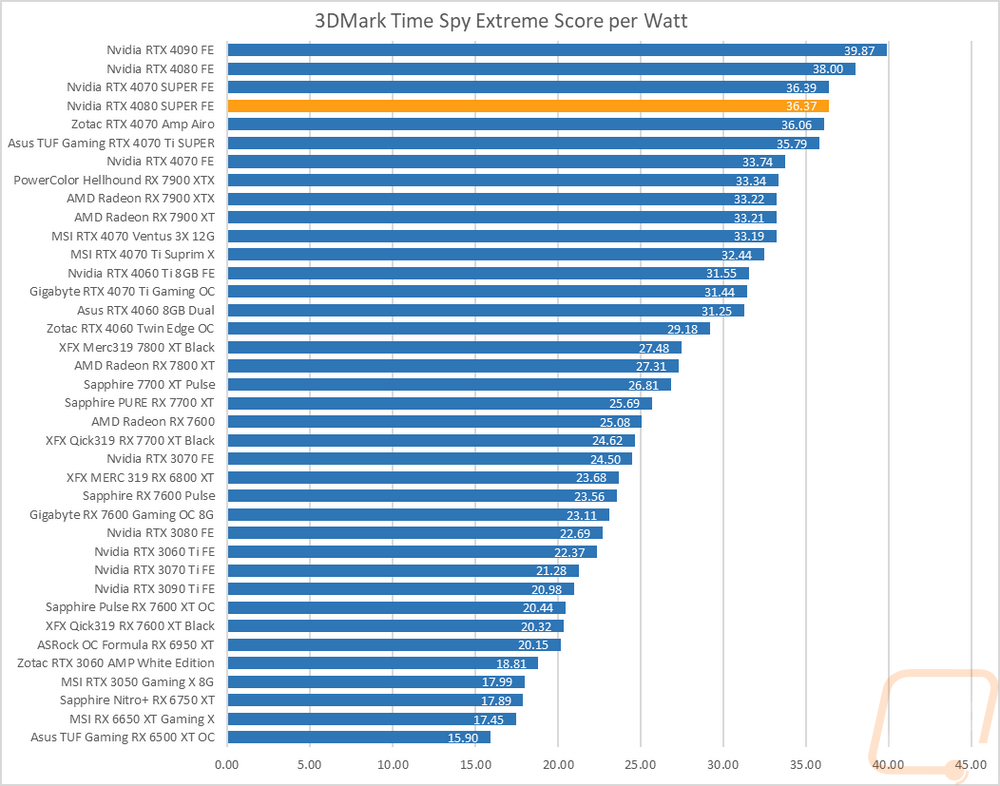
With having exact peak wattage numbers when running Time Spy Extreme I was also able to put together a graph showing the total score for each watt that a card draws which gives us an interesting look at overall power efficiency in the popular and demanding benchmark. With this test, I really wasn’t sure if the RTX 4080 SUPER Founders Edition would end up going up or down this chart. Officially it has the same TGP as the original RTX 4080 but as we saw in the previous test the average and peak numbers did go up and we know that the performance improvement while consistent wasn’t a big jump. All of that does show here with the RTX 4080 SUPER Founders Edition sitting at 36.37 points per watt which is still impressive but just a hair behind the new RTX 4070 SUPER and 1.63 points per watt lower than the original RTX 4080. This is still 3 points over the 7900 XTX but in getting the performance bump the overall efficiency did drop a little.
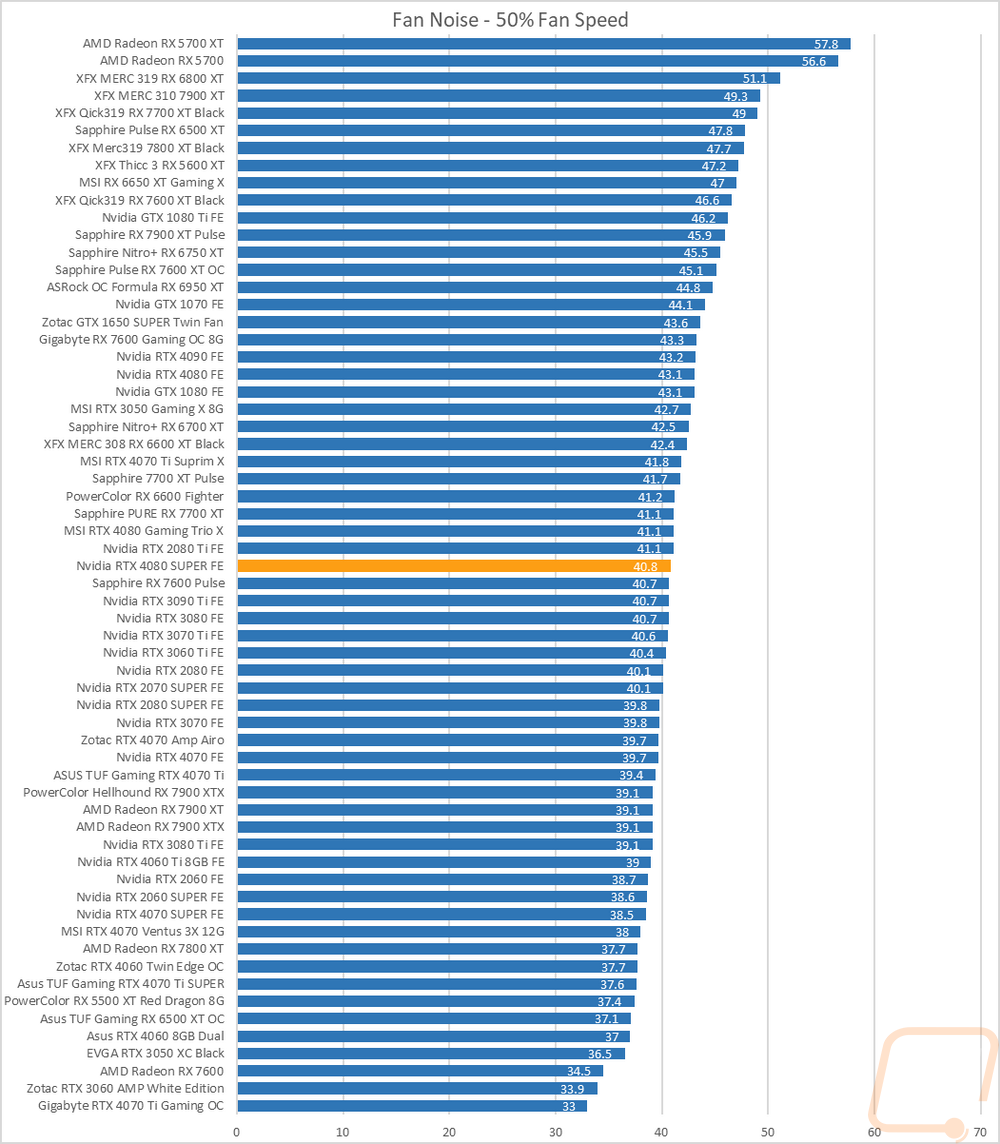
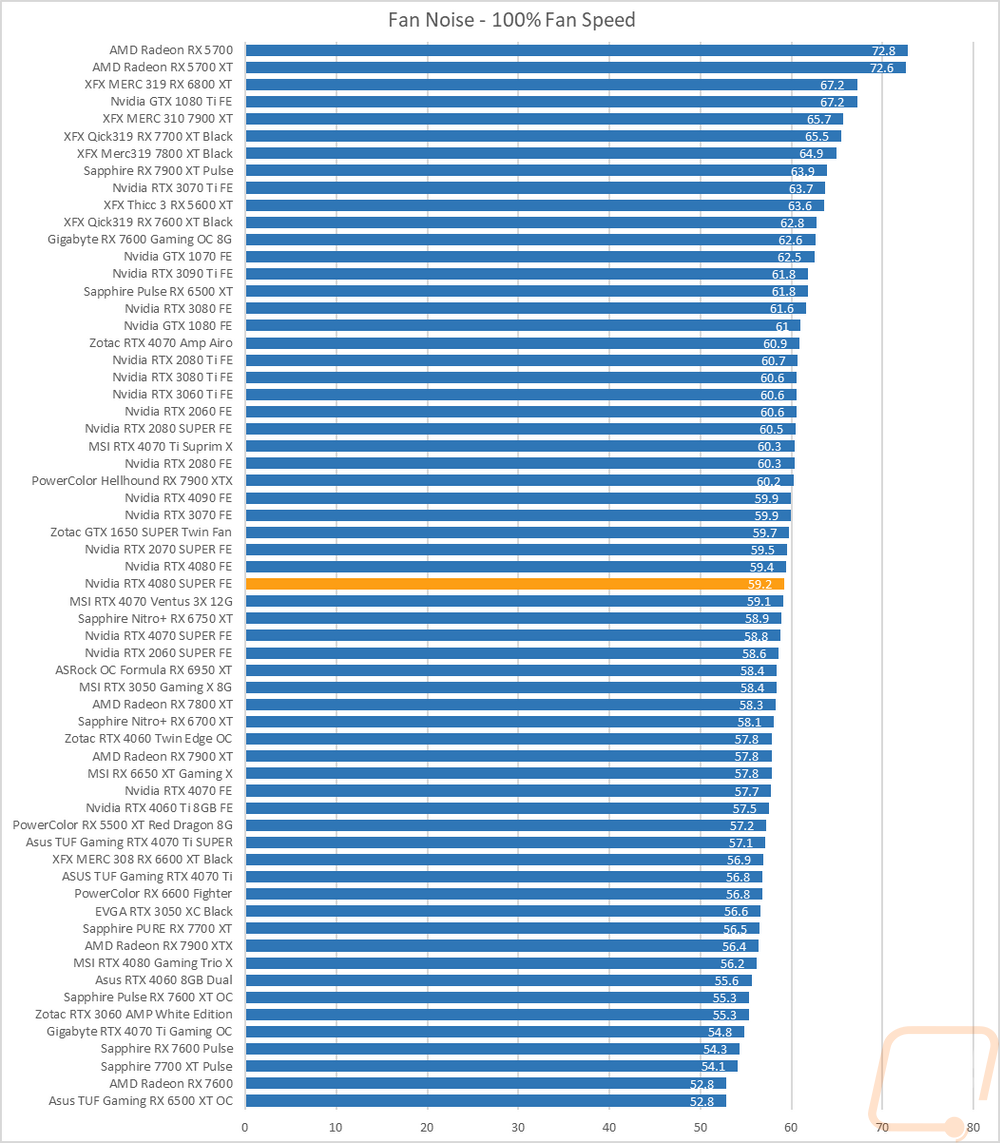
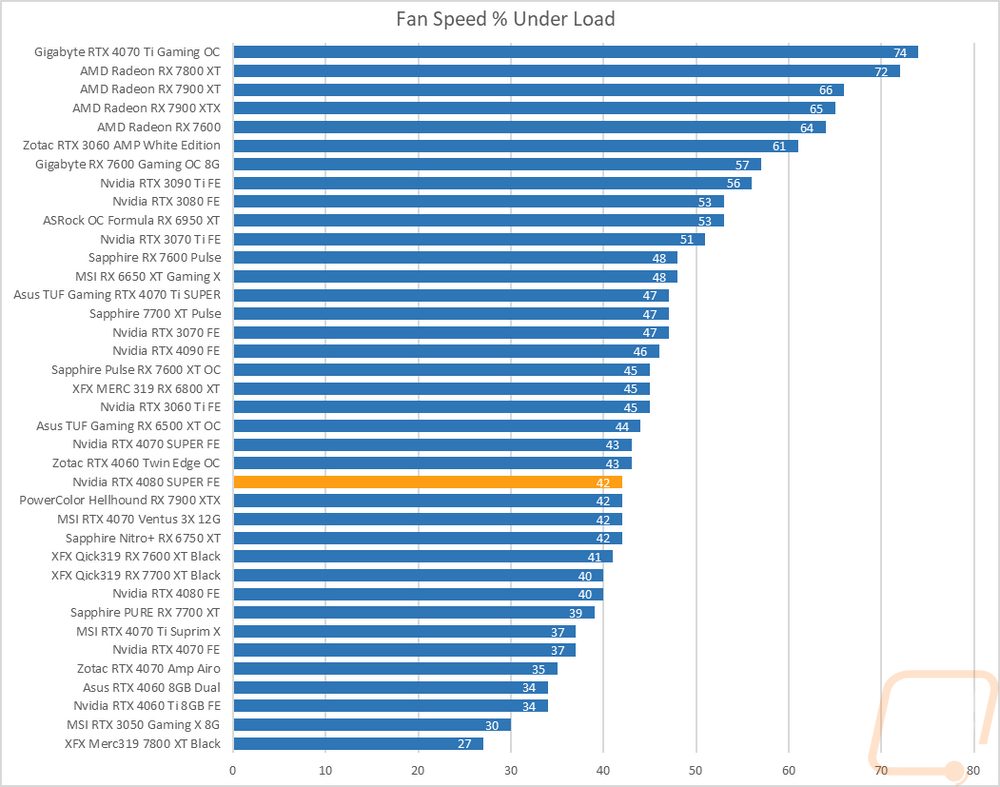
My next round of tests were looking at noise levels. These are especially important to me because I can’t stand to listen to my PC whirling. Especially when I’m not in game and other applications are using the GPU. For my testing, though I first tested with the fan cranked up to 100% to get an idea of how loud it can get, then again at 50% to get an idea of its range. The RTX 4080 SUPER Founders Edition fell right into the middle of the pack on both the 50% and 100% fan speed tests and surprise surprise the original RTX 4080 Founders Edition is right there with it on the 100% fan speed result. That shouldn’t be a surprise given that they are basically the same cooler other than the color.
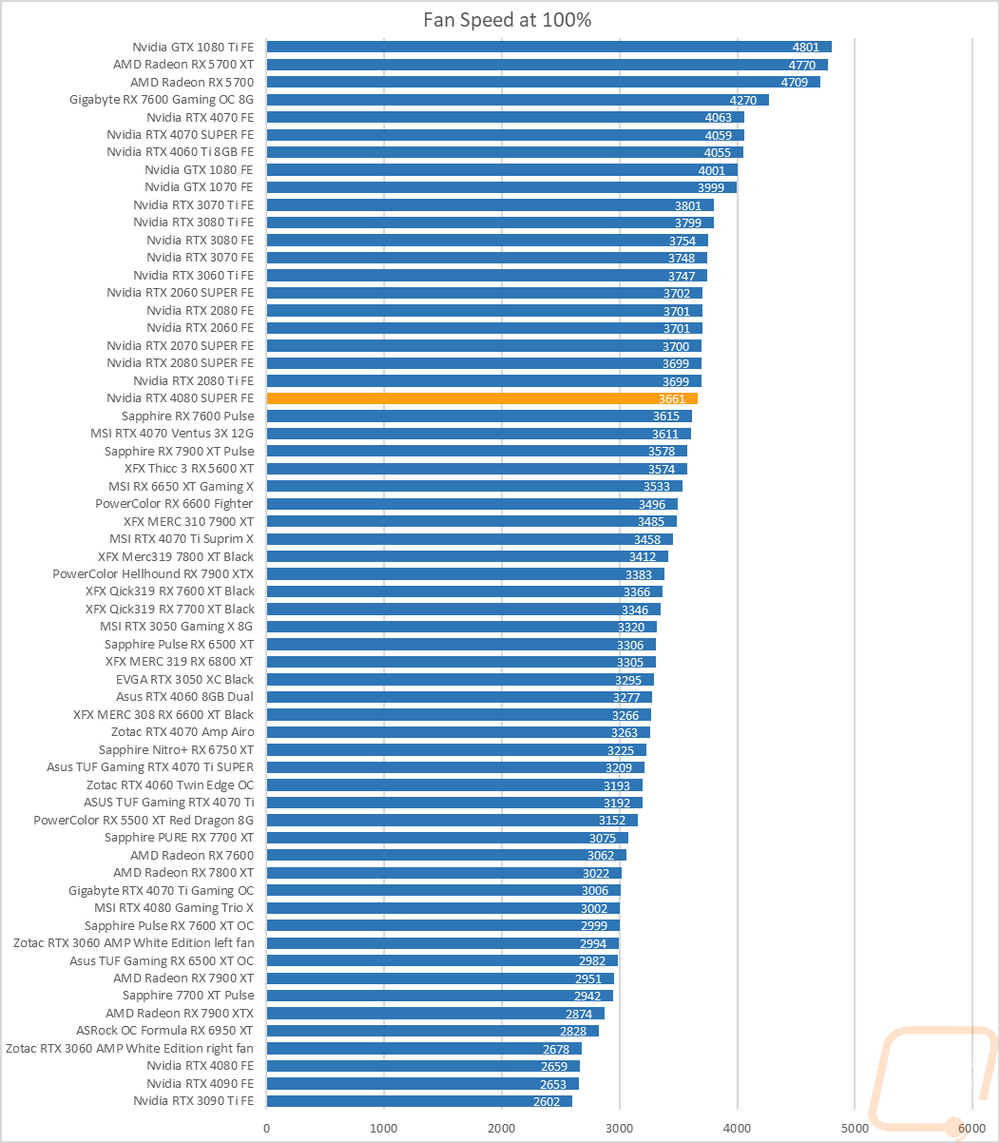
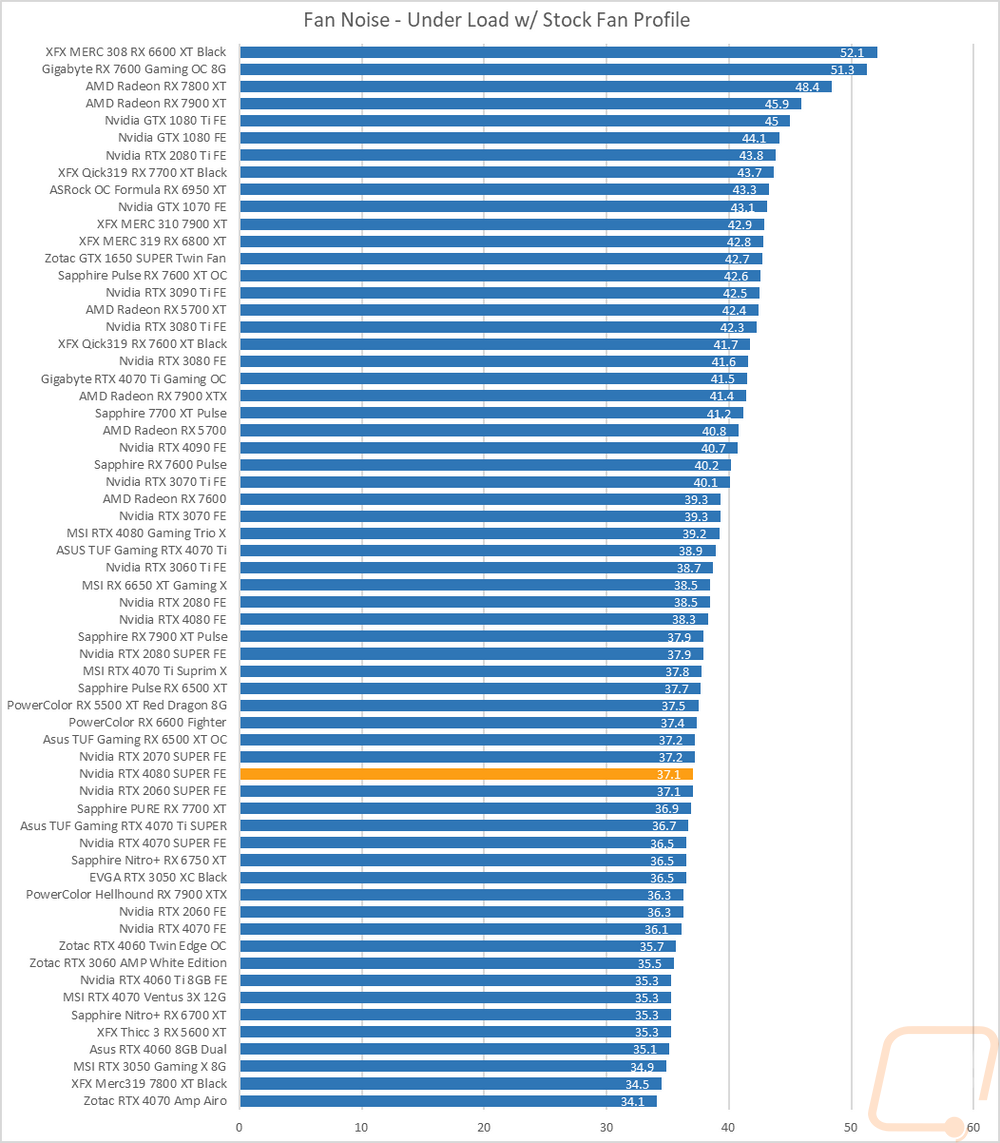
I also take a look at noise performance while under load. For that when running AIDA64’s stress test I wait until the temperature of the card has leveled off and then measure how loud things are when the card is at its worst-case scenario with the stock fan profile. Here the RTX 4080 SUPER Founders Edition did better than you might expect for a Founders Editon card with the stock fan profile coming in at just 37.1 decibels. This was right in the middle with cards like the 2070 SUPER and 2060 SUPER as well and was just below the RTX 4080 as well. The card was running at 42% fan speed when under load which is a big reason for the quiet performance.
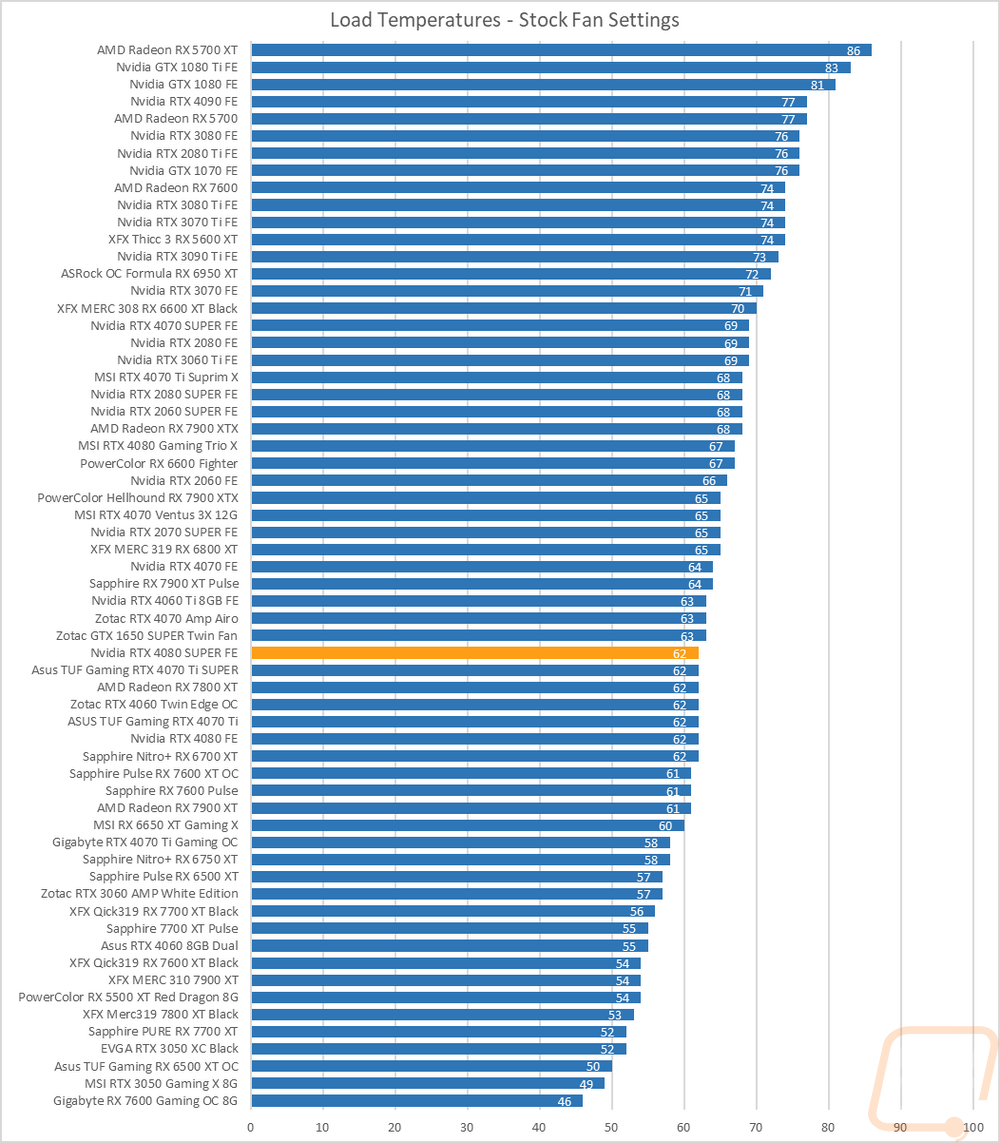
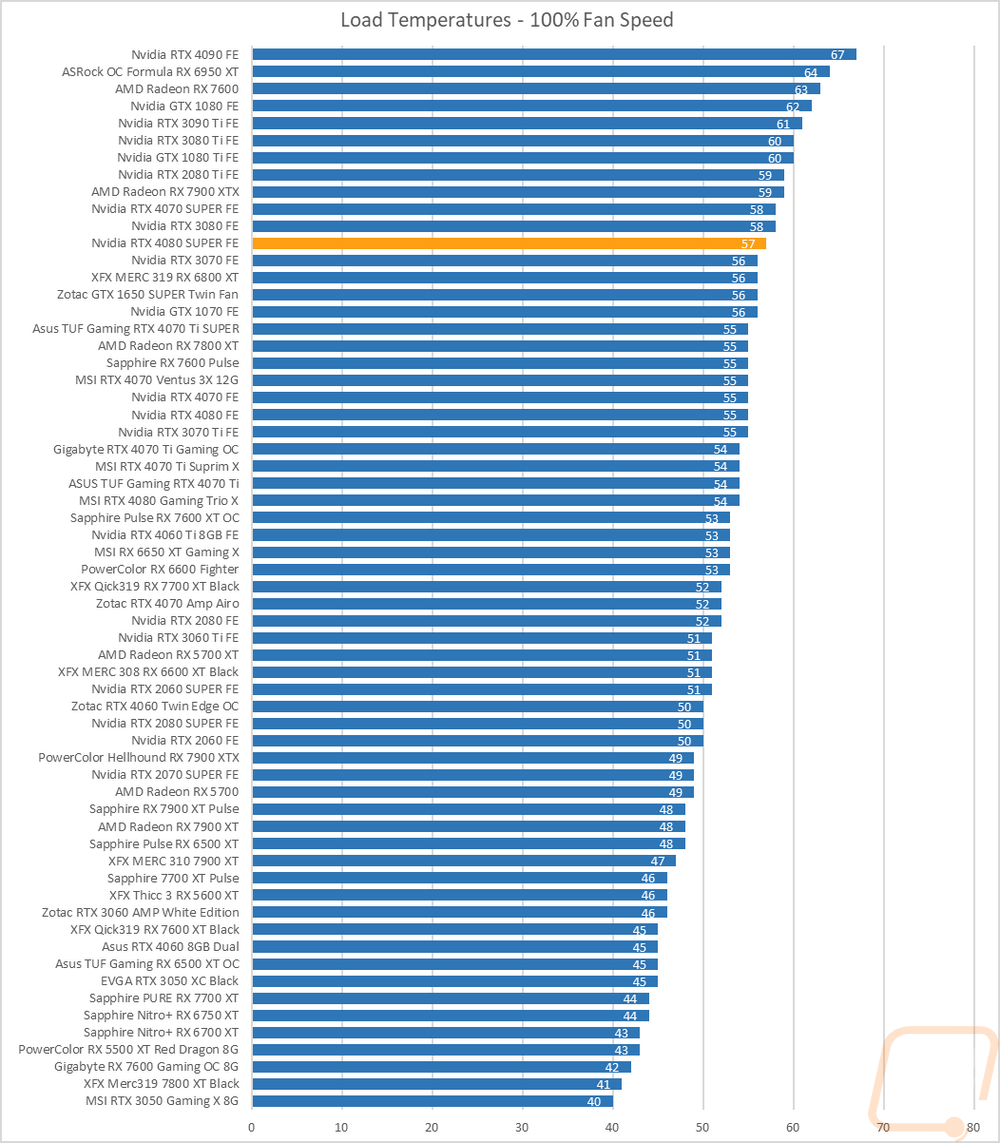
To finish up my testing I of course had to check out the cooling performance. To do this I ran two different tests. I used AIDA64’s Stress Test run for a half-hour each to warm things up. Then I documented what temperature the GPU leveled out at with the stock fan profile and then again with the fans cranked up to 100%. With the stock profile, the RTX 4080 SUPER Founders Edition was running at 62c in our load test. There is a big clump of cards all running at that same temperature including the original RTX 4080. The AMD RX 7900 XTX on the other hand for comparison is up a little higher at 68c. For GPU Hotspot the RTX 4080 SUPER Founders Edition was running cool at 76c, down near the bottom of our chart and memory was at just 58c which is great as well. Both were a little warmer than the original RTX 4080 FE but still a lot better than almost everything else tested.
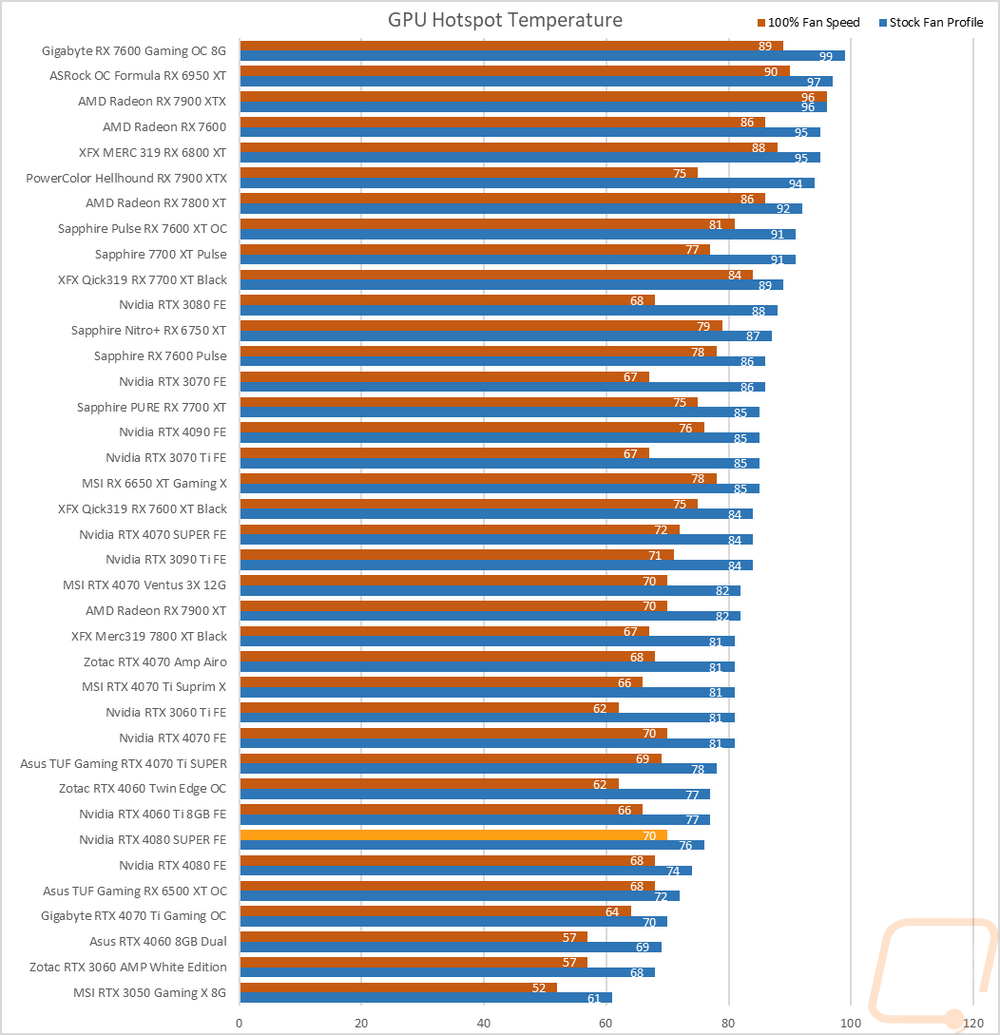
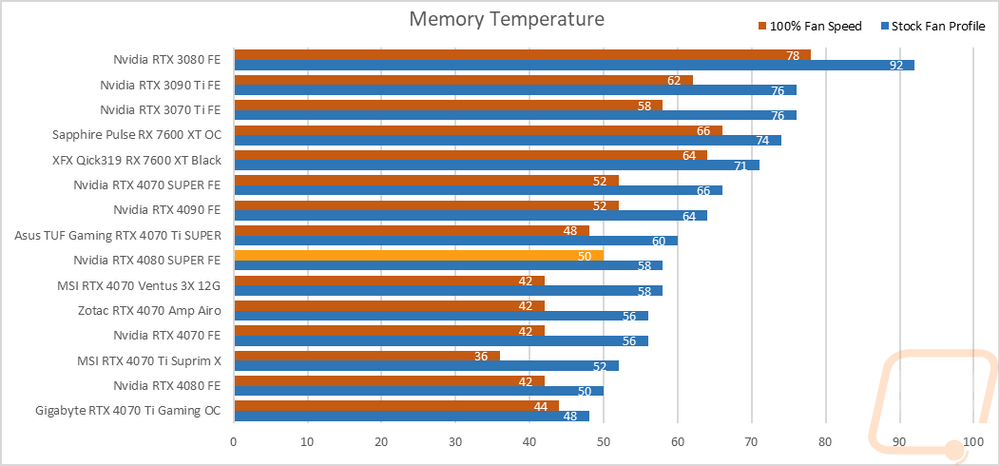
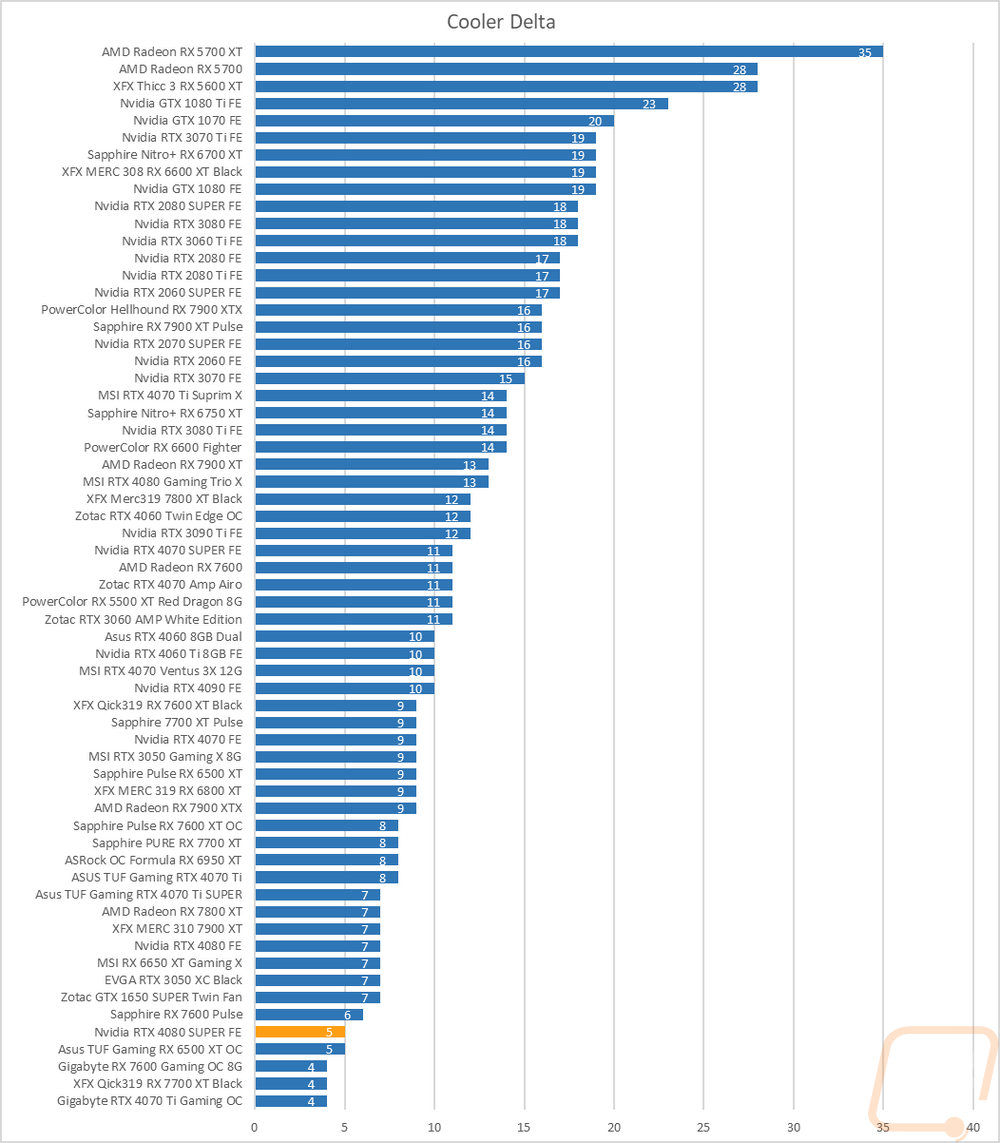
Then with the fans cranked up, the RTX 4080 SUPER Founders Edition moved up into the top 1/3 of the chart at 57c. This is a delta of just 5c and shows that while the cooler performs great there isn’t much headroom left beyond what Nvidia is already doing with it. The GPU hotspot dropped down 6c to 70c and the memory temps dropped 8c down to 50c.
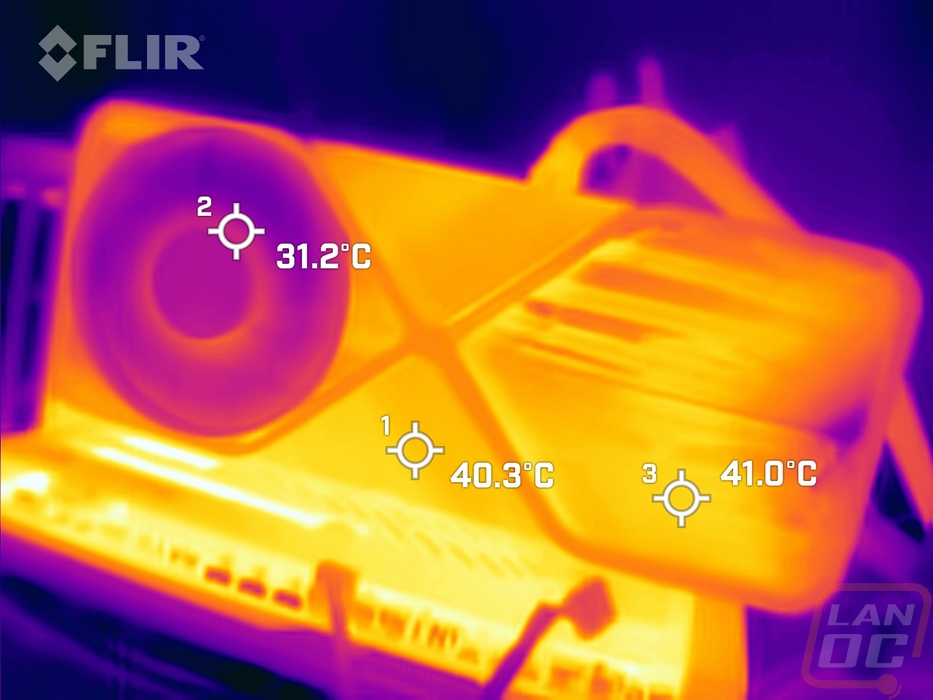
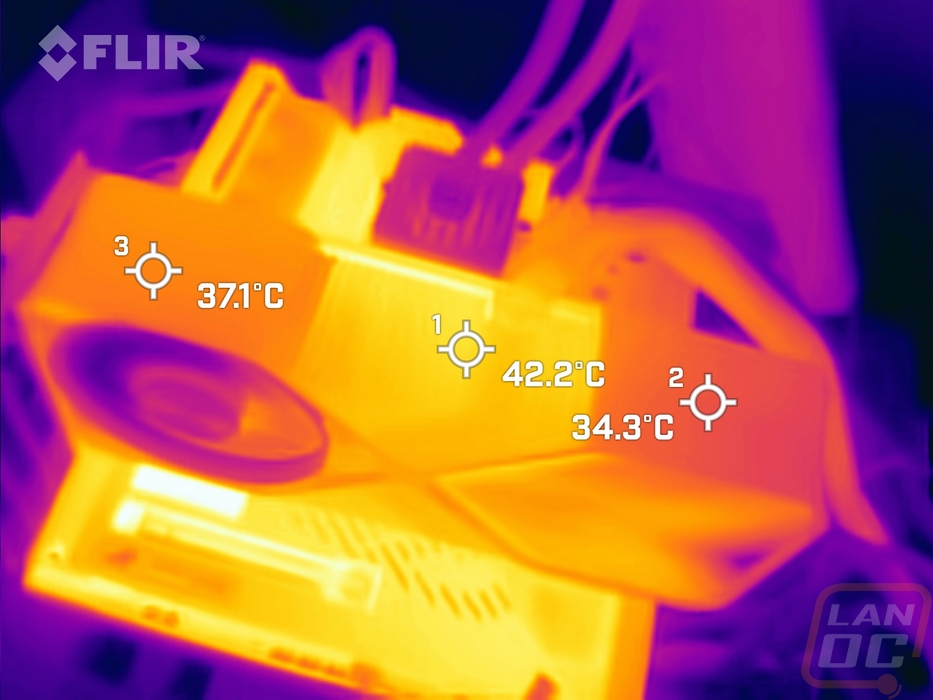
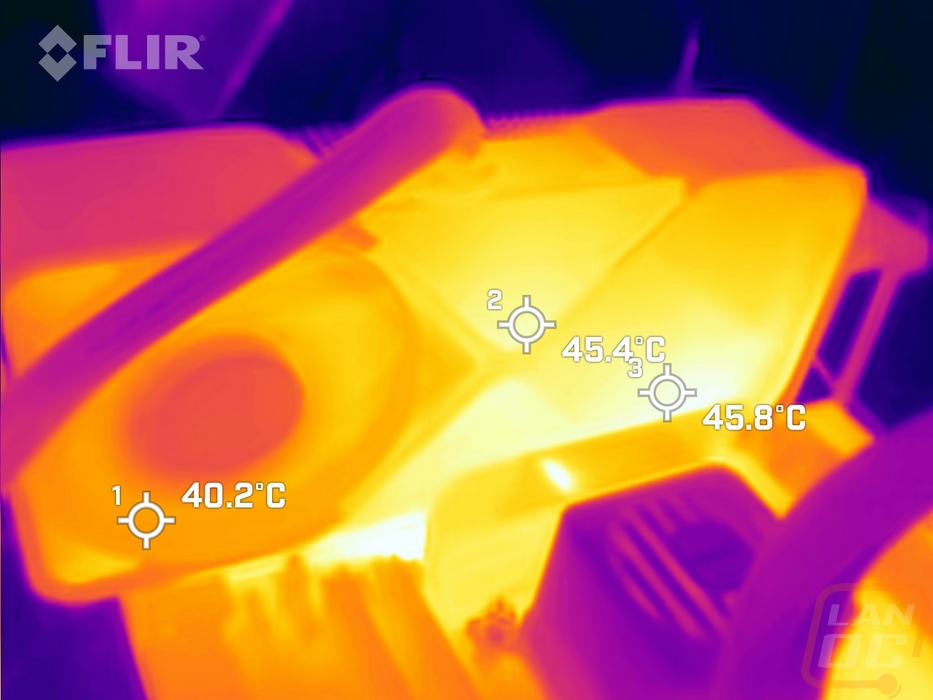
While running the stock fan profile testing I also took the time to get a few thermal images so we could see what is going on. The fan side view of the RTX 4080 SUPER Founders Edition in the thermals ranged from as low as 31c to 41c which isn’t too bad. That small range makes the card look hot on the right side but most of the card with it having the heatsink exposed is the same temperature. It is cooler behind the front side fan but that is about it. Even up on the top edge, it is similar with the top edge going from 34.3c to 42.2c and the hottest areas being in that center section with the exposed heatsink and where there is a gap between the heatsink and the PCB. Around on the back, there are a few warmer spots on the backplate which isn’t getting much airflow on our open-air testbench with the hottest being 45.8c down at the bottom edge behind the GPU. The fan doesn’t show as cool as on the front but that is because this is a pull fan, not a push so we are seeing the exhaust side of it.
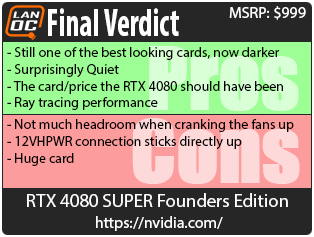
Overall and Final Verdict
I’ve got a big soft spot for the Founders Edition designs, specifically because their designs are unique and stylish and have an all-metal construction that is only matched and beat by some of the best cards on the market. It’s no different this time around as well, the RTX 4080 SUPER Founders Edition has the same design as the original RTX 4080 and the RTX 4090. The only change is the card is blacked out now like we saw with the RTX 4070 SUPER Founders Edition. The cooler design for this card is big, really big, and if you are a SFF fan like me it is going to be something you have to work around. This is exaggerated even more with the location of the 12VHPWR connection which is right up in the middle of the card on top not recessed down into the card like most aftermarket cards will do. Nvidia also didn’t put it in at an angle like with the 3000 Series. It means that the large card size has to also figure in the additional height of the power connection and the new 12VHPWR connection is less flexible in these situations. Even with that, I would still go with this card design in a lot of situations.
As far as the 4080 SUPER goes Nvidia did improve on the performance we saw with the RTX 4080 but this isn’t a huge step up in performance between the two cards, I saw an average of 3.8% improvement in our 4k gaming tests, and in some of the synthetic tests I saw less and other tests I saw up to 5%. This did help it catch up to the RX 7900 XTX at 1080p and 1440p but the XTX was still a few FPS higher at 4K. That is before we figure in DLSS 3 with frame generation and the overall ray tracing capabilities of the RTX 4080 SUPER Founders Edition which were both a big plus for the 4080 SUPER. For power efficiency, the RTX 4080 SUPER Founders Edition did drop down slightly compared to the original RTX 4080 but it was still in a different class compared to the competition from AMD. The RTX 4080 SUPER Founders Edition impressed in our noise testing, especially when under load and its cooling performance was better than I expected as well. The only downside there is that there isn’t much headroom in the cooler when it comes to cranking the fans up but as it sits I wouldn’t have any reason to want to do that anyhow.
In the end, like always, it comes down to pricing. Nvidia has the RTX 4080 SUPER priced with an MSRP of $999 and the RTX 4080 SUPER Founders Edition because it comes from them directly will be at that price point. The RTX 4080 that this replaces launched at $1199. While the RTX 4080 SUPER Founders Edition isn’t a drastic step forward in performance it does offer a step up while coming down $200. Most people, myself included, weren’t a fan of the pricing of the RTX 4080 last year but I can say without a doubt that the RTX 4080 SUPER and the RTX 4080 SUPER Founders Edition with it is what the original RTX 4080 should have been. A capable performer and while not cheap you are getting high-level performance at a price that fits that is competitive. The RX 7900 XTX is right in that same price range right now and while the raster performance of the 7900 XTX was a touch higher than the 4080 SUPER at 4K Nvidia’s tech like DLSS 3 and its ray tracing capabilities help add a lot of value and push me into the 4080 SUPER camp.

Live Pricing: HERE


