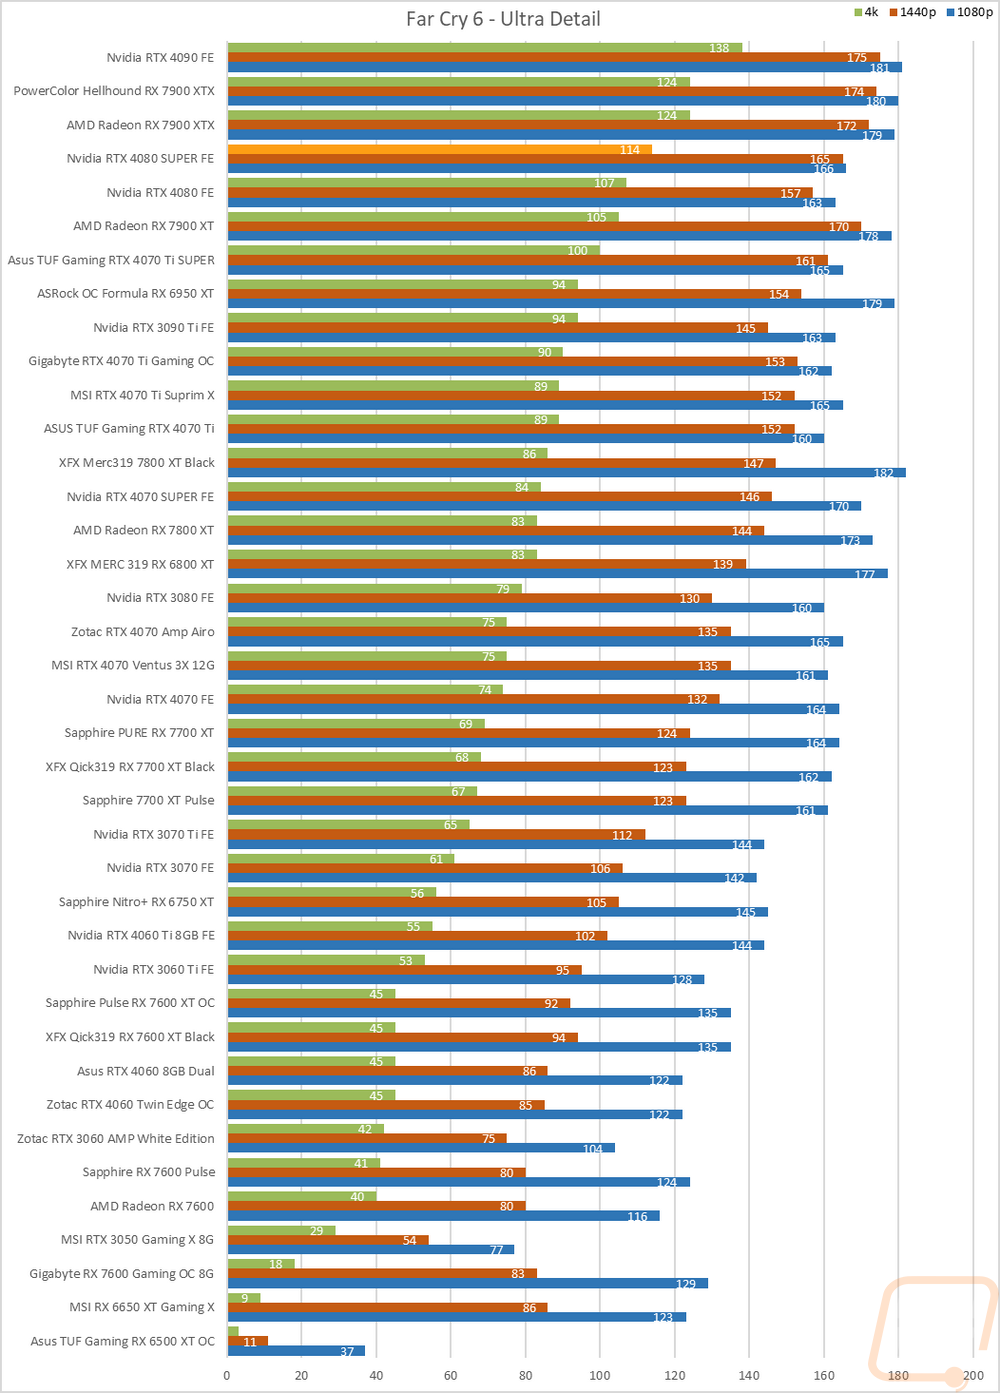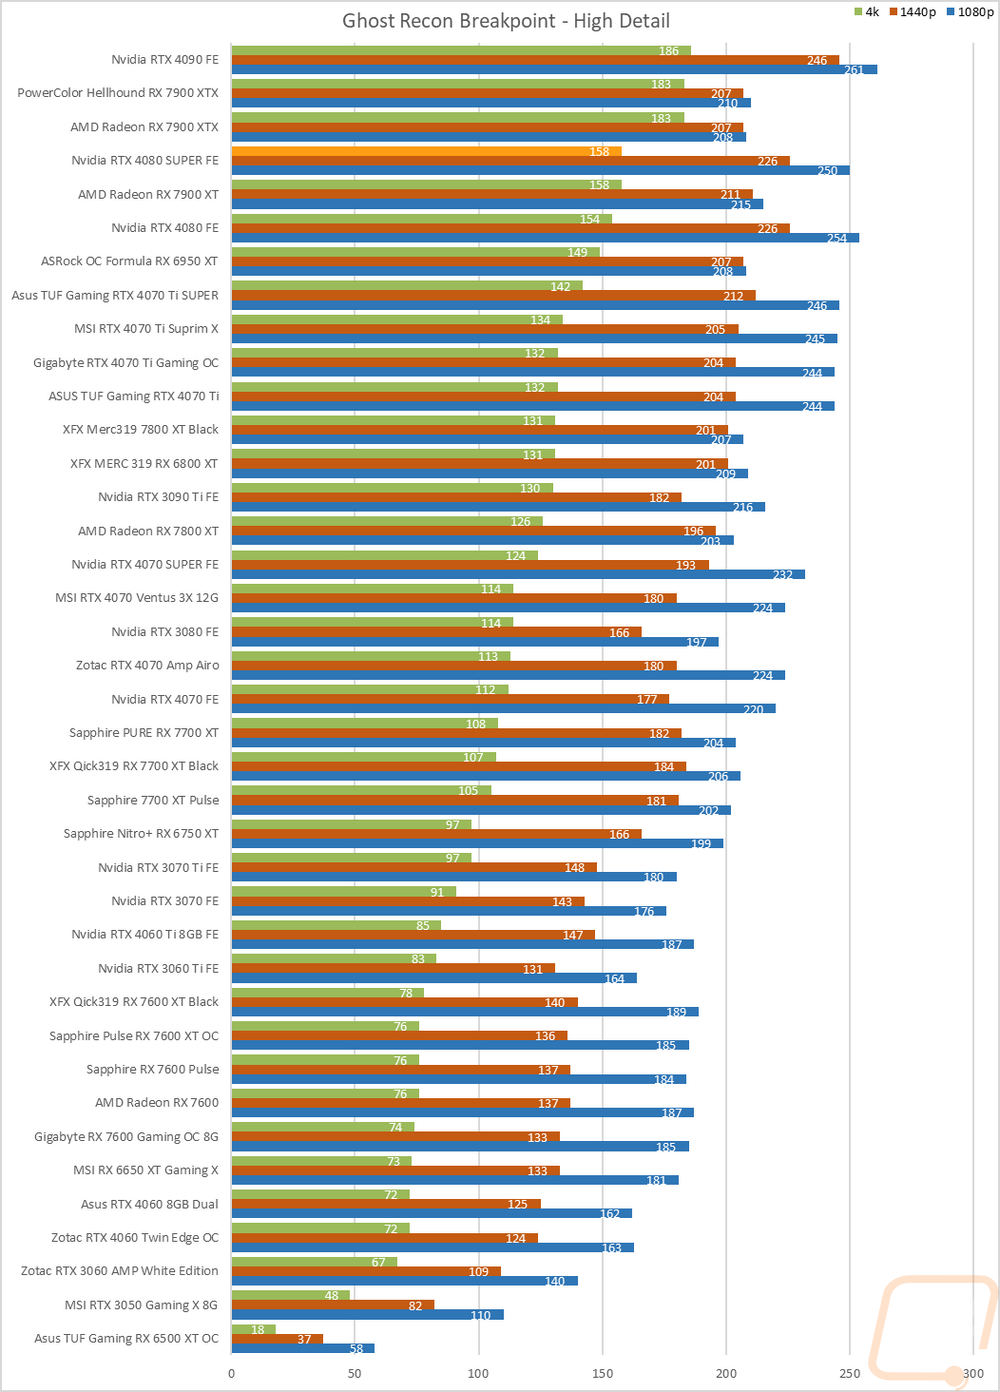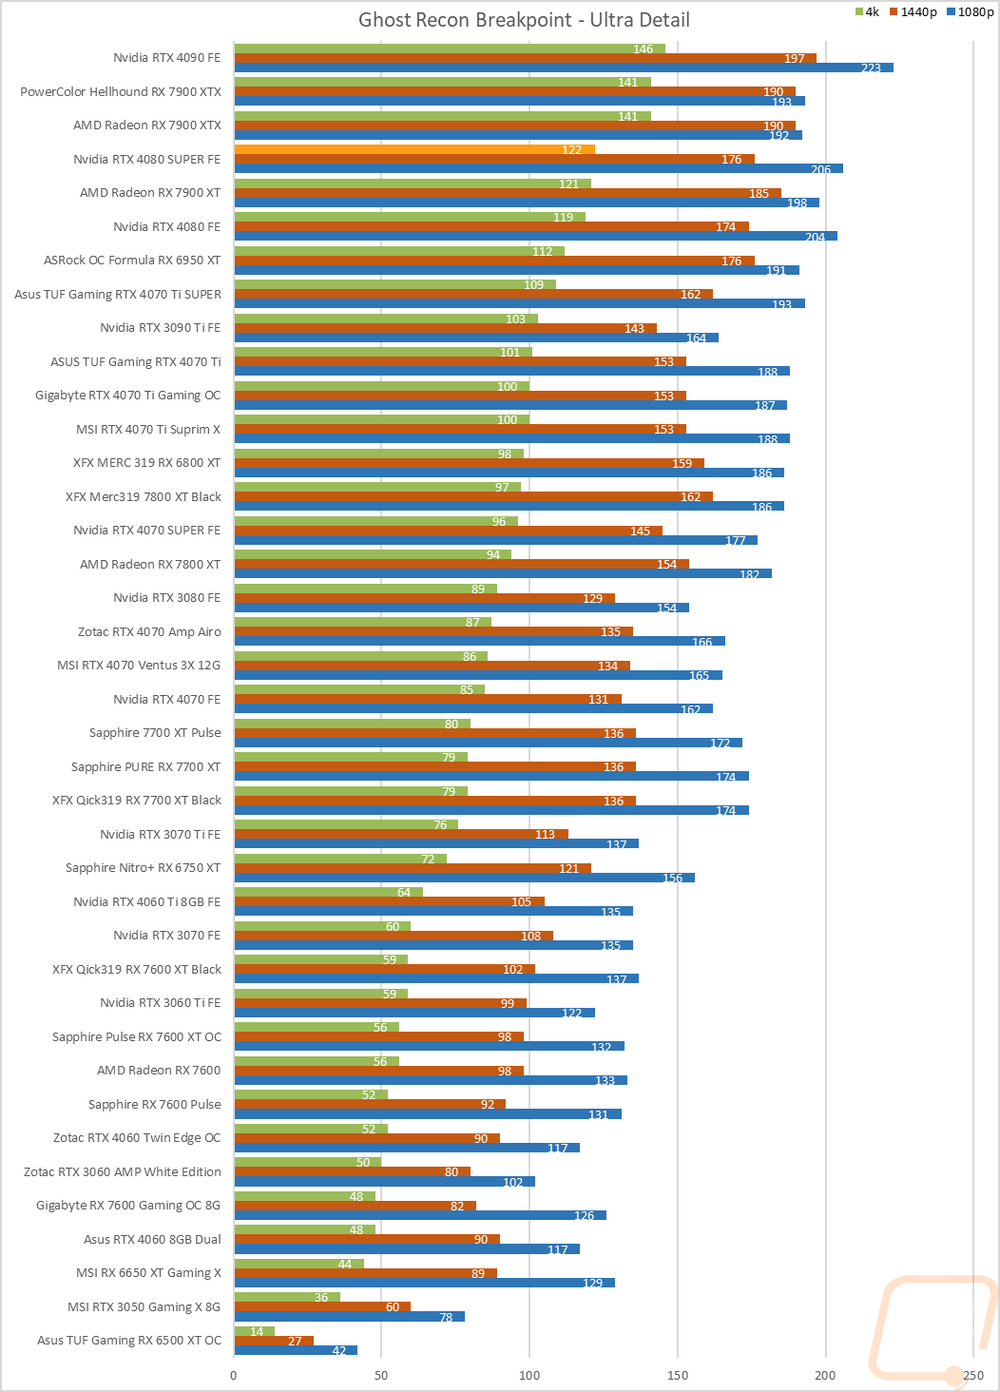
In-Game Benchmarks
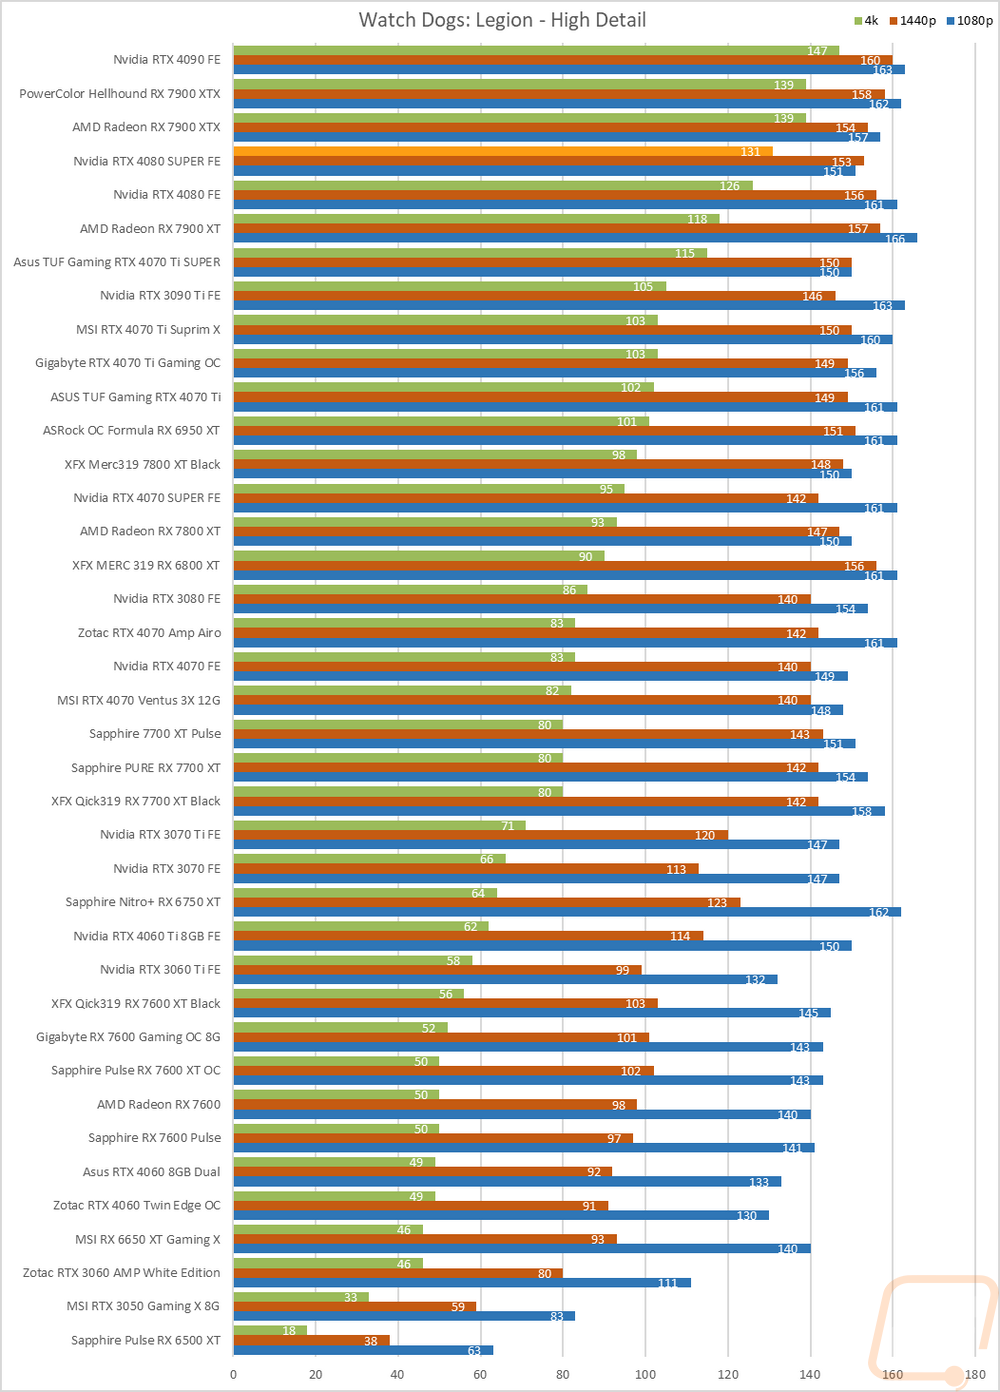
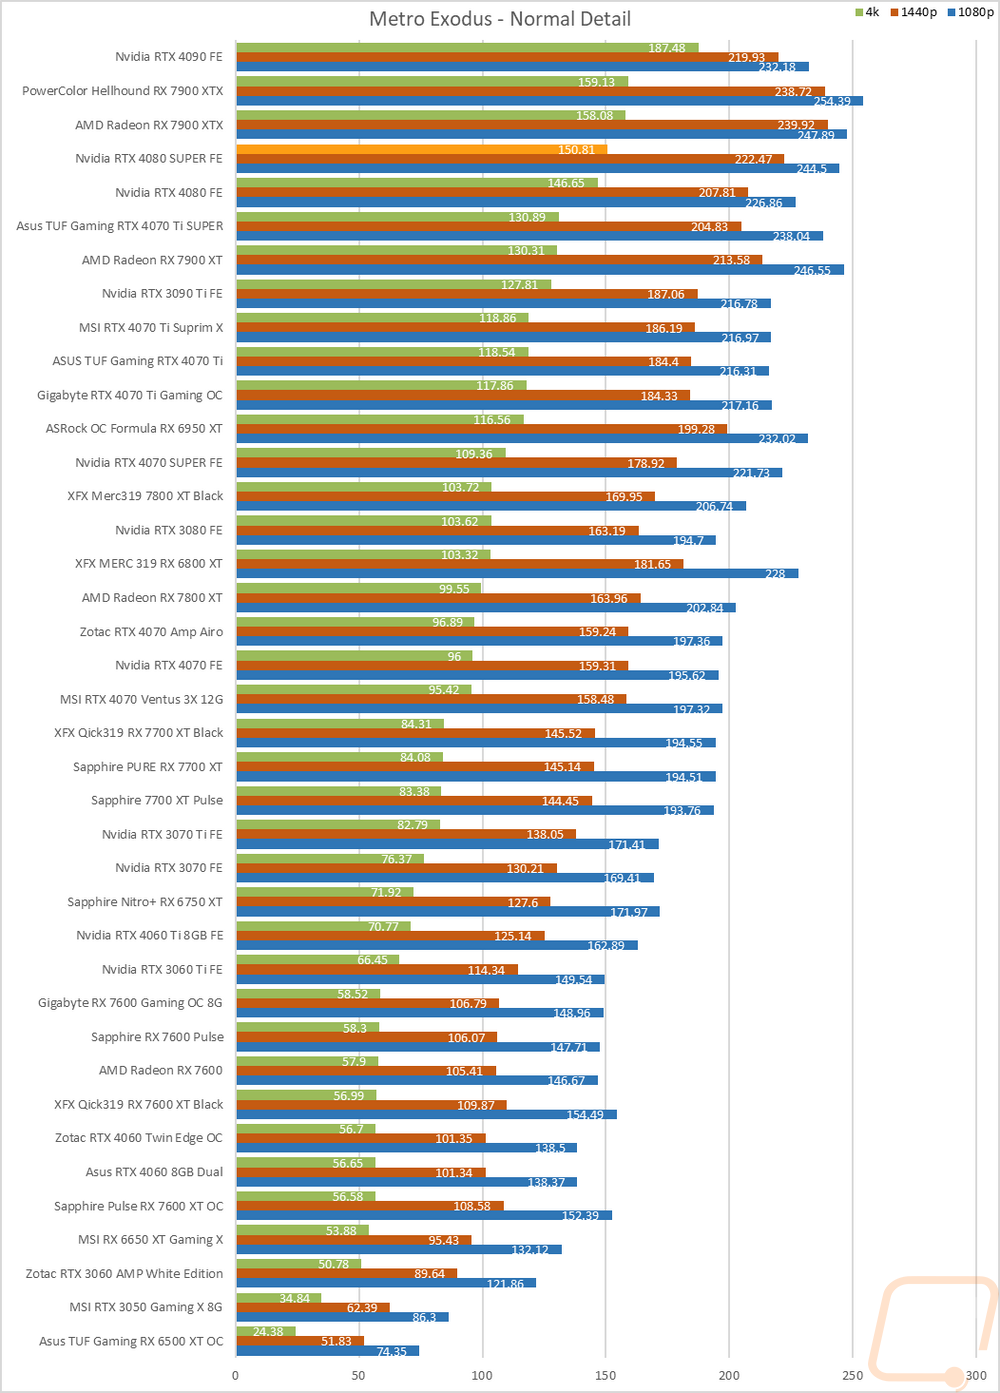
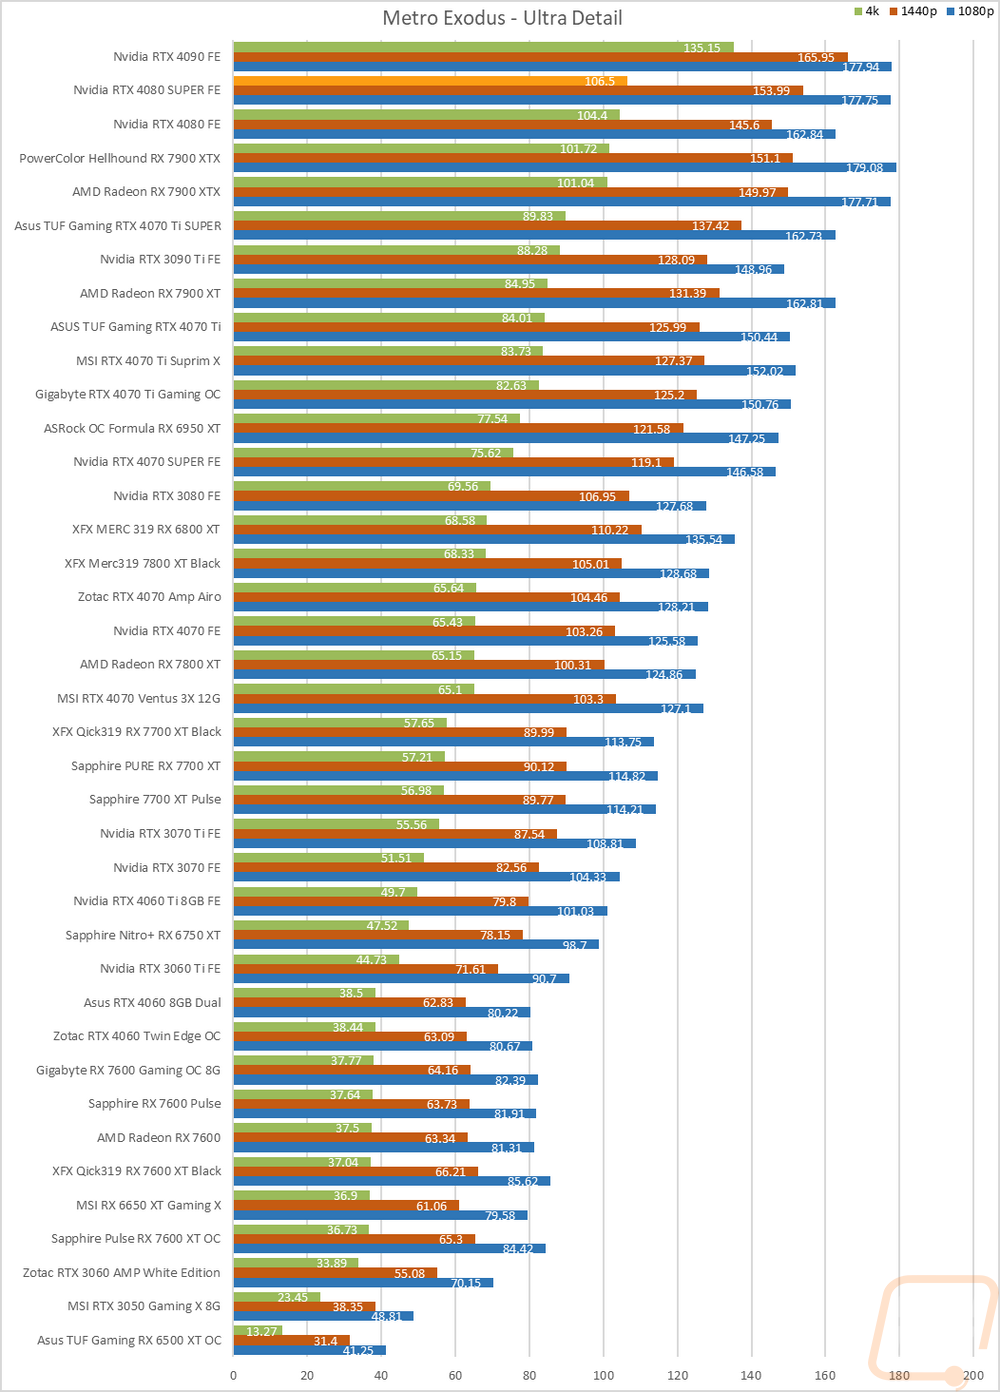
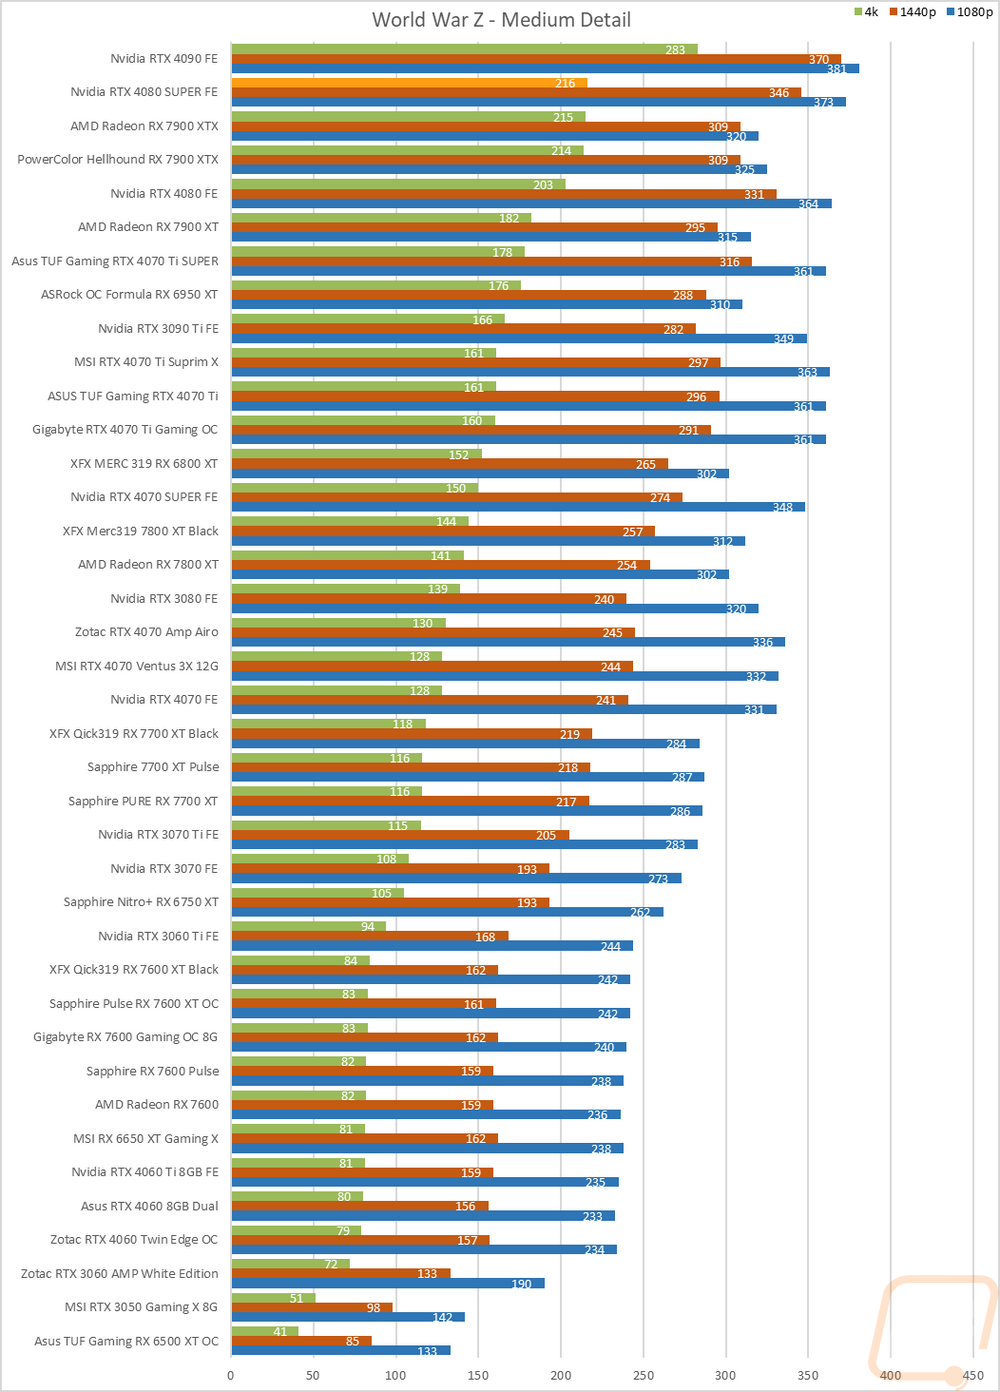
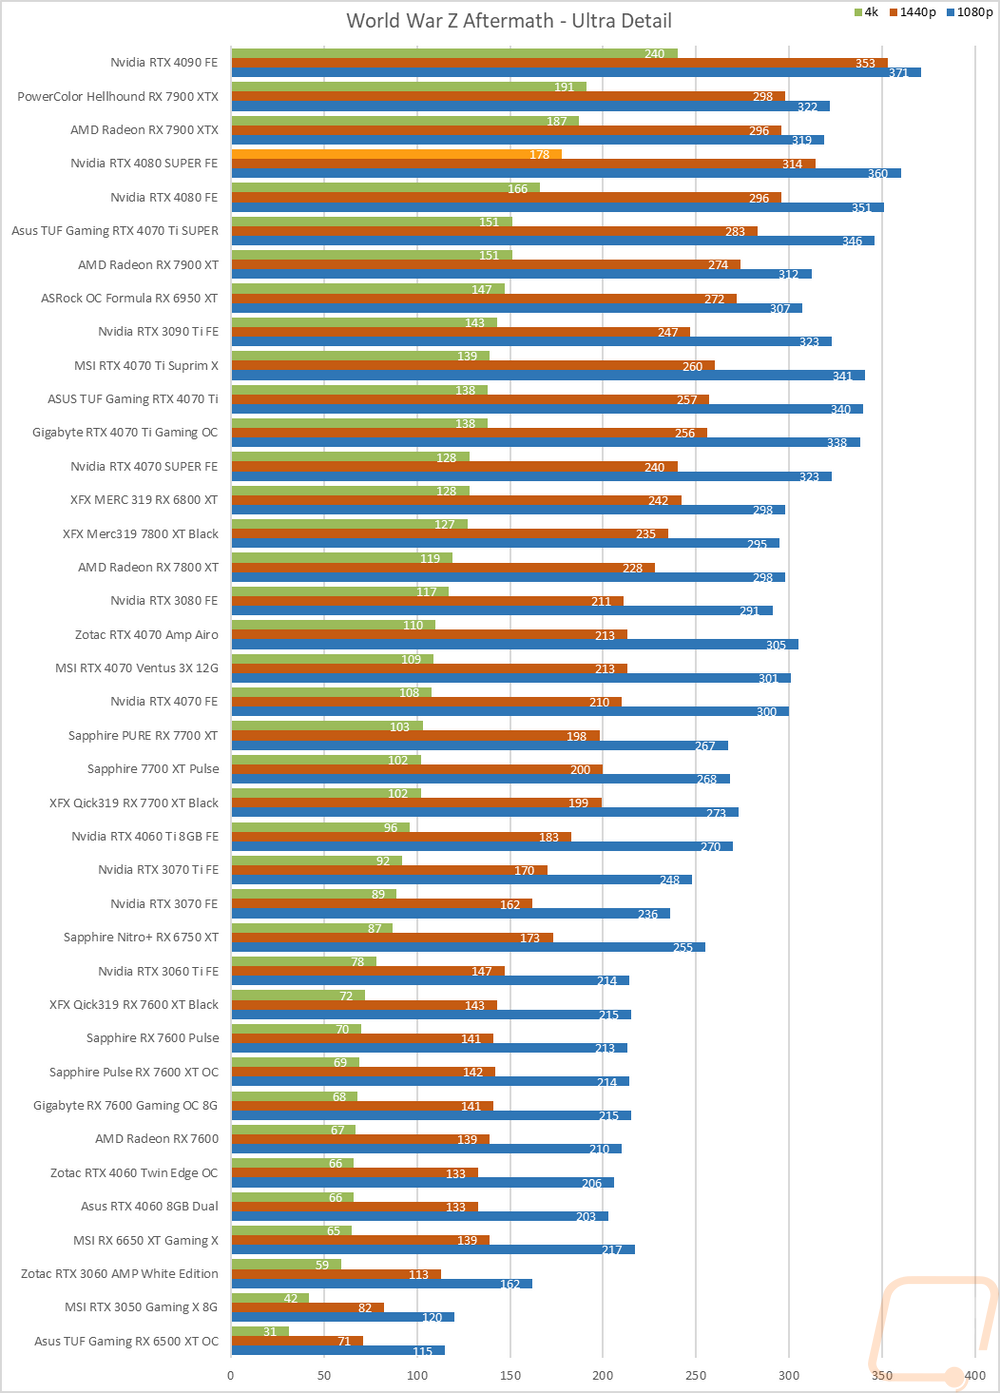
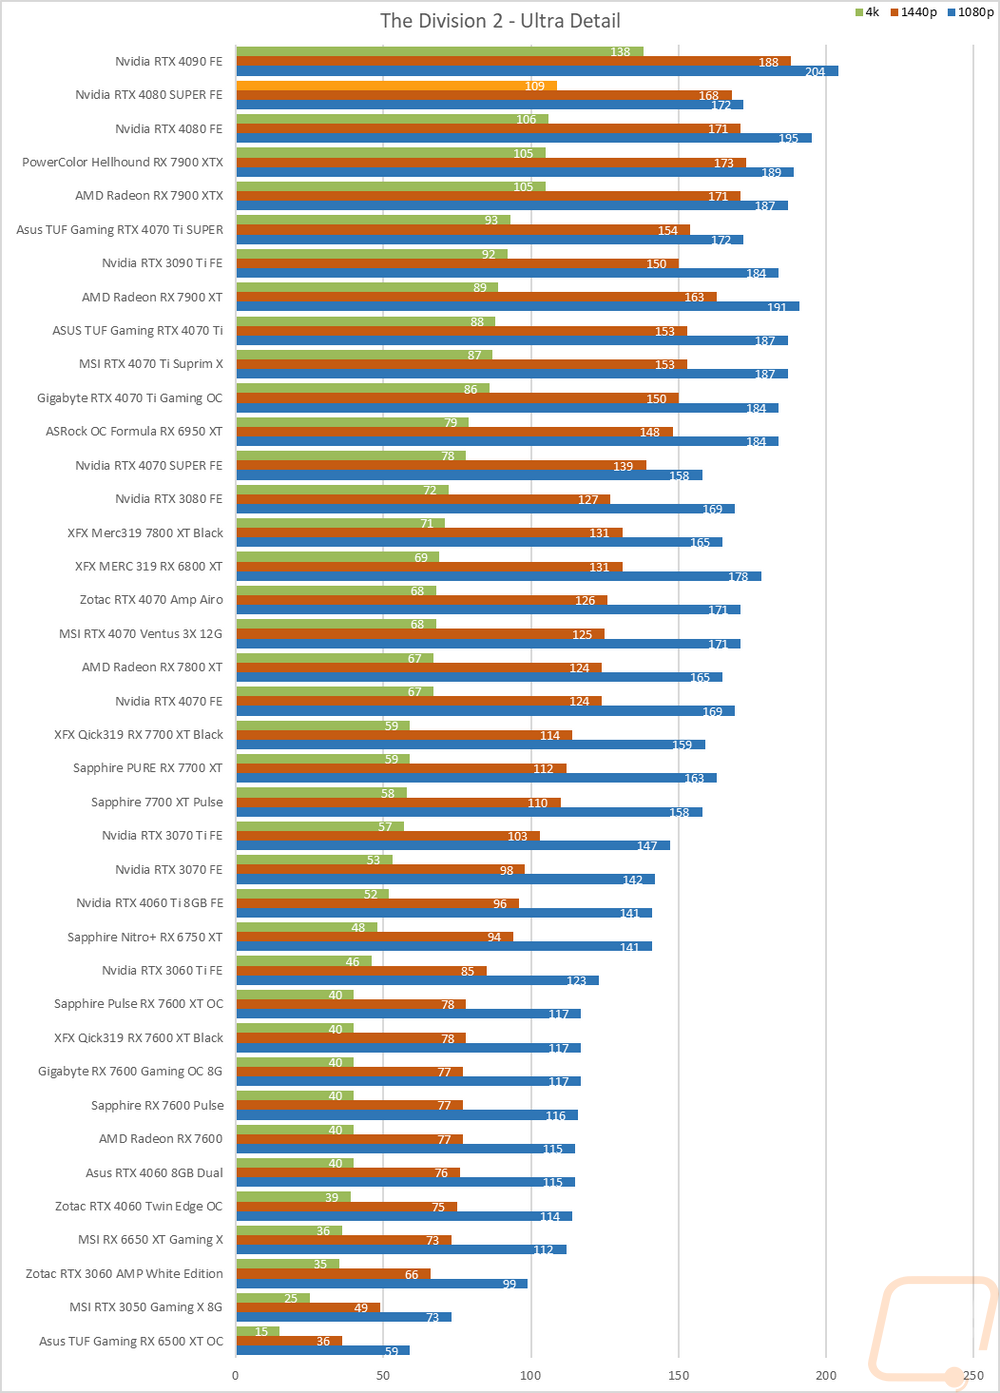
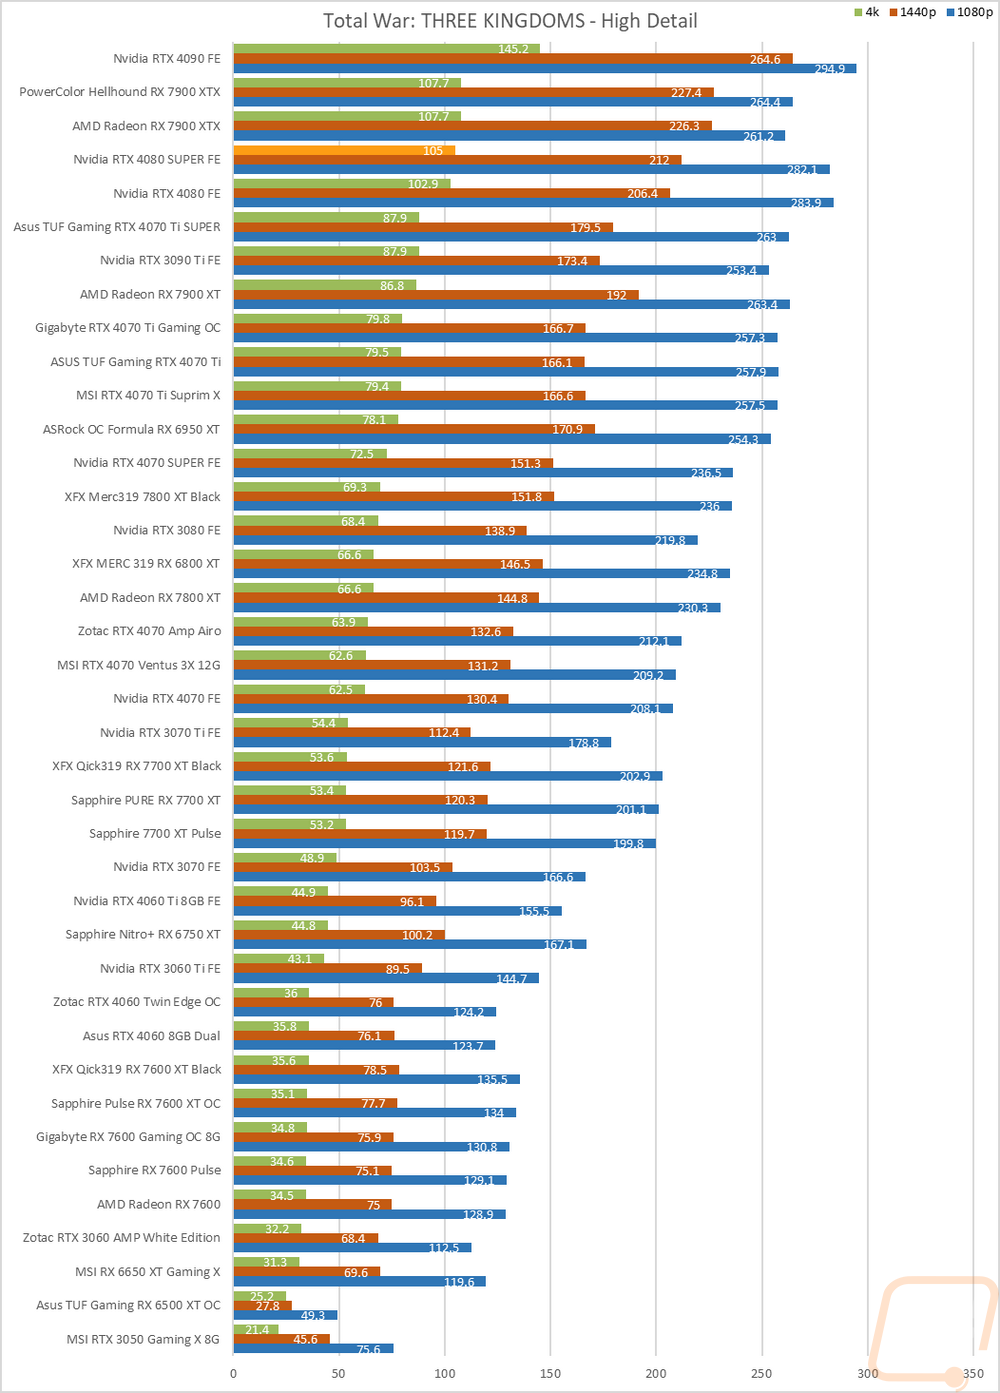
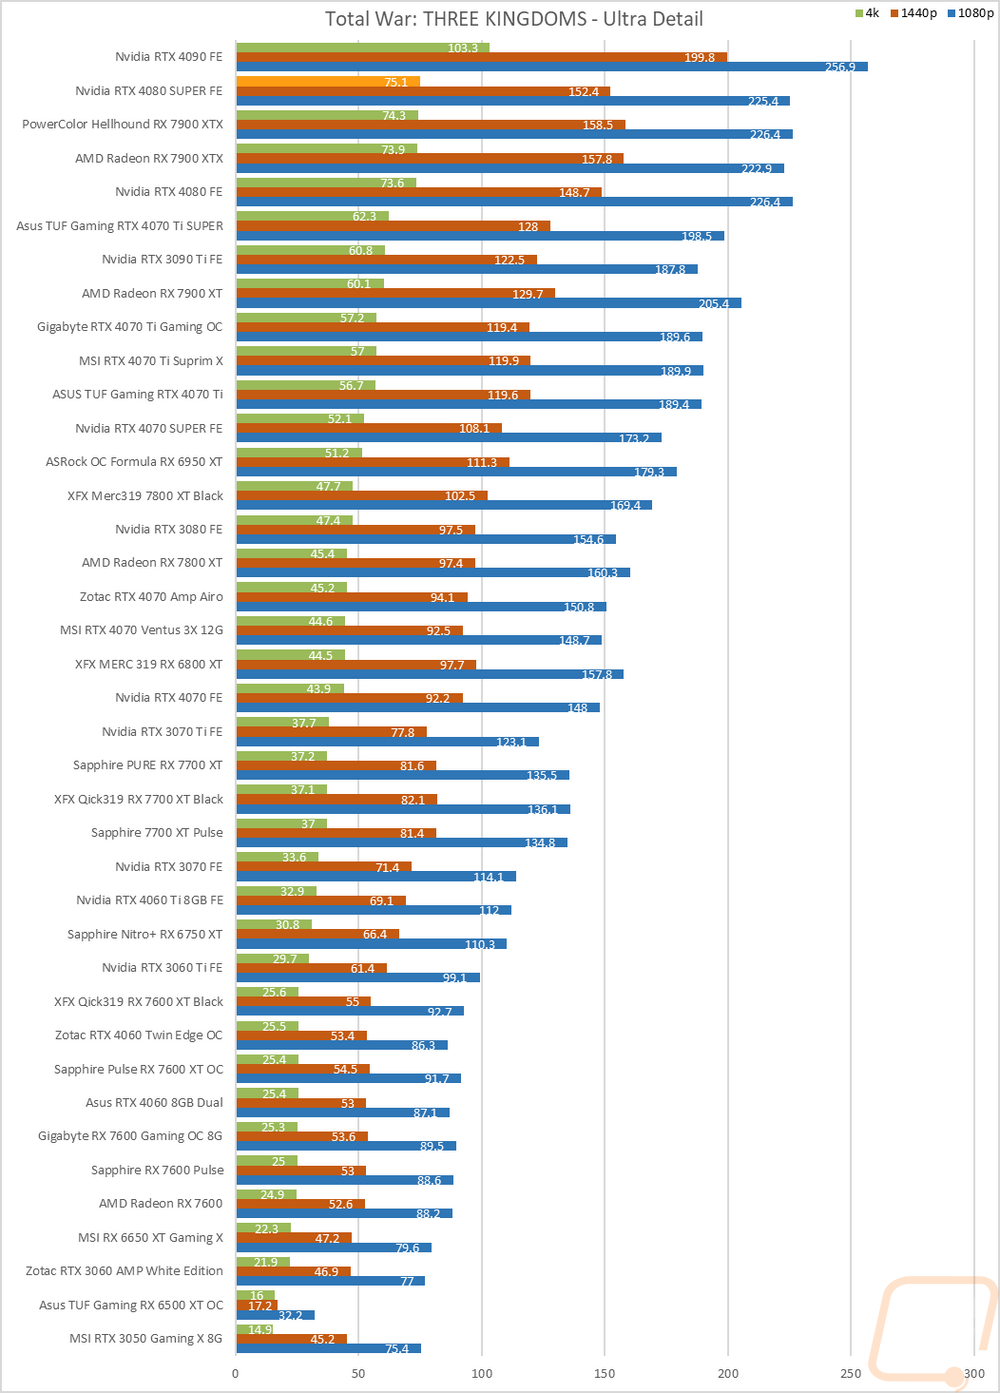
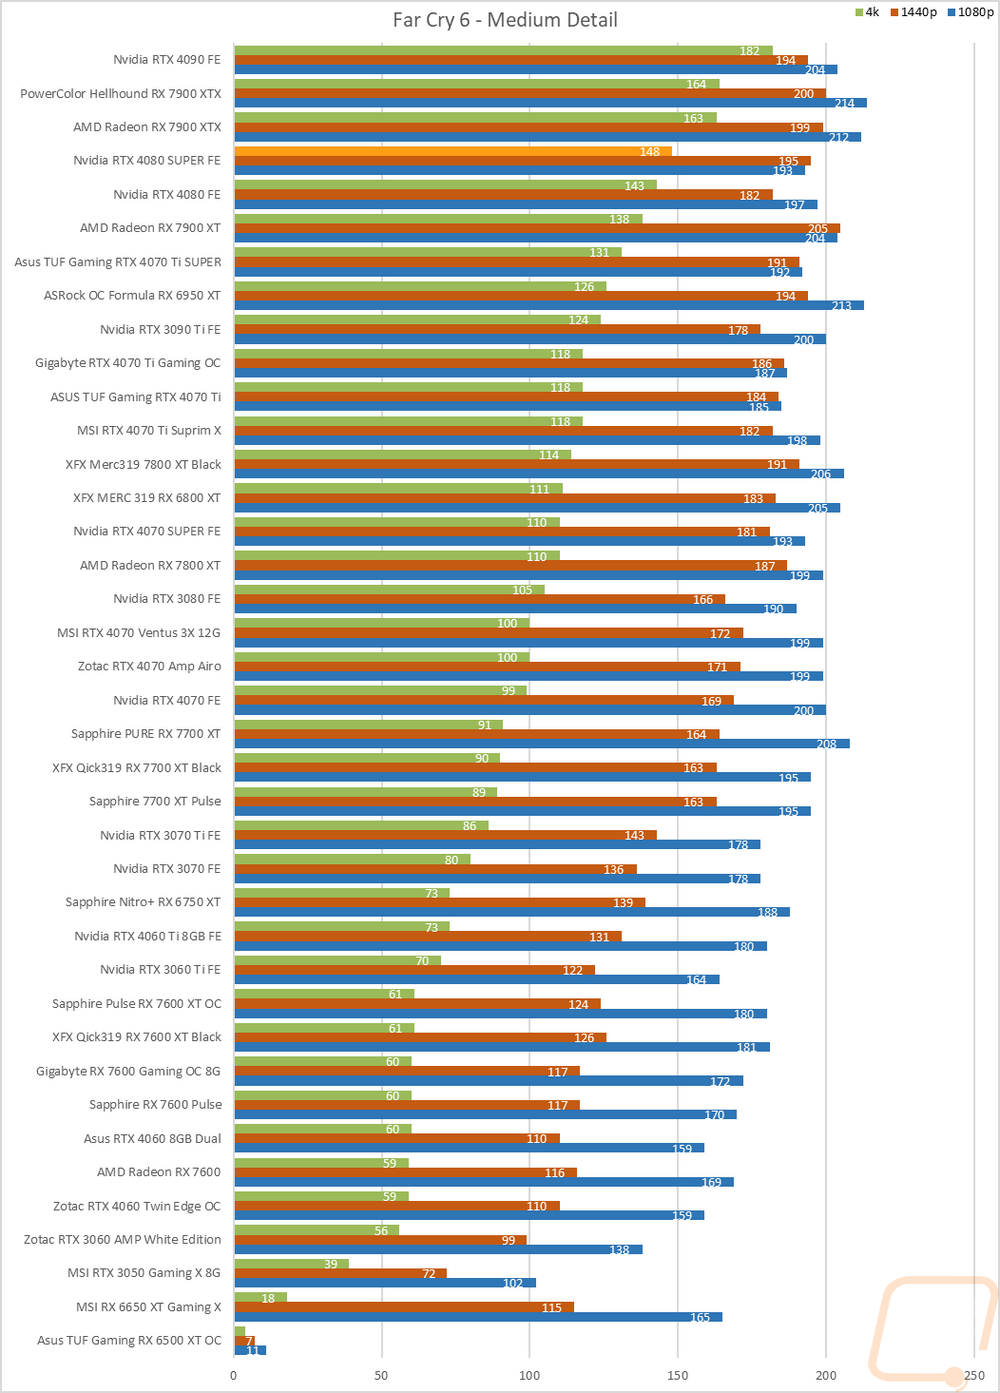
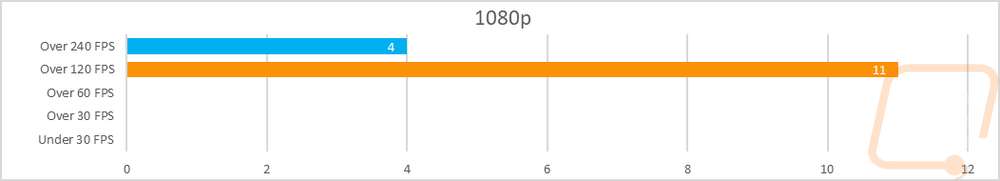
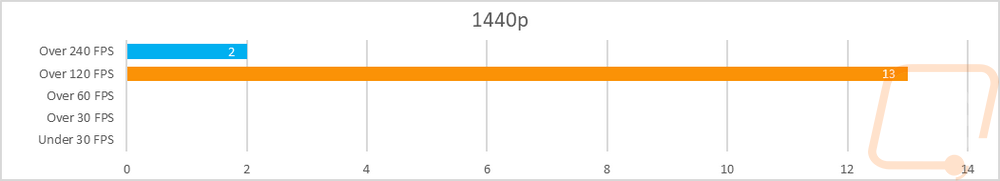
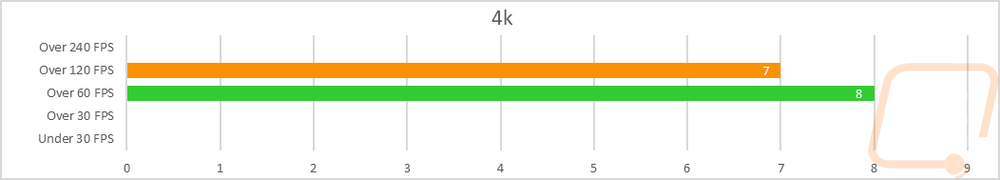
Now we finally get into the in game performance and that is the main reason people pick up a new video card. To test things out I ran through our new benchmark suite that tests 8 games at three different resolutions (1080p, 1440p, and 4k). Most of the games tested have been run at the highest detail setting and a mid-range detail setting to get a look at how turning things up hurts performance and to give an idea of if turning detail down from max will be beneficial for frame rates. In total, each video card is tested 45 times and that makes for a huge mess of results when you put them all together. To help with that I like to start with these overall playability graphs that take all of the results and give an easier-to-read result. I have one for each of the three resolutions and each is broken up into four FPS ranges. Under 30 FPS is considered unplayable, over 30 is playable but not ideal, over 60 is the sweet spot, and then over 120 FPS is for high refresh rate monitors.
So how did the RTX 4080 SUPER Founders Edition do? Well, this is a card designed for gaming at 4K and we know that a lot of our 1080p tests and some of the 1440p tests reach the limitations of the CPU. But even still at 1080p the RTX 4080 SUPER Founders Edition has all of its results up over 120 FPS with 4 over 240 FPS. 1440p is the same with all of the results over 120 FPS, this time though there were just two up over 240 FPS. Then we get to the 4K where we can finally see the card doing some work but even here none of the games tested averaged under 60 FPS with 8 results between 60-119 FPS and the other 7 were up over 120 FPS.
Of course, I have all of the actual in game results as well for anyone who wants to sort through the wall of graphs below. But to help get a feel for how the RTX 4080 SUPER Founders Edition compares to other cards I have put together averages from all of our tests across all three resolutions comparing the RTX 4080 SUPER Founders Edition to the RTX 4080, RTX 4090, new RTX 4070 Ti SUPER, and the 7900 XT and 7900 XTX from AMD. Like I said before the 1080p results don’t really show just how powerful most of these cards are and the same goes for 1440p as well with a lot of those results being limited by the CPU. It is only the 4K results that let us get a look at things. The RTX 4080 SUPER Founders Edition averaged 3.8% higher FPS than the original RTX 4080 which isn’t a big jump but is a consistent improvement fueled by the higher CUDA core count, even with the clock speeds being lower. The 7900 XTX is still out in front of the RTX 4080 SUPER Founders Edition however sitting 4 FPS higher on the 4k results and the 4090 result is just there to continue to remind people that all of this is just a competition to see what card can come in second place sitting 34 FPS higher than the RTX 4080 SUPER Founders Edition. Interestingly at 1080p and 1440p, the RTX 4080 SUPER Founders Edition did come in higher than the 7900 XTX.
|
Average FPS Across Tested Games |
1080p |
1440p |
4K |
|
ASUS TUF Gaming RTX 4070 Ti SUPER |
213.4 |
183.8 |
114.1 |
|
AMD Radeon RX 7900 XT |
211.1 |
186.6 |
114.8 |
|
Nvidia RTX 4080 FE |
220.7 |
193.5 |
127.5 |
|
Nvidia RTX 4080 SUPER FE |
221.2 |
198.9 |
132.4 |
|
AMD Radeon RX 7900 XTX |
212.9 |
196.7 |
136.7 |
|
Nvidia RTX 4090 FE |
232.7 |
217.3 |
166.0 |