Synthetic Benchmarks
As always I like to start my testing with a few synthetic benchmarks. 3DMark especially is one of my favorites because it is very optimized in both Nvidia and AMD drivers. It's nice to not have to worry about it being favored too much either way and the repeatability of the results makes it a nice chance to compare from card to card, especially when comparing with the same GPU. For the RTX 4080 SUPER Founders Edition, this is our first look at the new RTX 4080 SUPER but it doesn’t mean we don’t have a few cards that I want to keep an eye on how the card compares. The most obvious is the RTX 4080 which it replaced and of course, the RTX 4090 which is still Nvidia’s flagship. From AMD I’m looking at the RX 7900 XTX which is the only card that is going to be in the performance range of this one.
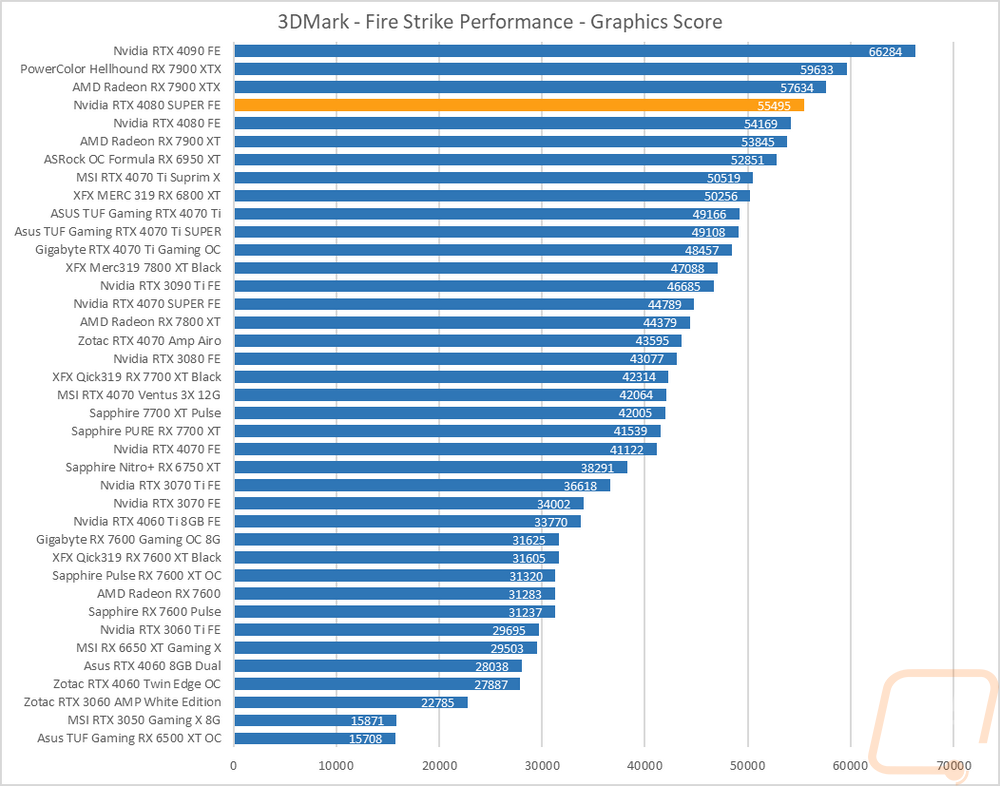
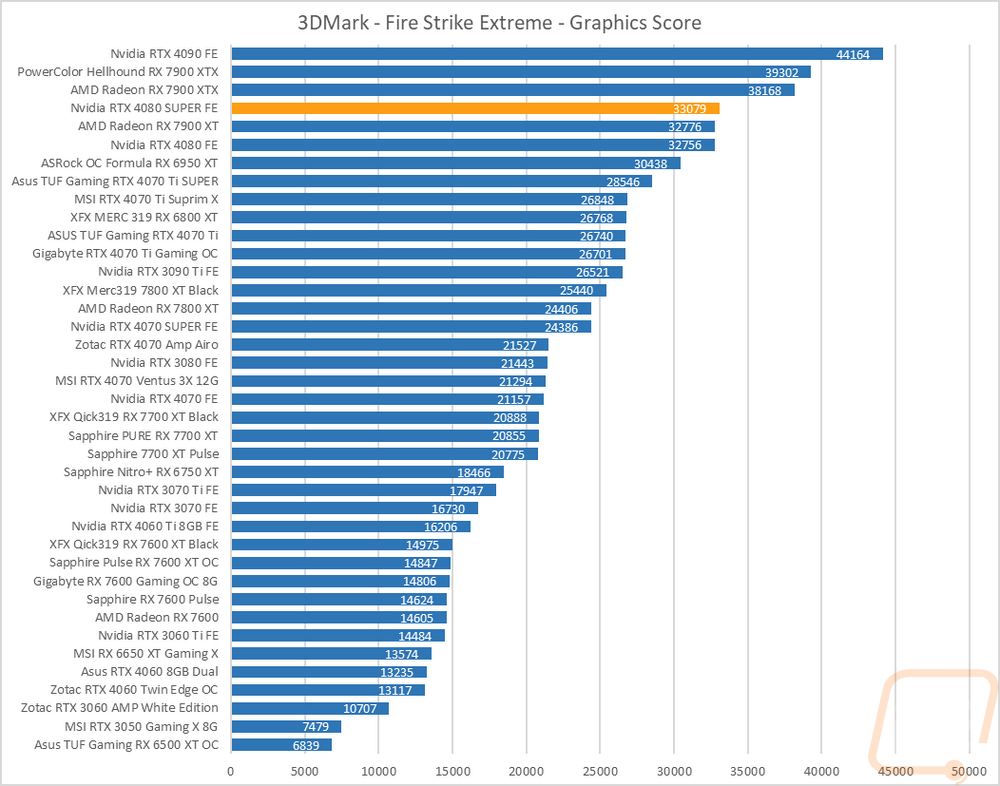
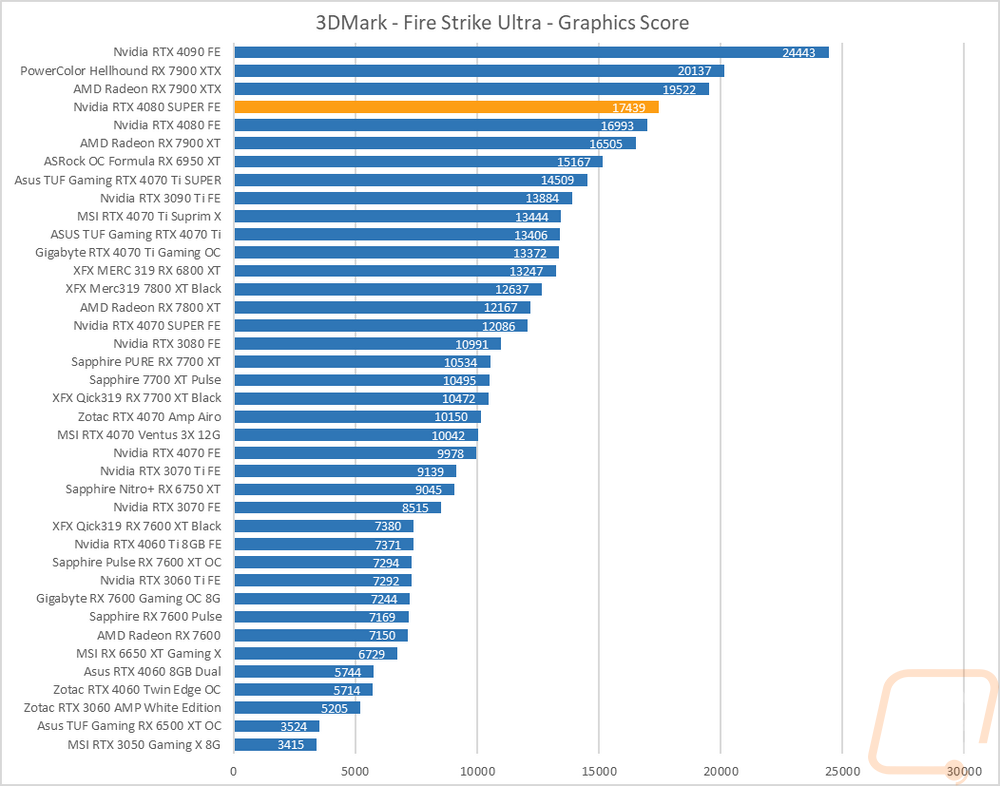
The first round of tests were done in the older Fire Strike benchmark which is a DX11 test. There are three detail levels, performance, extreme, and ultra. The RTX 4080 SUPER Founders Edition in base Fire Strike has improved on the RTX 4080 by 4.4% which isn’t a huge jump and isn’t enough to pass the 7900 XTX. In Fire Strike Extreme that gap is smaller with just 1% between the two cards and because AMD does better on Fire Strike the 7900 XT gets close to catching up. The RTX 4080 SUPER Founders Edition then pulls away again and is 2.6% ahead of the RTX 4080 in Fire Strike Ultra, still not catching up to the 7900 XTX but putting some space between it and the 4080 and 7900 XT.
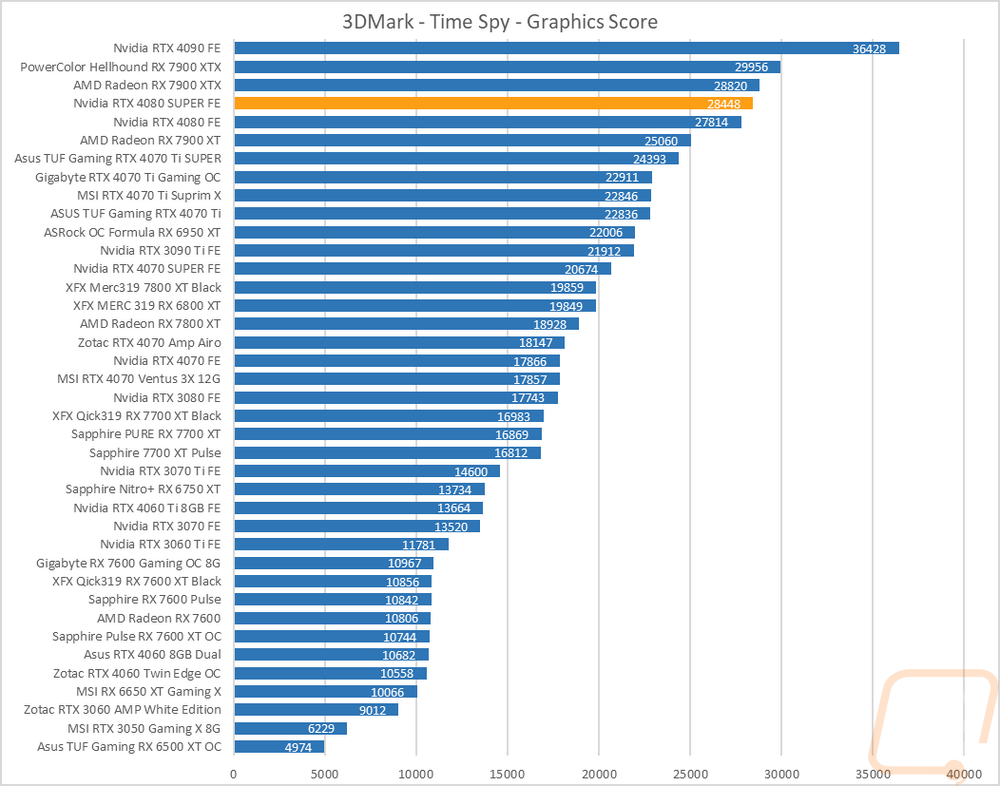
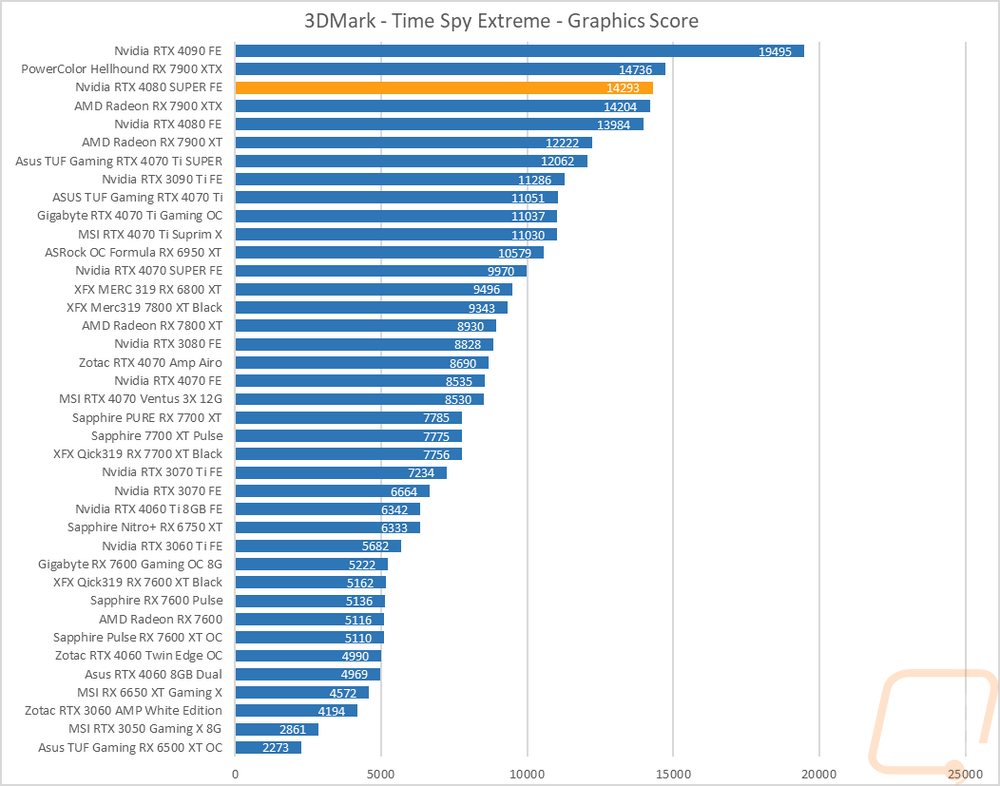
The next two were both based on the Time Spy benchmark. One is the standard test and then there is the extreme detail level. These are both DX12 and with that, the Nvidia cards historically have done a little better. You can see that the RTX 4080 SUPER Founders Edition isn’t too far off from the 7900 XTX in base Time Spy and it has a 2.3% improvement over the RTX 4080. In Time Spy Extreme the gap is similar at 2.2% but it was enough to pass the stock-clocked RX 7900 XTX but not enough to catch up to that Hellhound.
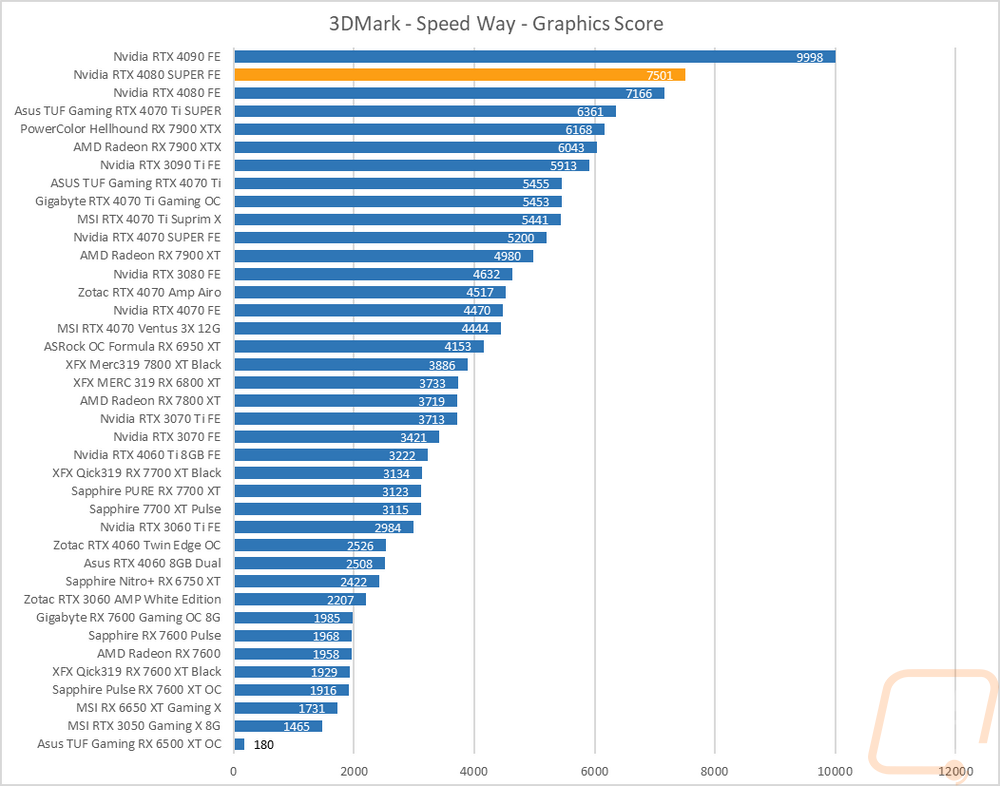
I did also test using the new 3DMark Speed Way which is their latest benchmark. Speed Way is DX12 as well but combines in more future-focused tech like Ray Tracing which up until now 3DMark has only used in feature tests. For this test the AMD cards all drop down significantly, the 4000 Series cards from Nvidia are in their own class when it comes to ray tracing performance it is seen here with the 7070 Ti SUPER even passing the 7900 XTX. The RTX 4080 SUPER Founders Edition gains 4.6% on the RTX 4080 here but that isn’t enough to even get close to the RTX 4090 which is still way out in front.
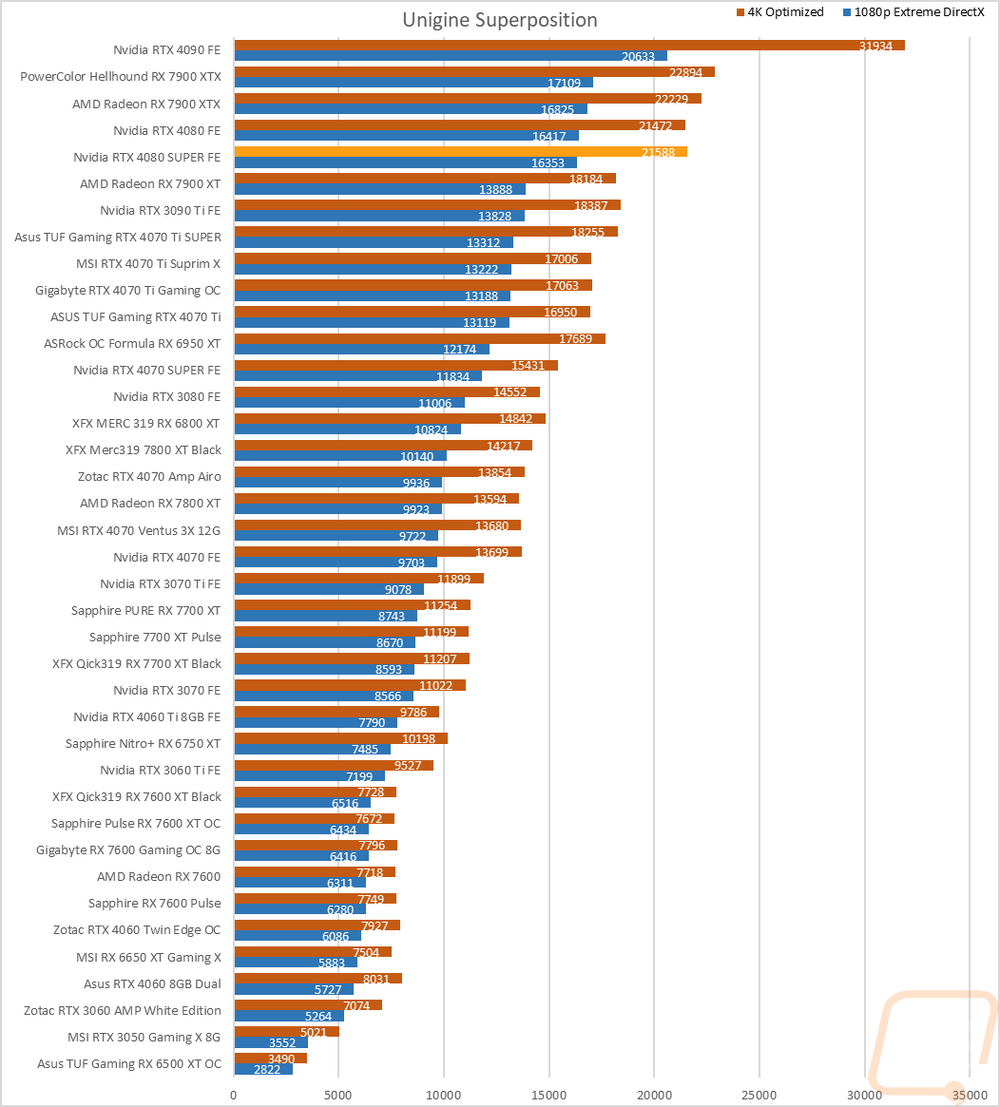
The last test was using the Unigine-based Superposition benchmark and I tested at 1080p with the extreme detail setting as well as the 4K optimized setting. In the extreme detail setting the RTX 4080 SUPER Founders Edition didn’t surpass the RTX 4080 surprisingly. It did on the 4K optimized test which tells us that on the 1080p test, the issue is the CPU being a limitation and some variation on CPU performance. Even at 4k though the RTX 4080 SUPER Founders Edition is just 5% ahead of the RTX 4080 and the RX 7900 XTX is ahead of both.