Cooling Noise and Power
For my last few tests, rather than focusing on in game performance, I like to check out other aspects of video card performance. These are also the most important ways to differentiate the performance between cards that have the same GPU. To start things off I took a look at power usage.
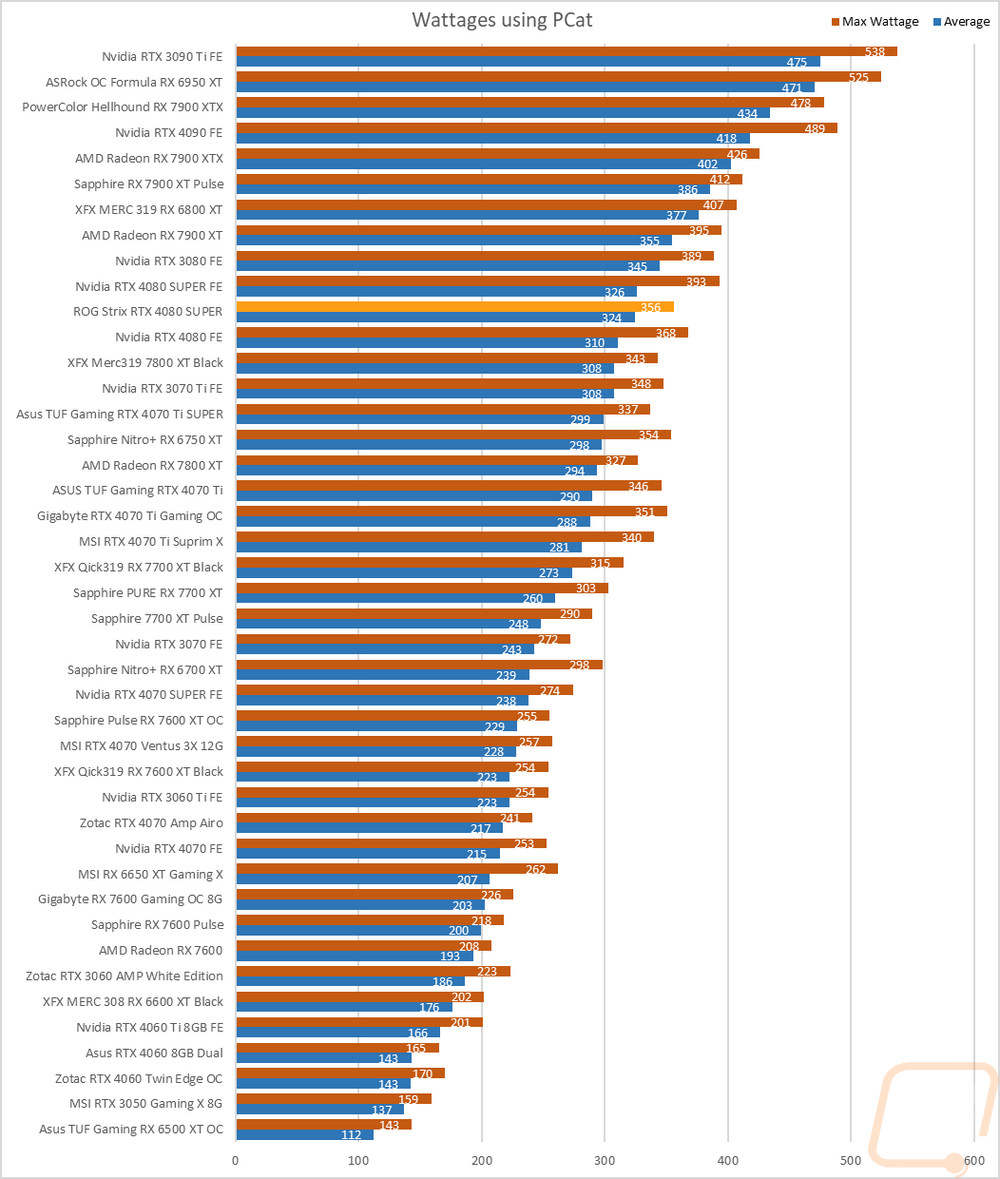
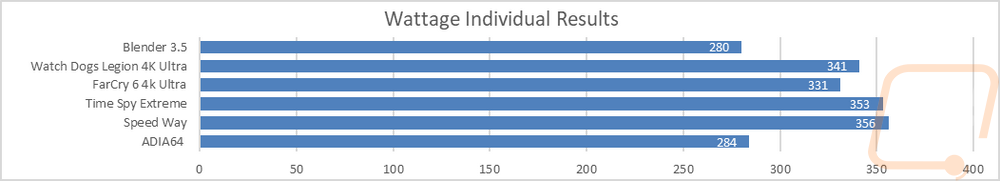
For this, our new test setup utilizes the Nvidia-designed PCat v2 along with cables to handle both traditional 6 or 8-pin connections as well as the new 12VHPWR. The PCat also utilizes a PCIe adapter to measure any power going to the card through the PCIe slot so we can measure the video card wattage exclusively, not the entire system as we have done in the past. I test with a mix of applications to get both in game, synthetic benchmarks, and other workloads like Blender and AIDA64. Then everything is averaged together for our result. I also have the individual results for this specific card and I document the peak wattage result as well which is almost always Time Spy Extreme. The ROG Strix RTX 4080 SUPER surprised me here with its average sitting two watts below the Founders Edition at 324 watts. The peak power draw was also significantly lower at 356 watts, a crazy 37 watts lower than the Founders Edition 4080 SUPER.
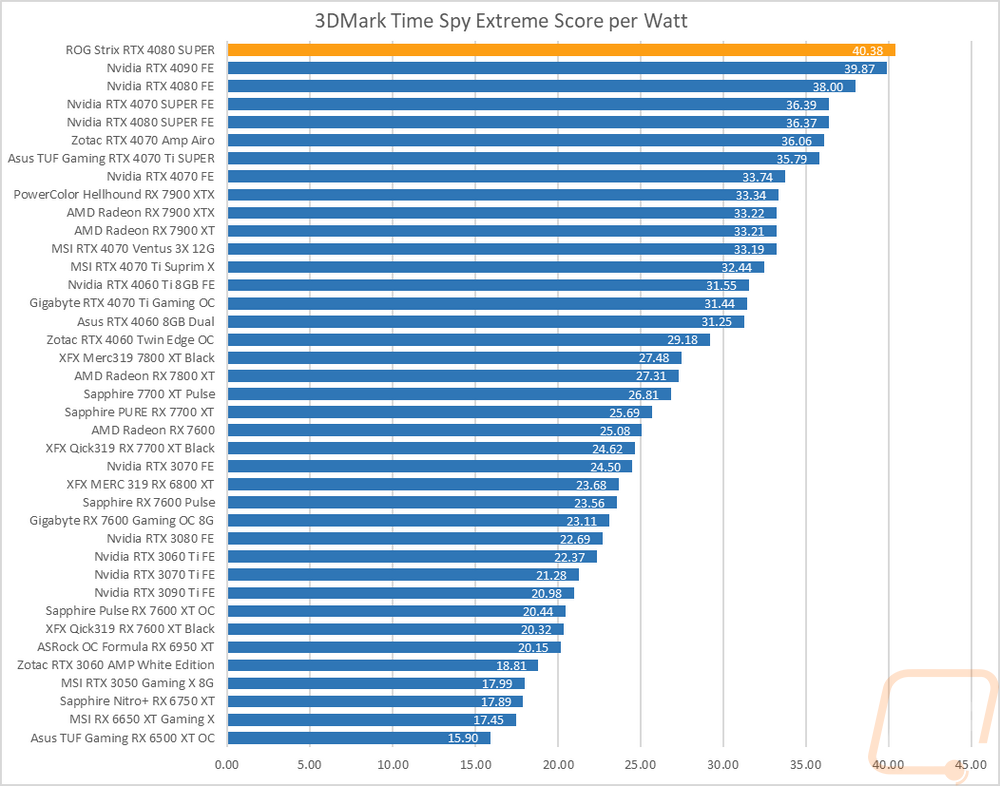
With having exact peak wattage numbers when running Time Spy Extreme I was also able to put together a graph showing the total score for each watt that a card draws which gives us an interesting look at overall power efficiency in the popular and demanding benchmark. With the power draw numbers being lower the ROG Strix RTX 4080 SUPER jumped up to the top of the chart in our efficiency charts an impressive 4 points per watt higher than the RTX 4080 SUPER Founders Edition and even up over the RTX 4090.
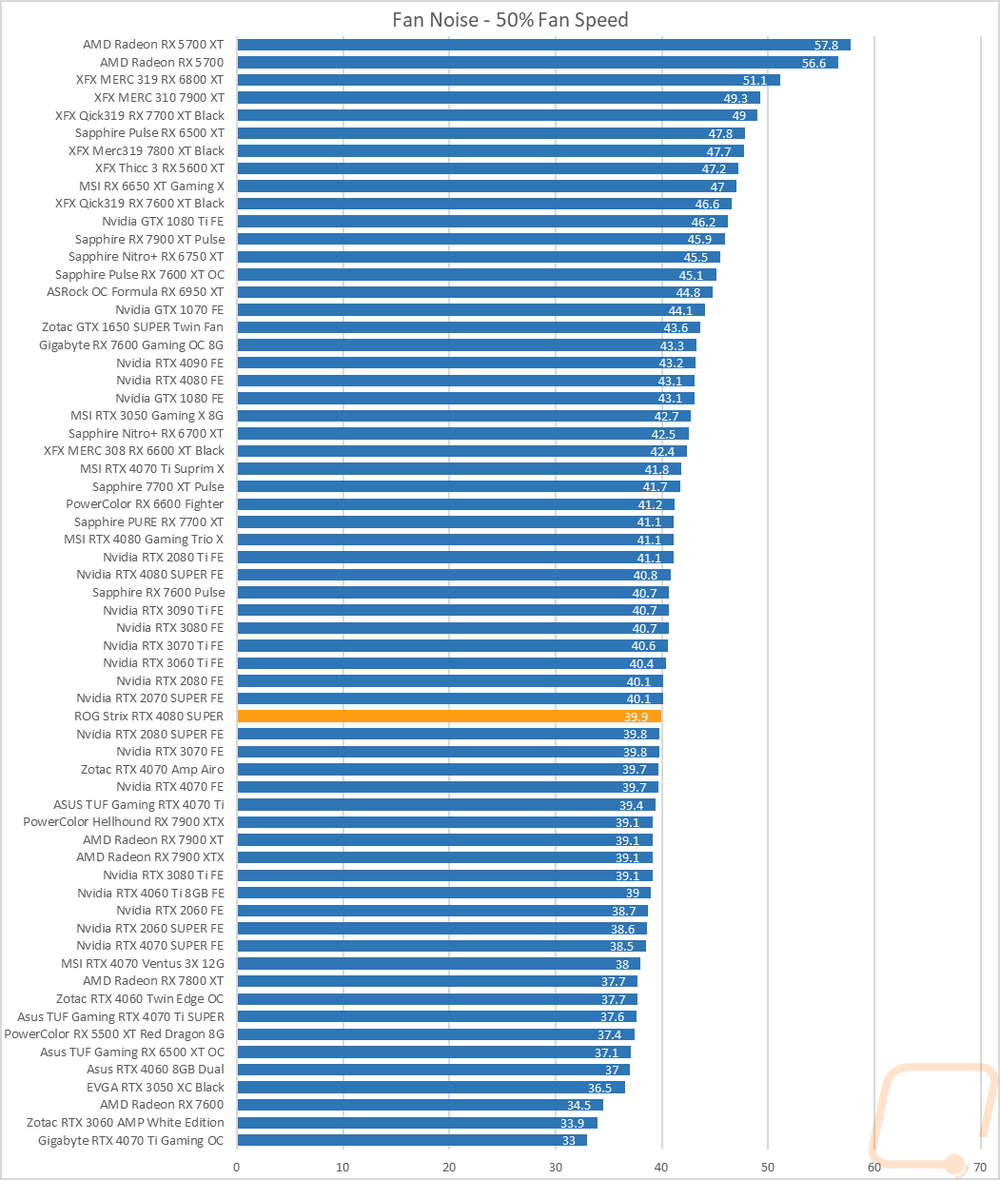
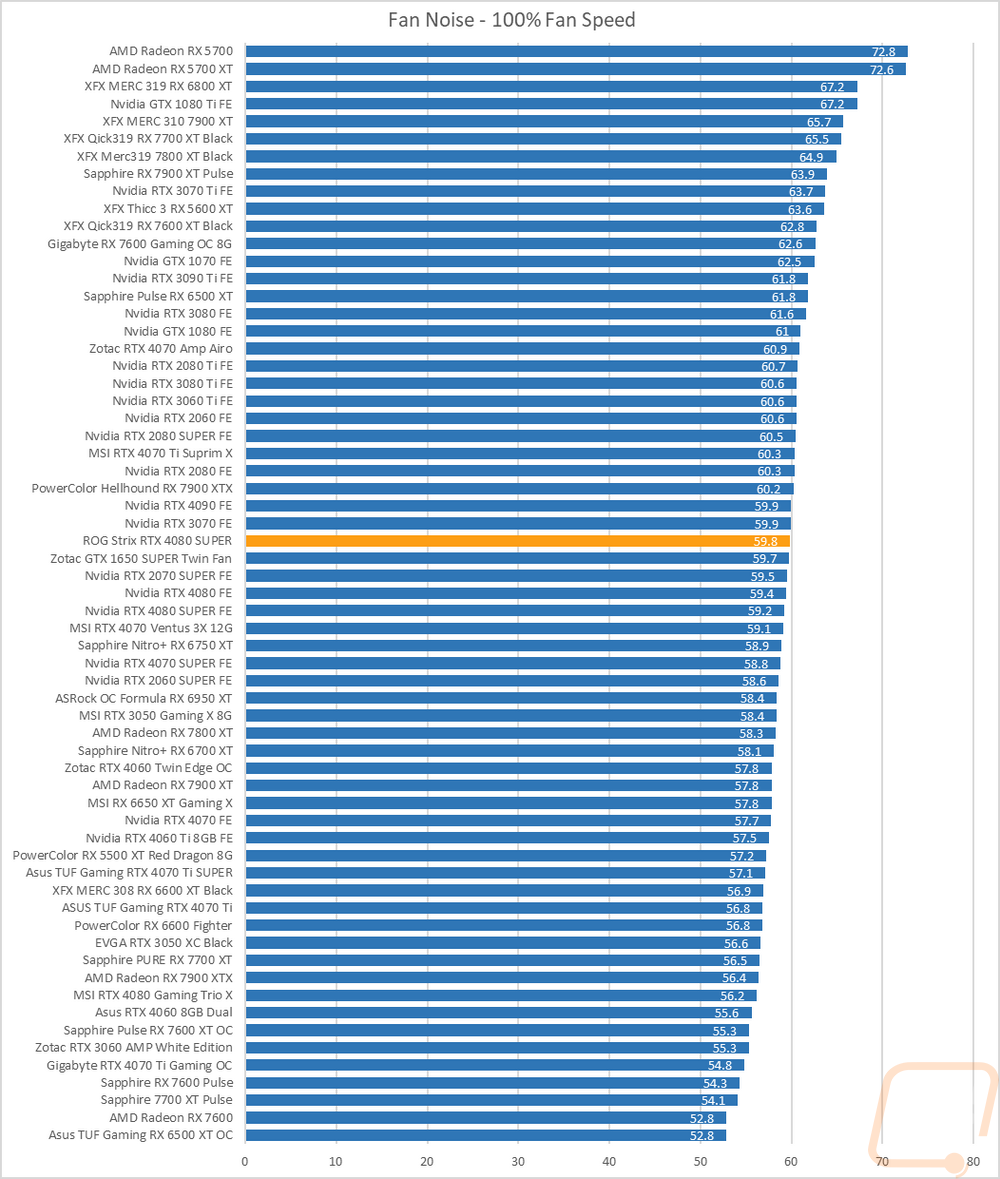
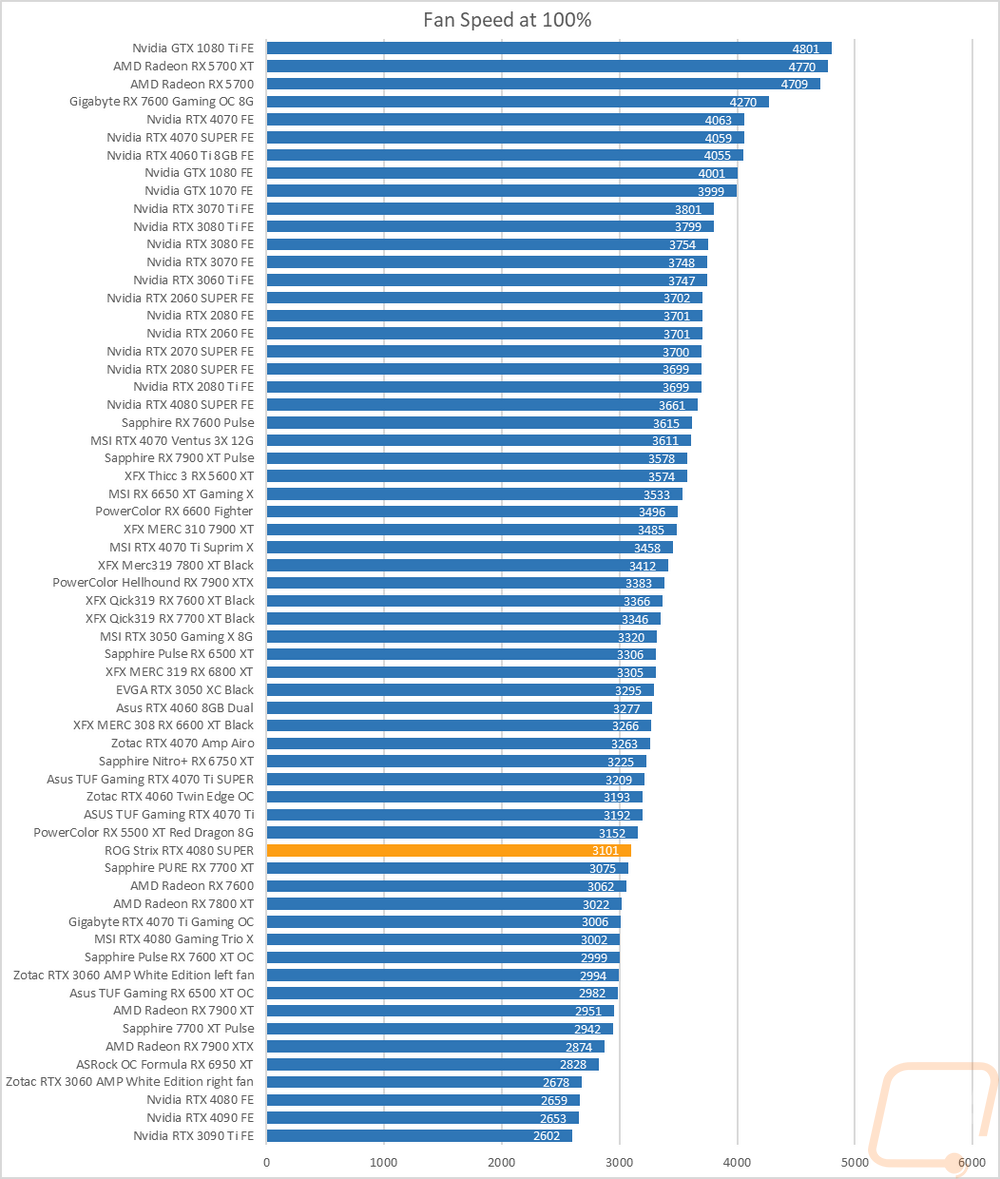
My next round of tests were looking at noise levels. These are especially important to me because I can’t stand to listen to my PC whirling. Especially when I’m not in game and other applications are using the GPU. For my testing, though I first tested with the fan cranked up to 100% to get an idea of how loud it can get, then again at 50% to get an idea of its range. The ROG Strix RTX 4080 SUPER with its three large fans came in at 39.9 decibels at 50% fan speed which for comparison the Founders Edition came in at 40.8 with a fan less. Cranking the fans up to 100% had the fans running at 3101 RPM which is lower down in our charts. The ROG Strix RTX 4080 SUPER was a little higher in the chart here but still only in the middle of the pack at 59.8 dB .6 dB higher than the Founders Edition.
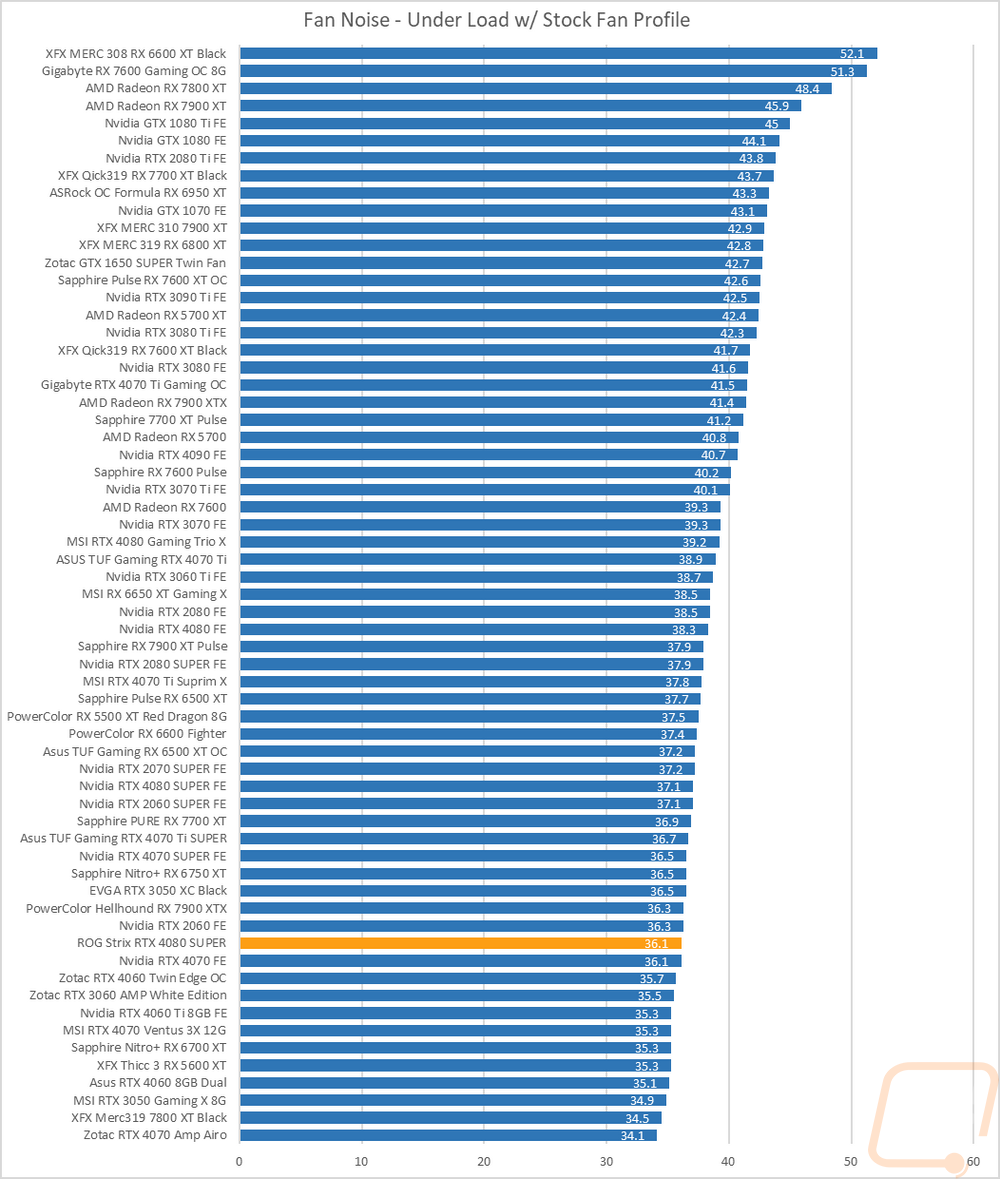
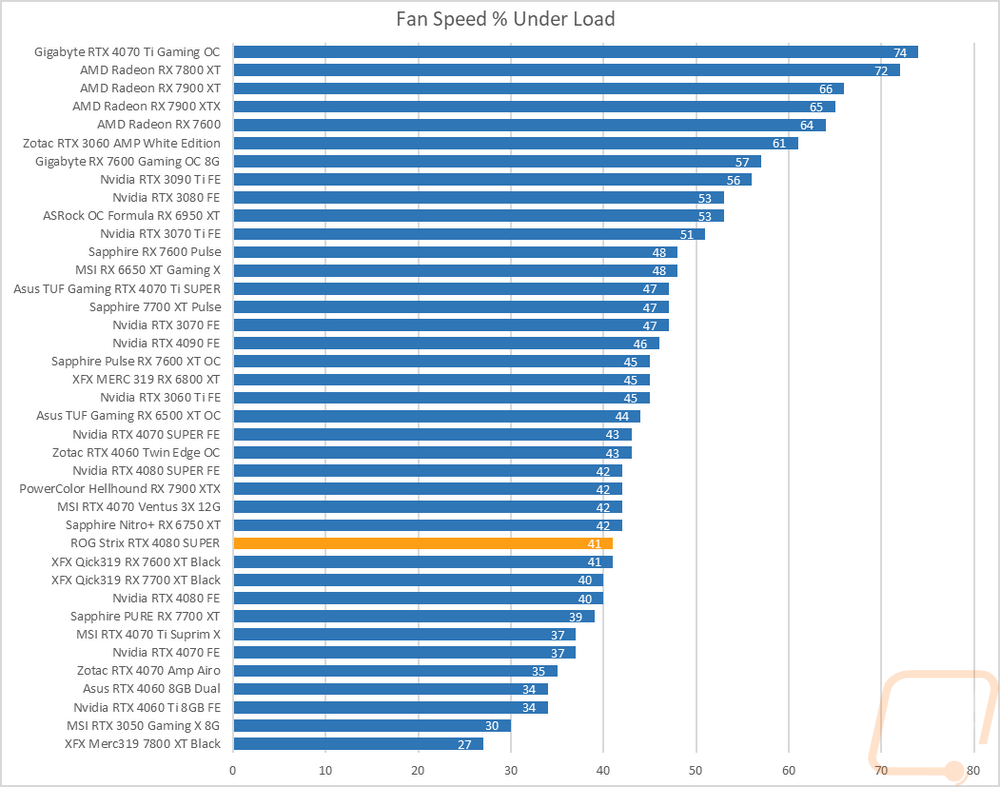
I also take a look at noise performance while under load. For that when running AIDA64’s stress test I wait until the temperature of the card has leveled off and then measure how loud things are when the card is at its worst-case scenario with the stock fan profile. Here the ROG Strix RTX 4080 SUPER ran extremely quiet at 36.1 dB, a full decible below the Founders Edition which itself ran quiet. While doing this test the ROG Strix RTX 4080 SUPER had its fans running at just 41% when under load which helps keep things quiet.
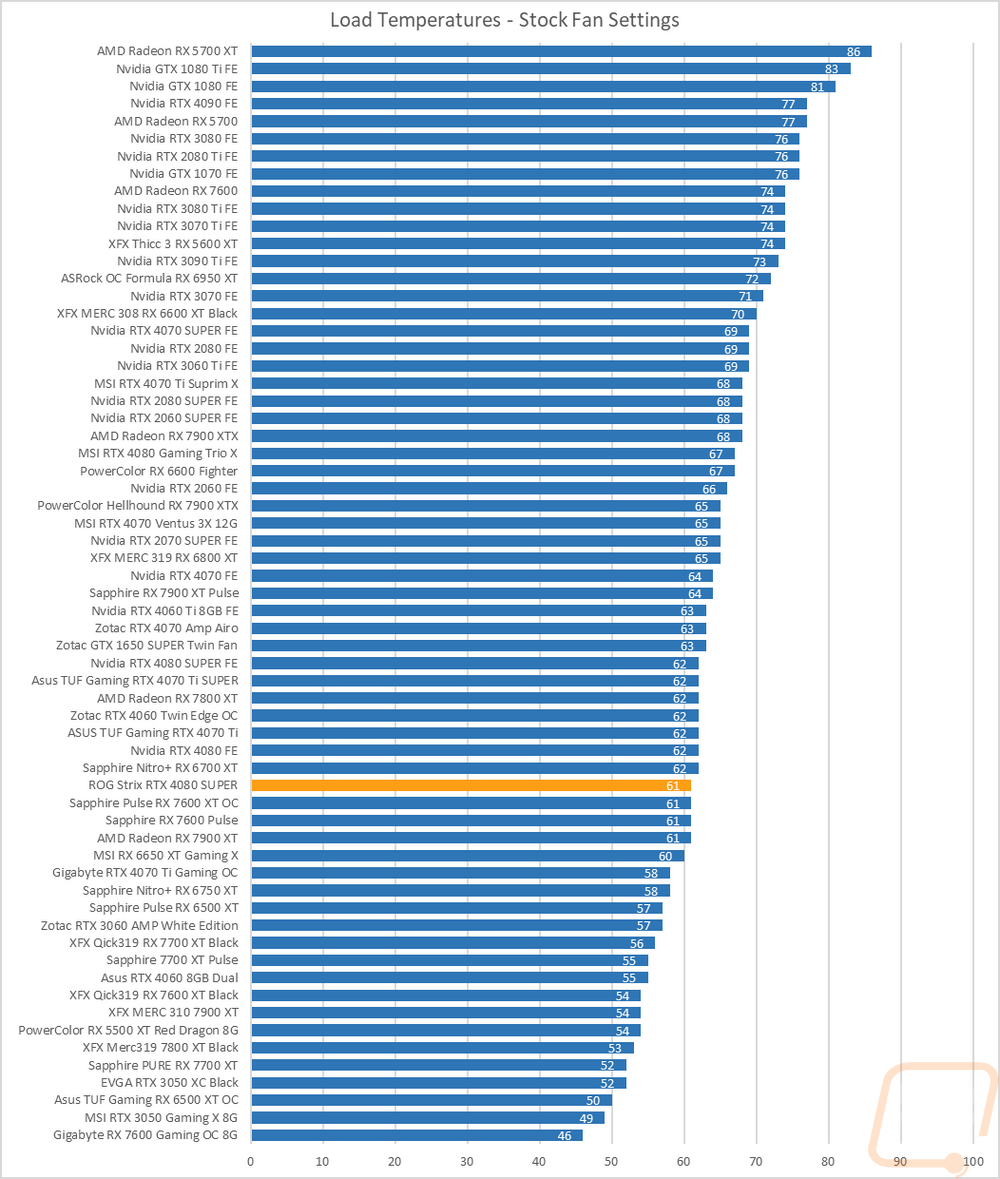
To finish up my testing I of course had to check out the cooling performance. To do this I ran two different tests. I used AIDA64’s Stress Test run for a half-hour each to warm things up. Then I documented what temperature the GPU leveled out at with the stock fan profile and then again with the fans cranked up to 100%. With the stock profile, the ROG Strix RTX 4080 SUPER leveled out in temps at 61c, this is 1c lower than the RTX 4080 SUPER Founders Edition and puts the monster card down in the bottom portion of our charts. The GPU hotspot was running at 74c, 2c less than the Founders Edition, and 52c for the memory temperature which was 6c less than the Founders Edition.
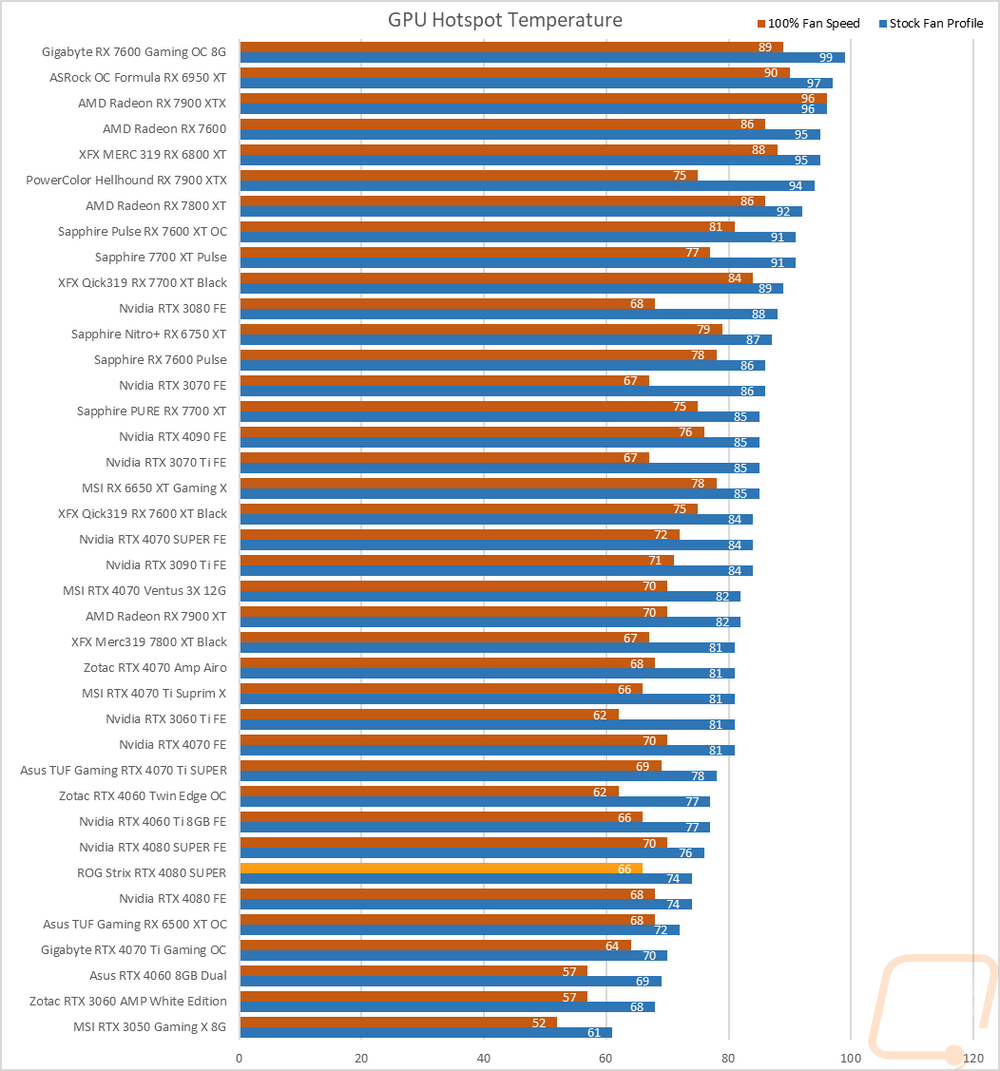
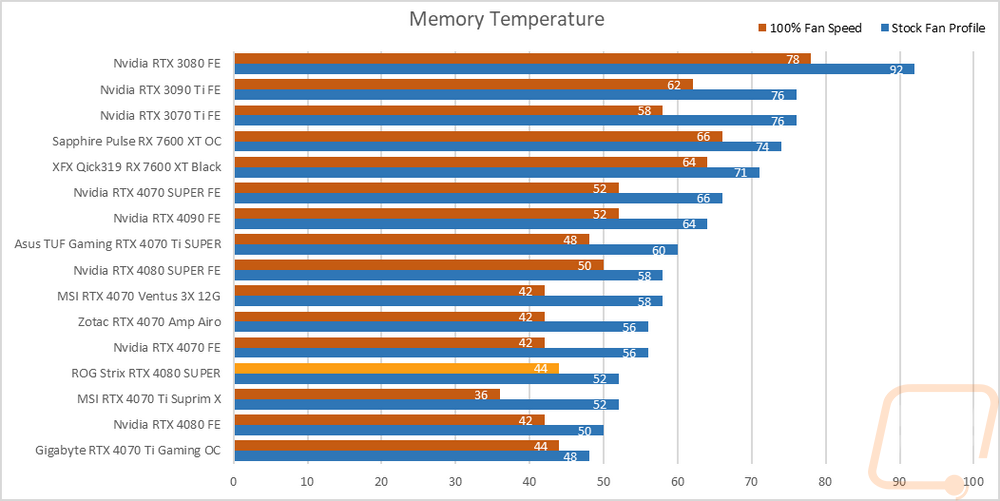
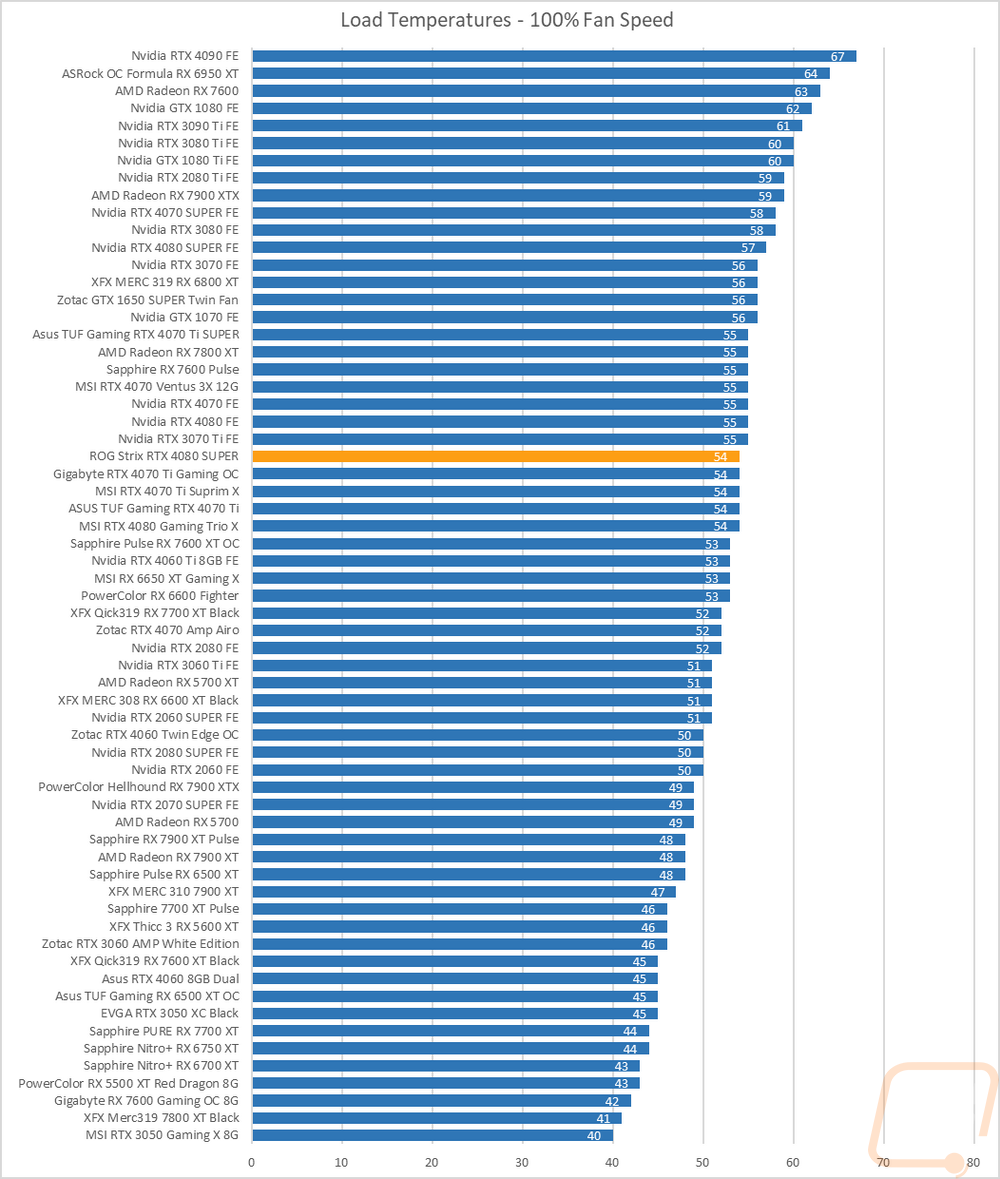
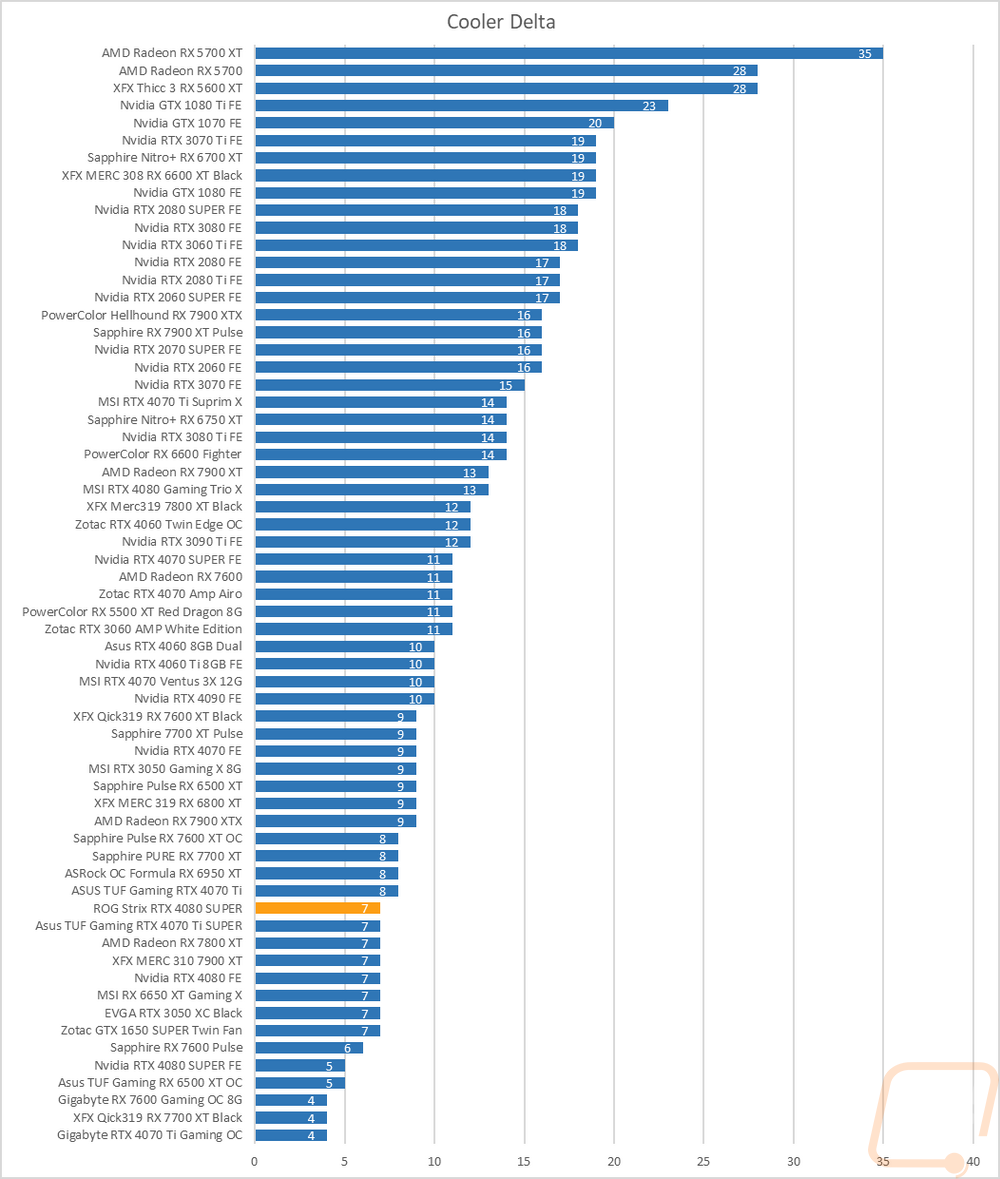
Then with the fans cranked up, the ROG Strix RTX 4080 SUPER dropped down to 54c which is 3c less than the Founders Edition and the delta between that and the stock fan profile was 7c. GPU Hotspot was down to 66c, 4 less than the Founders Edition and the memory was down to 44c, 6c less than the Founders Edition in the same test.
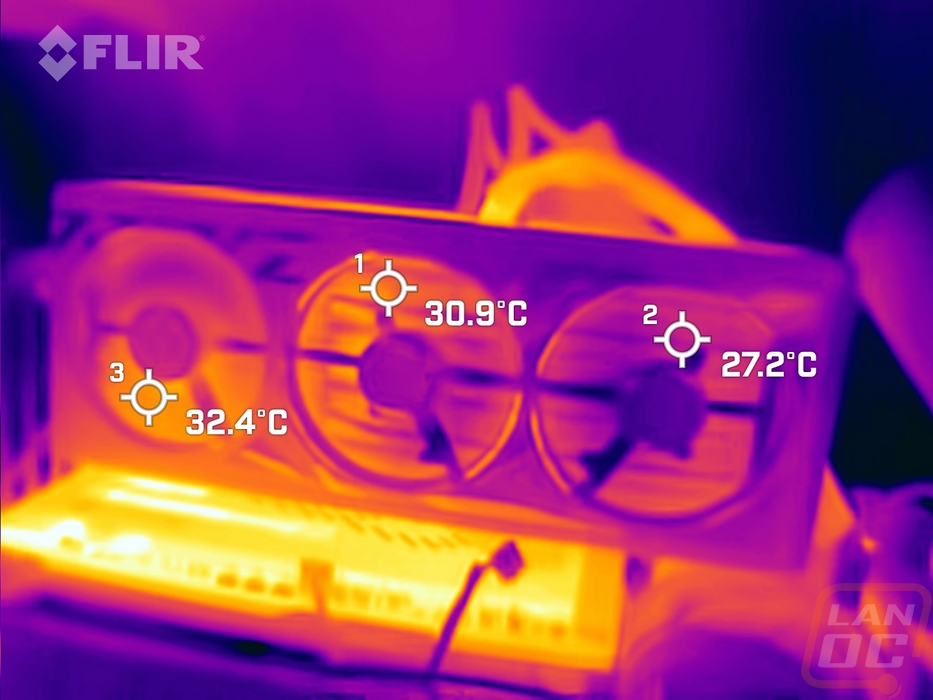
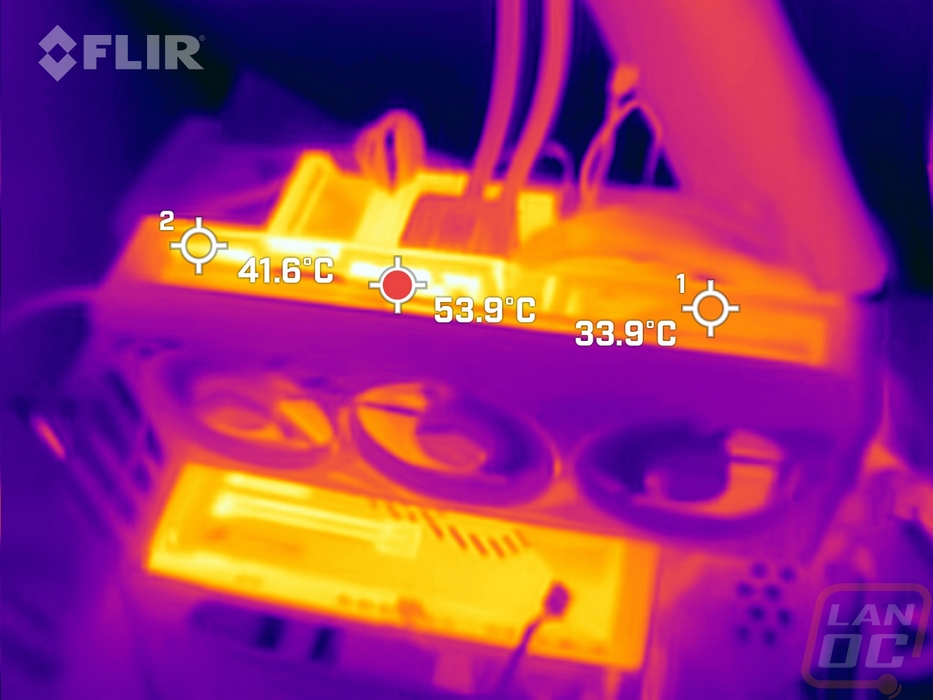
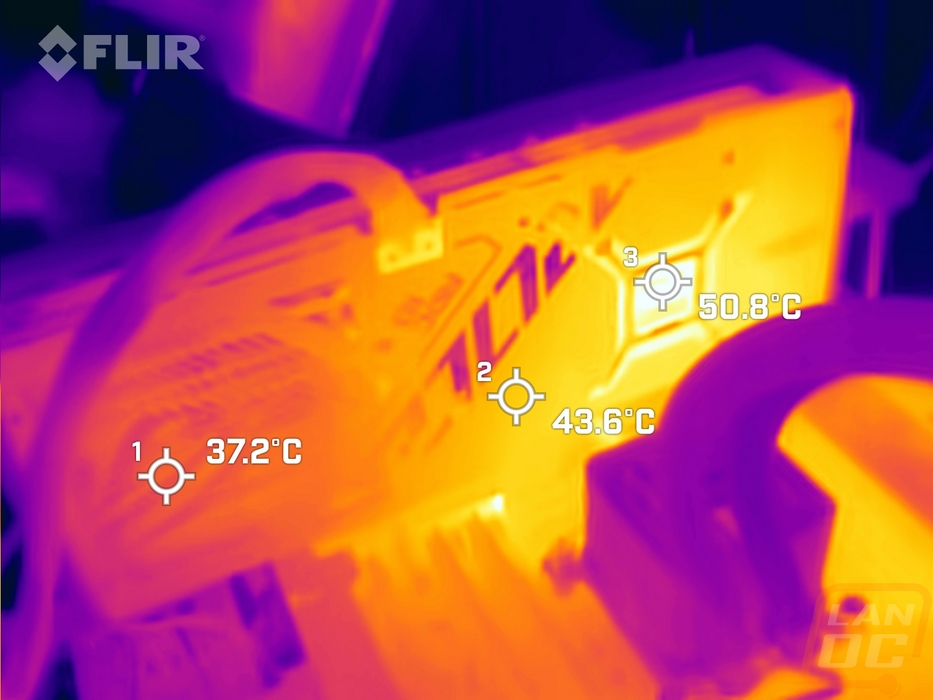
While running the stock fan profile testing I also took the time to get a few thermal images so we could see what is going on. The fan side on the ROG Strix RTX 4080 SUPER is running so cool that it makes the motherboard below it look hot. The warmest spot is in the bottom left but that was just 32.4c and it's nearly room temperature behind the fan on the right end. We can see the heatpipes through the heatsink in this view as well. Up on the top edge is the hottest part of the card, not surprising with this being where a lot of the warmed air vents out. The hotspot here was in the center on the exposed PCB. It is a little cooler to the left and on the right when we get to the blow-through heatsink, it is 20c cooler than on that PCB. Then on the back, the blow-through area is of course running cool at 37.2c. In the middle, the metal backplate is warmed up slightly at 43.6c but the hottest area here is the exposed PCB behind the GPU at 50.8c but that is still running cooler than we saw up on the top edge by 8 degrees.