In-Game Benchmarks
Now we finally get into the in game performance and that is the main reason people pick up a new video card. To test things out I ran through our new benchmark suite that tests 8 games at three different resolutions (1080p, 1440p, and 4k). Most of the games tested have been run at the highest detail setting and a mid-range detail setting to get a look at how turning things up hurts performance and to give an idea of if turning detail down from max will be beneficial for frame rates. In total, each video card is tested 45 times and that makes for a huge mess of results when you put them all together. To help with that I like to start with these overall playability graphs that take all of the results and give an easier-to-read result. I have one for each of the three resolutions and each is broken up into four FPS ranges. Under 30 FPS is considered unplayable, over 30 is playable but not ideal, over 60 is the sweet spot, and then over 120 FPS is for high refresh rate monitors.
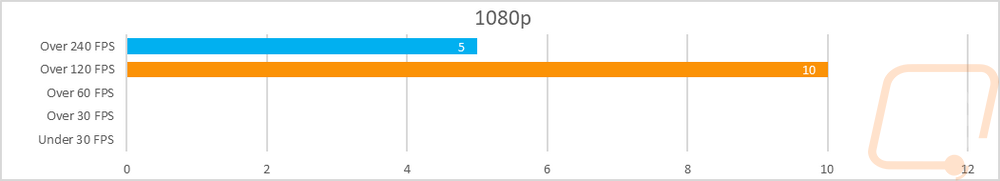
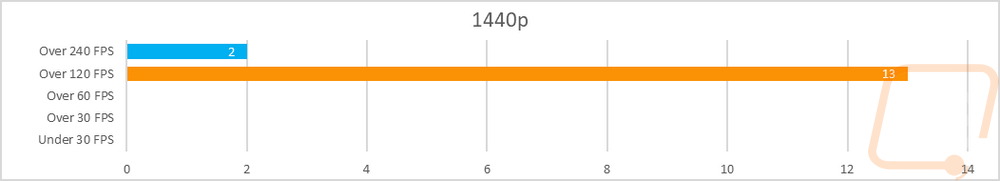
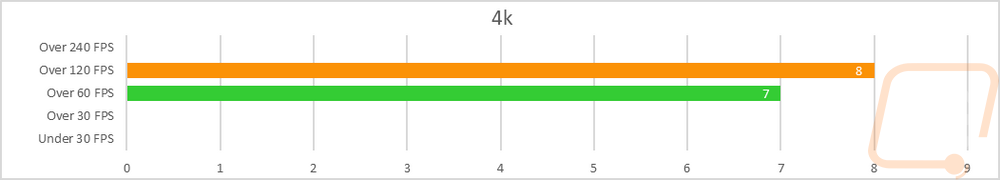
So how did the ROG Strix RTX 4080 SUPER do? Well, there won’t be anyone surprised that at 1080p the biggest limitation was the CPU. Of the 15 test results 10 of them came in over 120 FPS and the other 5 were over 240 FPS. Turning the resolution up changed things slightly, but still, every result was in that 120+ range with 13 results between 120-239 FPS and two were over 240 FPS. Then at 4K, we can finally see the ROG Strix RTX 4080 SUPER doing work. But even at 4K, every result was in the smooth and playable 60 FPS or higher range with 7 in the 60-119 range and 8 results over 120 FPS. This was a change from the Founders Edition which had 8 in the 60 range and 7 in the 120 range so the overclock on the ROG Strix RTX 4080 SUPER pushed one of the results up into the next category.
Of course, I have all of the actual in game results as well for anyone who wants to sort through the wall of graphs below. I also have averaged out all of the results for the ROG Strix RTX 4080 SUPER, the RTX 4080, RTX 4080 SUPER Founders Edition, and a few other video cards in that range for comparison to get a better idea of how the ROG Strix RTX 4080 SUPER performed and fits with the competition. Honestly with how the ROG Strix RTX 4080 SUPER performed in the synthetic benchmarks I wasn’t sure how it would perform when in game but it did improve on the numbers that the 4080 SUPER Founders Edition did especially at 1080p and 1440p, at 4k the gap is smaller but still there. Comparing things with the RX 7900 XTX the ROG Strix RTX 4080 SUPER way out in front at 1080p and 1440p but the higher VRAM on the XTX helped keep it out in front at 4k with a little less than 4 FPS across the average.
|
Average FPS Across Tested Games |
1080p |
1440p |
4K |
|
ASUS TUF Gaming RTX 4070 Ti SUPER |
213.4 |
183.8 |
114.1 |
|
AMD Radeon RX 7900 XT |
211.1 |
186.6 |
114.8 |
|
Nvidia RTX 4080 FE |
220.7 |
193.5 |
127.5 |
|
Nvidia RTX 4080 SUPER FE |
221.2 |
198.9 |
132.4 |
|
ROG Strix RTX 4080 SUPER |
224.9 |
200.6 |
132.9 |
|
AMD Radeon RX 7900 XTX |
212.9 |
196.7 |
136.7 |
|
Nvidia RTX 4090 FE |
232.7 |
217.3 |
166.0 |
