So last week we had our first peak at the kind of new R9 380. Well it just so happens that card was only a 2GB model. Lucky for us PowerColor sent over their PCS+ R9 380 and it has a 4GB frame buffer. So today I’m going to check out the card from PowerColor and see what they have going on and along with that we can see if having the additional frame buffer is worth it in our benchmark suite. With these cards not exactly being focused towards higher resolution gameplay I’m not sure if we will see too much at 1080p but given the 1440p numbers we saw before I bet we see some improvement there!
Product Name: PowerColor PCS+ R9 380
Review Sample Provided by: PowerColor
Written by: Wes
Pictures by: Wes
Amazon Link: HERE
| Specifications | |
| Graphics Engine | RADEON R9 380 |
| Video Memory | 4GB GDDR5 |
| Engine Clock | 980MHz |
| Memory Clock | 1475MHz (5.9Gbps) |
| Memory Interface | 256bit |
| DirectX® Support | 12 |
| Bus Standard | PCIE 3.0 |
| Features Supported | OpenGL CrossFireX™ Technology ATI Stream Technology ATI Eyefinity Technology |
| Display Outputs | DL DVI-I/ DL DVI-D DisplayPort HDMI |
| HDCP Support | Support |
| Maximum Resolution |
VGA: 2048x1536 DVI: 2560x1600 DisplayPort: 4096x2160 HDMI: 4096x2160 |
| Board Dimensions | 207.25mmX111.15 mmx38mm |
| Minimum System Power requirement (W) | 500W |
| Extension Power Connector | Two 6-Pin PCI Express Power Connectors |
Packaging
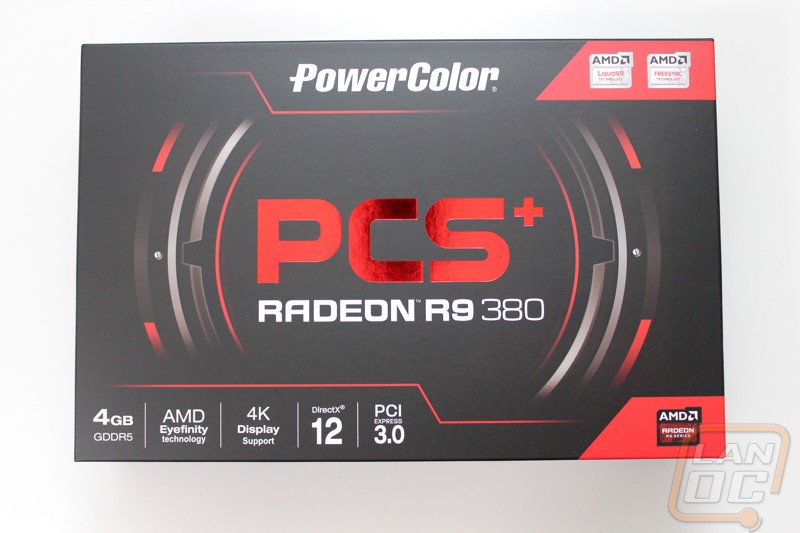
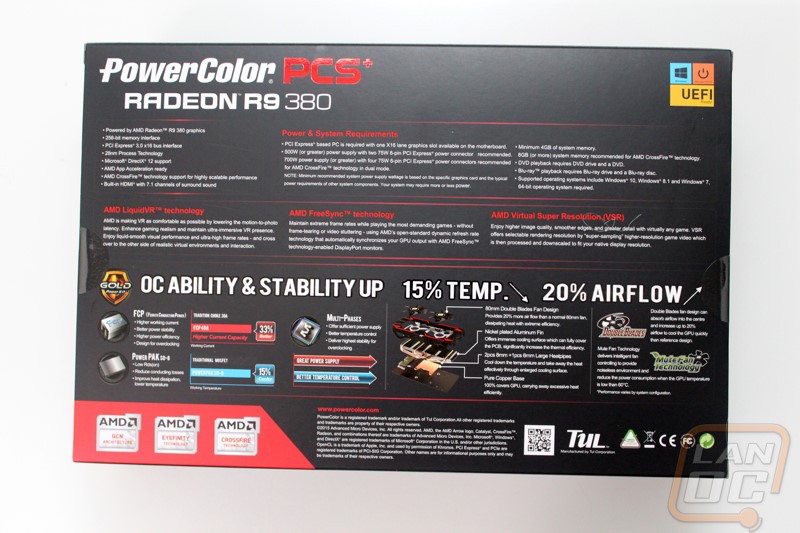
The box for the PowerColor PCS+ R9 380 has the now almost standard red and black theme though to be fair PowerColor has been using it for a long time. The front has a large PCS+ logo in a metallic finish with the model name below it. Down along the bottom we have a little information on the card, namely the 4GB frame buffer as the other icons all represent features found on all AMD cards. I would love to see them slip in a photo of the card on the cover as well rather than the circle design they went with. On the back we have a little more information on the card. They talk about AMD features like FreeSync as well as the PCS+ R9 380’s overclocking ability and the coolers 15% temperature decrease and 10% airflow increase. They did a nice job of including a list of system requirements and power requirements at least. There wasn’t a photo of the card beyond a tiny blown up drawing of the cards cooler, there also wasn’t any specific information or specifications on the card. This was weird to me because from what I can tell PowerColor only has the one 4GB R9 380 but they must be leaving room for additional models in the future.
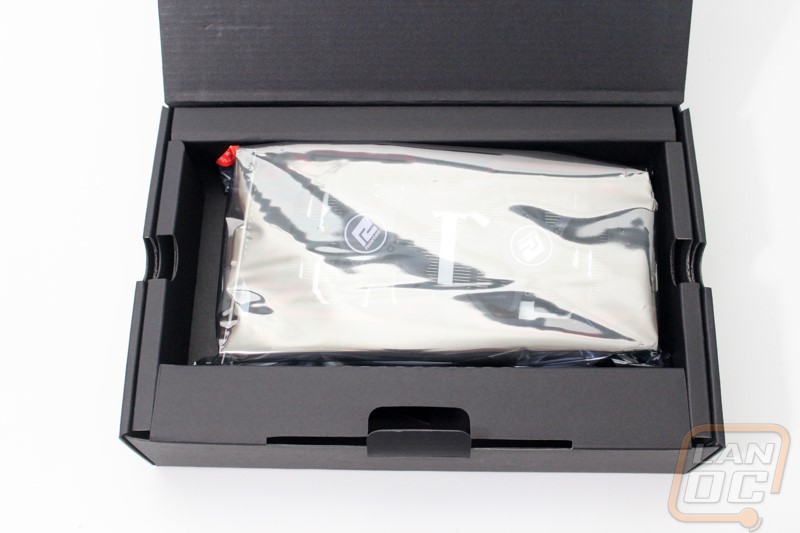
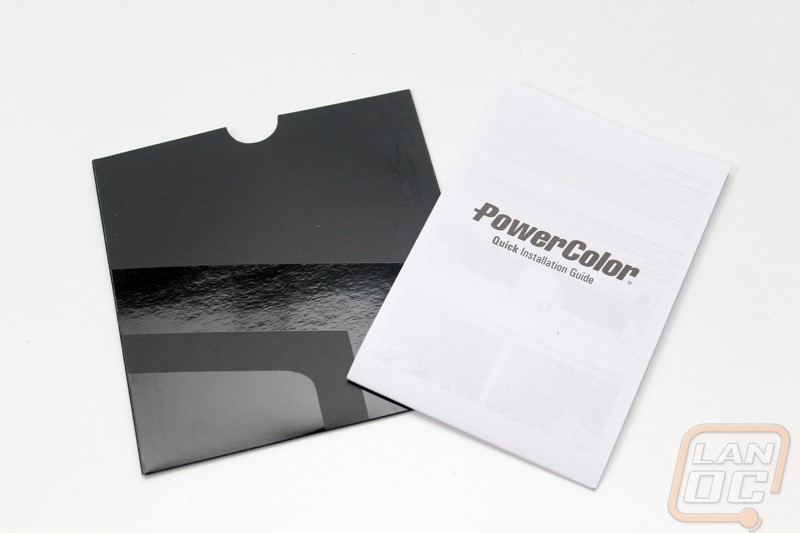
Inside the card is wrapped up in a static protective bag and then it sits in a cardboard tray. Up under that tray is the documentation and normally we would find accessories. So you get a small user manual and a driver disk, oddly enough they don’t include a DVI to VGA adapter or power adapters like most cards.
Card Layout and Photos
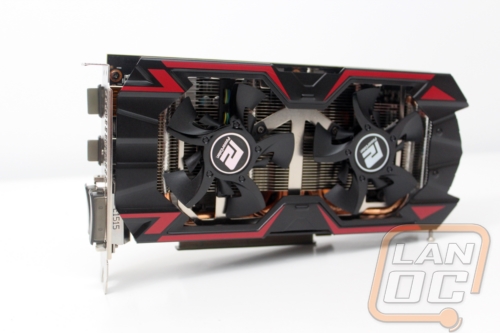
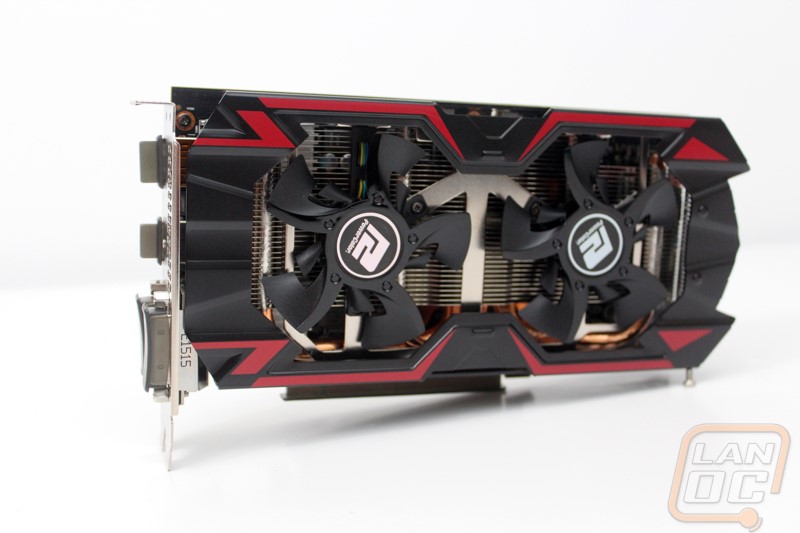
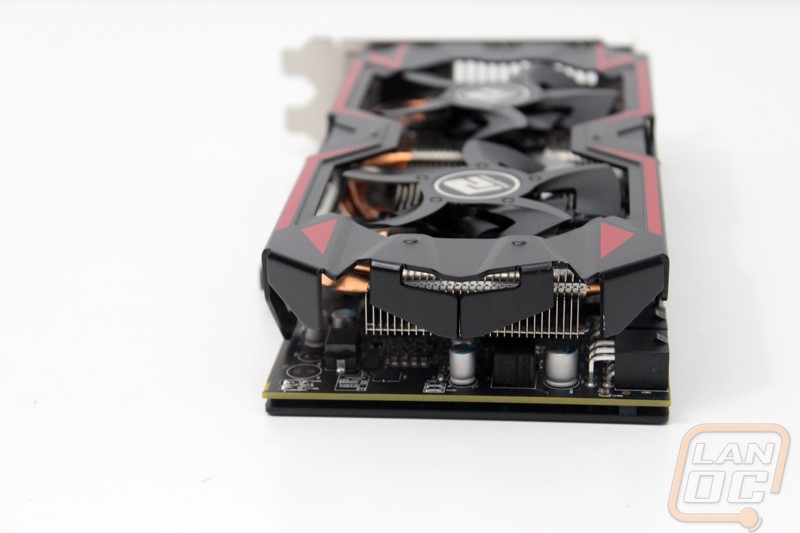
The PowerColor PCS+ R9 380 is an interesting looking card. For the most part a lot of the cards tend to all look the same but I can say for sure that this card looks nothing like them. Just the two fans alone are enough to set it apart. They seem to be missing every other fan blade but if you look closely the second blade is there but small and tucked up inside a knock out of the larger fan blades. The blades don’t look attached to a circle in the center as well, the middle of the fans actually looks to be part of the fan blades. The fan shroud is a little different as well. As regular readers might know I love metal fan shrouds and this card does have one. PowerColor stamped it out of steel and then finished it in a textured black with red stripes. By stamping the shroud out of metal they were able to do a design much closer to the plastic shrouds but with a little stronger design. The black and red theme isn’t different but the opening between the two fans is. Additionally the whole design is noticeably smaller in both height and width compared to the MSI 380. Next to each other they look like completely different GPUs, the PCS+ 380 is a lot more likely to fit in your small builds.
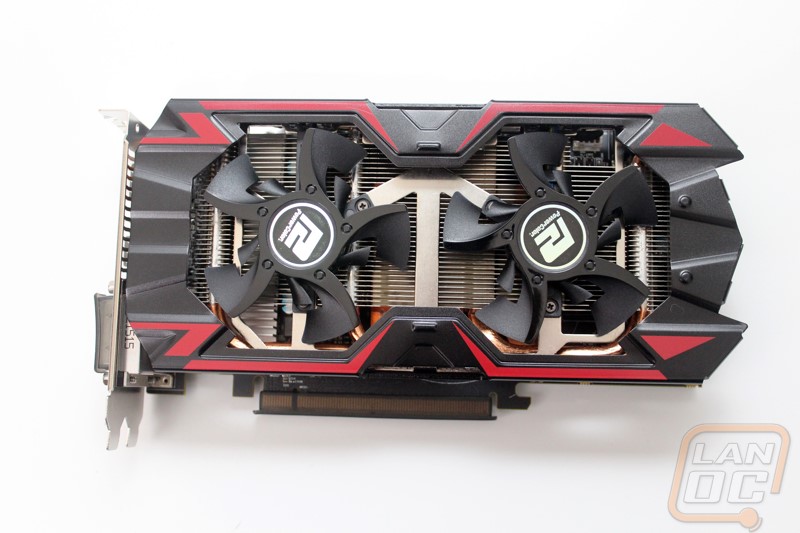
For a card that is relatively small I was surprised that PowerColor decided to pack the heatpipes in up under the fan shroud. In fact the heatsink is actually only about 2 and a half inches tall, the rest of the space under the shroud is taken up by the heatpipes. Given the smaller fans the small heatsink is about the right size for the fans though. The two fans blow the air down through the heatsink and across the PCB. From there the air does vent out every edge of the card. This means the warmed air will vent into your case but that is expected for cards with aftermarket coolers.
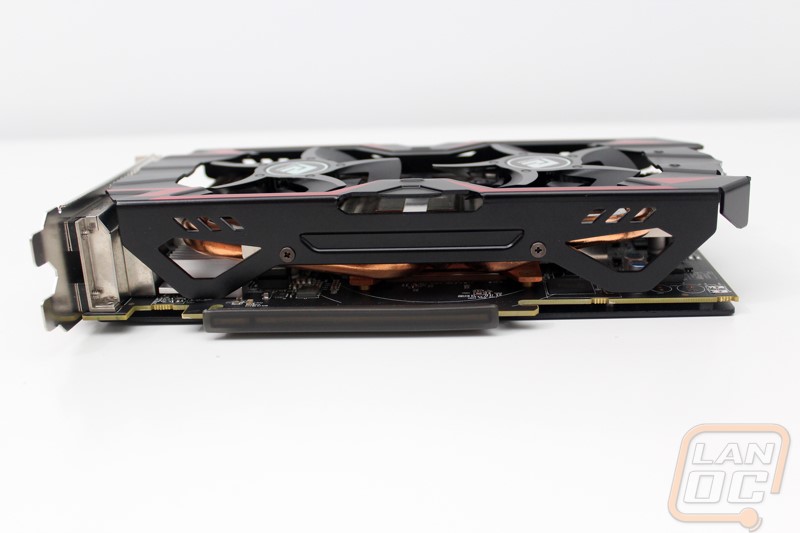
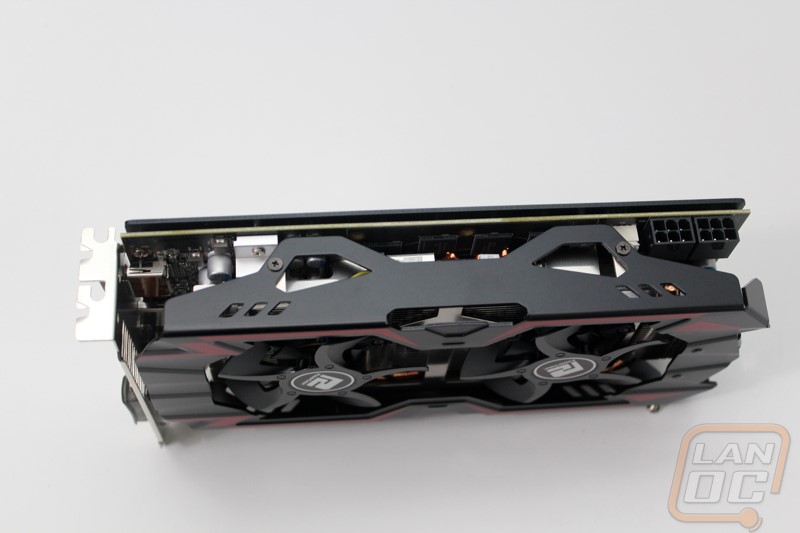
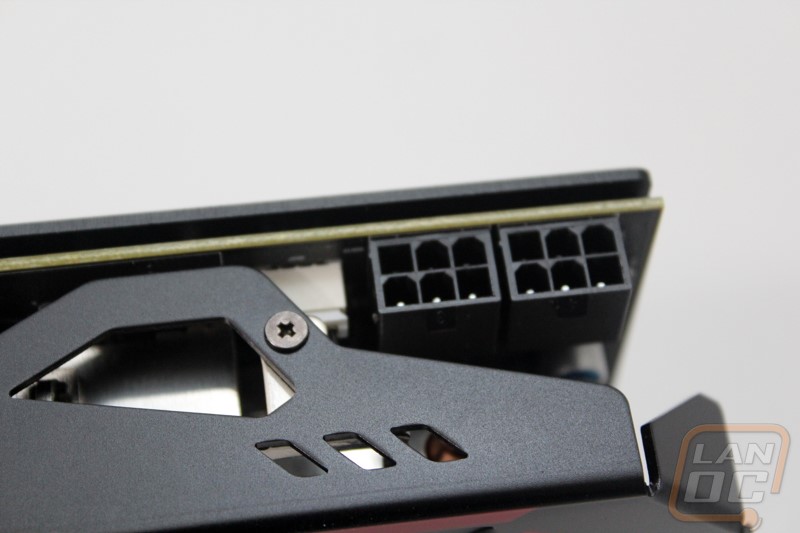
For power the PCS+ 380 needs two six pin connections to get everything powered up. This is the same as seen on other R9 380’s so no surprise there. The connectors are facing the normal direction and even though the fan shroud gets kind of close there is more than enough room to get your finger in there and unhook the cables.
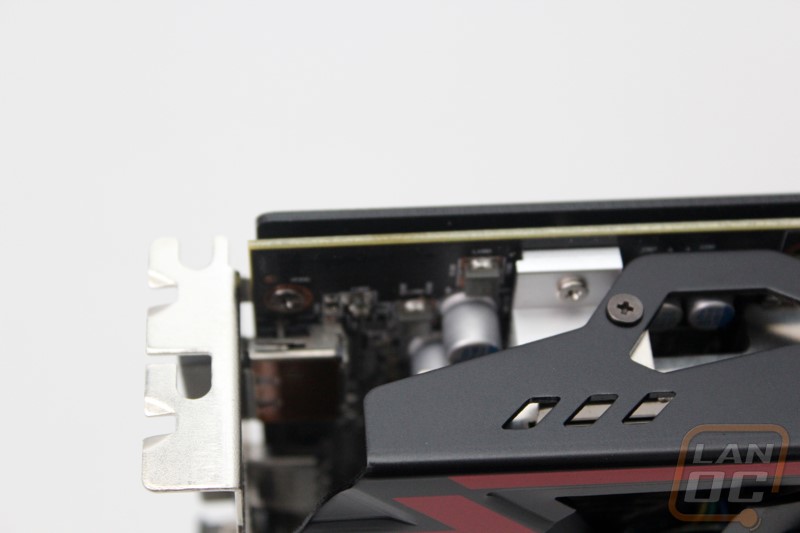
The R9 380 doesn’t have a traditional Crossfire bridge, like the R9 290 they actually run the Crossfire through the PCI slot.
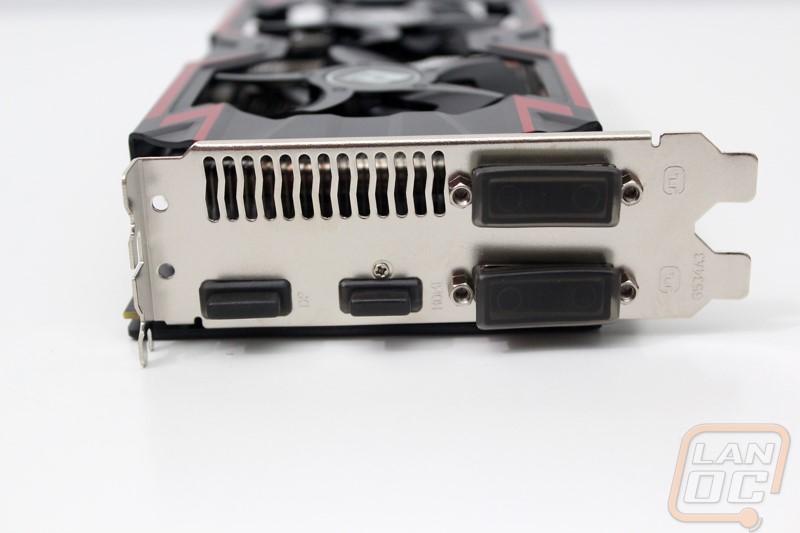
For display connections the PCS+ has the same options that the MSI 380 had as well. You get two DVI connections as well as a DisplayPort and HDMI both full sized. There is a small vent in the second slot as well for a little of the warm air from the card to vent. Most cards these days are going away from the dual DVI connections and moving to more DisplayPort connections so I’m always happy to see the dual DVIs, I know a lot of people haven’t even moved to HDMI monitors let alone DisplayPort.
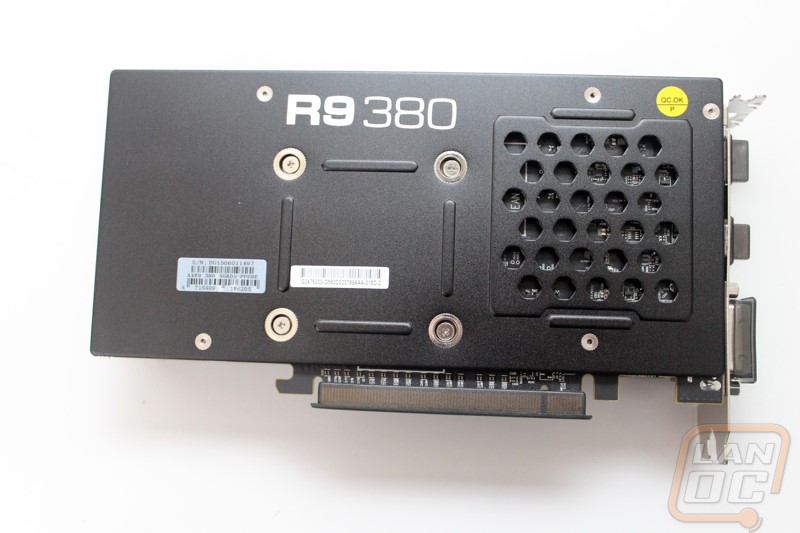
The back of the PCS+ R9 380 had a stamped steel backplate. This helps with the rigity of the card and prevent the PCB from bending over time but they are known for hurting temps. To help with that PowerColor did vent part of the backplate. The MSI 380 had a backplate as well but it was machined aluminum, its vents were on the end towards the power circuity, I’m curious if the location on this card will help or hurt cooling. The backplate also has the serial number and model number on it to make it easier to find those if you ever have to RMA. They also included the R9 380 logo on the backplate although I would have preferred the logo to be flipped around so that you can see it when the card is installed.
Our Test Rig and Procedures
| Our Test Rig | ||
| CPU | Intel i7-3960X | Live Pricing |
| Memory | Corsair Vengeance 1600 MHz DDR3 RAM Quad Channel (4x4GB) | Live Pricing |
| Motherboard | Asus Rampage IV X79 Motherboard | Live Pricing |
| Cooling | Intel Active Thermal Solution RTS2011LC | Live Pricing |
| Power Supply | Cooler Master Gold Series 1200 Watt PSU | Live Pricing |
| Storage | ||
| Case | High Speed PC Test Bench | Live Pricing |
| Our Testing Procedures | |
| 3DMark | The same goes for the most current version of 3DMark using the Fire Strike benchmark in normal, extreme, and ultra settings |
| Unigine Heaven Benchmark 4.0 | Using the “Extreme” preset |
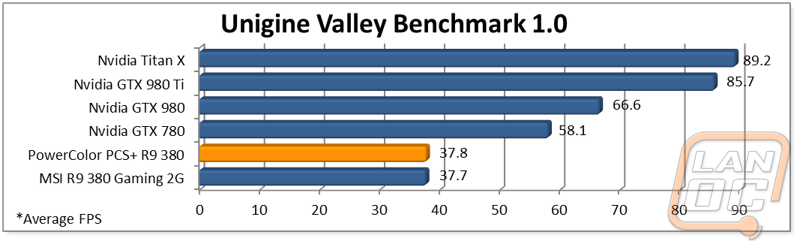
| Unigine Valley Benchmark 1.0 | Using the Extreme HD preset to get an average FPS |
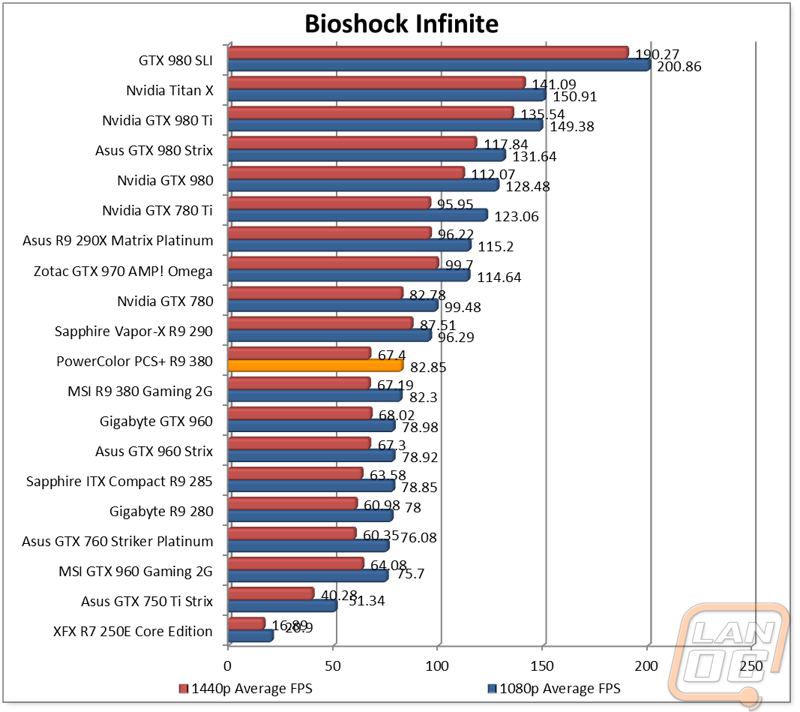
| Bioshock Infinite | Using the Adrenaline Action Benchmark Tool we run Bioshock Infinite on the “Xtreme” quality setting. This has a resolution of 1920x1080, FXAA turned on, Ultra Texture detail, 16x Aniso Texture Filtering, Ultra Dynamic Shadows, Normal Postprocessing, Light Shafts on, Ambient Occlusion set to ultra, and the Level of Detail set to Ultra as well. We also run this same test at 2560x1440 using the same settings as mentioned above. |
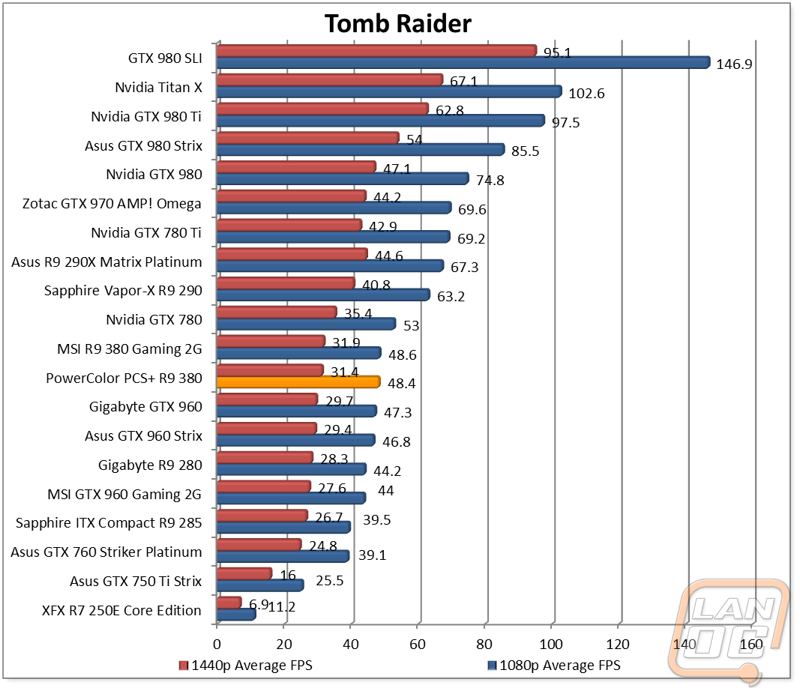
| Tomb Raider | Using the Adrenaline Action Benchmark Tool we run Tomb Raider on the “Xtreme” quality setting. This has a resolution of 1920x1080, Exclusive Fullscreen turned on, Anti-Aliasing set to 2xSSAA, Texture Quality set to Ultra, Texture Aniso set to 16x Aniso, Hair Quality set to TressFX, Shadow set to Normal, Shadow Resolution on High, Ultra SSAO, Ultra Depth of Field, High Reflection quality, Ultra LOD scale, Post Processing On, High Precision RT turned on, and Tessellation is also turned on. We also run this same test at 2560x1440 using the same settings as mentioned above. |
| Hitman: Absolution | Using the Adrenaline Action Benchmark Tool we run Hitman: Absolution on the “Xtreme” quality setting other than the MSAA setting is turned down from 8x to 2x. That setting puts the resolution at 1920x1080, MSAA is set to 2x, Texture Quality is set to High, Texture Aniso is set to 16x, Shadows are on Ultra, SSA is set to high, Global Illumination is turned on, Reflections are set to High, FXAA is on, Level of Detail is set to Ultra, Depth of Field is high, Tessellation is turned on, and Bloom is set to normal. We also run this same test at 2560x1440 using the same settings as mentioned above, except on the “high” setting. |
| Sleeping Dogs | Using the Adrenaline Action Benchmark Tool we run Sleeping Dogs on the “Xtreme” quality setting. That means our resolution is set to 1920x1080, Anti-Aliasing is set to Extreme, Texture Quality is set to High-Res, Shadow Quality is High, Shadow Filter is set to high, SSAO is set to High, Motion Blur Level is set to High, and World Density is set to Extreme. We also run this same test at 2560x1440 using the same settings as mentioned above. |
| F1 2014 | We use the built in benchmark for F1 2014. We use the Ultra setting and then test at 2560x1440 and 1920x1080 |
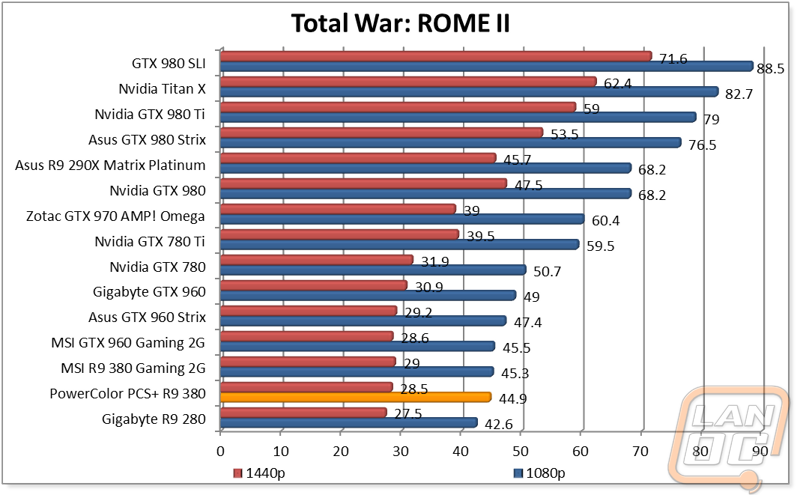
| Total War: ROME II | Ultra setting tested at 1920x1080 and 2560x1440, built in forest benchmark |
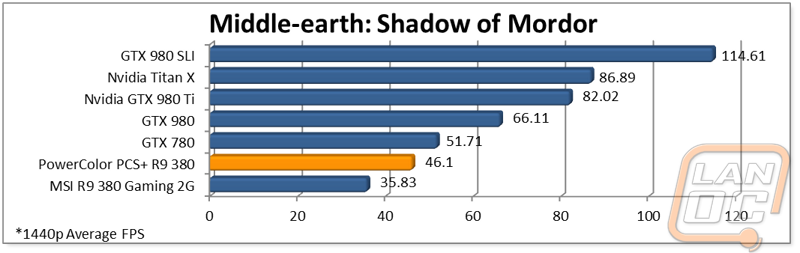
| Middle-earth: Shadow of Mordor | Using the built in benchmark we test with ultra settings at 1440p |
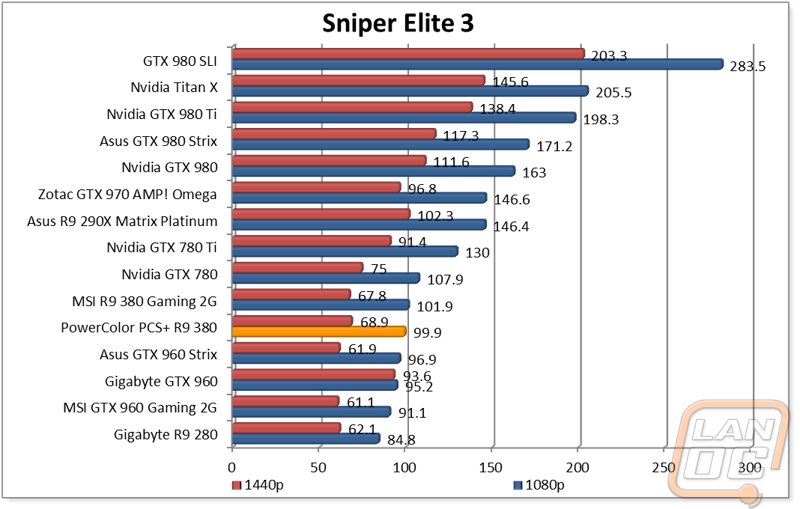
| Sniper Elite 3 | Ultra setting tested at 1920x1080 and 2560x1440, built in benchmark |
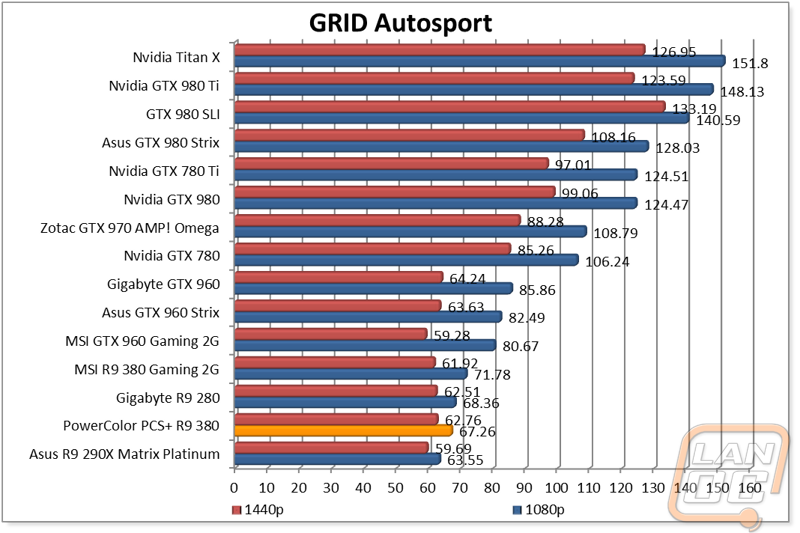
| GRID Autosport | Ultra setting tested at 1920x1080 and 2560x1440, built in benchmark |
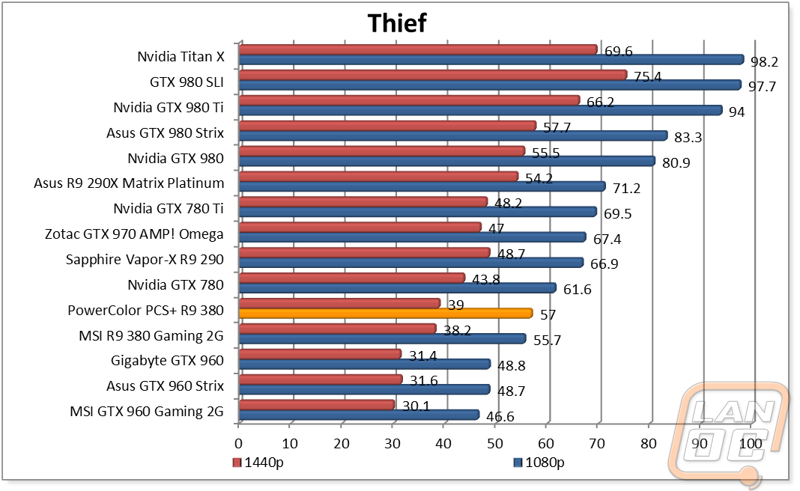
| Theif | Tested using the “Very High” setting at 1920x1080 and 2560x1440 |
| Folding @ Home | Using the Folding @ Home benchmark we test both single and double precision using the explicit result |
| Unreal Heaven Benchmark 4.0 heat testing | We run through Unreal Heaven using the “Extreme” preset for 30 minutes to test in game cooling performance. |
| Power Usage | Using Unreal Heaven Benchmark 4.0, we get our “load” power usage number from the peak power usage during our test. We get our numbers from a Kill-A-Watt connected to the test benches power cord. |
| Noise Testing | Our Noise testing is done using a decibel meter 3 inches away from the video card on the bottom/fan side of the card. We test an idle noise level and then to get an idea of how loud the card will get if it warms all the way up we also turn the fan speed up to 50% and 100% and test both speeds as well. The 100% test isn’t a representation of typical in game noise levels, but it will show you how loud a card can be if you run it at its highest setting or if it gets very hot. |
Synthetic Benchmarks
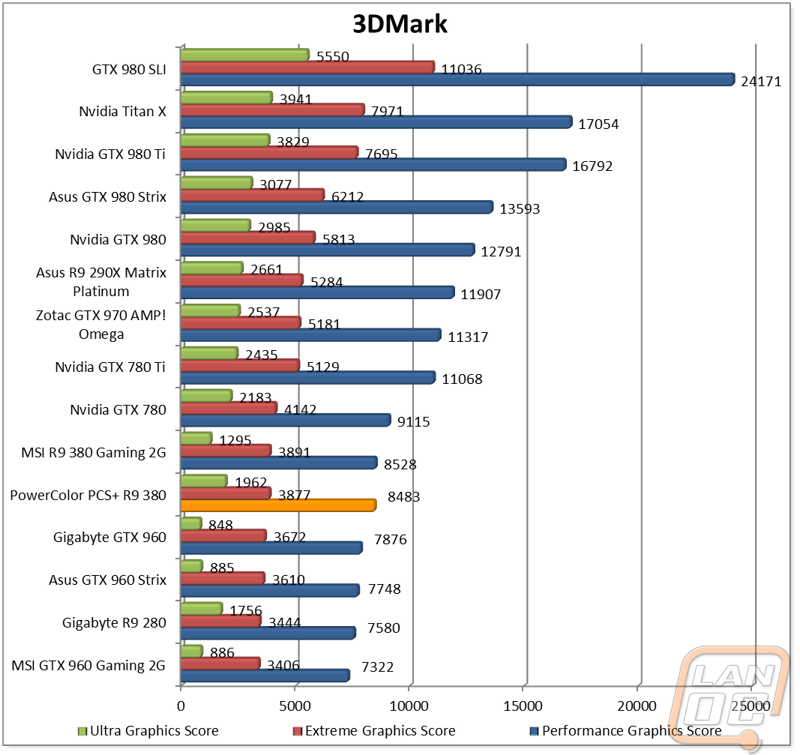
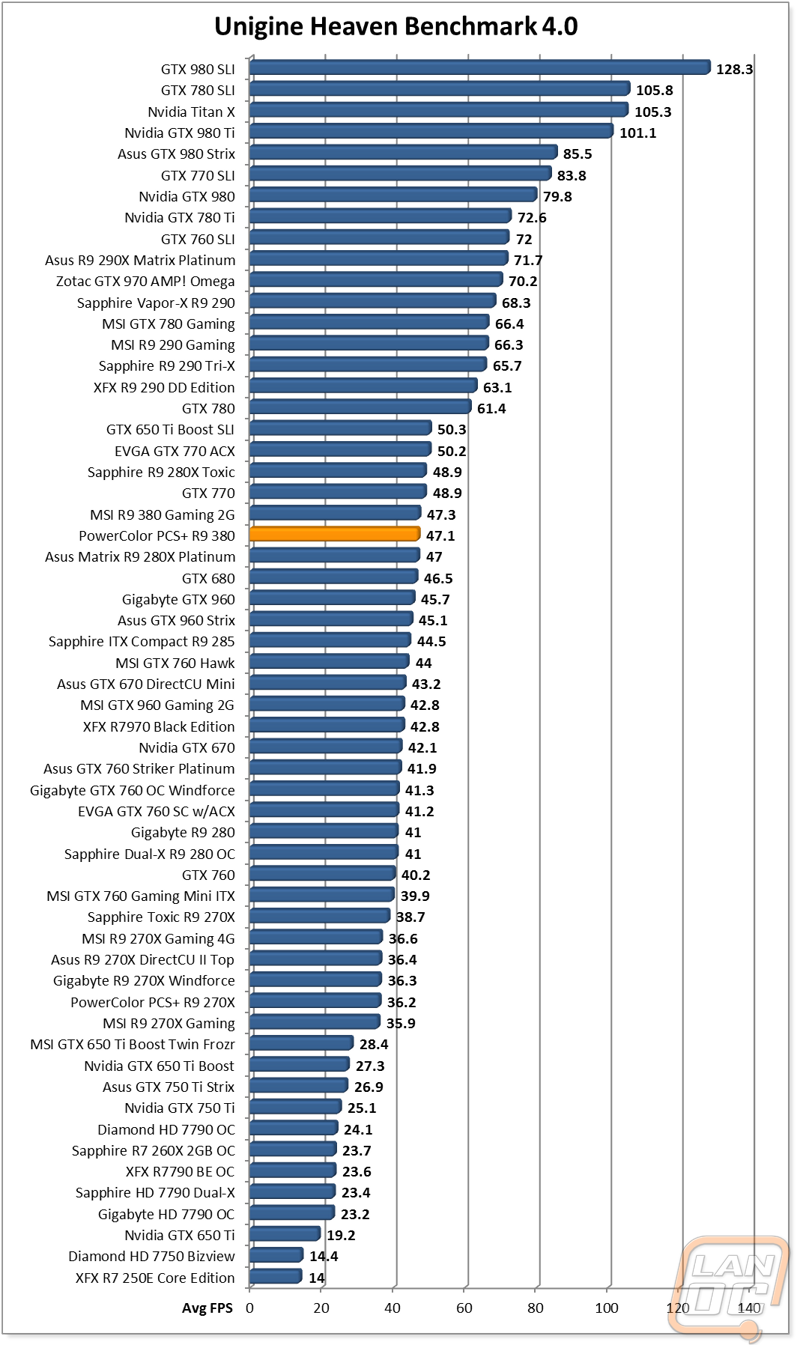
To start off my testing I ran the PowerColor PCS+ R9 380 through our standard synthetic benchmark suite. While these results don’t really have a correlation with in game performance they are still a great way to compare card to card. In this case I was really curious if the PowerColor would see an improvement compared to the MSI R9 380 because the PowerColor has 4 gigs of memory where the MSI only had 2 gigs. In 3DMark on the performance setting the results were nearly the same. The same goes for the 1440p Extreme setting. However when we tested at 4K the PowerColor really pulled ahead. In fact it was surprisingly close to the GTX 980 on the Ultra setting as well. In both of the Unigine benchmarks the results between the two cards were basically the same leaving the PowerColor 380 between the GTX 770 and the GTX960 just like we saw previously.
In-Game Benchmarks
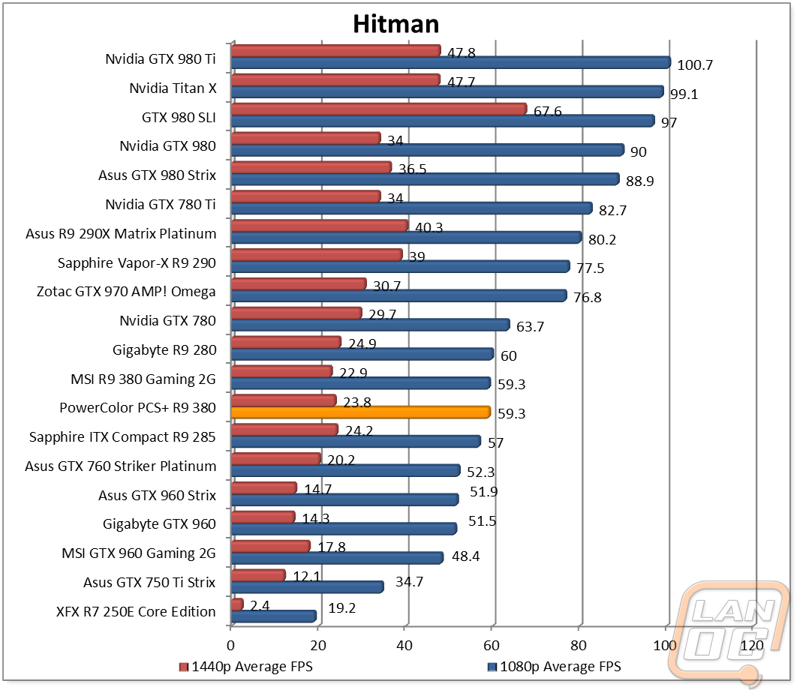
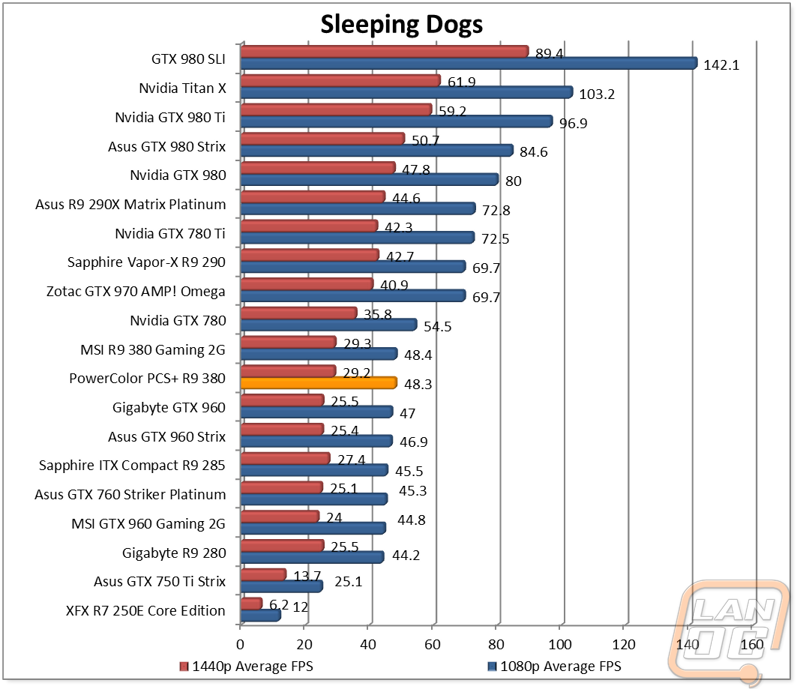
So when we get into in game benchmarks we can finally see exactly how well the PowerColor PCS+ R9 380 will perform for you in game. For our testing I tested the card in 9 different games at 1440 and 8 at 1080p (Shadow at Mordor won’t let me force 1080p on our 1440p monitor). All of the games were set at their highest settings for all of the testing to get a worse case scenario. When breaking the card down by our three ratings (less than 30 FPS, Over 30 FPS, and Over 60FPS) for each game we can get an idea of if you can run the game at max settings out of the box and get the sweet spot frame rate (60 or above), if you might need to adjust the settings to hit the sweet spot but still playable (Above 30), or if the game is unplayable (under 30 FSP) we can get an idea of what to expect. Just like the MSI the PowerColor 380 ended up with 5/8 of the 1080p results in the playable but could use some setting tweaks and the other 3/8 were perfectly playable at max settings.
At 1440p I was expecting to see a little bit of an improvement in performance for the 4GB PowerColor but when looking at our rankings you can’t see it. The results were 3/3/3 with three games in each rating. When looking at the results I could still see an obvious increase in performance though so I averaged out the results to see the overall improvement. In the end (as you can see below) the PowerColor did have nearly a 2FPS improvement here. This is even better considering the MSI has a slightly higher boost clock speed. Is it worth? Well we will dig into that later when we talk about how much the cards cost.
Powercolor 380
1080p Average 63.48875
1440p Average 44.11777
MSI 380
1080p Average 64.16
1440p Average 42.671111
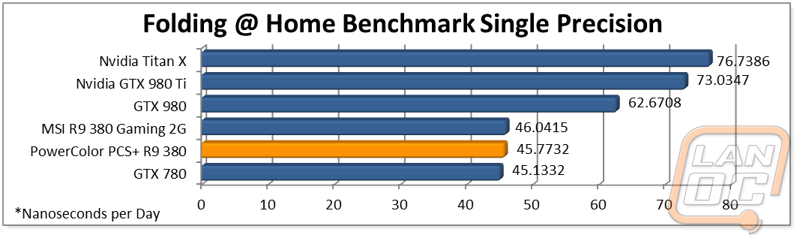
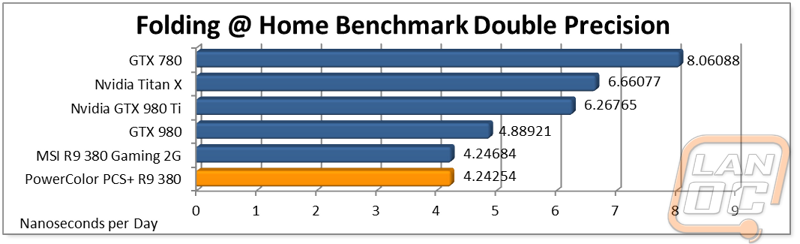
Compute Performance
As I said in the MSI R9 380 review, I doubt people are picking up R9 380’s for their compute power. But I did still run the PowerColor through our Compute benchmarks in Folding @ Home. This will help give users considering adding one to their folding array they can see how it performs and as well as those of you who do some video editing on the side. The higher memory capacity of the PowerColor makes no difference here so the MSI did have a slight lead with its slight overclock advantage. That said in the single precision testing the 380’s performed great in comparison to the GTX 780. In the double precision testing the GTX 780 dominated but the 380’s did get respectably close to the gimped GTX 980.
Cooling, Noise, and Power
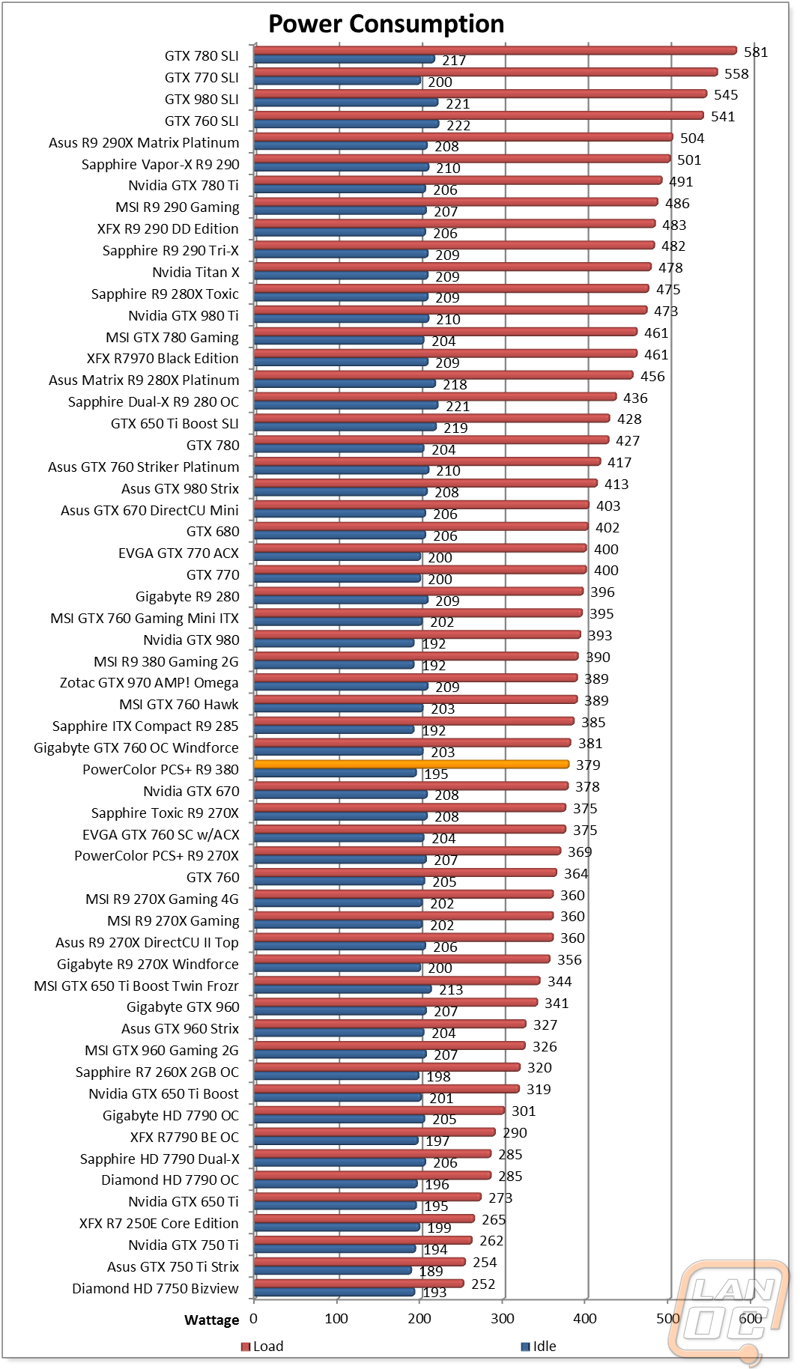
Considering how close the performance between the two R9 380’s has been it makes this section even more important. In this section we get to take a look at noise and temperature performance of the aftermarket coolers. Those coolers are one of the big factors in what sets each card apart. In this case I was also curious if the memory and overclock differences would play any part in power usage as well. So to start off I took a look at our power testing. I recorded idle numbers with our Kill A Watt then ran the 380 through the Heaven Benchmark 4.0 and noted the peak wattage the whole testbench pulled. This does include our 6 core testbench and water cooling so you can expect slightly lower numbers on a more normal build. So surprisingly the MSI 380 pulled 390 watts at peak load where the PowerColor pulled 379. This was actually less than our overclocked R9 285 even putting the PowerColor down with R9 270X’s and GTX 760’s.
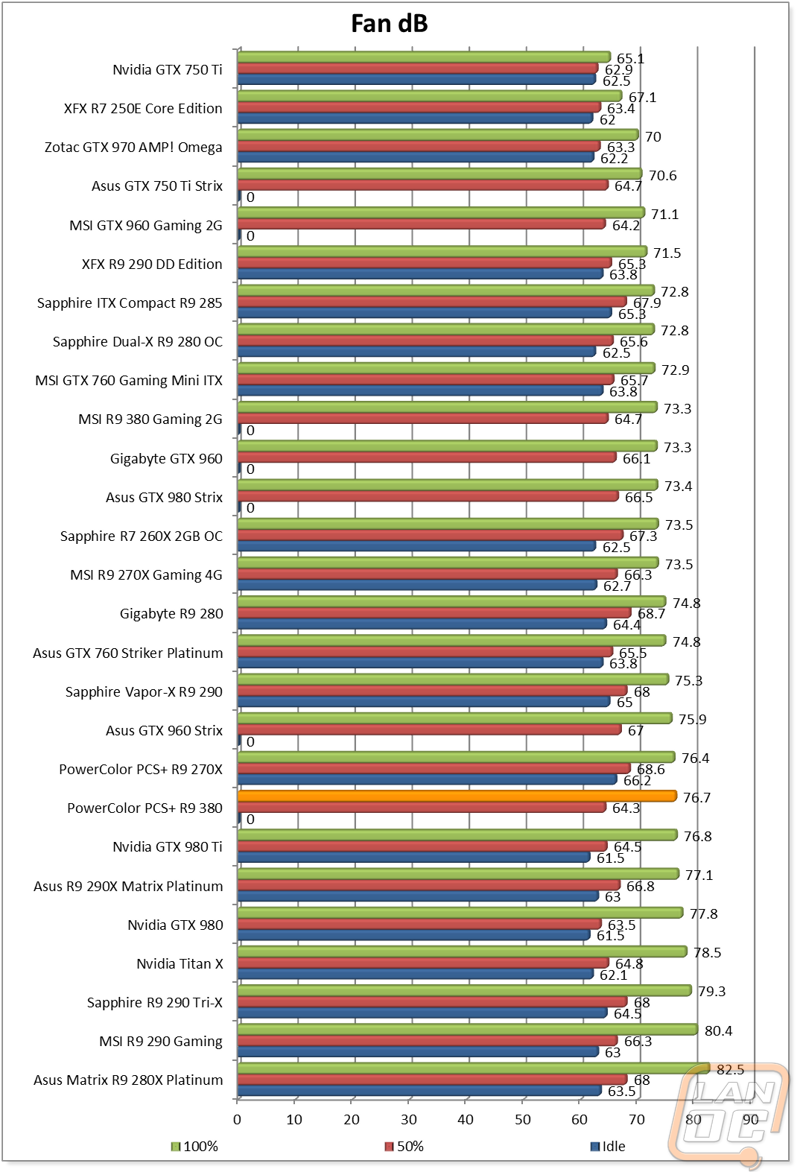
For noise testing I ran through three decibel tests. Once with the fans turned up to 100% for a worse case benchmark, once at 50% for a real world number, and then at idle. Like a lot of the cards recently the PowerColor R9 380 turns off its fans at idle. At 100% fan speed the PowerColor was noisier than the MSI 380 by a little over three decibels putting it up in the top half of the cards we have tested in the past. I’m guessing the smaller fans on the PowerColor have a higher max speed to make up for their size. At the more realistic 50% fan speed test the two cards were very close with the PowerColor actually being quieter.
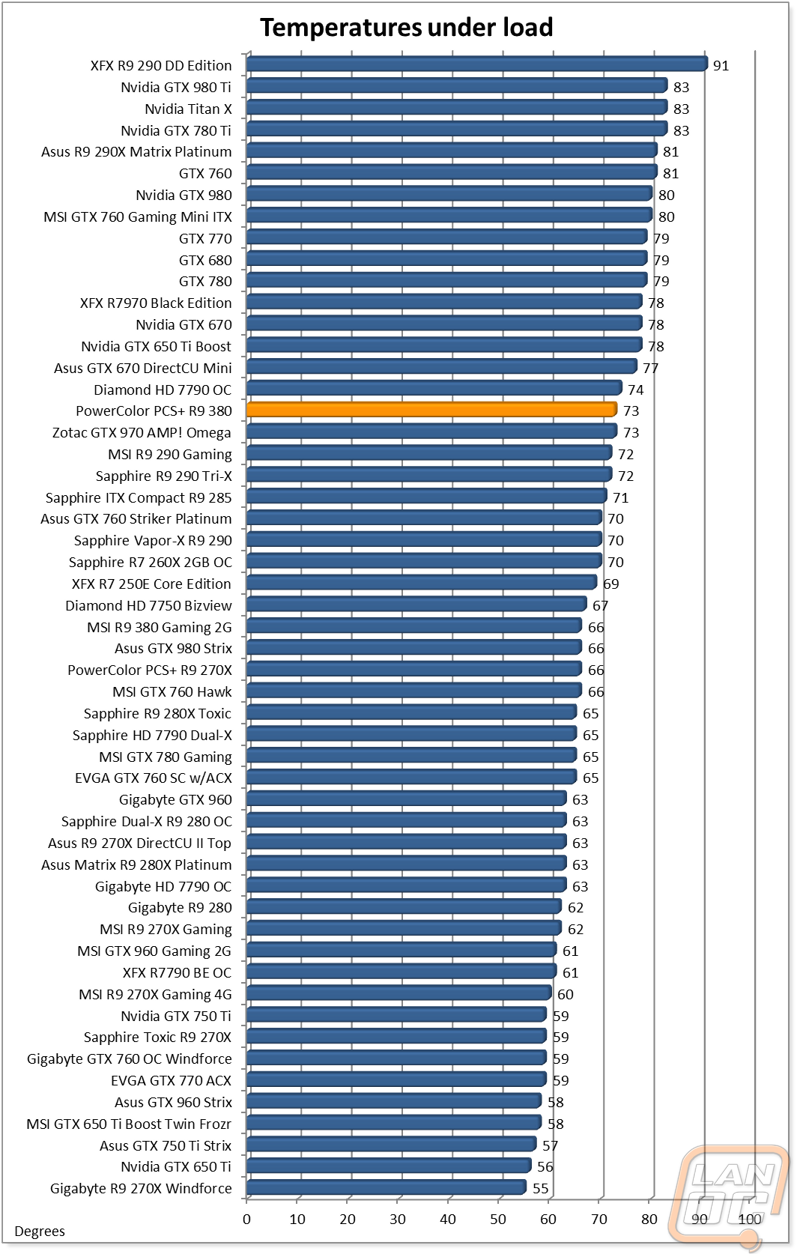
As we saw in the last test if the PowerColor R9 380 is cranked up it can get noisy so it is important for it to be able to control its temperatures without having to reach 100% fan speed. So to test the cooling performance I ran the card in Heaven Benchmark 4.0 again, this time letting it run until the temperatures leveled off. At 73 degrees this card does run noticeably warmer than the average card with aftermarket cooling, in fact it was up close to what the reference cards are running. Given the smaller heatsink and smaller fans I should have seen it coming. If you have a case that would have issues with tall cards this might be the best option still though.
Overclocking
Before finishing up my testing I did want to see just how well the PowerColor PCS+ R9 380 would overclock as well. To do this I broke down the overclocking into three sections, the GPU clock, Memory clock, and then both together. This way I could get my peak overclocks on each and then see if the card could handle them together. Overclocking the GPU clocks went identical with the MSI 380, on both cards I saw 1130MHz. But when it came to memory overclocking I tried to cut out a few of my earlier overclocks knowing how the other 380 performed but I was surprised to run into a wall when testing above 6700MHz. Normally when overclocking memory I will see some artifacts when I push it past its limit or worse case a drive crash. This time around though the PowerColor would actually turn off the PC completely, no artifacts, no drive crash, no bluescreen even. I would be especially careful overclocking the PCS+ R9 380 on the memory side because of this. Not having memory overclocks isn’t really much of a loss anyhow, almost all of the improvements come from a good GPU clock speed bump.
So with my two overclocks I did try to run them together but I had a driver crash. Given the issues with the memory before I went ahead and bumped that down a notch and did the same for the GPU clock. Once I did that I was able to benchmark the card successfully. In the end the MSI overclocked better and saw a slightly higher FPS result as well. The PowerColor overclocked well on the GPU side but there is clearly issues with pushing the memory.
| GPU Clock Speed Overclocking | |||
| GPU Clock Speed | Pass/Fail | FPS Result | Notes |
| 970MHz | Pass | 52.22 | Stock Clock |
| 1050MHz | Pass | 55.61 | |
| 1100MHz | Pass | 57.88 | |
| 1150MHz | Fail | N/A | Driver Crash |
| 1130MHz | Pass | 59.24 | |
| 1140MHz | Fail | N/A | Driver Crash |
| Memory Clock Offset Overclocking | |||
| Memory Clock Speed | Pass/Fail | FPS Result | Notes |
| 5500MHz | Pass | 52.22 | Stock Clock |
| 6500MHz | Pass | 52.53 | |
| 6700MHz | Pass | 52.62 | |
| 6900MHz | Fail | N/A | PC Hard Crashed |
| 6800MHz | Fail | N/A | PC Hard Crashed |
| GPU and Memory Overclocks Together | |||
| GPU Clock Speed | Memory Clock Speed | FPS Result | Notes |
| 1130MHz | 6700MHz | N/A | Driver Crash |
| 1120MHz | 6600MHz | 59.10 | |
Overall and Final Verdict
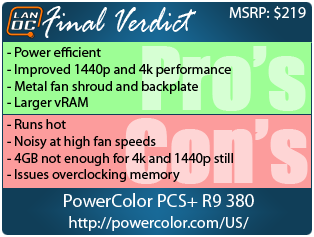
Having already tested one R9 380 I had a good idea of what to expect when going into the PowerColor PCS+ R9 380. What I wasn’t sure about was just what PowerColor was doing different on their 380’s and also how the doubled vRAM would change the cards performance. When it comes to the card, I was happy to see that PowerColor includes a metal backplate and fan shroud. Going with metal over plastic gives the card a more solid feel while I admit that I would prefer to see the backplate be a machined aluminum over a stamped sheet metal. I would love to see PowerColor go with slightly larger fans but only large enough to fit in the space in the current design, I love that this design isn’t obnoxiously large like most cards are these days.
Sadly the smaller size and smaller fans hurt the card when it came to actual performance. It did run on the hot side and the small fans (while quiet at normal speeds) got noisy when turned all the way up. The slightly lower overclock and smaller fans did translate into a more power efficient card than the other R9 380 tested. That combined with the smaller design actually makes it a good candidate for a small LAN rig where power is a concern. In a LAN rig the issues with memory overclocking wouldn’t be a concern as well.
So with this specific model we had an additional 2gigs of vRAM giving us a total of 4GB. How did this effect the overall performance of the card? Well in tests like 3DMark Ultra we saw a huge improvement. This leads me to believe that we would see big improvements in 4k testing in game. Sadly even with the improvements at 1440p the increase still wasn’t enough to really justify an additional cost. Normally I would be all for better performance, but in this case we didn’t see an improvement at the 1080p resolution that the R9 380 is best used at and the improvement at higher resolutions isn’t enough to make them playable in most cases.
So where does that leave us? Well this is one of those weird situations where I would actually recommend that you look at the model below this. PowerColor offers a second 380 that has a 2GB frame buffer. This card has an MSRP of $219 but with the other card you could save $20 and pick u a card for $199. This is less than the MSI that I tested as well making it an even better deal. You are giving up a little on cooling performance compared to the MSI, but you are getting a more compact card with the PowerColor. So this is a good option for people who don’t have the room for the ever growing cards like the MSI.
Live Pricing: HERE
