CPU Performance
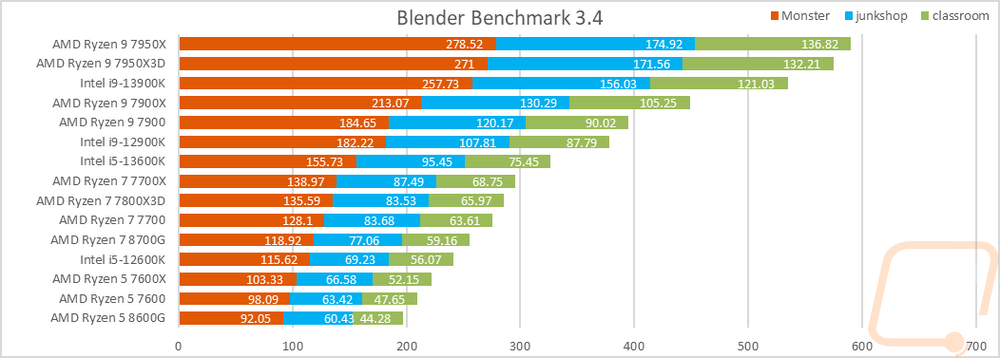
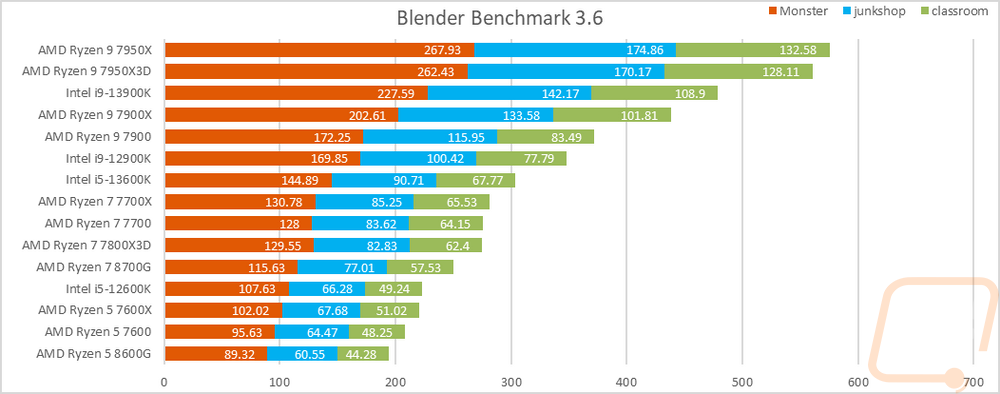
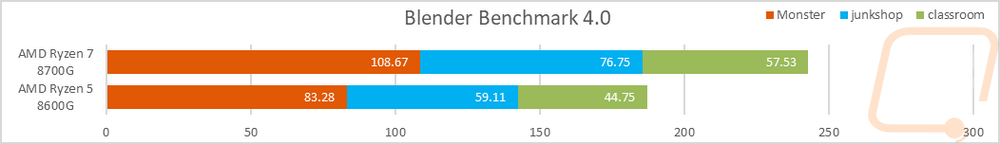
To start testing off I went with a rendering-focused benchmark with the always popular Blender. This software is always updating and with that the benchmark changes as well so I have run with a few versions here simply because with the latest 4.0 version I haven’t had the chance to get more CPUs on the bench to compare against the 8700G and 8600G. I have all three tests stacked together so we can see an overall of them altogether. Blender loves the higher core counts but clock speed does still make a difference. But how did the two new CPUs perform? Well In Belnder 3.4 and 3.6 the combined results put the 8700Gjust under the 7700 and 7700X which is about where I would expect it to be. The 8600G is farther down the chart of course and is at the bottom of the CPUs tested below the Ryzen 5 7600 on both.
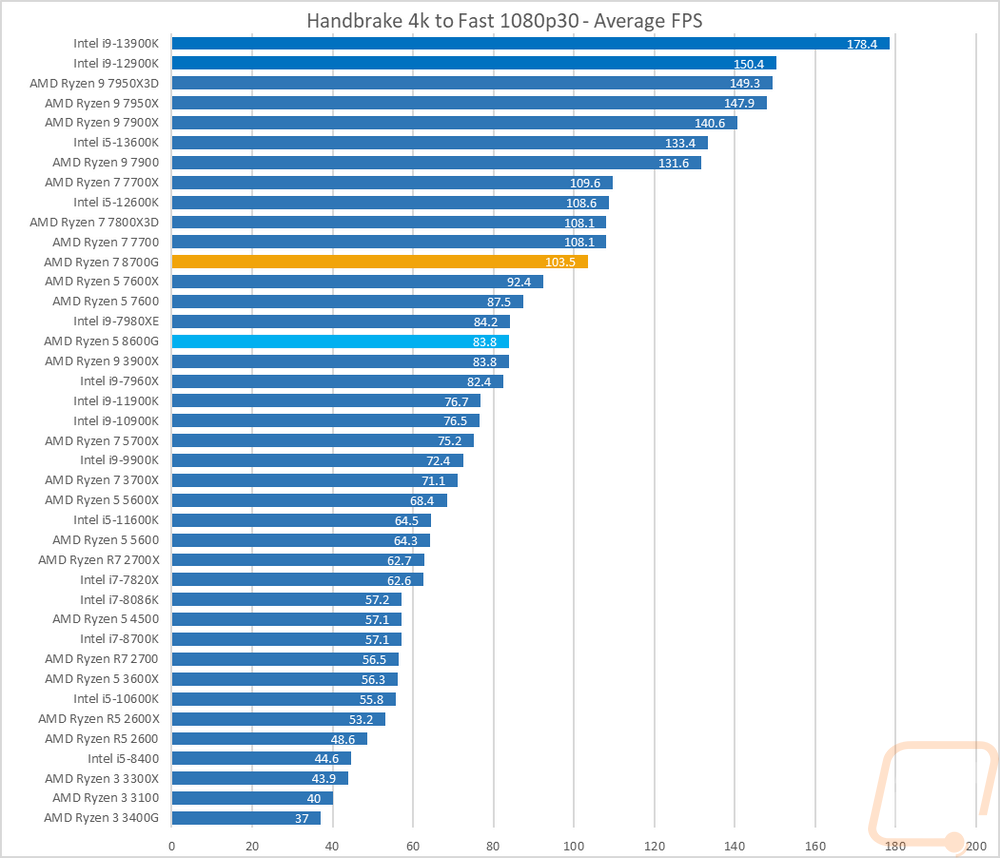
Continuing with the video encoding theme I also have Handbrake which is an open-source transcoder. For this test I am taking a 4k video down to 1080p 30 FPS, the results are the average FPS of that task. The 8700G at 103.5 FPS is right behind the 7700 and the 7800X3D. The 8600G is behind the 7600 as well as behind a few of the old high core count Intel’s from the older enthusiast platform that would run alongside of the Xeon line. This puts it ahead of CPUs like the i9-11900K and 10900K which were monsters when they came out.
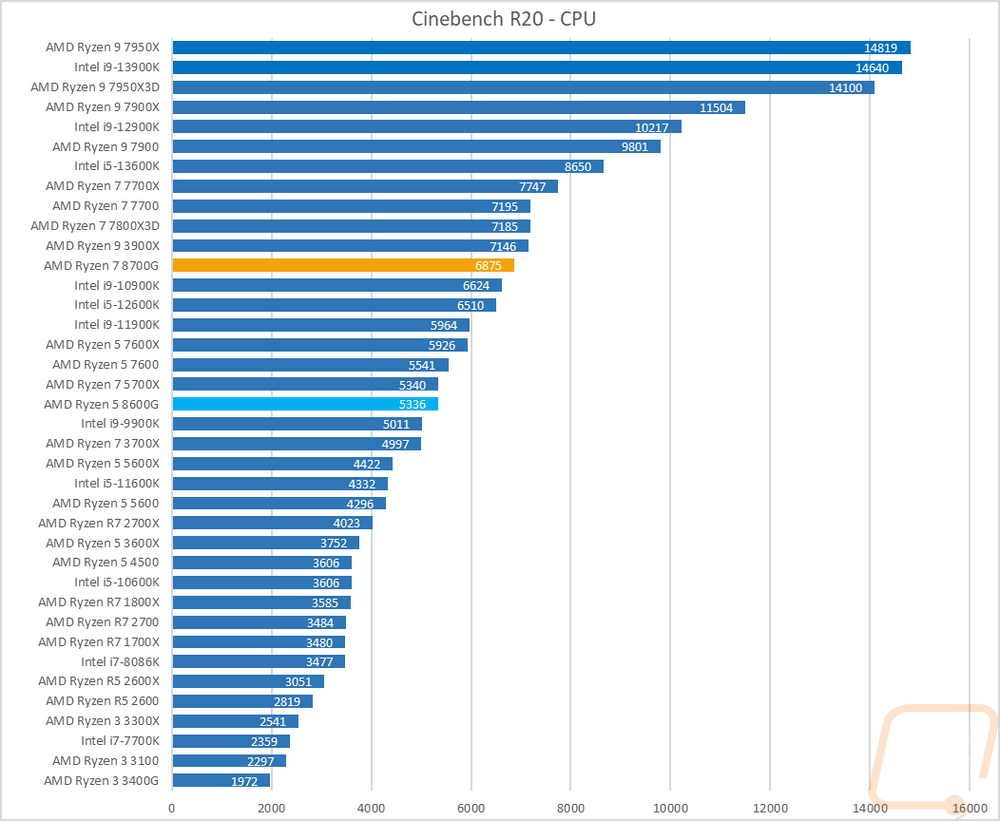
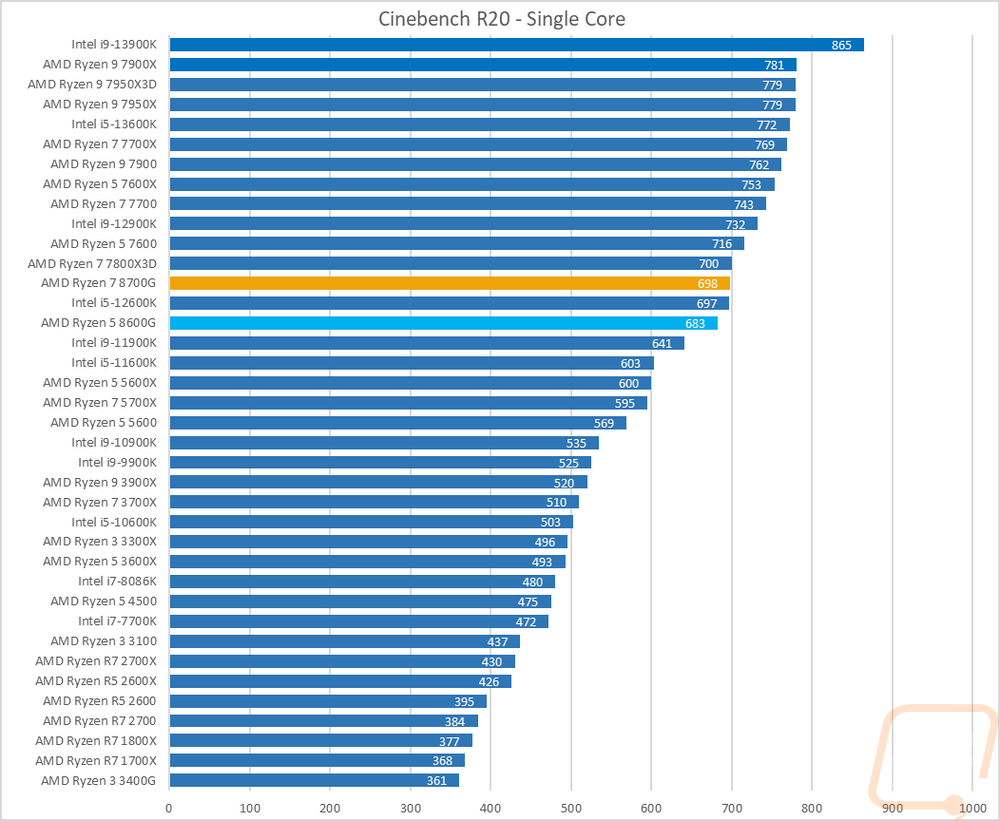
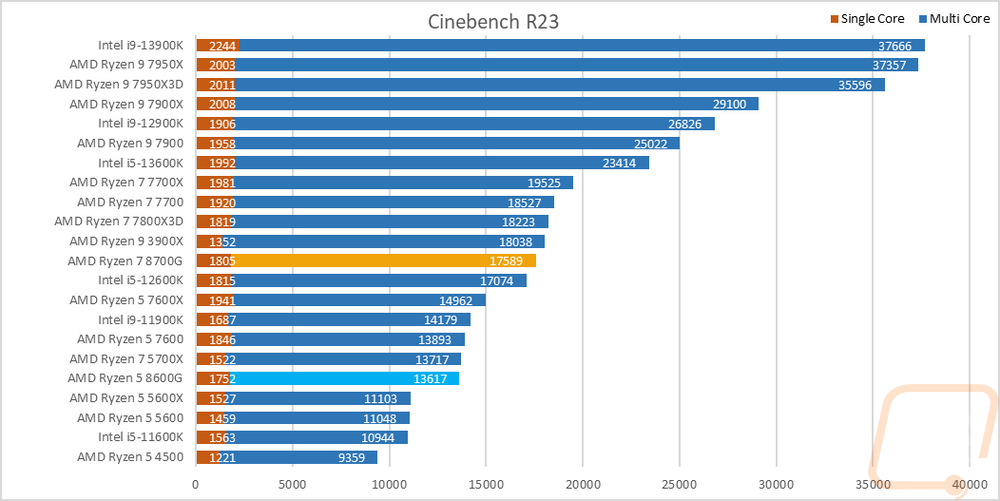
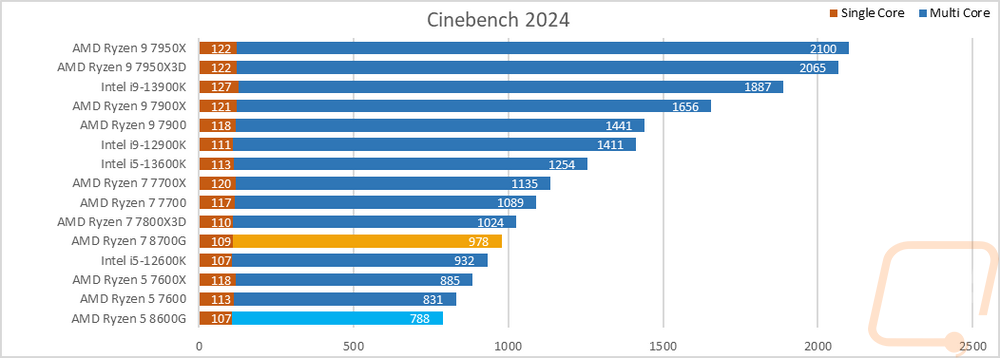
For the always popular Cinebench, I am testing with the older Cinebench R20 and R23 as well as the new 2024 edition as well. I always like Cinebench because we have multi-core and single-core performance which gives us a good look at the performance of the whole CPU and IPC performance. In R20 on the multi-core test, the 8700G is again right behind the Ryzen 7 7700. The 8600G on the other hand is a little farther down with its lower core count but still did well sitting behind the Ryzen 5 7600. For their single core results in R20, they are both up farther in the chart with the 8700G being slightly higher and right with the 7800X3X and the 8600G just behind the 7600. In R23 the 8700G is behind the 7700 on both multicore and single-core tests. The 8600G with its 13617 score is just behind the Ryzen 5 7600. Then in the latest 2024 test, the 8700G scored a 978 which I know I sound like a broken record but put it right behind the 7700 and the 788 for the 8600G put it at the bottom of the chart behind the 7600.
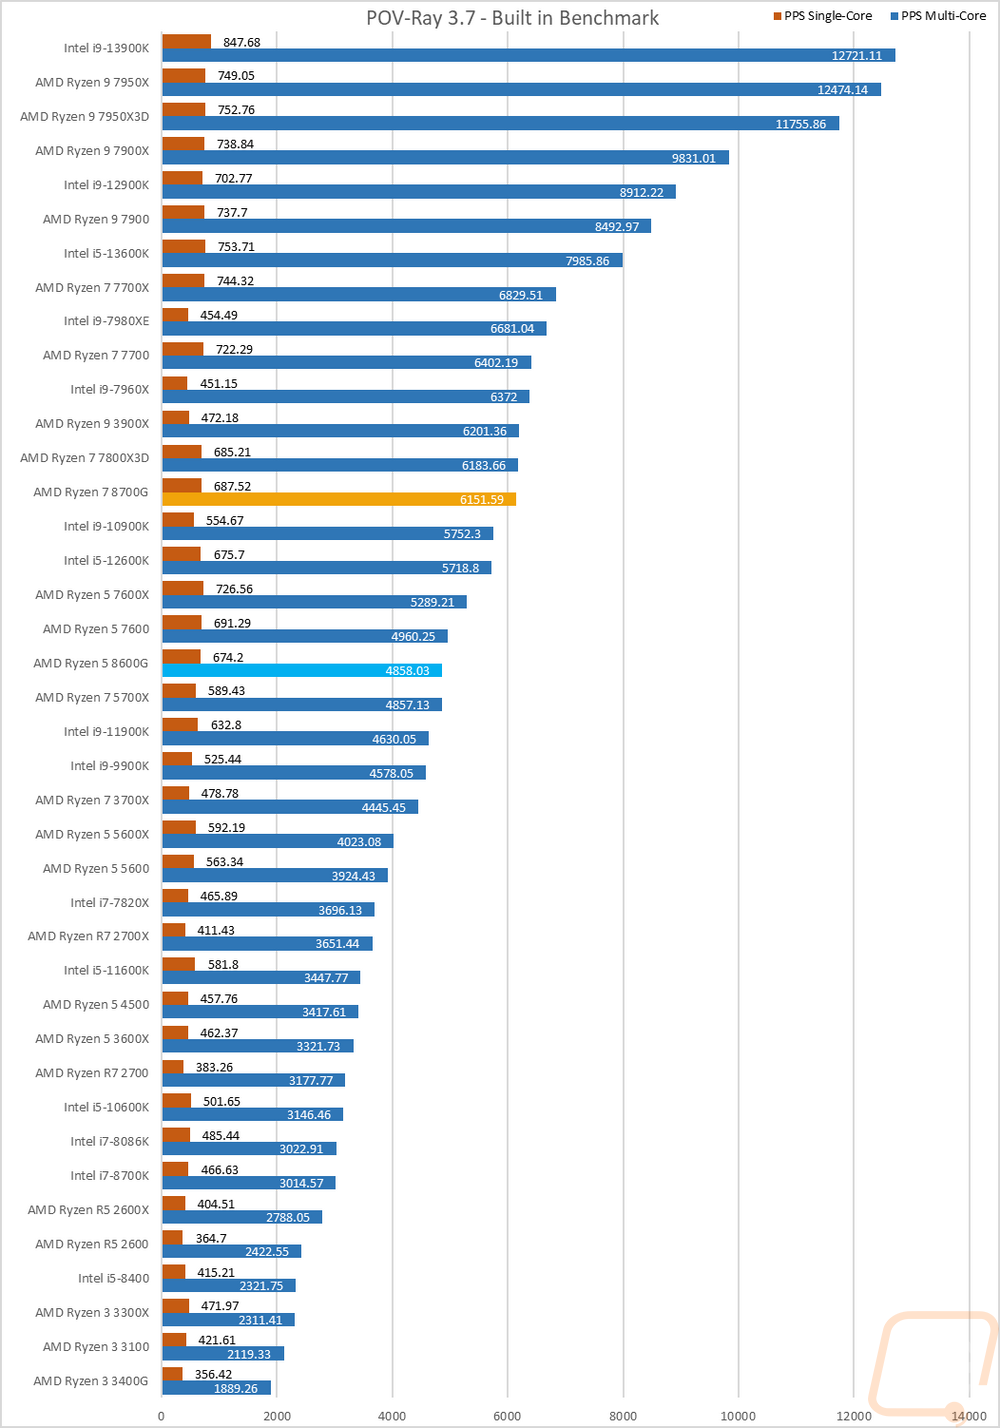
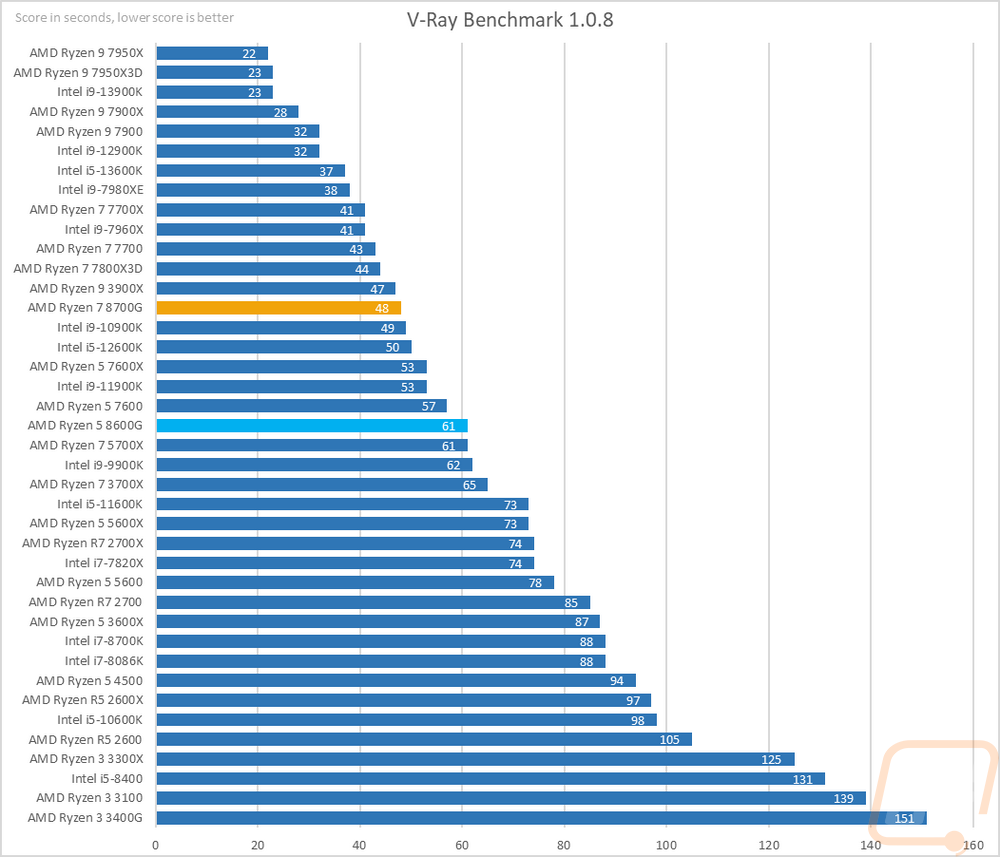
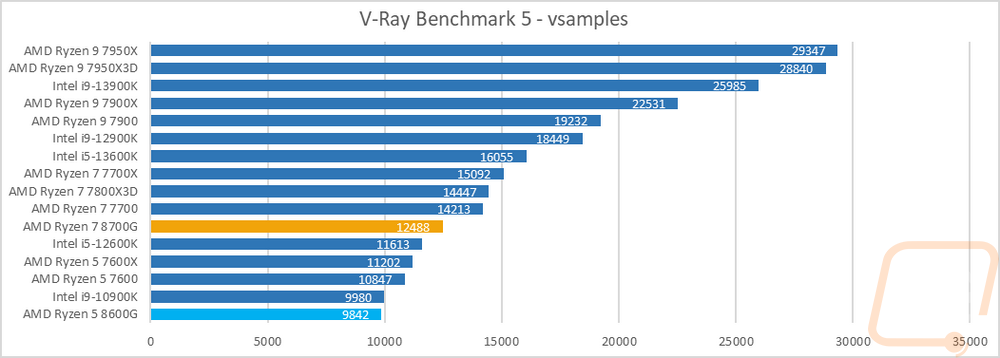
Next up we have ray tracing-focused rendering benchmarks. Here I tested the CPUs in POV-Ray and V-Ray including the newer V-Ray Benchmark 5. POV-Ray was also tested with a single core and across all of the cores. The 8700G scored a 6151 for the multi-core POV-Ray score putting it behind the 7800X3D and similar on its single-core score. The 8600G on the other hand was down farther at 4858 behind the 5700X and the 7600. In the older V-Ray 1.0.8, the 8700G came in at 48 seconds, with the 7800X3D being the closest modern CPU there and the 7700 just ahead of that. The 8600G on the other hand at 61 seconds was tied with the 5700X and just behind the 7600. In the newer V-Ray Benchmark 5, the 8700G scored 12488 which put it behind the 7700 with a big gap between the two, and the 8600G scored a 9842 putting it at the bottom of the chart behind the 10900K.
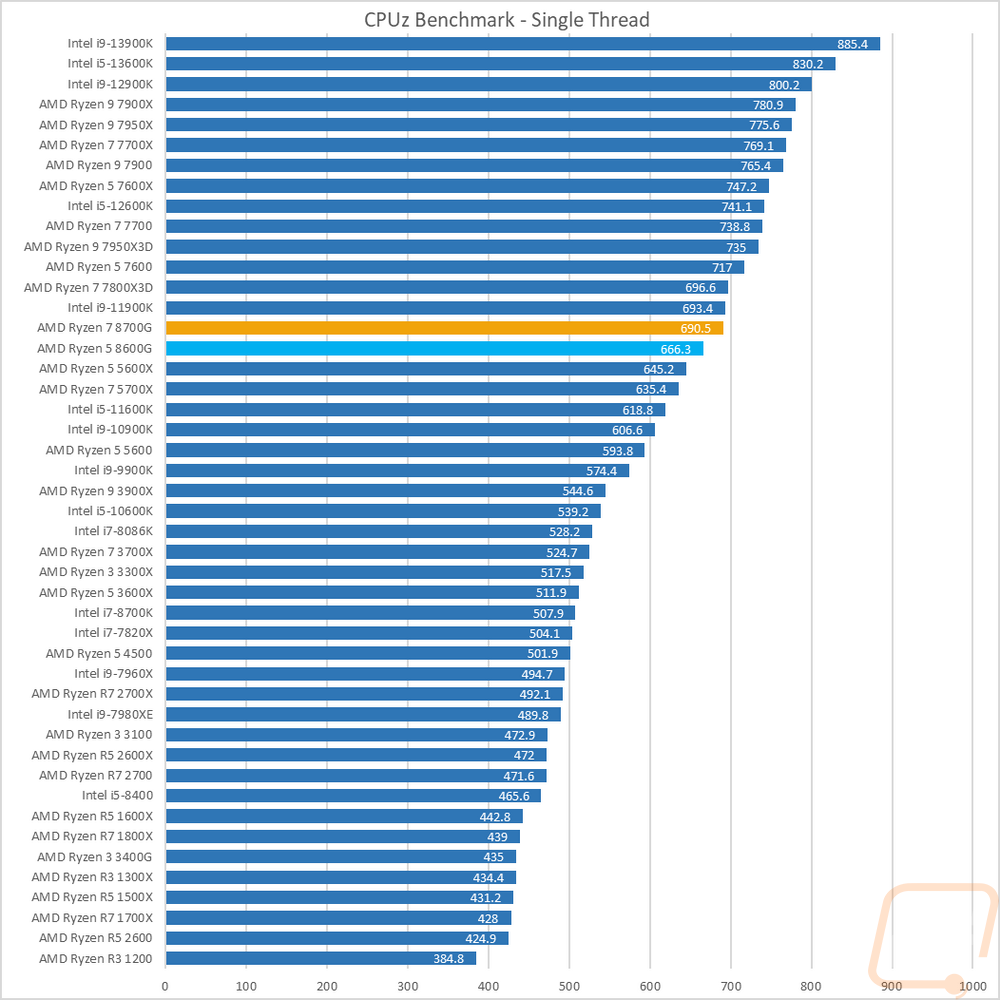
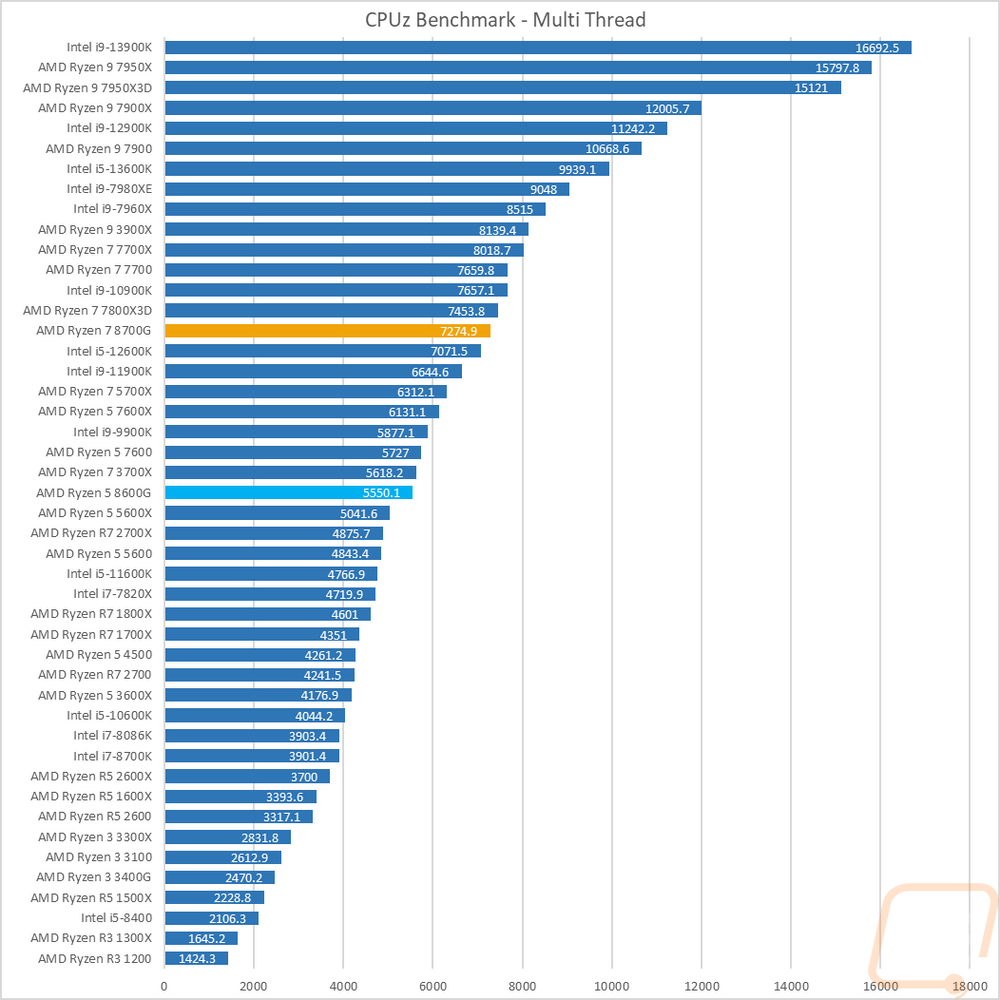
I also tested using the CPUz’s built-in benchmark which does run on a single thread and with all threads. In the multi-thread test, the 8700G scored 7274 putting it right behind the 7800X3D again. The 8600G on the other hand with its 6 cores was lower with a 5550 putting it behind the 5700X and 7600. For single-core results, the 8600Ga and 8700G are a lot closer. The 690.5 for the 8700G is behind the 11900K and not far behind the 7800X3D. The 8600G had a 666.3 which puts it behind the 8700G.
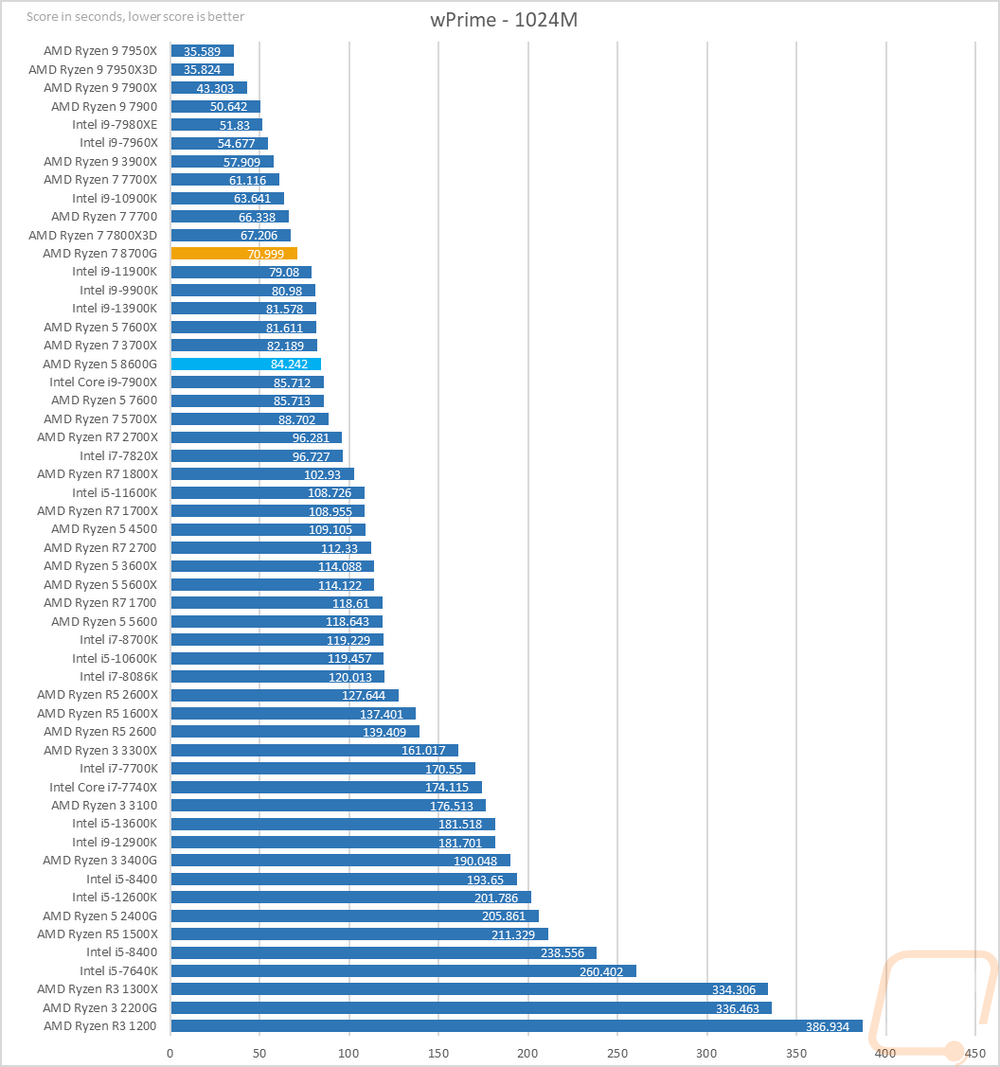
Next, we have wPrime which is a classic overclocking benchmark that calculates pi out to 1024 million digits and is timed. This is a multi-thread heavy test which has the older high-core count CPUs still all over the top of the charts and you can see that with the top CPUs sitting at 8 or more cores. The 8700G with its 8 cores came in with a 70.999 putting it behind the 7700 but ahead of the 11900K. The 8600G took 14 seconds longer with its 84.242 score putting it ahead of the Ryzen 5 7600.
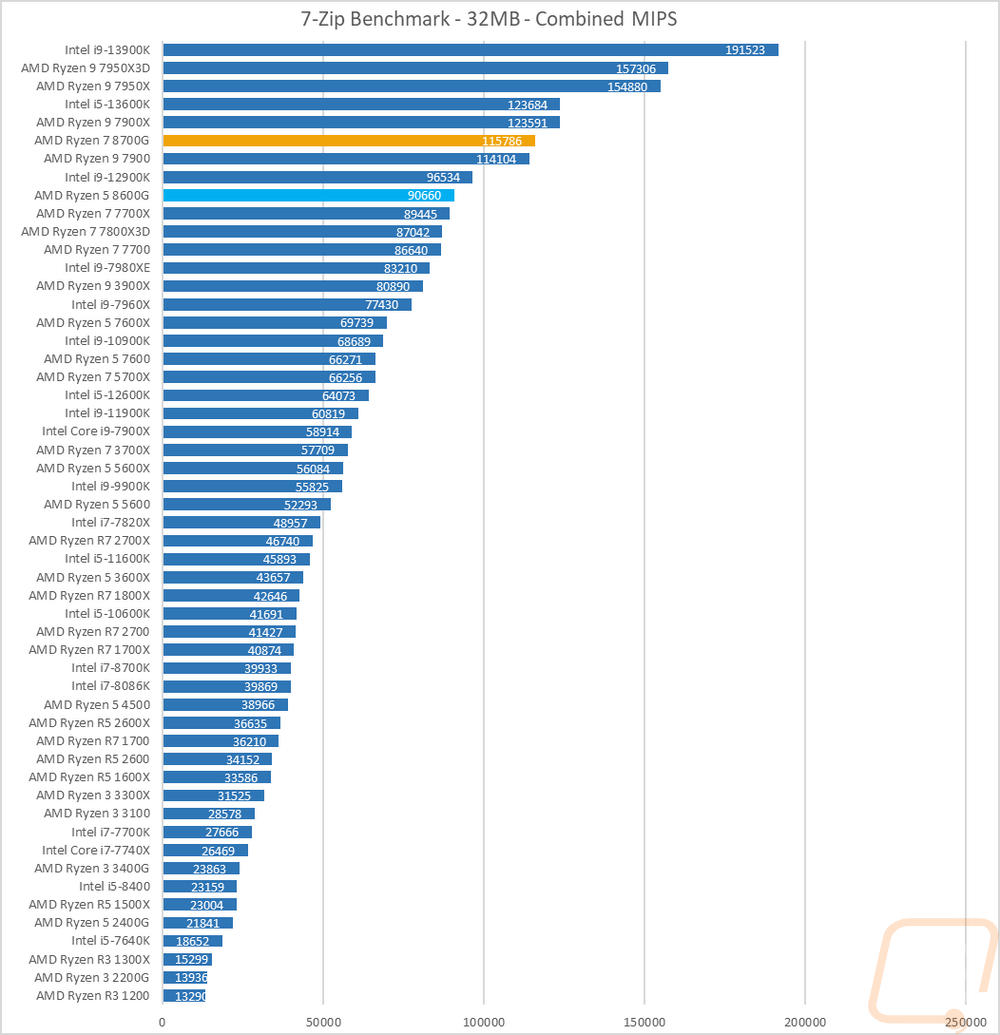
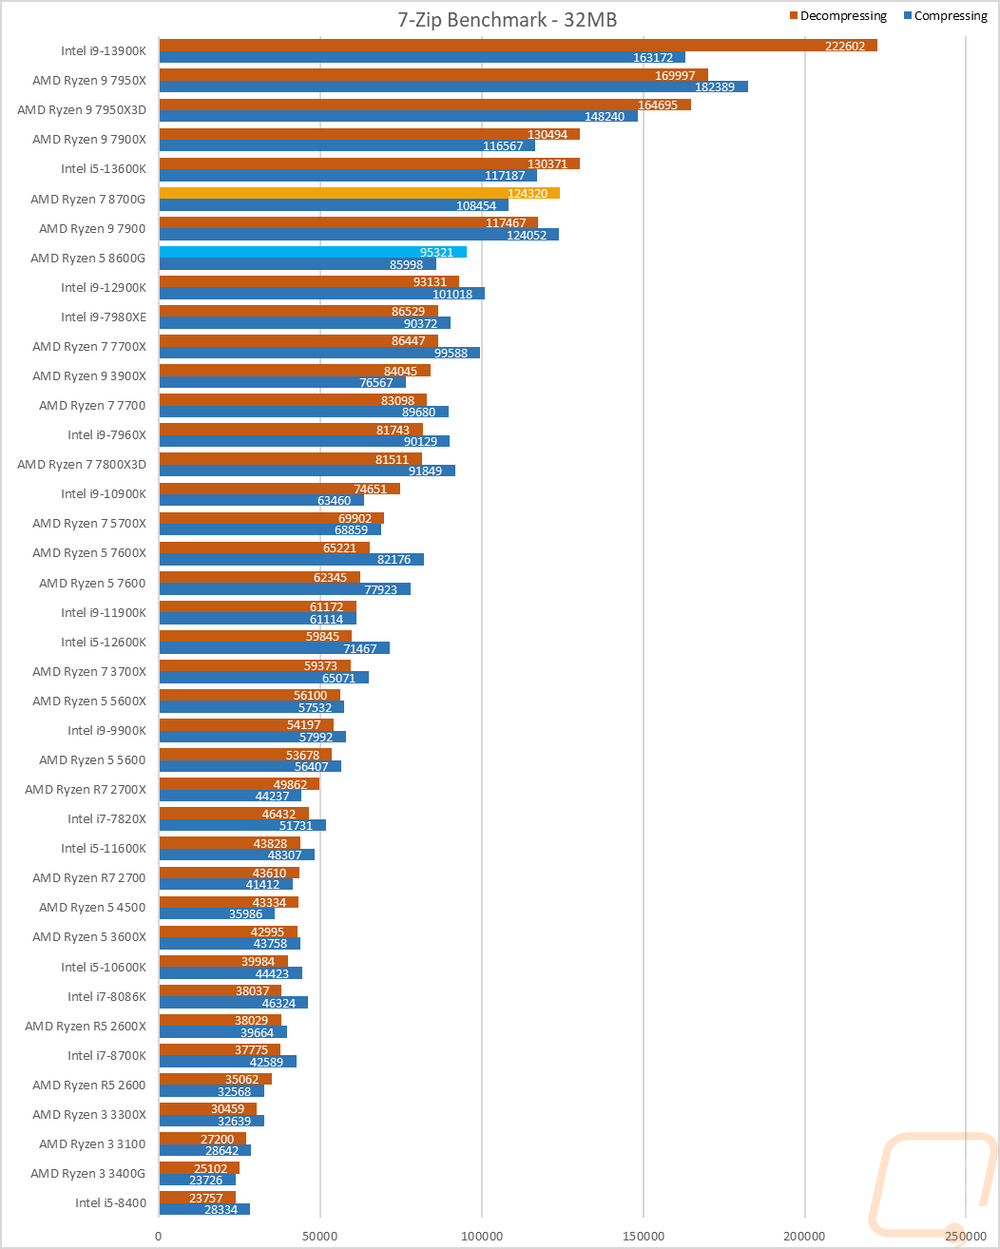
7 Zip is another open-source program, this time for compressing and decompressing all of your files. Here I have run the benchmark and we have three results. The combined MIPS is a combination of compressing and decompressing performance. Then I have it broken down between the two. The combined results have the 8700G with a score of 115786 which was surprisingly good, putting it up ahead of the Ryzen 9 7900 and behind the 13600K. The 8600G also did well with a 90660 putting it ahead of the 7700X. The split results show the same thing and show that both CPUs favored the decompressing test with that ahead on both whereas most CPUs favor the compression test.
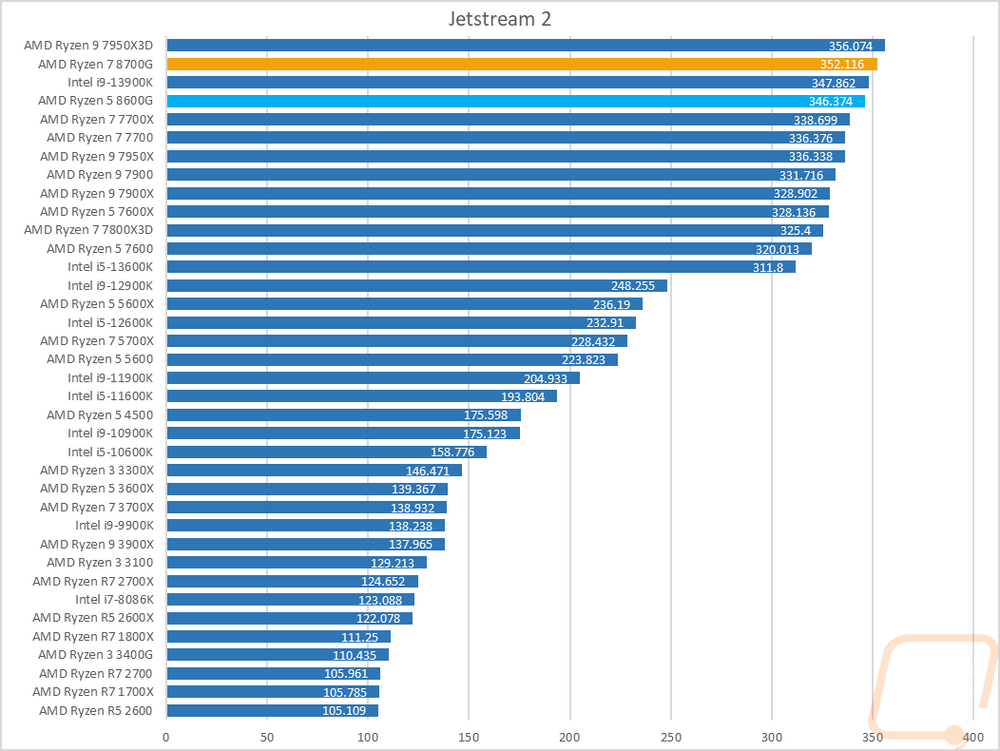
Jetstream 2 is a compilation benchmark that takes a long list of HTML5 and Java in-browser tests and runs them all three times and puts together an overall score. I love this benchmark because let's be honest, most people are using their browser more than any other game or program. Jetstream gives some interesting results sometimes though but it tends to prefer high IPC or single-core performance and there are some situations where it prefers lower core-count CPUs. The 8700G and 8600G are a great example of where this test doesn’t always care about the highest-end CPUs, both scored right up in the top end behind the 7950X3D.
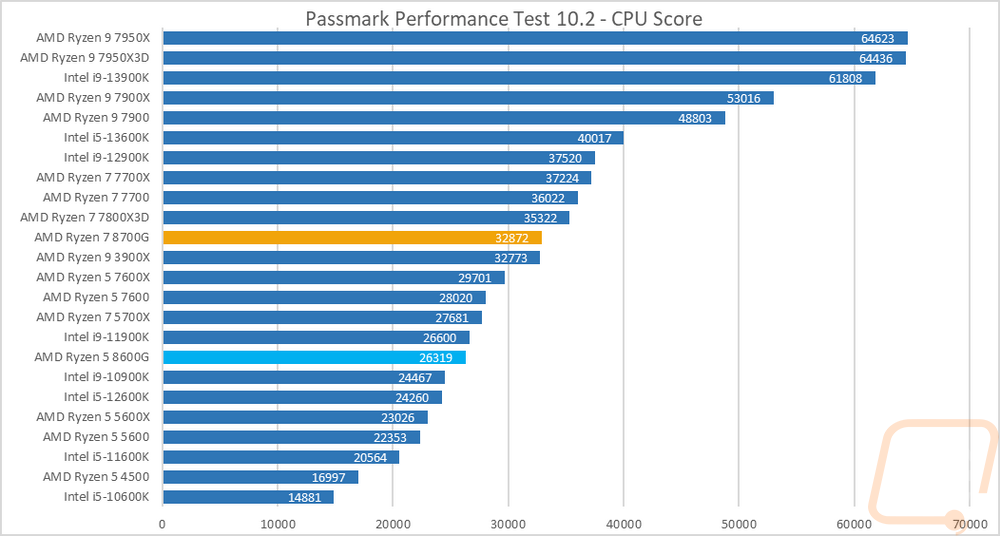
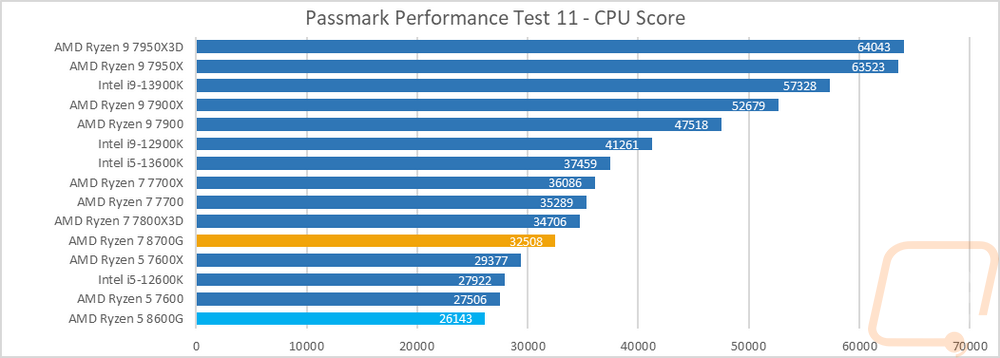
For Passmark Performance Test I used the latest version, Performance Test 11 and also tested with the older Performance Test 10 as well. I only look at the overall CPU score which takes a few different synthetic benchmarks and combines the results to put together an overall score. This is a test that does favor multi-threaded performance over IPC. In Performance Test 10 the 8700G came in behind the 7700, no surprises there, and the 8600G was just behind the 5700X and 7600, again no surprises. In Performance Test 11 the 8700G is just behind the 7800X3D and the 7700. The 8600G is down at the bottom of the chart behind the 7600 and the 12600K.
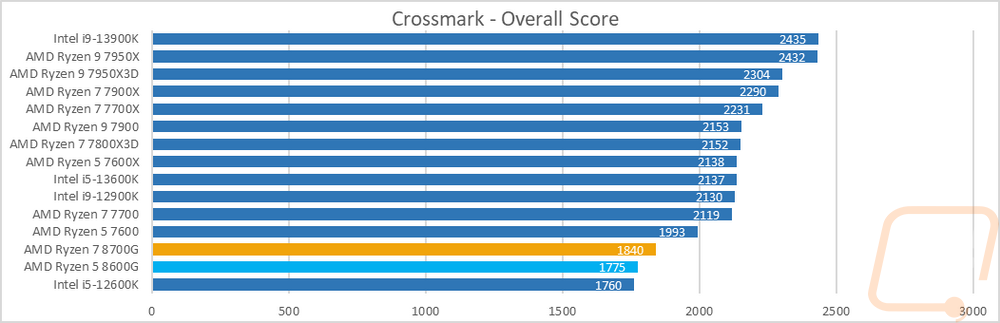
Crossmark is from BAPCo which also makes SYSmark and this is a cross-platform test where you can compare performance between phones and both Windows and Mac computers. This is the start of our overall PC benchmarks and Crossmark uses a mix of real-world tests to output an overall score. The 8700G scored an 1840 which wasn’t as high as I expected it to be. This put it down below the 7600. The 8600G which is normally behind the 7600 wasn’t far behind, putting it ahead of the 12600K but behind the 8700G.
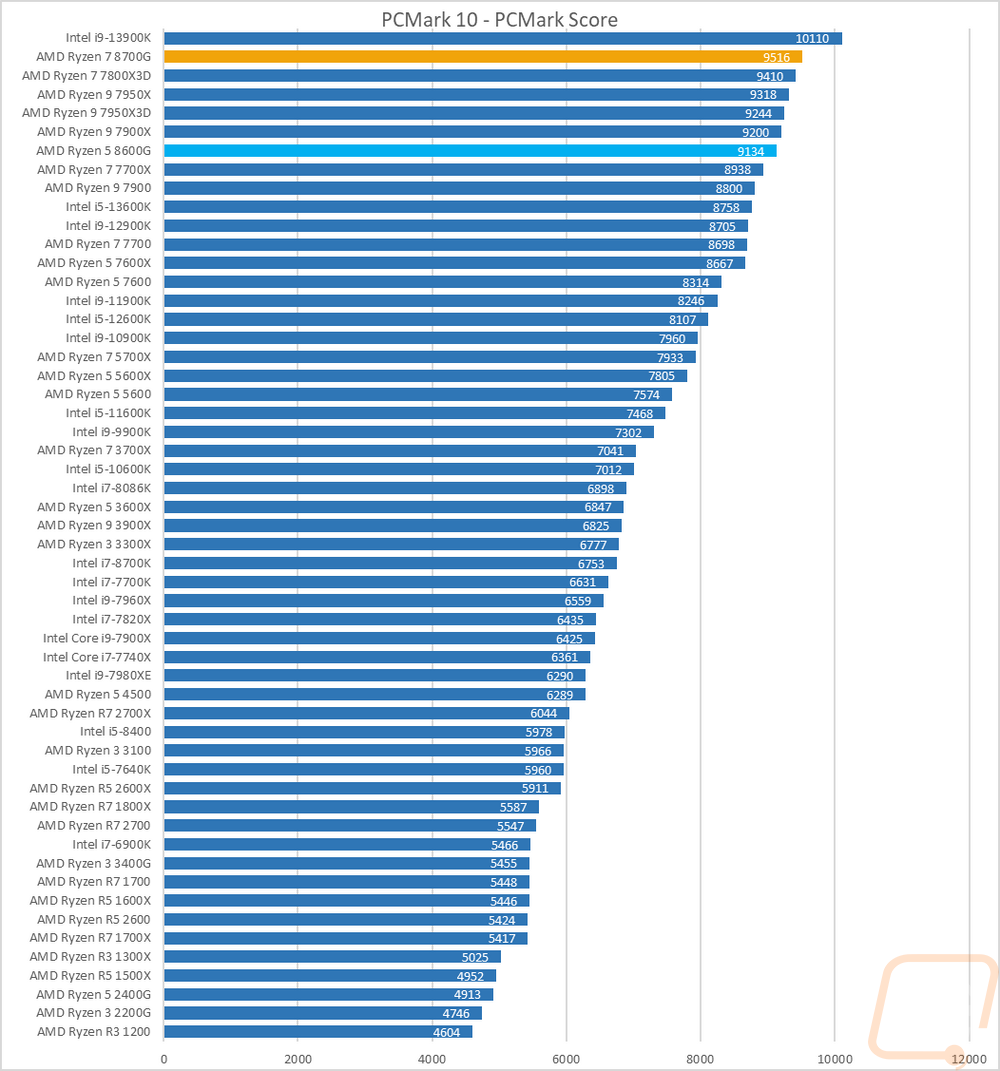
PCMark 10 is a great test because it tests things like video calls, browser performance, Excel, and Word performance to give an idea of real-world performance. It tends to like higher clock speeds but does take raw core count into account as well which you can see. The Ryzen 7 8700G scored a 9516 here which put it right up in the top section of our chart ahead of the 7800X3D and behind the 13900K. The 8600G was down a little lower with its score of 9134 but this is still up in the top group in front of the 7950X even.
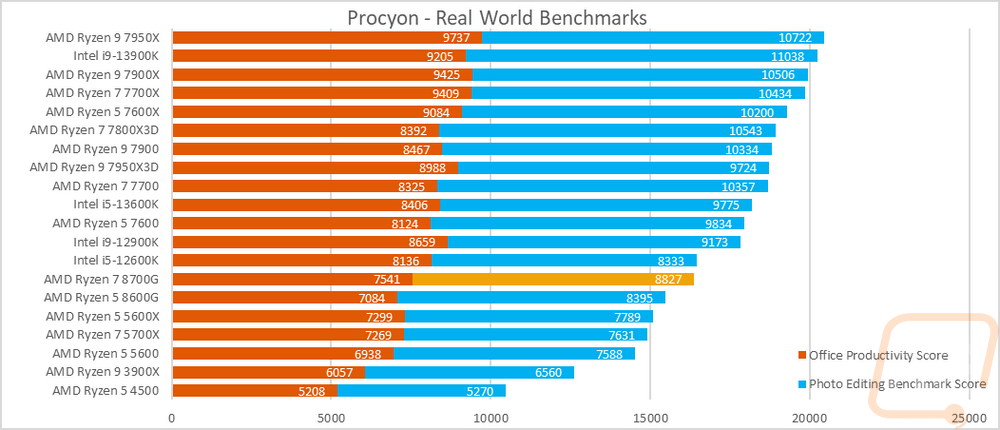
We recently added even more real-world testing with the UL Procyon Benchmarks which are as real-world as they can get using the actual programs that you would use in each test. There are two overall benchmarks, first is the Office Productivity Benchmark which uses Microsoft Office 365 to test actual performance in Word, Excel, PowerPoint, and Outlook. The second benchmark is the Photo Editing Benchmark which is run using the latest version of Photoshop as well as Lightroom Classic to look at photo editing performance. I have both scores stacked together to get an overall look at the performance. The Ryzen 7 8700G has a combined score of 16368 and the 8600G 15479, both are right next to each other here sitting behind the 12600K and ahead of the older 5600X.
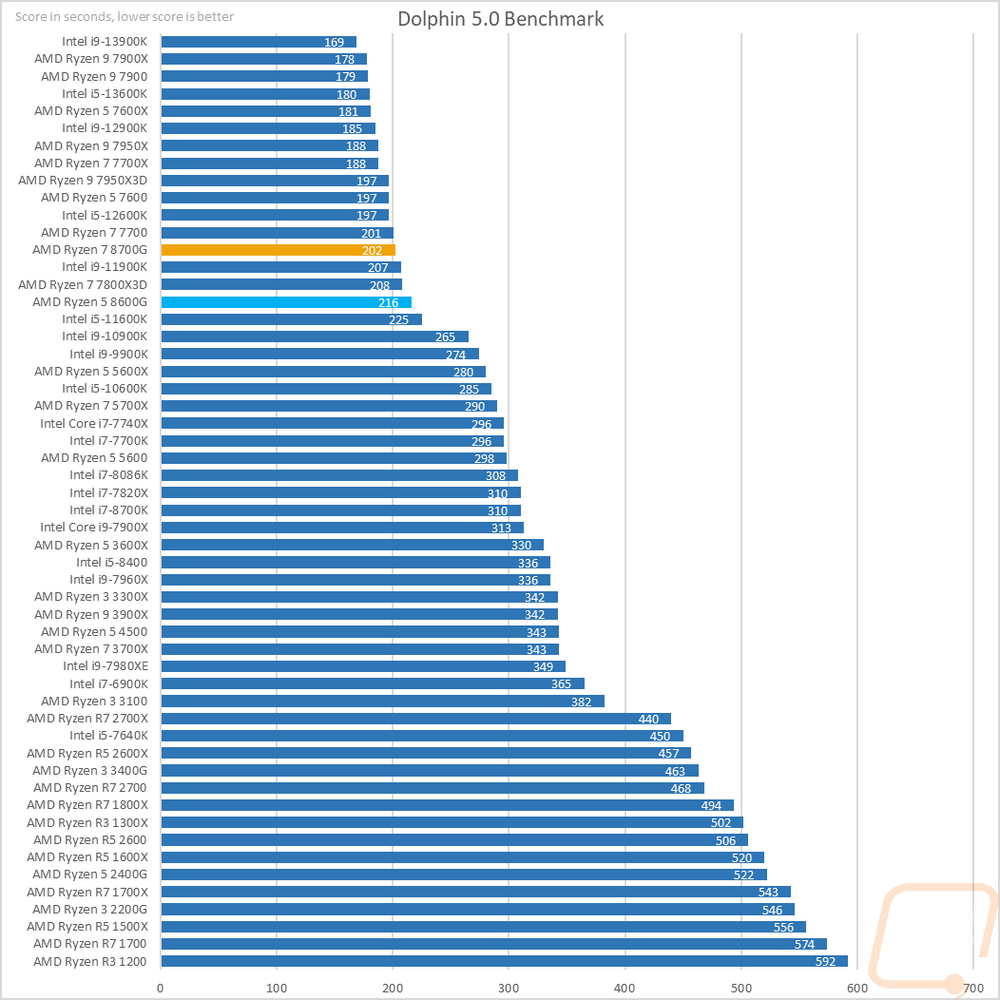
Moving the focus over towards gaming my next test is using Dolphin 5.0 Benchmark. Dolphin 5.0 is a Wii emulator and like most emulators, it doesn’t care about high core counts at all. In fact, it only runs two in total. Clock speeds are king here most of the time which is why all of the 5 GHz+ CPUs are at the top of the chart here. The 8700G took 202 seconds to run the test putting it just behind the 7700. The 8600G took 216 seconds isn’t too far behind the 8700G, at 216 seconds it is behind the 7800X3D.
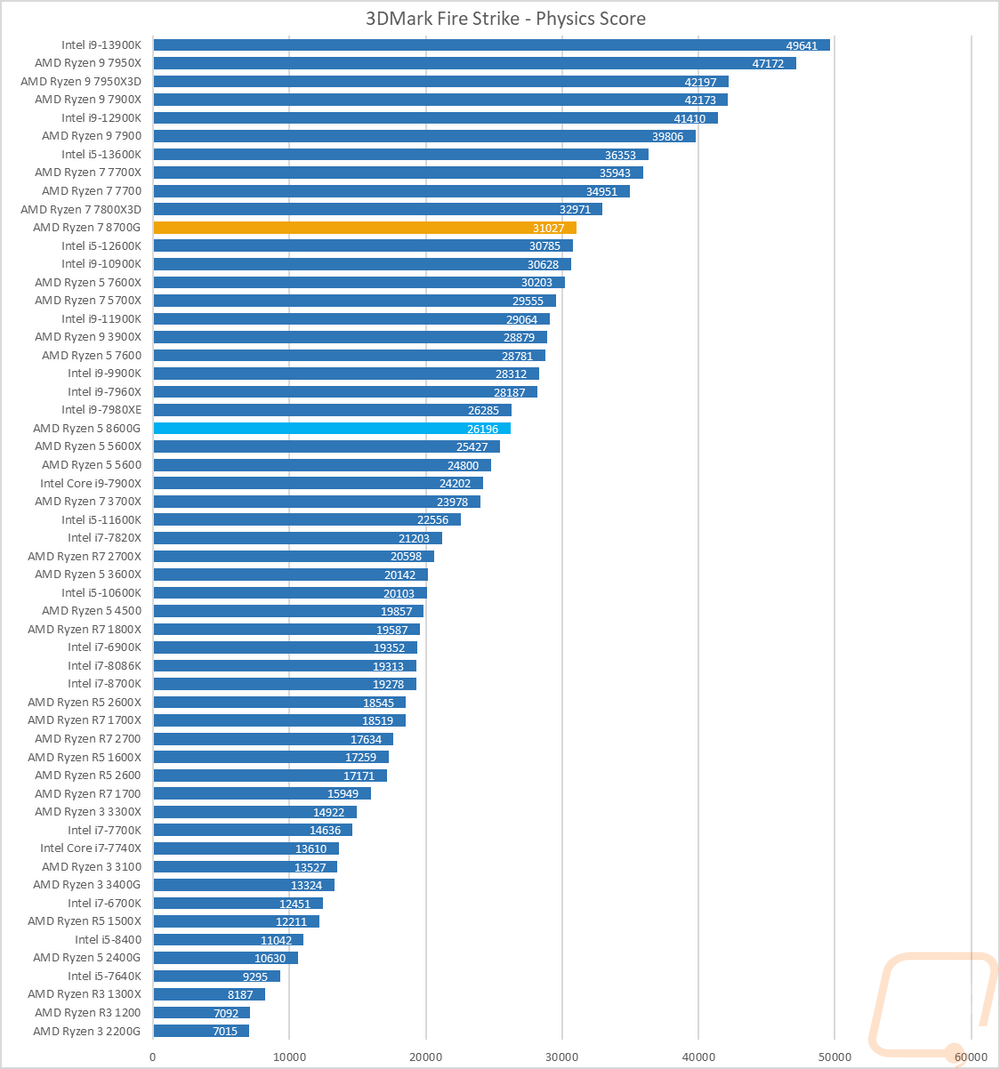
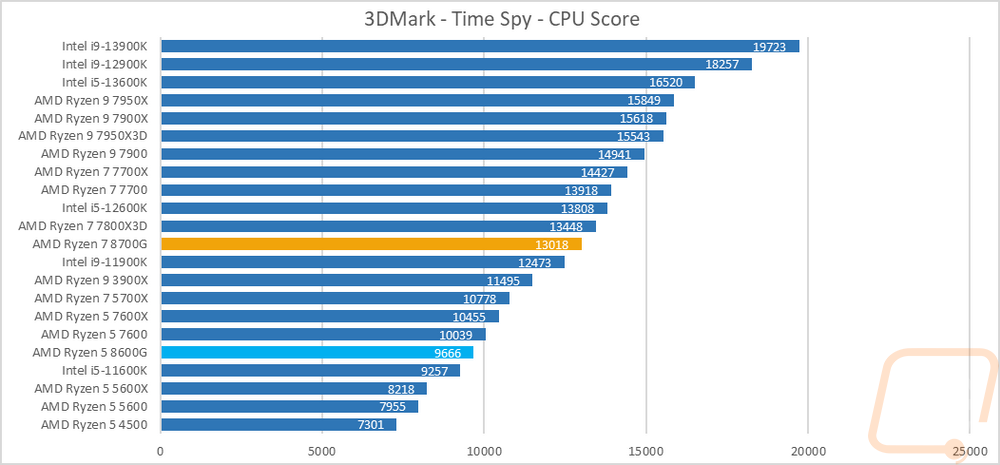
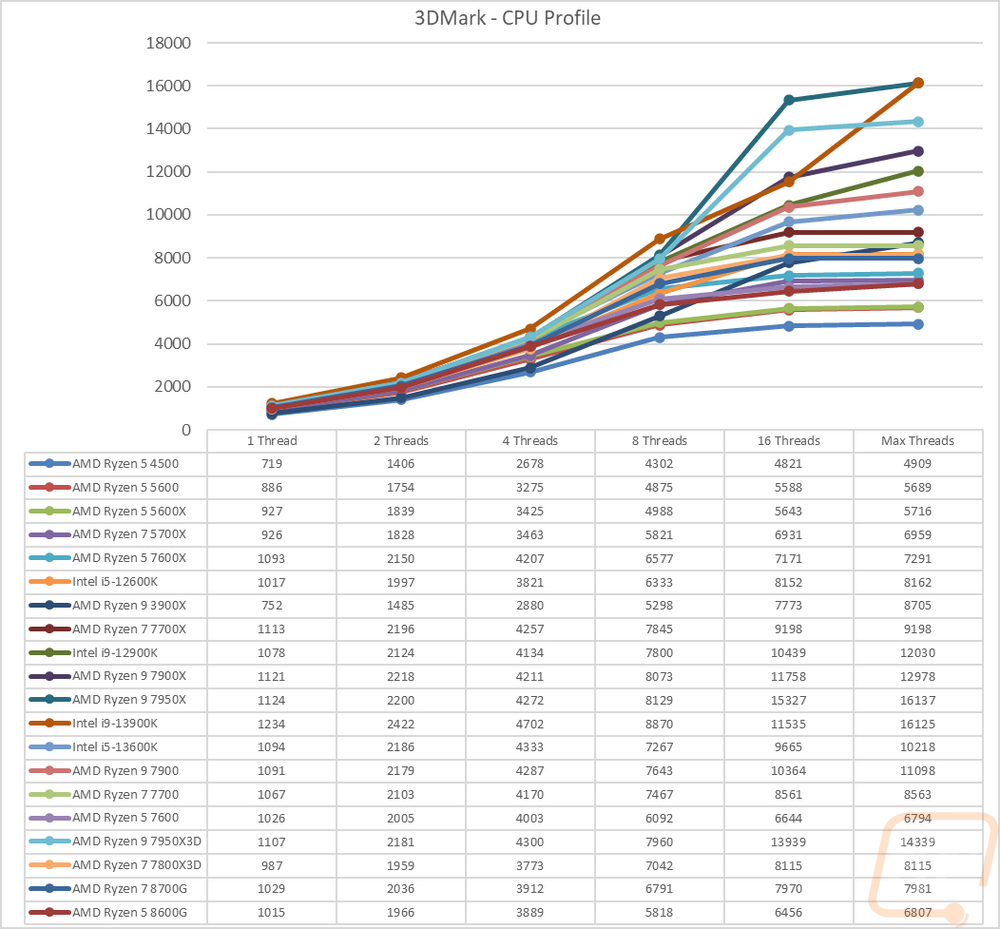
Before diving into game testing I wanted to check out synthetic performance using 3DMark. I tested with the older DX11 Fire Strike test as well as the newer DX12 Time Spy. I also added the new 3DMark CPU Profile benchmark into the mix as well which does a good job of showing the full range of thread counts that you might see being used in games as well as a max threads option that does everything above 16 threads. In the Fire Strike test, the 8700G scored a 31027 in the Fire Strike test putting it behind the 7800X3D which has a big gap between the two. The 8600G is down closer to the middle of the chart sitting ahead of the 5600X and a few CPUs behind the Ryzen 7600. In Time Spy the results are similar but with a smaller gap between the 8700G and the 7800X3D, same with the 8600G and the 7600. In the 3Dmark CPU profile, the 8700G and 8600G hold their own in the early low thread count tests because of their high clock speeds. The 8600G does start to drop off at 8 threads and ends up behind the 7500X in the end. The 8700G does better but ends up behind the 7800X3D once again.
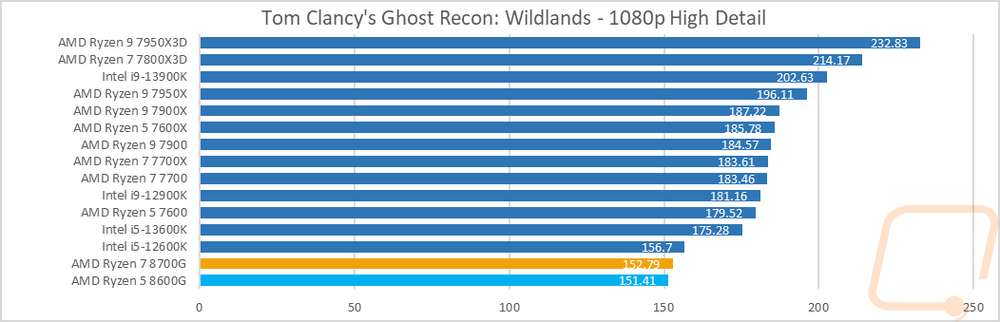
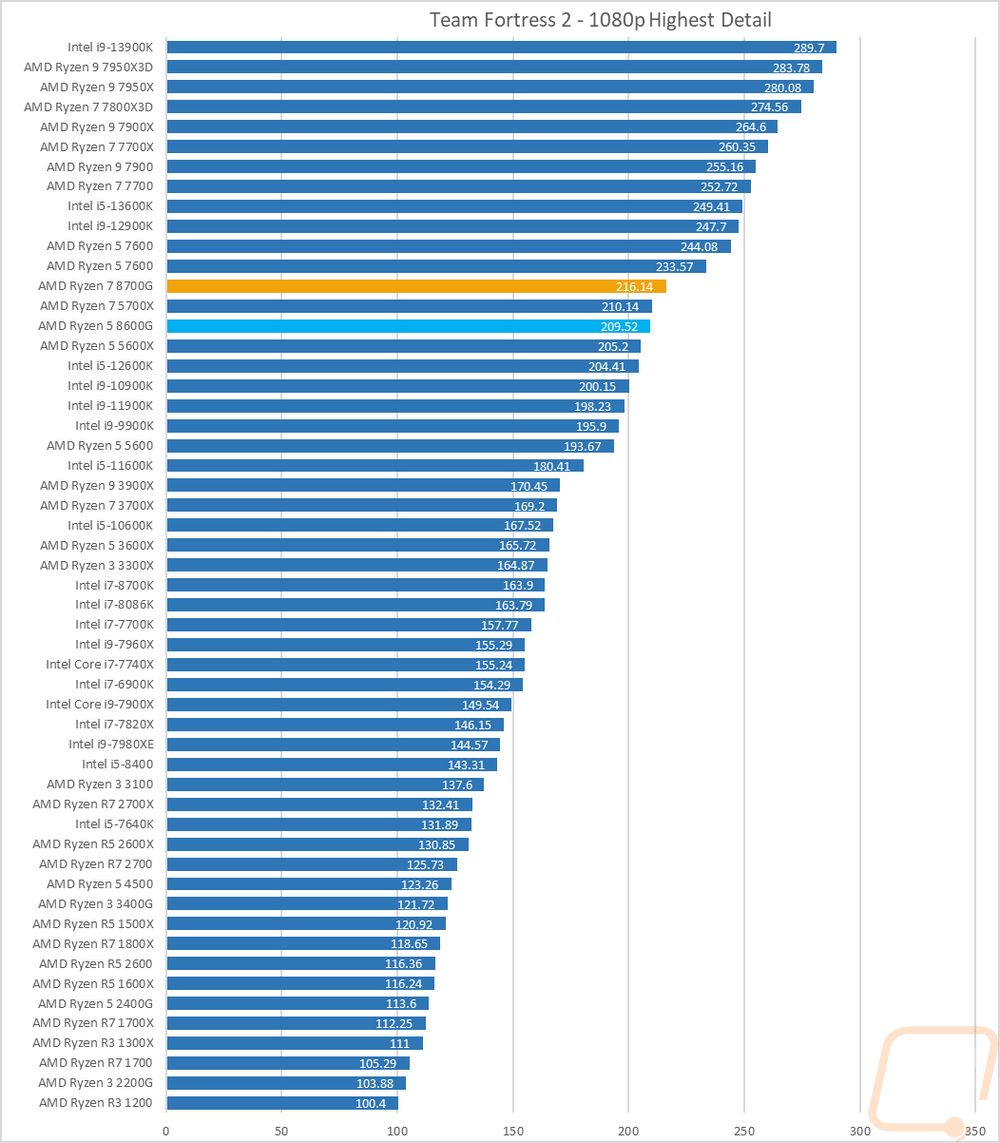
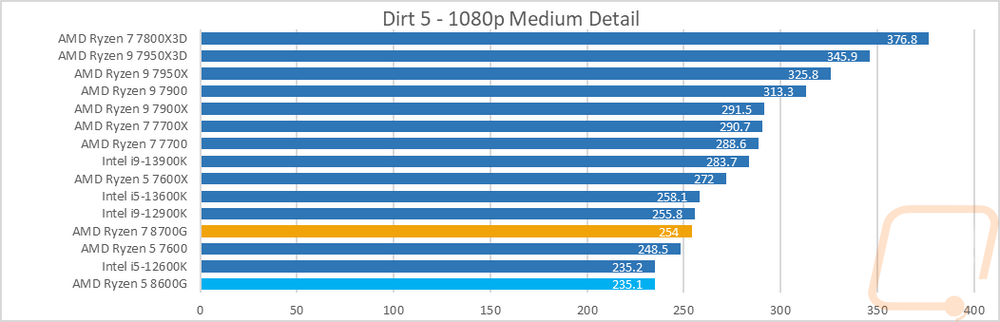
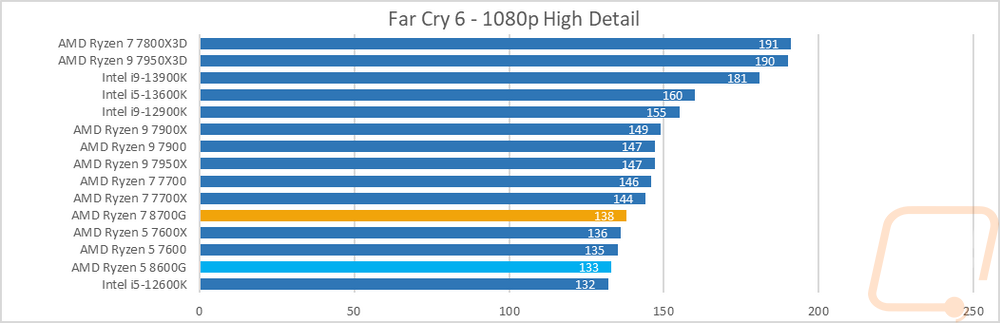
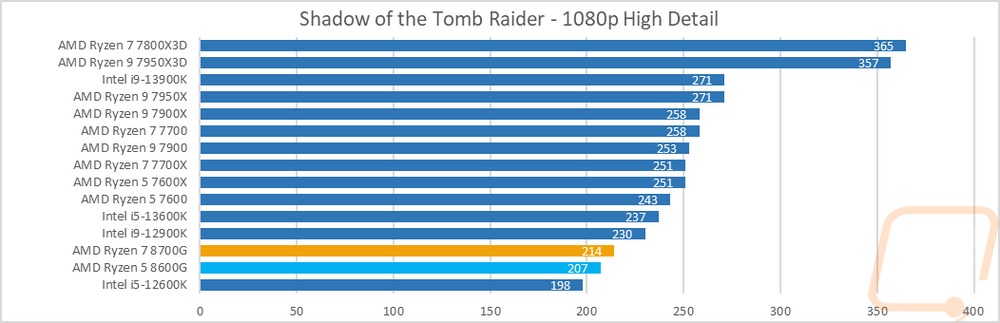
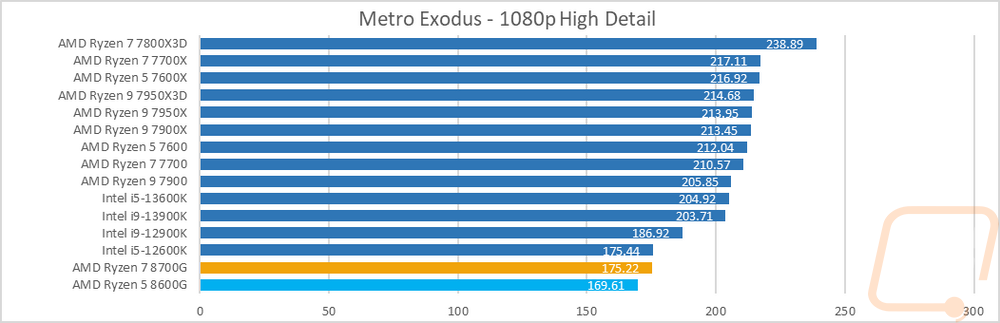
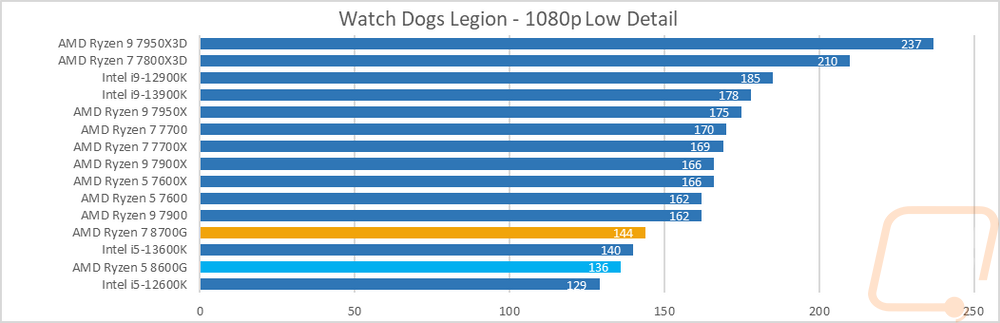
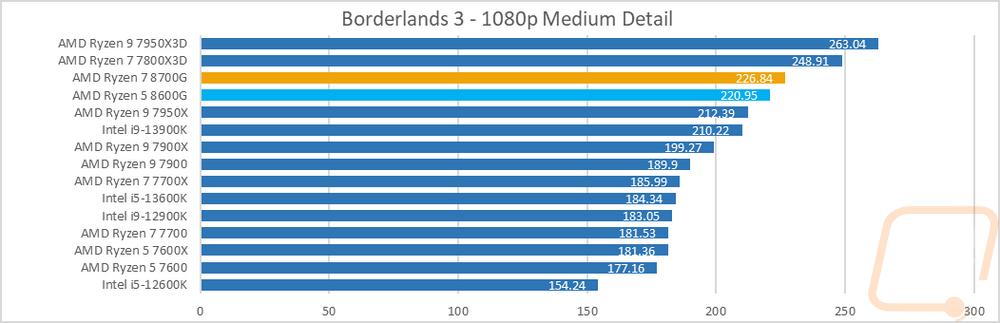
I did of course test the two new CPUs in games as well. I will dive into testing the integrated GPU in the next section. Here though they are paired up with a powerful GPU (the RTX 4090) and I compare CPU to CPU performance. In TF2 where we have a lot of CPUs tested, the game is CPU limited so the difference between the CPUs is a little more obvious. The 8700G came in at 216 FPS sitting behind the Ryzen 5 7600. The 8600G is just 7 FPS below that and sits between the older 5700X and 5600X there. When we get into some of the other games the 8600G is done at the bottom or near the bottom in a lot of the games trading places with the 12600K often. The 8700G did better but is still in the bottom half in most of the games except for Borderlands 3.
Last up I also run a few tests in AIDA64, these take a look at cache performance for L1, L2, and L3 cache as well as memory speeds, Precision FLOPS, and Integer IOPS. With the larger cache size, the Ryzen 7 8700G performed a lot better in the cache tests than the Ryzen 5 8600G did. The 6400 MHz G.Skill memory used helped in the memory speed tests as well whereas the other AM5 Ryzen CPUs were all tested with 6000 MHz memory.
|
AIDA64 |
L1 Cache Read |
L1 Cache Write |
L1 Cache Latency |
L2 Cache Read |
L2 Cache Write |
L2 Cache Latency |
L3 Cache Read |
L3 Cache Write |
L3 Cache Latency |
|
|
GB/s |
GB/s |
ns |
GB/s |
GB/s |
ns |
GB/s |
GB/s |
ns |
|
AMD Ryzen R7 2700X |
999.43 |
502.5 |
1 |
978.03 |
495.12 |
2.8 |
414.95 |
417.71 |
8.8 |
|
AMD Ryzen R5 2600X |
768.13 |
388.05 |
1 |
729.37 |
366.01 |
2.9 |
429.09 |
323.83 |
9.1 |
|
Ryzen 5 2400G |
485.01 |
238.29 |
1 |
459.8 |
232.2 |
3.1 |
222.96 |
181.6 |
9.6 |
|
Ryzen 3 2200G |
460.55 |
227.41 |
1.1 |
352.84 |
177.56 |
3.3 |
137.3 |
171.2 |
10.2 |
|
Intel i7-8700K |
1595.6 |
803.65 |
0.9 |
640.37 |
397.14 |
2.6 |
337 |
213.67 |
11 |
|
Intel i5-8400 |
1417.2 |
710.79 |
1 |
543.81 |
352.9 |
3.1 |
270.89 |
186.82 |
13 |
|
Intel Core i9-7980XE |
3758.3 |
1896.7 |
1.1 |
1671.7 |
1069.9 |
5.6 |
229.61 |
118.4 |
21 |
|
Intel Core i9-7960X |
3532.3 |
1785.2 |
1 |
1571.6 |
1003.5 |
5.1 |
220.22 |
121.04 |
19.8 |
|
Intel Core i7-7820X |
1969.9 |
995.02 |
1 |
884.63 |
574.74 |
5.6 |
114.4 |
103.57 |
19.2 |
|
Intel Core i5-7640X |
1044.8 |
31888 |
1 |
397.26 |
247 |
2.9 |
228.31 |
163.86 |
11.1 |
|
Intel Core i9-7900X |
2418.5 |
709.16 |
1 |
1037.3 |
521.94 |
5.2 |
124.16 |
106.78 |
21.2 |
|
Intel Core i7-7740X |
1102.7 |
561.25 |
0.9 |
424.55 |
304.3 |
2.7 |
287.01 |
186.67 |
21.2 |
|
Intel i7-6900K |
1963.9 |
999.59 |
1 |
710.28 |
310.34 |
4.1 |
243.96 |
195.41 |
14.6 |
|
Intel i7-7700K |
1114.6 |
560.82 |
0.9 |
415.45 |
285.97 |
2.7 |
234.5 |
188.7 |
10.4 |
|
Intel i7-5960X |
1748.5 |
874.6 |
1.2 |
623.08 |
272.77 |
3.5 |
260.72 |
184.92 |
15.3 |
|
AMD Ryzen R7 1800X |
917.46 |
460.16 |
1.1 |
831.95 |
446.37 |
4.7 |
388.18 |
386.01 |
12.4 |
|
AMD Ryzen R7 1700X |
867.89 |
435.33 |
1.2 |
809.29 |
419.38 |
5 |
369.75 |
350.31 |
12.9 |
|
AMD Ryzen R7 1700 |
793.9 |
398.12 |
1.3 |
742.92 |
389.73 |
5.4 |
334.36 |
332.12 |
14.2 |
|
AMD Ryzen R5 1600X |
689.47 |
345.95 |
1.1 |
630.99 |
334.93 |
4.7 |
386.48 |
326.86 |
12.3 |
|
AMD Ryzen R5 1500X |
446.84 |
224.01 |
1.1 |
306.82 |
211.58 |
11.8 |
306.82 |
211.58 |
11.8 |
|
AMD Ryzen R5 2600 |
685.38 |
344.05 |
1 |
669.28 |
333.5 |
3.1 |
381.16 |
320.56 |
9.8 |
|
AMD Ryzen R7 2700X |
849.91 |
426.09 |
1 |
837.76 |
418.75 |
3 |
357.51 |
356.71 |
9.4 |
|
Intel i7-8086K |
1596.4 |
803.56 |
0.9 |
623.36 |
423.53 |
2.6 |
380.04 |
243.73 |
10.9 |
|
Intel i9-9900K |
2375.6 |
1195.4 |
0.8 |
907.65 |
626.34 |
2.4 |
302.01 |
221.1 |
11 |
|
AMD Ryzen 9 3900X |
3098.6 |
1551.4 |
0.9 |
1545.3 |
1416.8 |
2.8 |
1014.4 |
836.39 |
11.5 |
|
AMD Ryzen 7 3700X |
2133.2 |
1072.9 |
0.9 |
1069.1 |
993.49 |
2.8 |
611.53 |
573.21 |
10.2 |
|
AMD Ryzen 5 3600X |
1547.4 |
779.24 |
1 |
777.62 |
745.3 |
2.8 |
584.93 |
538.45 |
10.4 |
|
AMD Ryzen 3 3400G |
508.97 |
253.87 |
1 |
490.26 |
247.04 |
3 |
233.57 |
193.62 |
9.3 |
|
AMD Ryzen 3 3300X |
1080.5 |
541.5 |
0.9 |
541.84 |
530.5 |
2.7 |
322.13 |
321.33 |
11.1 |
|
AMD Ryzen 3 3100 |
965.85 |
484.67 |
1 |
485.55 |
460.71 |
3.1 |
374.11 |
343.53 |
11.8 |
|
Intel i5-10600K |
1676.6 |
840.87 |
0.8 |
662.98 |
452.67 |
2.5 |
361.35 |
238.47 |
10.5 |
|
Intel i9-10900K |
3162.1 |
1586.7 |
0.8 |
1201.8 |
759.97 |
2.4 |
407.66 |
245.94 |
11.4 |
|
AMD Ryzen 5 5600X |
1721.4 |
869.69 |
0.9 |
851.89 |
831.97 |
2.6 |
276.24 |
298.84 |
11 |
|
Intel i9-11900K |
4542.8 |
2299.3 |
1 |
1413.2 |
691.62 |
2.5 |
330.32 |
213.28 |
11.4 |
|
Intel i5-11600K |
3412.3 |
1724.9 |
1 |
960.91 |
526.76 |
2.7 |
319.1 |
198.57 |
11.4 |
|
Intel i9-12900K |
2310 |
1438.7 |
1 |
1233.5 |
562.72 |
2.9 |
678.84 |
418.11 |
19.8 |
|
Intel i5-12600K |
1461.1 |
971.78 |
1.1 |
846.4 |
360.51 |
3.2 |
598.86 |
292.09 |
21.4 |
|
AMD Ryzen 5 4500 |
1561.9 |
784.1 |
1 |
785.34 |
751.61 |
2.9 |
350.05 |
571.19 |
10.5 |
|
AMD Ryzen 5 5600 |
1646.6 |
831.24 |
0.9 |
832.43 |
767.22 |
2.7 |
445.8 |
437.73 |
11.9 |
|
AMD Ryzen 7 5700X |
2267.8 |
1157.8 |
0.9 |
1147.6 |
1026.1 |
2.6 |
501.53 |
526.11 |
11.5 |
|
AMD Ryzen 7 7700X |
2722.9 |
1381 |
0.7 |
1361.1 |
1305.1 |
2.7 |
887.95 |
901.2 |
10.1 |
|
AMD Ryzen 5 7600X |
1996.3 |
1019.3 |
0.7 |
1020.9 |
999.93 |
2.6 |
847.43 |
847.61 |
10.5 |
|
AMD Ryzen 9 7950X |
5252.2 |
2685 |
0.7 |
2615.6 |
2588.4 |
2.6 |
1293.7 |
1357.3 |
9.9 |
|
AMD Ryzen 9 7900X |
4042.4 |
2051.4 |
0.7 |
2008.5 |
1956.3 |
2.5 |
1278.6 |
1394.1 |
9.8 |
|
Intel i9-13900K |
2005.7 |
872.39 |
0.9 |
2280.2 |
851.63 |
3.7 |
1729.2 |
619.38 |
18.3 |
|
Intel i5-13600K |
3218.4 |
1472.5 |
1.1 |
1156 |
479.87 |
4.5 |
907.63 |
406.76 |
14.9 |
|
AMD Ryzen 9 7900 |
3839.2 |
2023.6 |
0.7 |
1925.5 |
1865.1 |
2.7 |
1146 |
1046.4 |
10.3 |
|
AMD Ryzen 7 7700 |
2630.8 |
1333.7 |
0.8 |
1336.2 |
1298.2 |
2.9 |
826.97 |
879.08 |
10.4 |
|
AMD Ryzen 5 7600 |
1898 |
963.23 |
0.8 |
964.63 |
946.49 |
2.9 |
698.77 |
690.84 |
10.8 |
|
AMD Ryzen 9 7950X3D |
4734.9 |
2518.4 |
0.8 |
2558.7 |
2422.3 |
2.7 |
1314.4 |
1376.8 |
12.5 |
|
AMD Ryzen 7 7800X3D |
2342.7 |
1239.1 |
0.8 |
1252.6 |
1171.8 |
3.1 |
674.02 |
703.18 |
12.8 |
|
AMD Ryzen 7 8700G |
2350.8 |
1228 |
0.8 |
1230.7 |
1219.8 |
2.8 |
867.87 |
893.95 |
11.4 |
|
AMD Ryzen 5 8600G |
1777.2 |
930.44 |
0.8 |
941.76 |
941.91 |
2.9 |
721.29 |
702.59 |
10.7 |
|
AIDA64 |
Memory Read |
Memory Write |
Memory Latency |
Single-Precision FLOPS |
Double Precision FLOPS |
AES-256 |
24-bit Integer IOPS |
32-bit Integer IOPS |
64-bit Integer IOPS |
|
|
MB/s |
MB/s |
ns |
GFLOPS |
GFLOPS |
MB/s |
GIOPS |
GIOPS |
GIOPS |
|
AMD Ryzen R7 2700X |
50214 |
48578 |
65 |
507.9 |
253.9 |
70514 |
127.7 |
127.7 |
64.22 |
|
AMD Ryzen R5 2600X |
50273 |
48346 |
65.5 |
383.2 |
191.4 |
51932 |
95.82 |
95.82 |
48.15 |
|
Ryzen 5 2400G |
45967 |
47850 |
66.6 |
235.9 |
117.8 |
32388 |
58.94 |
58.98 |
29.67 |
|
Ryzen 3 2200G |
35567 |
36240 |
118.4 |
225.8 |
112.6 |
27603 |
56.32 |
56.32 |
28.3 |
|
Intel i7-8700K |
38421 |
40175 |
57.9 |
825 |
412.5 |
29406 |
370 |
370 |
51.55 |
|
Intel i5-8400 |
38096 |
40549 |
59.8 |
728.8 |
364.5 |
25192 |
323.5 |
323.5 |
45.55 |
|
Intel Core i9-7980XE |
77004 |
68888 |
73.4 |
1831 |
915.5 |
69377 |
821.2 |
821.3 |
121.6 |
|
Intel Core i9-7960X |
79416 |
71554 |
74.9 |
1681 |
840.6 |
65409 |
754 |
753.9 |
114.7 |
|
Intel Core i7-7820X |
76049 |
73759 |
71.6 |
944.9 |
472.5 |
36420 |
423.7 |
423.7 |
63.85 |
|
Intel Core i5-7640X |
30786 |
31888 |
68.5 |
536.5 |
268.2 |
18547 |
238.1 |
138.1 |
33.53 |
|
Intel Core i9-7900X |
76856 |
72856 |
72.8 |
1148 |
574.5 |
45506 |
515.1 |
515 |
79.76 |
|
Intel Core i7-7740X |
38455 |
40596 |
53.2 |
575.4 |
287.8 |
20503 |
258.1 |
258 |
35.97 |
|
Intel i7-6900K |
66786 |
68130 |
61.9 |
1023 |
511.7 |
36340 |
255.9 |
255.9 |
63.96 |
|
Intel i7-7700K |
38498 |
40448 |
52.7 |
575.7 |
287.9 |
20519 |
258 |
258 |
35.98 |
|
Intel i7-5960X |
66108 |
49545 |
62.8 |
895.5 |
447.7 |
31783 |
223.9 |
223.9 |
55.97 |
|
AMD Ryzen R7 1800X |
44031 |
43425 |
81.8 |
472.4 |
236.2 |
64016 |
118.1 |
118.1 |
59.03 |
|
AMD Ryzen R7 1700X |
44493 |
43749 |
78.3 |
446.8 |
223.4 |
61730 |
111.7 |
111.7 |
55.84 |
|
AMD Ryzen R7 1700 |
45343 |
43777 |
82.6 |
408.5 |
204.3 |
56811 |
102.1 |
102.1 |
51.05 |
|
AMD Ryzen R5 1600X |
44452 |
43918 |
83.7 |
354.9 |
177.5 |
49340 |
88.74 |
88.73 |
44.34 |
|
AMD Ryzen R5 1500X |
44289 |
43746 |
83.1 |
229.8 |
114.8 |
31983 |
57.43 |
57.45 |
28.72 |
|
AMD Ryzen R5 2600 |
50385 |
48499 |
66.5 |
351 |
175.4 |
48939 |
88.03 |
88.02 |
44.01 |
|
AMD Ryzen R7 2700 |
50088 |
48343 |
65.9 |
434.3 |
217.2 |
60336 |
108.6 |
108.6 |
54.68 |
|
Intel i7-8086K |
39069 |
40675 |
56.2 |
824.9 |
412.5 |
29397 |
369.9 |
369.9 |
51.55 |
|
Intel i9-9900K |
39682 |
41015 |
51.1 |
1226 |
613 |
45542 |
550 |
549.8 |
79.79 |
|
AMD Ryzen 9 3900X |
53981 |
52271 |
70.7 |
1546 |
772.1 |
106943 |
385.7 |
385.7 |
96.57 |
|
AMD Ryzen 7 3700X |
51498 |
28739 |
67.3 |
1078 |
537.8 |
74474 |
271 |
271.2 |
67.77 |
|
AMD Ryzen 5 3600X |
50769 |
28736 |
68.9 |
799.5 |
400 |
55456 |
198.6 |
198.6 |
49.64 |
|
AMD Ryzen 3 3400G |
49936 |
53502 |
67.1 |
257.2 |
128.5 |
35736 |
64.16 |
64.16 |
32.25 |
|
AMD Ryzen 3 3300X |
51435 |
28743 |
66.4 |
551.6 |
276.1 |
38176 |
138.7 |
138.7 |
34.65 |
|
AMD Ryzen 3 3100 |
50246 |
28734 |
71.1 |
497.6 |
248.7 |
34946 |
124.4 |
124.4 |
31.09 |
|
Intel i5-10600K |
43340 |
43430 |
48.2 |
863.8 |
431.9 |
30782 |
387.2 |
386.9 |
53.99 |
|
Intel i9-10900K |
44972 |
43808 |
50.5 |
1632 |
815.7 |
58163 |
731.3 |
731.2 |
102 |
|
AMD Ryzen 5 5600X |
50972 |
28772 |
59.2 |
891.9 |
445.8 |
61623 |
709.6 |
709.7 |
55.72 |
|
Intel i9-11900K |
44919 |
43343 |
51.8 |
1068 |
534.2 |
164966 |
547 |
547 |
182.7 |
|
Intel i5-11600K |
43953 |
43468 |
55.6 |
838.7 |
419.4 |
123767 |
429.3 |
429.3 |
143.4 |
|
Intel i9-12900K |
71418 |
72395 |
82 |
695.7 |
247.9 |
140499 |
400.6 |
400.6 |
166.2 |
|
Intel i5-12600K |
65416 |
71336 |
87.8 |
432.5 |
216.2 |
86470 |
252.7 |
252.7 |
96.22 |
|
AMD Ryzen 5 4500 |
52683 |
53191 |
82.8 |
806 |
402.6 |
56578 |
201.5 |
201.3 |
50.35 |
|
AMD Ryzen 5 5600 |
48444 |
28753 |
70.9 |
853.2 |
426.2 |
107839 |
675.8 |
679.6 |
53.38 |
|
AMD Ryzen 7 5700X |
47858 |
28760 |
68.2 |
1158 |
577.9 |
137459 |
919.1 |
912.9 |
74.38 |
|
AMD Ryzen 7 7700X |
58755 |
80120 |
70 |
1392 |
694.6 |
192730 |
1205 |
1205 |
602.4 |
|
AMD Ryzen 5 7600X |
54720 |
80771 |
69.5 |
1046 |
523.1 |
147661 |
912.5 |
912.5 |
456.4 |
|
AMD Ryzen 9 7950X |
67342 |
76712 |
69 |
2735 |
1364 |
379510 |
2370 |
2370 |
1184 |
|
AMD Ryzen 9 7900X |
68064 |
78123 |
67.7 |
2062 |
1029 |
288134 |
1792 |
1789 |
895.4 |
|
Intel i9-13900K |
76006 |
68902 |
86.1 |
2238 |
1116 |
157028 |
831.4 |
831.4 |
270.6 |
|
Intel i5-13600K |
64721 |
62311 |
97.2 |
1294 |
647 |
86637 |
509.5 |
509.4 |
136.4 |
|
AMD Ryzen 9 7900 |
73968 |
73494 |
69.4 |
2007 |
998.7 |
267499 |
1710 |
1709 |
855.9 |
|
AMD Ryzen 7 7700 |
58694 |
79929 |
68.9 |
1369 |
684.7 |
185084 |
1192 |
1192 |
594.3 |
|
AMD Ryzen 5 7600 |
59454 |
81467 |
69.6 |
988.6 |
494.3 |
140625 |
861.9 |
861.2 |
431.2 |
|
AMD Ryzen 9 7950X3D |
77677 |
80314 |
68.1 |
2619 |
1311 |
178269 |
2239 |
2239 |
1120 |
|
AMD Ryzen 7 7800X3D |
65343 |
81313 |
71.9 |
1241 |
620.3 |
89694 |
1076 |
1076 |
538.3 |
|
AMD Ryzen 7 8700G |
75149 |
99082 |
74.5 |
1277 |
638.1 |
88895 |
1108 |
1108 |
554.1 |
|
AMD Ryzen 5 8600G |
75418 |
99134 |
71.6 |
969.3 |
484.6 |
69303 |
842.7 |
843.2 |
421.4 |
