It’s been a surprisingly busy 2024 with a list of different GPU launches that were all announced at CES. AMD didn’t just announce the RX 7600 XT at CES however, they also introduced a new line of CPUs their Ryzen 8000G Series, and a few new SKUs in the older Ryzen 5000 Series as well for AM4 users. Today I’m going to check out two of the new 8000G Series CPUs, the Ryzen 7 8700G and Ryzen 5 8600G which will be hitting stores on the 31st. They are Zen 4 CPUs with upgraded integrated GPU capabilities including AI processing as well with an integrated NPU on both the 8700G and 8600G. Onboard graphics performance is an area that we always test and keep an eye on with included so I’m excited to see what AMD’s promise of “fastest built-in graphics in its class” will mean for actual gameplay so let’s dive in and see what they are capable of.
Product Name: AMD Ryzen 8000G Series
Review Samples Provided by: AMD
Written by: Wes Compton
Amazon Affiliate Links:
|
|
Ryzen 7 8700G |
Ryzen 5 8600G |
Ryzen 5 8500G |
Ryzen 3 8300G |
|
MSRP |
$329 |
$229 |
$176 |
N/A |
|
Architecture |
Zen 4 |
2 x "Zen4" 4 x "Zen4c" |
1 x "Zen4" 3 x "Zen4c" |
|
|
# of CPU Cores |
8 |
6 |
4 |
|
|
Multithreading (SMT) |
Yes |
|||
|
# of Threads |
16 |
12 |
8 |
|
|
Max. Boost Clock |
Up to 5.1GHz |
Up to 5.0GHz |
Up to 4.9GHz |
|
|
Max Zen4c Clock |
N/A |
Up to 3.7GHz |
Up to 3.6GHz |
|
|
Base Clock |
4.2GHz |
4.3GHz |
3.5GHz |
3.4GHz |
|
Zen4c Base Clock |
N/A |
3.2GHz |
||
|
L2 Cache |
8MB |
6MB |
4MB |
|
|
L3 Cache |
16MB |
8MB |
||
|
Default TDP |
65W |
|||
|
AMD Configurable TDP (cTDP) |
45-65W |
|||
|
Processor Technology for CPU Cores |
TSMC 4nm FinFET |
|||
|
CPU Compute Die (CCD) Size |
178mm² |
137mm² |
||
|
Package Die Count |
1 |
|||
|
Unlocked for Overclocking |
Yes |
No |
||
|
AMD EXPO™ Memory Overclocking Technology |
Yes |
|||
|
Precision Boost Overdrive |
Yes |
|||
|
Curve Optimizer Voltage Offsets |
Yes |
|||
|
AMD Ryzen™ Master Support |
Yes |
|||
|
CPU Socket |
AM5 |
|||
|
CPU Boost Technology |
Precision Boost 2 |
|||
|
Instruction Set |
x86-64 |
|||
|
Supported Extensions |
AES, AMD-V, AVX, AVX2, AVX512, FMA3, MMX(+), SHA, SSE, SSE2, SSE3, SSE4.1, SSE4.2, SSE4A, SSSE3, x86-64 |
|||
|
Max. Operating Temperature (Tjmax) |
95°C |
|||
|
PCI Express® Version |
PCIe® 4.0 |
|||
|
Native PCIe® Lanes (Total/Usable) |
20 / 16 |
20 / 16 |
14 / 10 |
14 / 10 |
|
NVMe Support |
Boot, RAID0, RAID1 |
|||
|
System Memory Type |
DDR5 |
|||
|
Memory Channels |
2 |
|||
|
Max. Memory |
256GB |
|||
|
Graphics Capabilities |
||||
|
Graphics Model |
AMD Radeon 780M |
AMD Radeon 760M |
AMD Radeon 740M |
|
|
Graphics Core Count |
12 |
8 |
4 |
|
|
Graphics Frequency |
2900 MHz |
2800 MHz |
2600 MHz |
|
What is the Ryzen 8000G Series
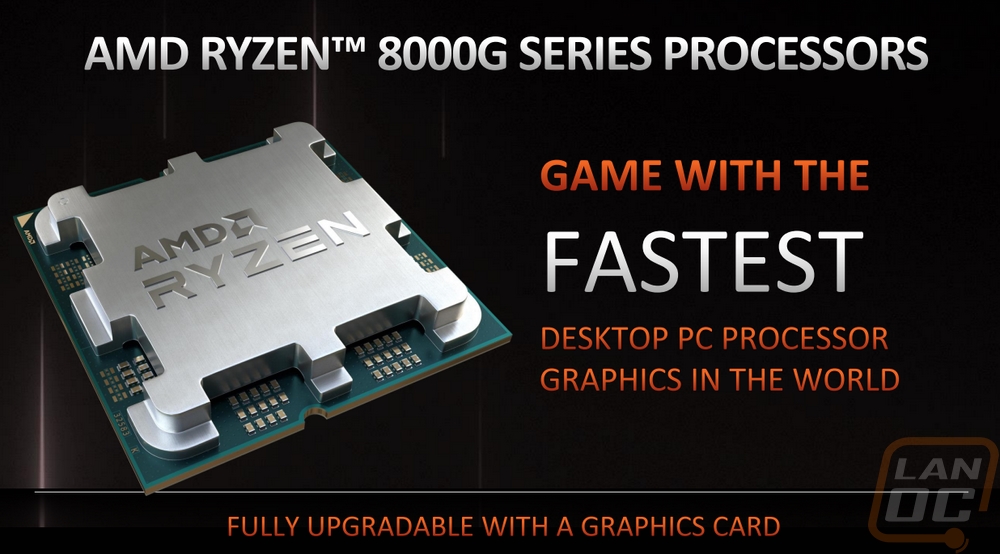
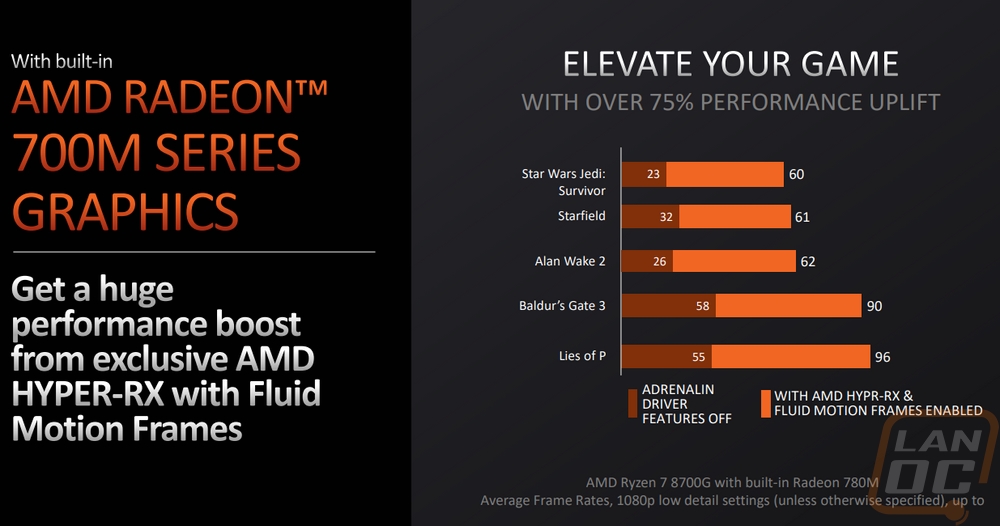
Well, you might be wondering exactly what the 8000G Series is all about and while this is the first CPUs from the 8000 Series the G lets us know that these are focused on onboard graphics performance, pairing that alongside a solid CPU as well which means that in the future you can upgrade to a dedicated GPU if needed or use the CPU in more demanding CPU applications. In AMDs presentation, they highlight the 8000G Series as the fastest desktop PC processor graphics in the world. This isn’t too big of a surprise as AMD has really been leading that area for a while. What is the most exciting thing in my eyes however is that the 700M graphics used here supports AMD HYPR-RX and Fluid Motion Frames. Those technologies help see big performance improvements and AMDs examples showed it giving a 75% performance uplift across a range of modern titles and with those demanding titles it is a way to get smooth 60+ FPS gaming WITHOUT a dedicated GPU and I don’t have to remind everyone just how much any of the video cards cost these days.
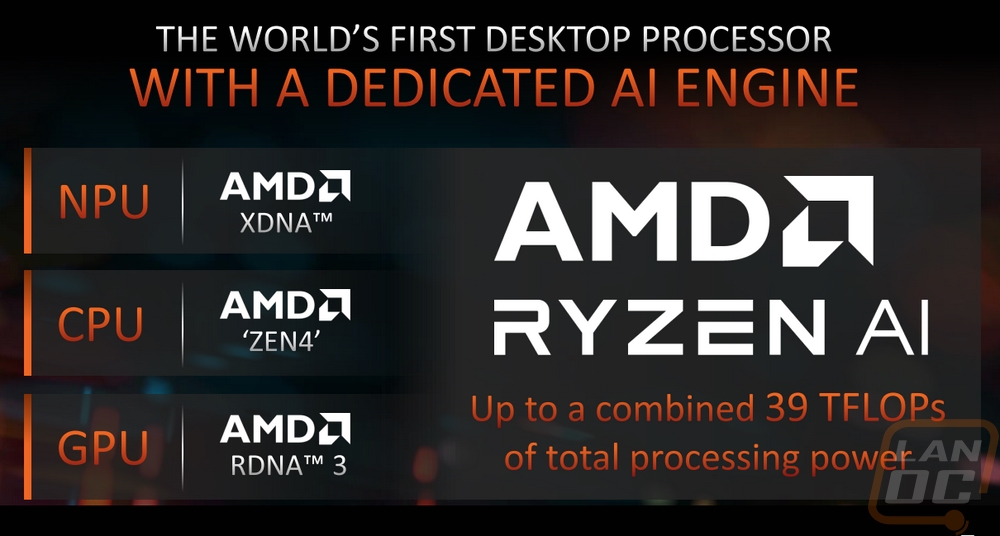
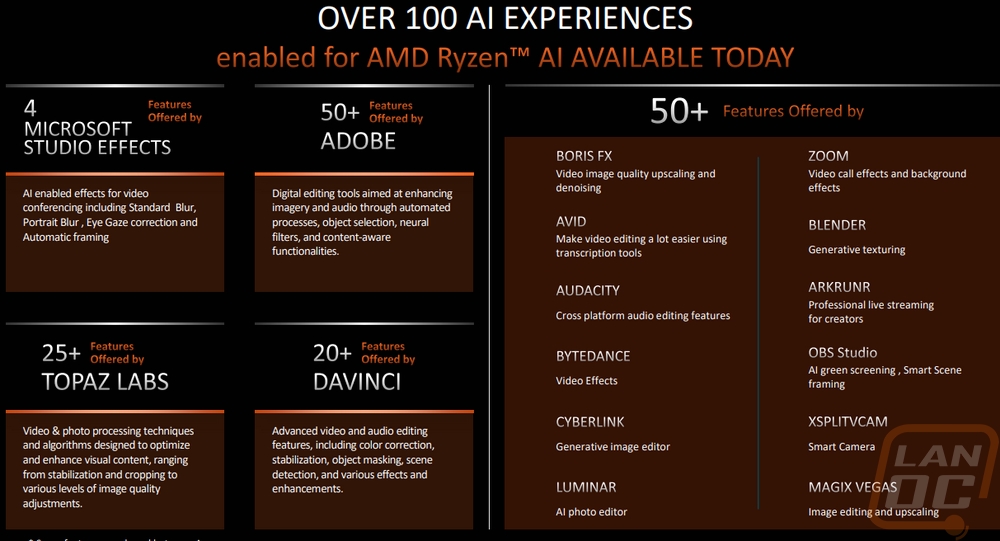
One of the other big features with two out of the four 8000G CPUs is the inclusion of a proper NPU for dedicated AI engine processing. AI is of course the big buzzword these days but a lot of software is integrating it. Having dedicated processing will help keep that load off of the CPU. AMD did give a nice list showing examples of some of the 100 different situations that are supported currently and you might think that you won’t need it but software like Zoom and OBS use it for effects and green screen use and a lot of non-power users would be doing those things. That doesn’t include other aspects like video, audio, and photo editing which a majority of big names there are using it in one way or another.
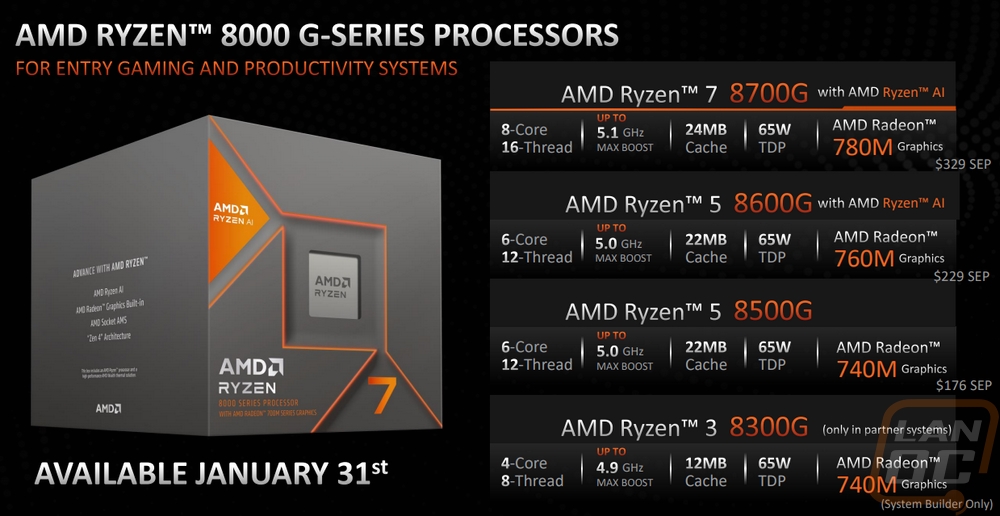
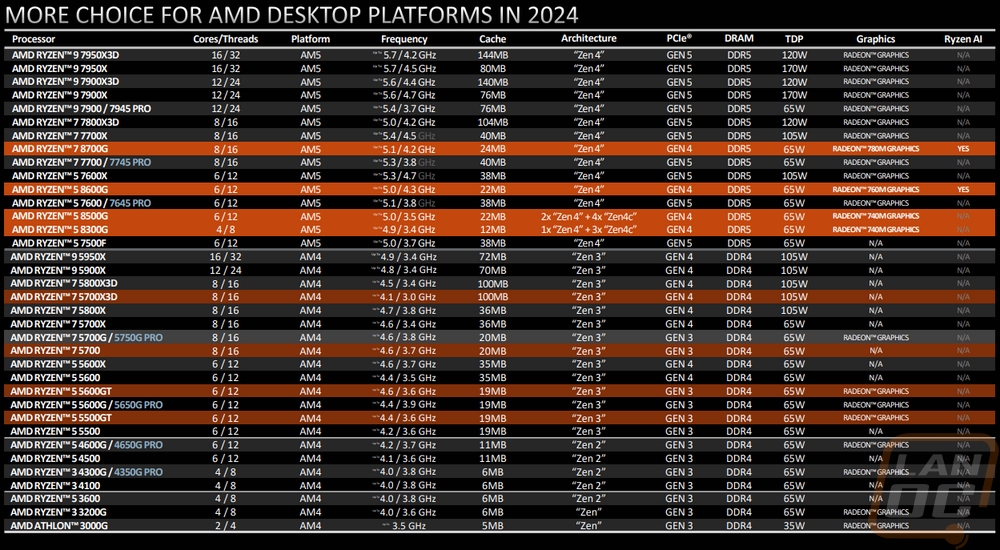
So there are four new CPUs and like I mentioned before two of those (the 8700G and 8600G) support Ryzen AI. What else do they have going on? Well, there are three different levels of integrated graphics. They are all from the Radeon 700M series but the top-end Ryzen 7 8700G has 780M graphics whereas the 8600G has 760M and the 8500G and 8300G both have Radeon 740M graphics. Their presentation doesn’t show it but the 780M iGPU has 12 cores, the 760M has 8 cores, and the 740M has 4 cores which should help give a good idea of their overall performance between each other. The CPU side of things break down similar to the normal Ryzen lineups. The Ryzen 7 8700G has an 8-core CPU with 16 threads and can boost up to 5.1 GHz and has a 24MB infinity cache. The Ryzen 5 8600G has 6 cores and 12 threads with a boost clock speed of up to 5.0 GHz and has a 22MB cache. The 8500G is similar with the same core count and cache but has that lower model iGPU and doesn’t have Ryzen AI. Then the Ryzen 3 8300G has 4 cores and 8 threads with a 4.9 GHz max boost and a smaller 12 MB cache. That last one is system builder only so it won’t hit stores. All four have the same 65-watt TDP. When you see where they fit in with the rest of AMDs CPUs in the full list the 8700G is similar to the 7700X but with a lower boost and base clock speed and cache. It and the others also only support PCIe Gen 4, not Gen 5. For pricing the 8700G has a $329 suggested price, the 8600G is suggested to be $229, and then the 8500G is suggested at $176 so they have really covered a range of pricing as well. They have kept the pricing for the 8700G down under the 7700X which is selling for $349 right now.
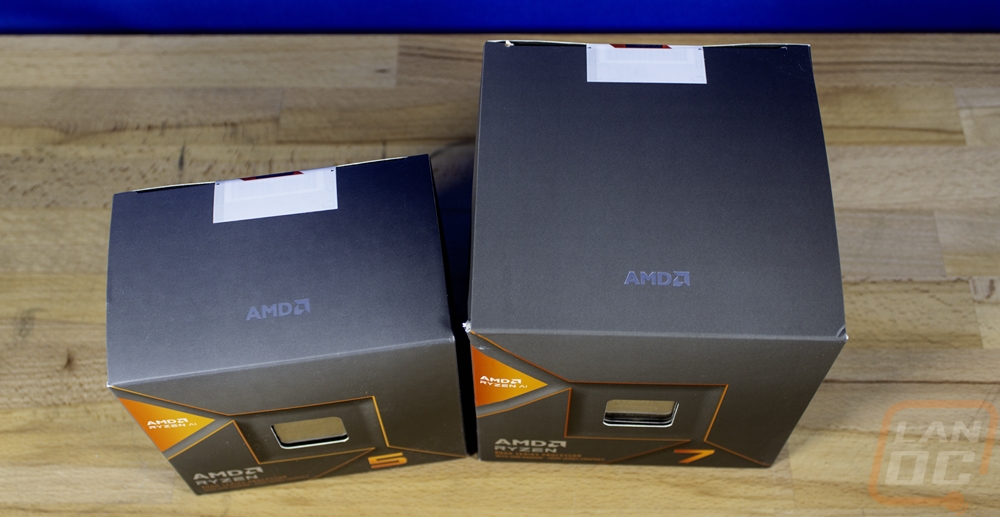
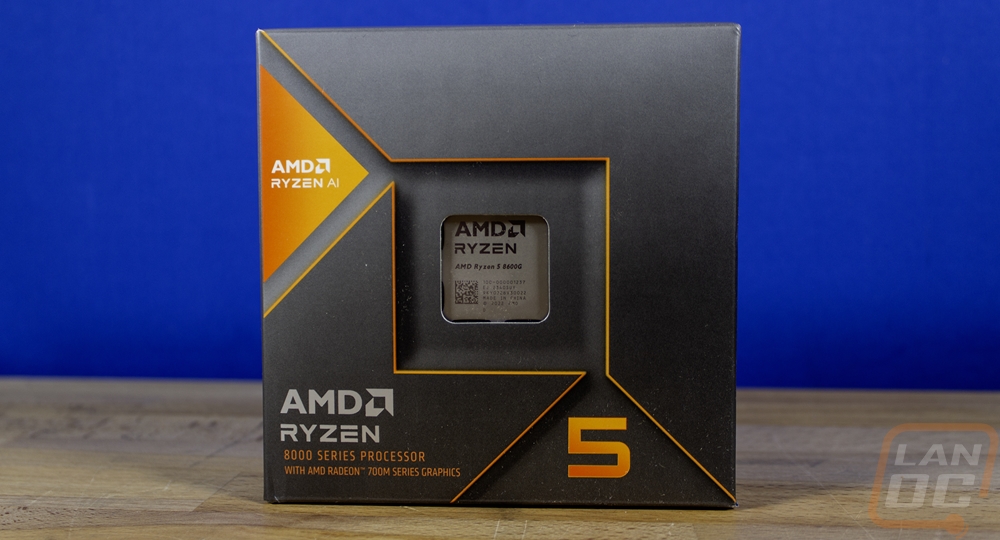
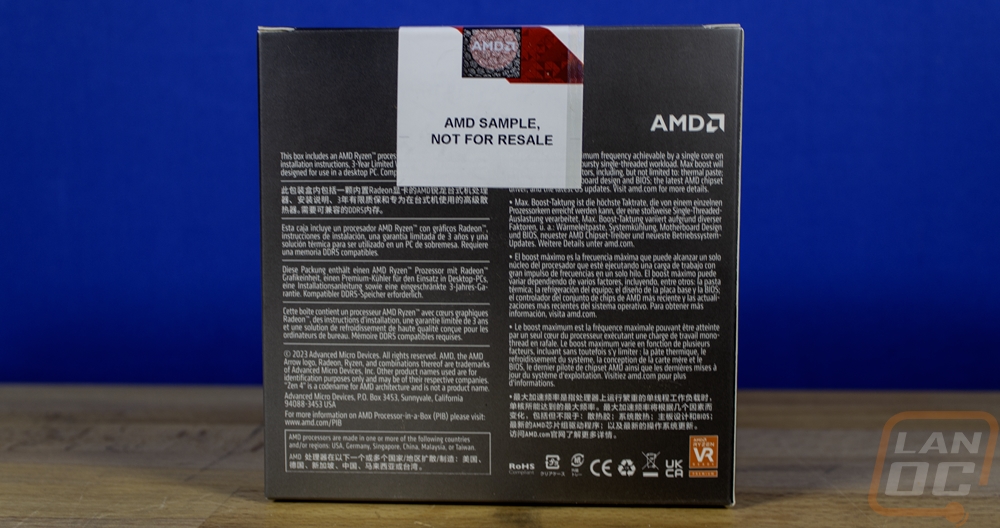
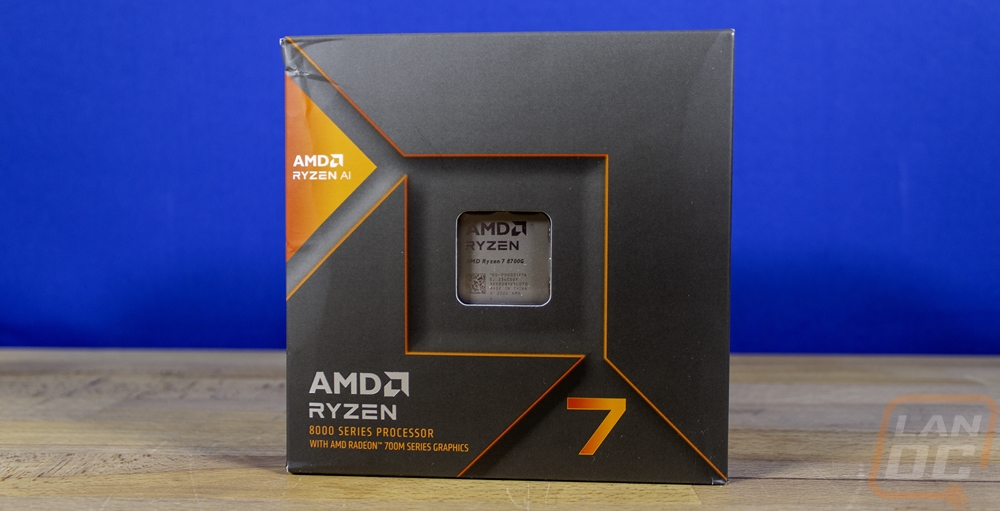
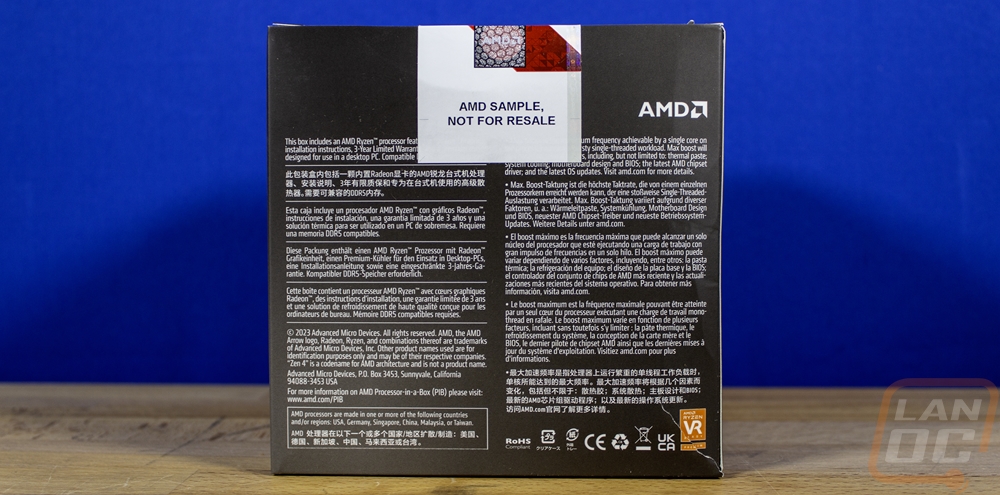
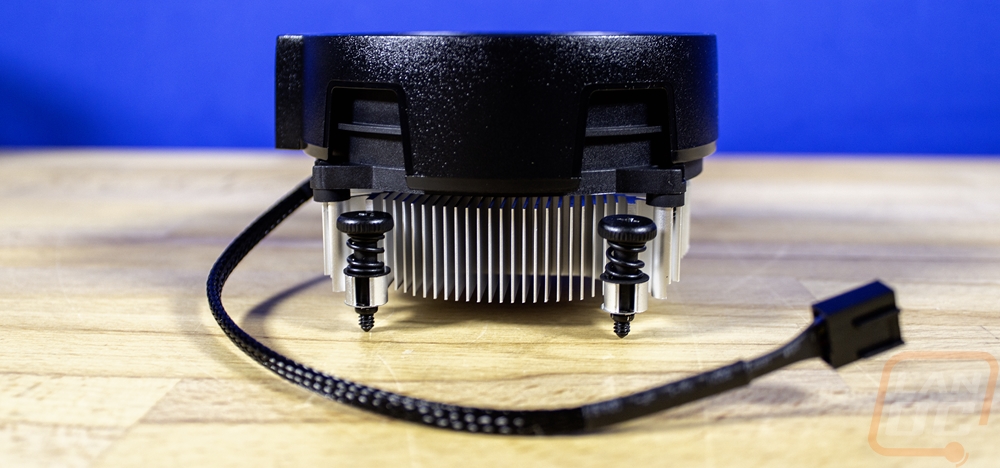
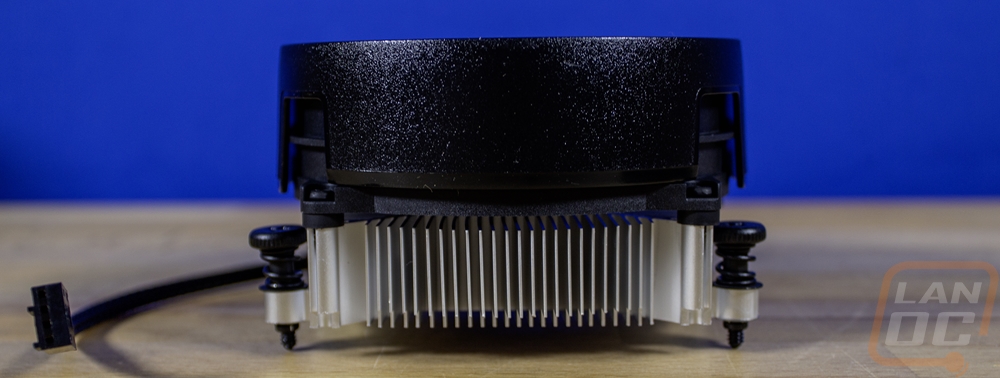
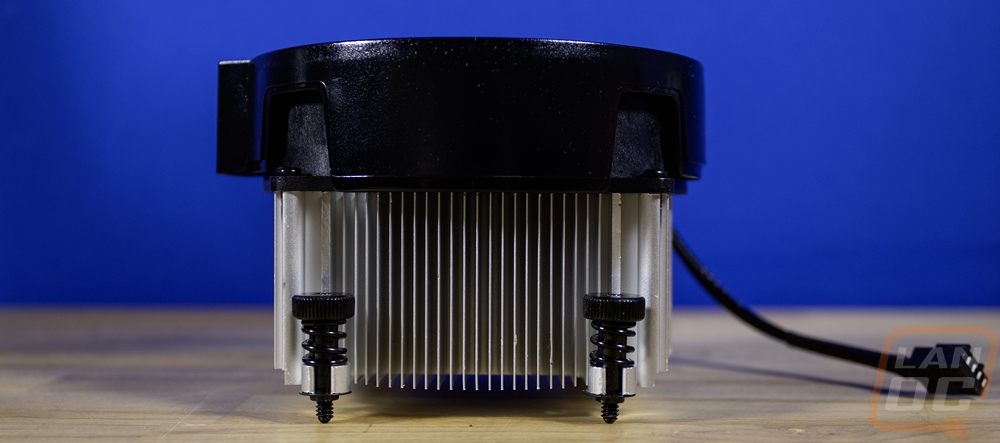
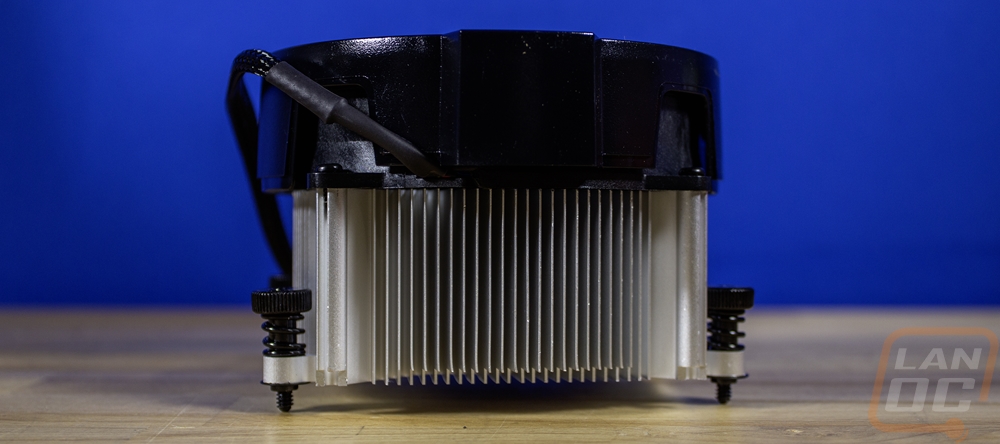
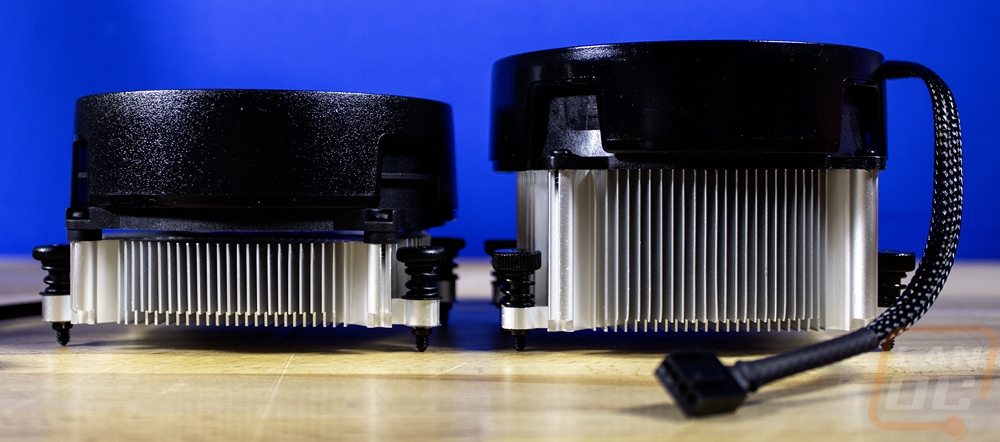
AMD did send over the full packaging for both the Ryzen 7 8700G and Ryzen 5 8600G and while the boxes do have that signature Ryzen grey and orange theme. They have added a highlight for Ryzen AI support on these two CPUs on the left side of the front of the box. You still get a cutout that lets you see the actual CPU as well right on the front and the Ryzen 5 and Ryzen 7 lines are prominent on the front with a large 5 and 7 to help let people know the pecking order here. They do have two different sized boxes though even with everything else being basically the same. That is because while they do have the same 65-watt TGP they come with different wrath coolers.
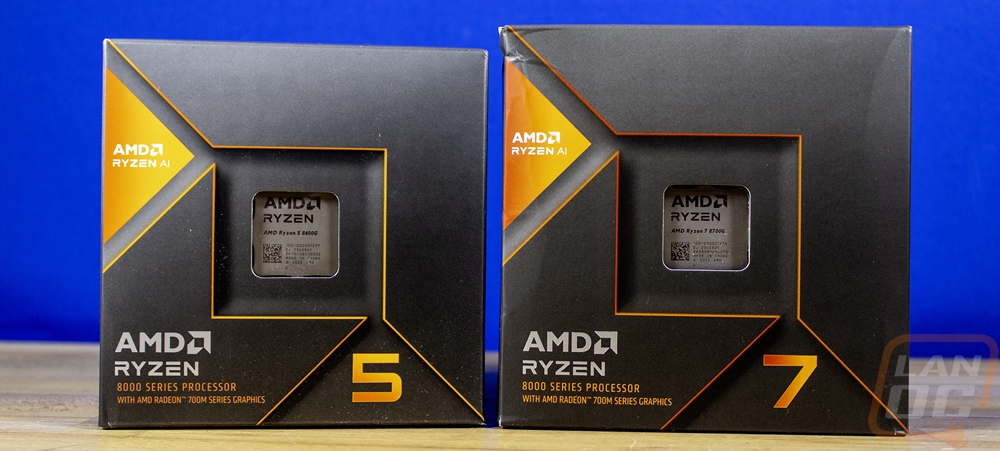
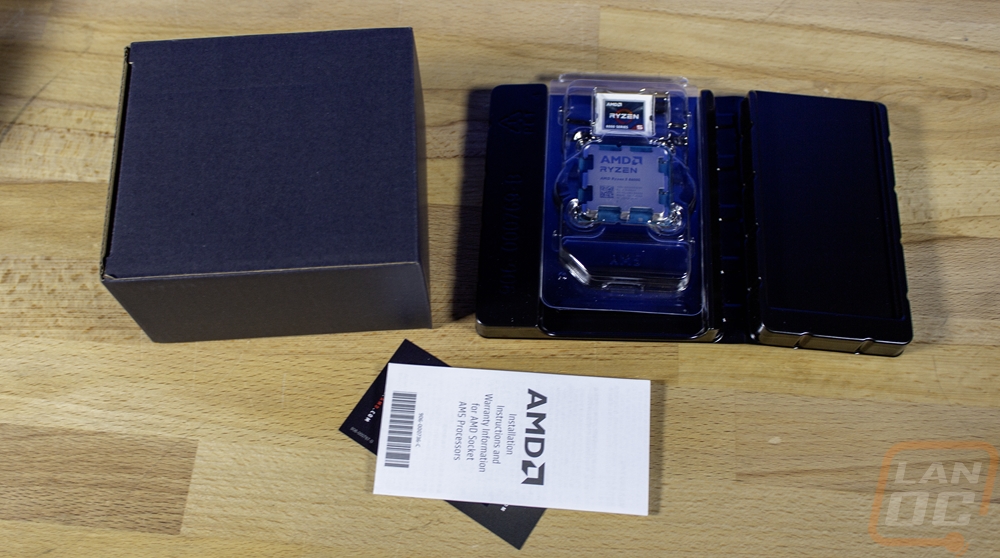
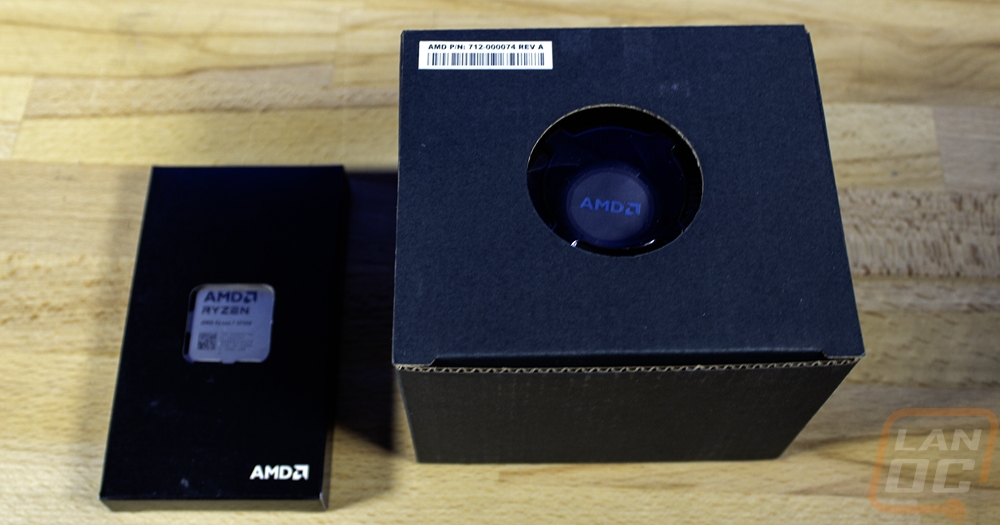
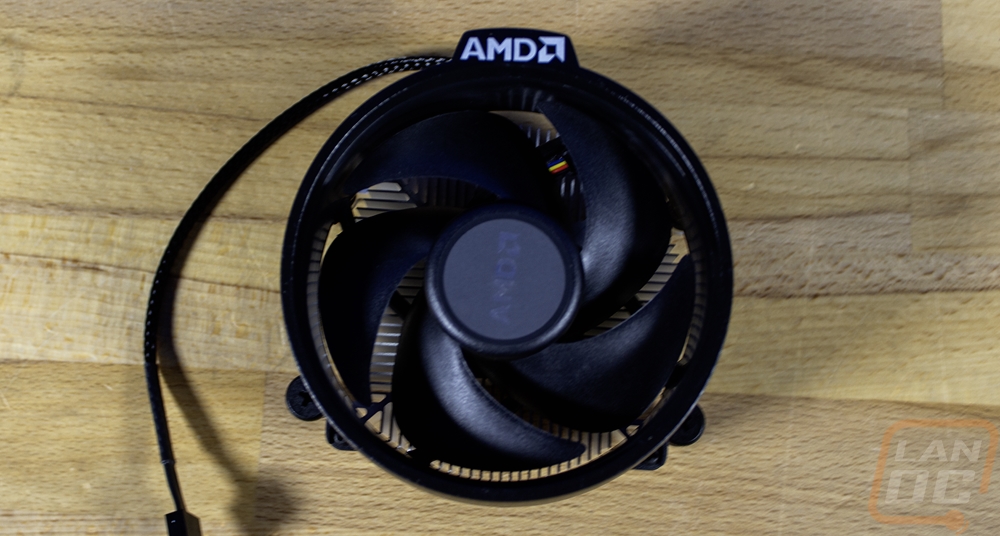
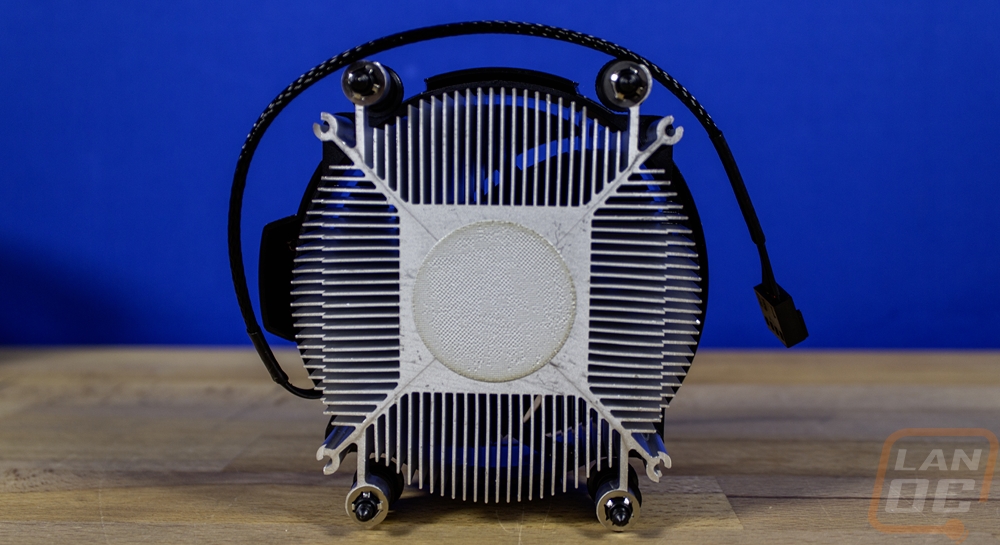
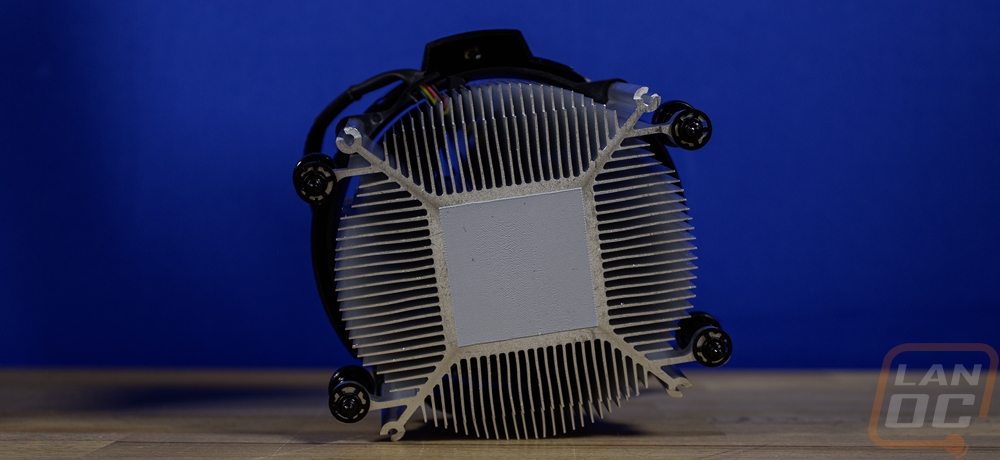
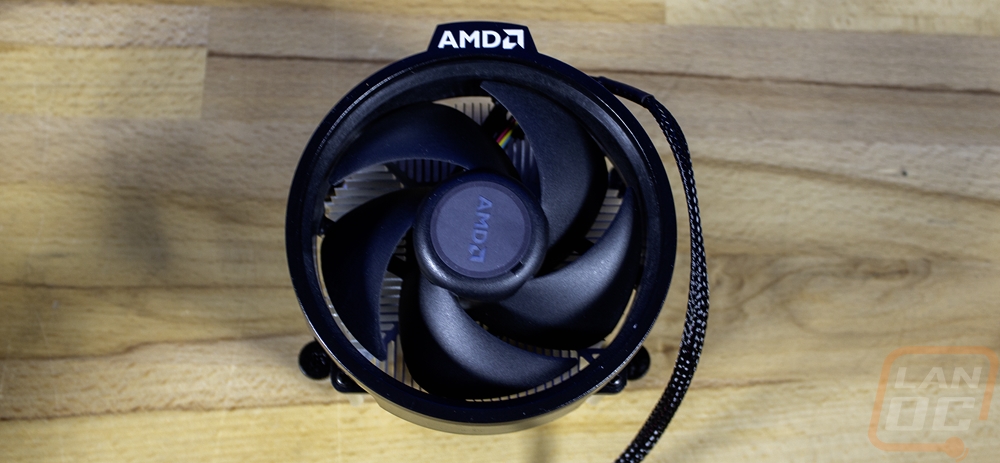
The 8700G comes with what looks like the Wrath Spire and the 8600G has the shorter Wrath Stealth. They have the same aluminum heatsink design and come with thermal paste pre-applied. They also use the screw mount design which is so much better than using the old school plastic clips in my opinion. Of course, the larger Spire has better cooling capabilities. Really though I will still prefer running better aftermarket cooling, but getting a cooler to use at the start is always nice and really fits with the theme of the 8000G Series where you get the best possible integrated graphics but also get CPUs capable of taking advantage of a dedicated GPU later on.
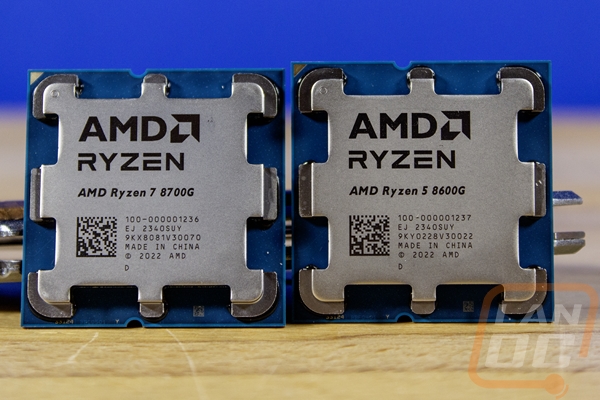
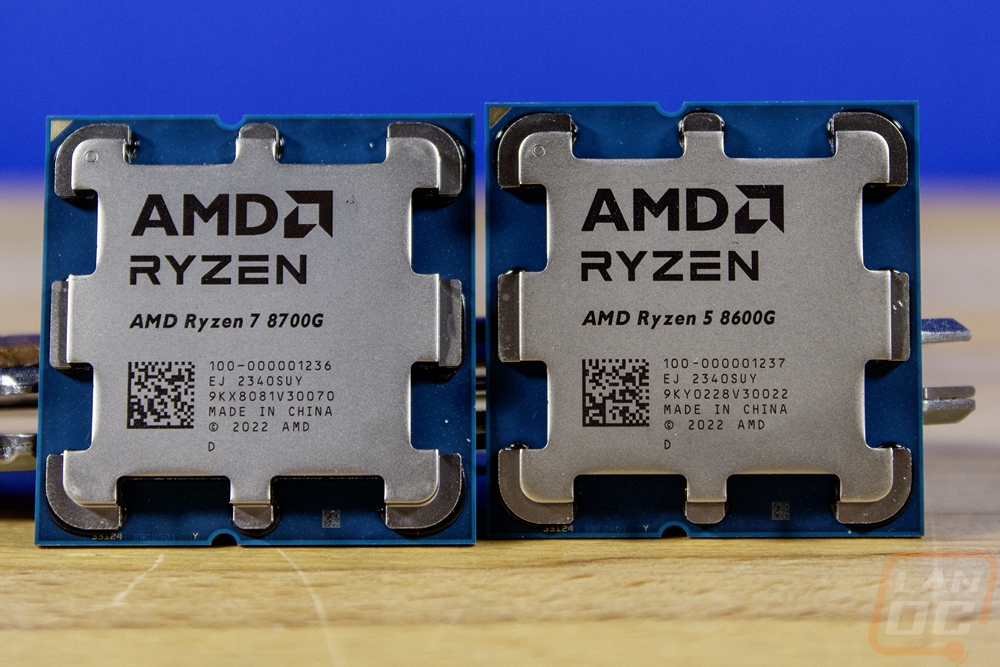
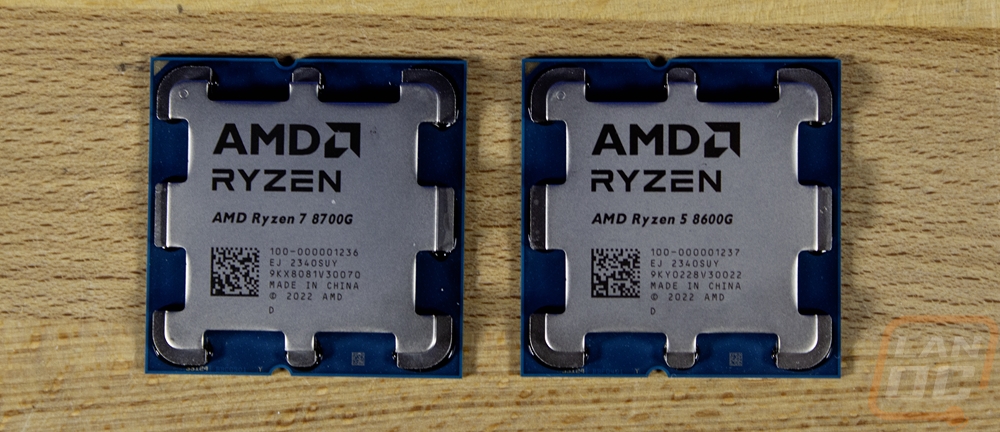
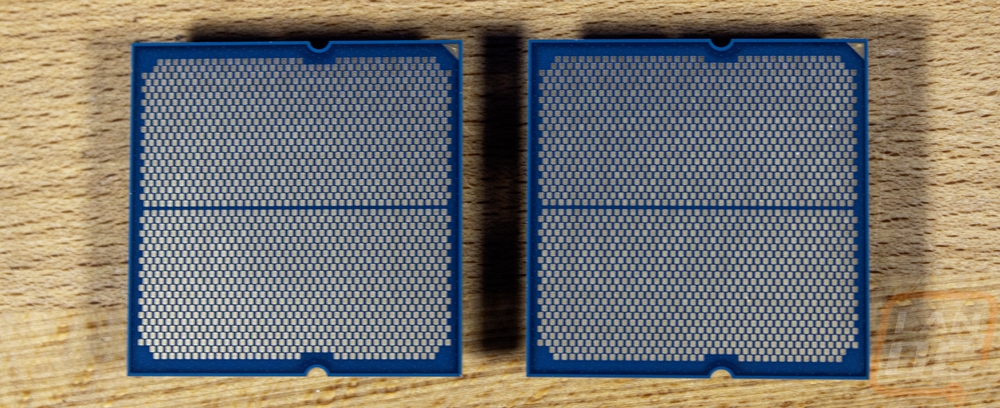
All of the new CPUs are AM5 which means they don’t have pins. The heatspreader design has that unique X with a plus sign shape and they do have the AMD Ryzen branding laser etched in a large font across the top of the heatspreader. It also has the model number and manufacturing information as well as the serial number and more.
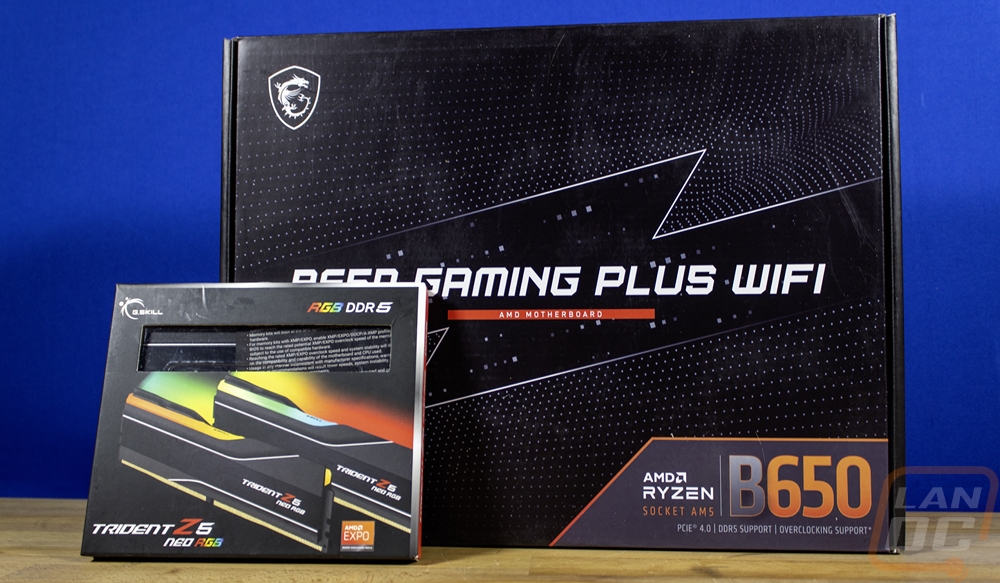
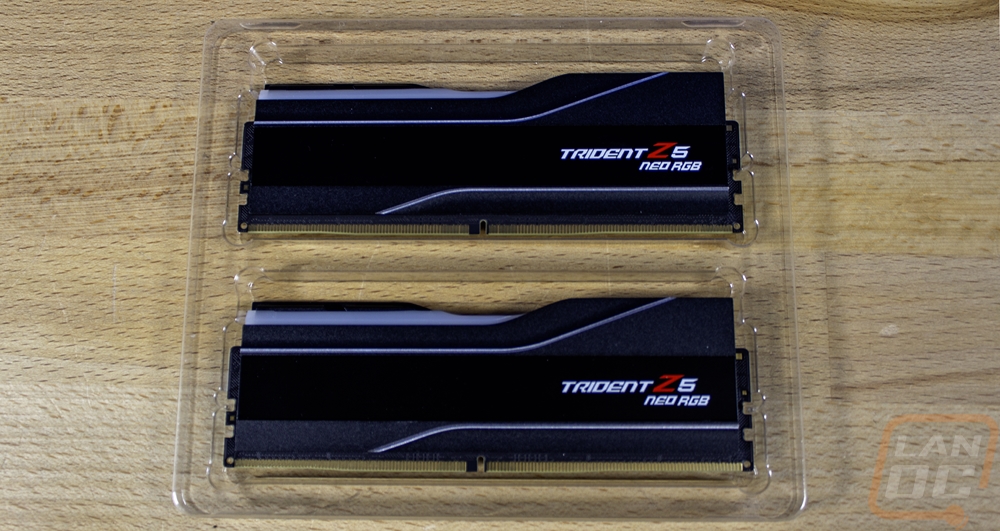
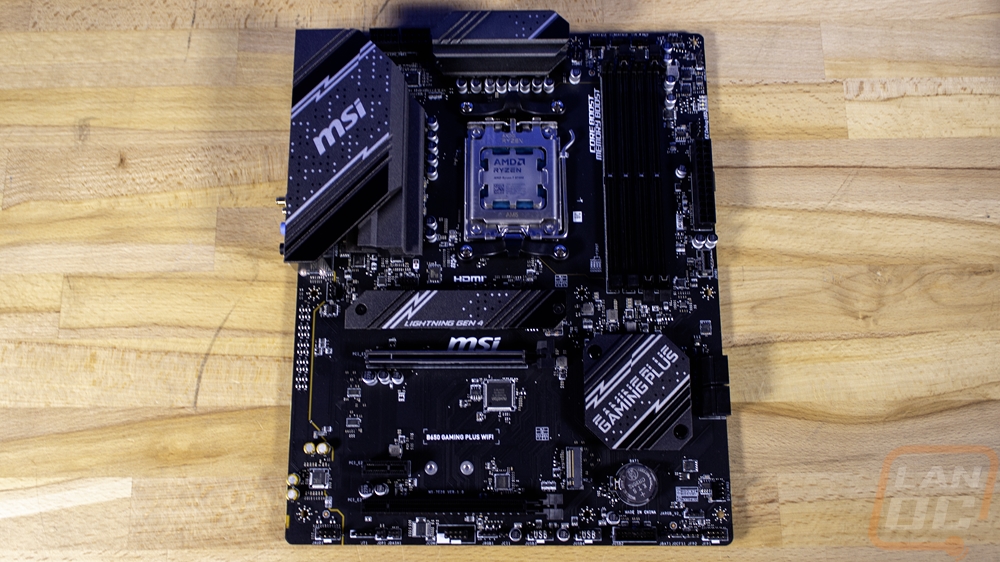
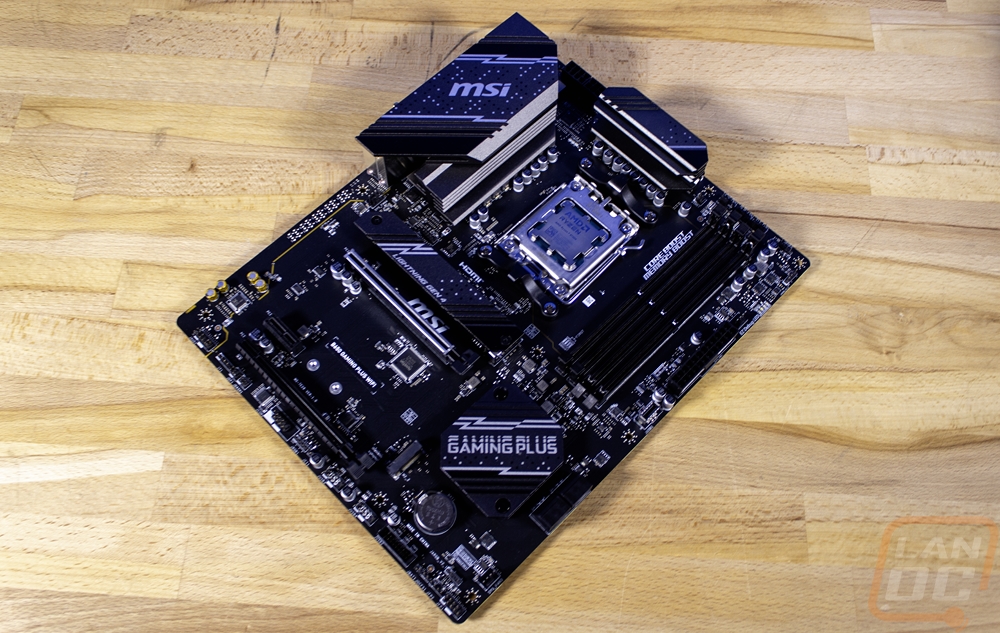
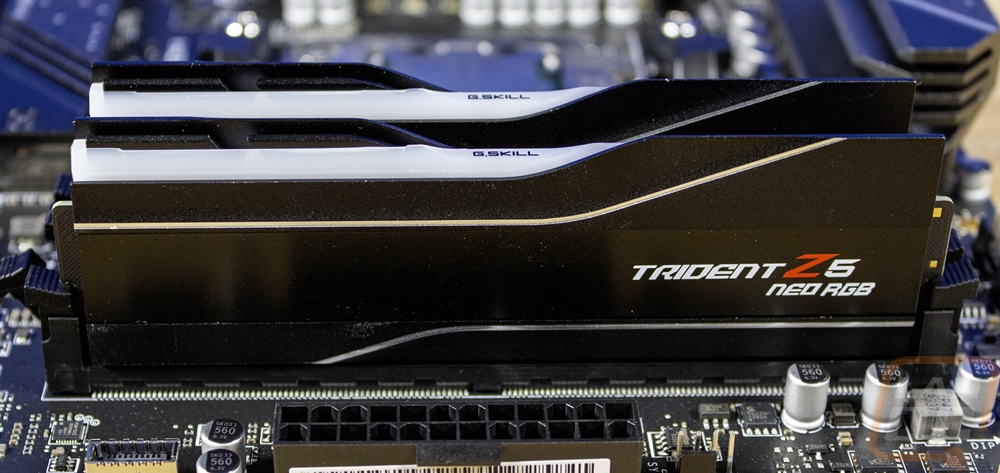
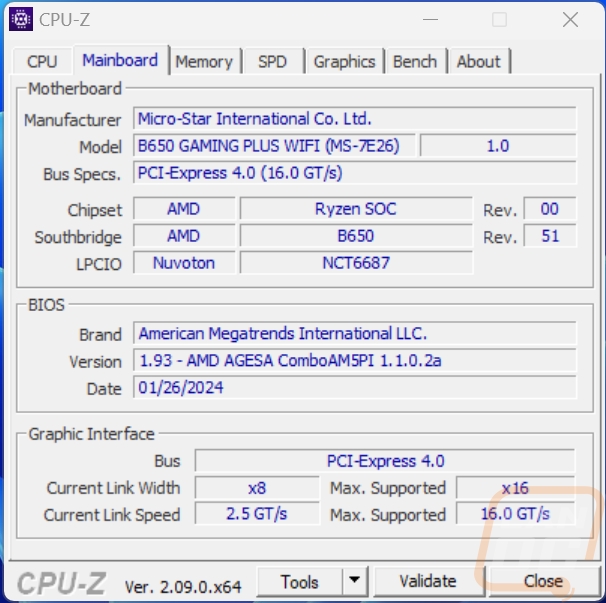
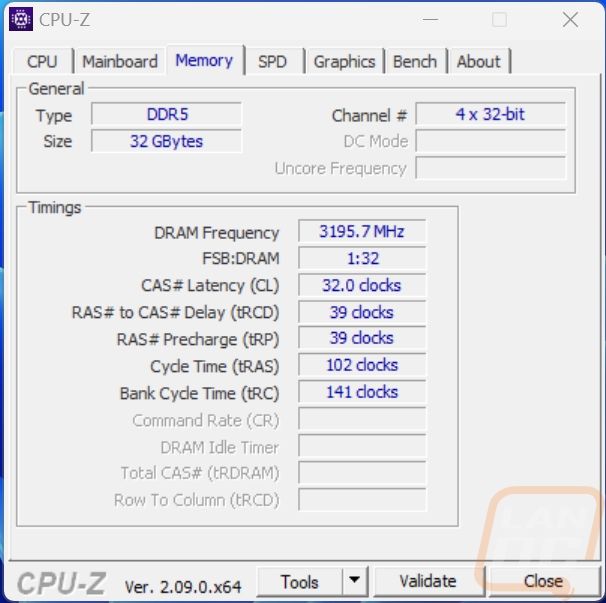
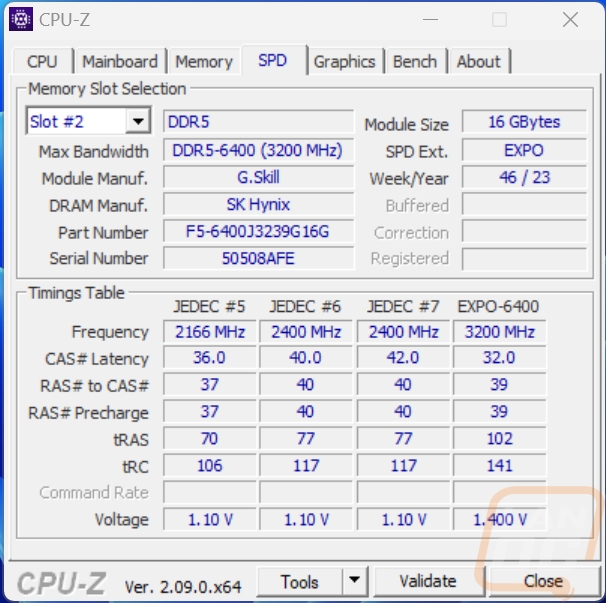
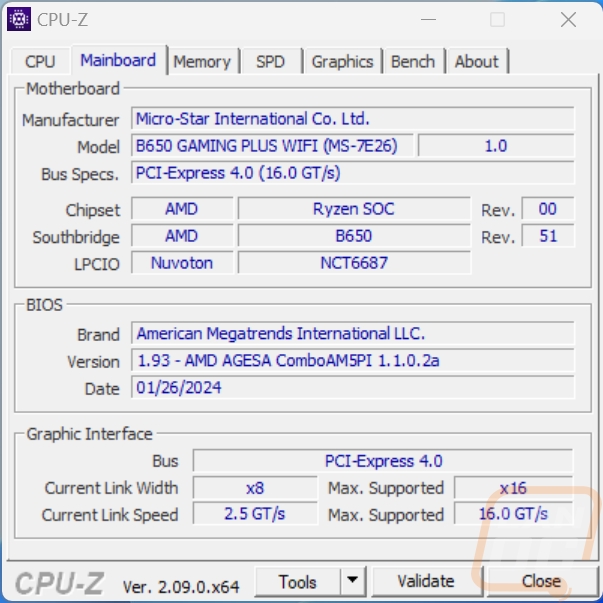
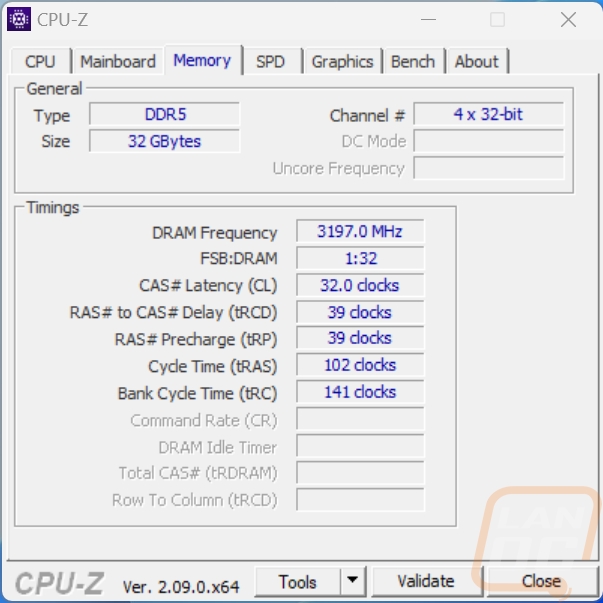
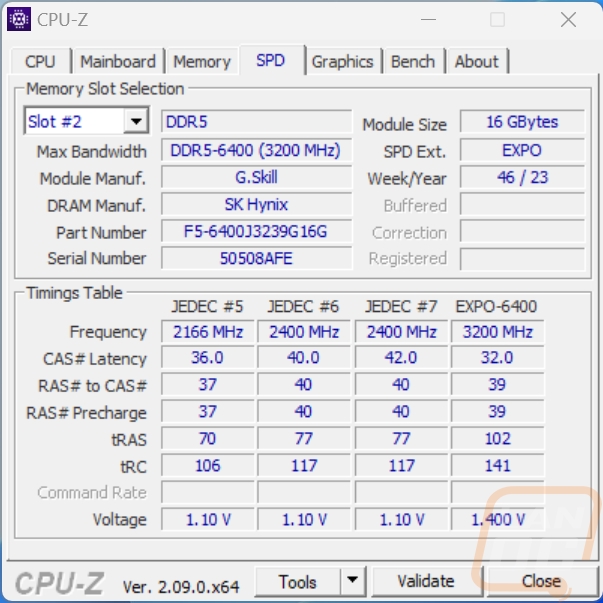
Before getting into testing I did want to point out that AMD did send over a motherboard to go with the two CPUs for testing as well as a memory kit. I would normally test on our ASUS ROG Crosshair X670E Hero but they went with a few specific boards just to make sure members of the press had the correct BIOS ahead of the launch. They sent the MSI B650 Gaming Plus Wifi and really that is a more appropriate motherboard to go with these CPUs. The memory kit was similar to what I ran on our AM5 testbench the G.Skill Trident Z5 Neo RGB 6400 MHz, our normal kit is a 6000 MHz non-RGB version of the same kit.
Test Rig and Procedures
Test System
Motherboard: MSI B650 GAMING PLUS WIFI - Live Pricing
Cooling: Enermax LIQMAXFLO 360- Live Pricing
Noctua NT-H1 Thermal Paste - Live Pricing
Memory: G.Skill Trident Z5 Neo RGB DDR5 16GBx2 6400MHz - Live Pricing
Storage: Kingston FURY Renegade 2TB PCIe 4.0 SSD- Live Pricing
Video Card: Nvidia RTX 4090 FE - Live Pricing
Power Supply: be quiet! Dark Power Pro 13 1600W- Live Pricing
Case: Primochill Wetbench - Live Pricing
OS: Windows 11 Pro 64-bit - Live Pricing
|
CPU Testing Procedures |
|
|
Blender |
Using the official benchmark using 3.6 |
|
Handbrake |
Tested using 2d 4k 60 FPS version, resized using the Fast 1080p30 preset, average FPS used. Here is the file download location http://bbb3d.renderfarming.net/download.html |
|
Cinebench R20 |
CPU and CPU (Single Core results) |
|
Cinebench R23 |
CPU and CPU (Single Core results) |
|
Cinebench 2024 |
Multi and Single Core tests |
|
POV-Ray |
Using built-in benchmark. Settings are all set to the "Standard Benchmark Switches" listed on http://www.povray.org/download/benchmark.php |
|
V-Ray Benchmark 1.0.8 |
CPU Benchmark time used as the score |
|
V-Ray Benchmark 5.0.2 |
vsamples score |
|
CPUz |
CPUz's built-in benchmark on 17.01.64 version, both single and multi-core scores |
|
wPrime |
1024M Setting, core count set to the number of threads the CPU has |
|
7-Zip |
Built-in benchmark set to 32MB, which runs 10 passes. Combined MIPS, Compressing, and Decompressing scores were all used. Just the Current result, not the resulting |
|
JetStream 2 - BrowserBench |
Core from website test using Chrome https://browserbench.org/JetStream2.0/ |
|
Passmark |
CPU Mark Score with Passmark 10 and the newer Passmark Performance Test 11 as well |
|
Crossmark |
Benchmark from BapCo using Revision 1.2 documenting the overall score |
|
PCMark 10 |
Normal test ran, not the express or extended |
|
Procyon |
Office productivity benchmark is done with the current Microsoft Office 365, Photo Editing Benchmark is done with Adobe Photoshop and Lightroom Classic. All products are running on the latest version at the time of testing |
|
Dolphin 5.0 Benchmark |
This benchmark runs automatically and at the end gives you a time result in seconds https://bit.ly/2dpa9n3 |
|
3DMark |
Fire Strike - Physics Score – Performance benchmark, Time Spy - CPU Score, and CPU Profile test |
|
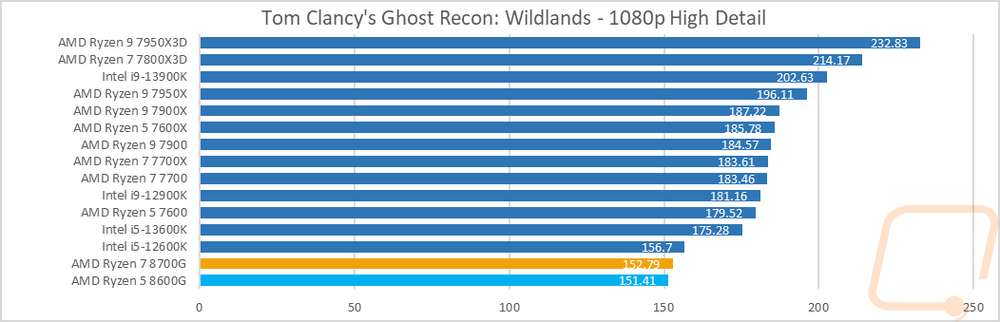
Tom Clancy's Ghost Recon: Wildlands |
Built-in Benchmark, 1080p, High detail setting |
|
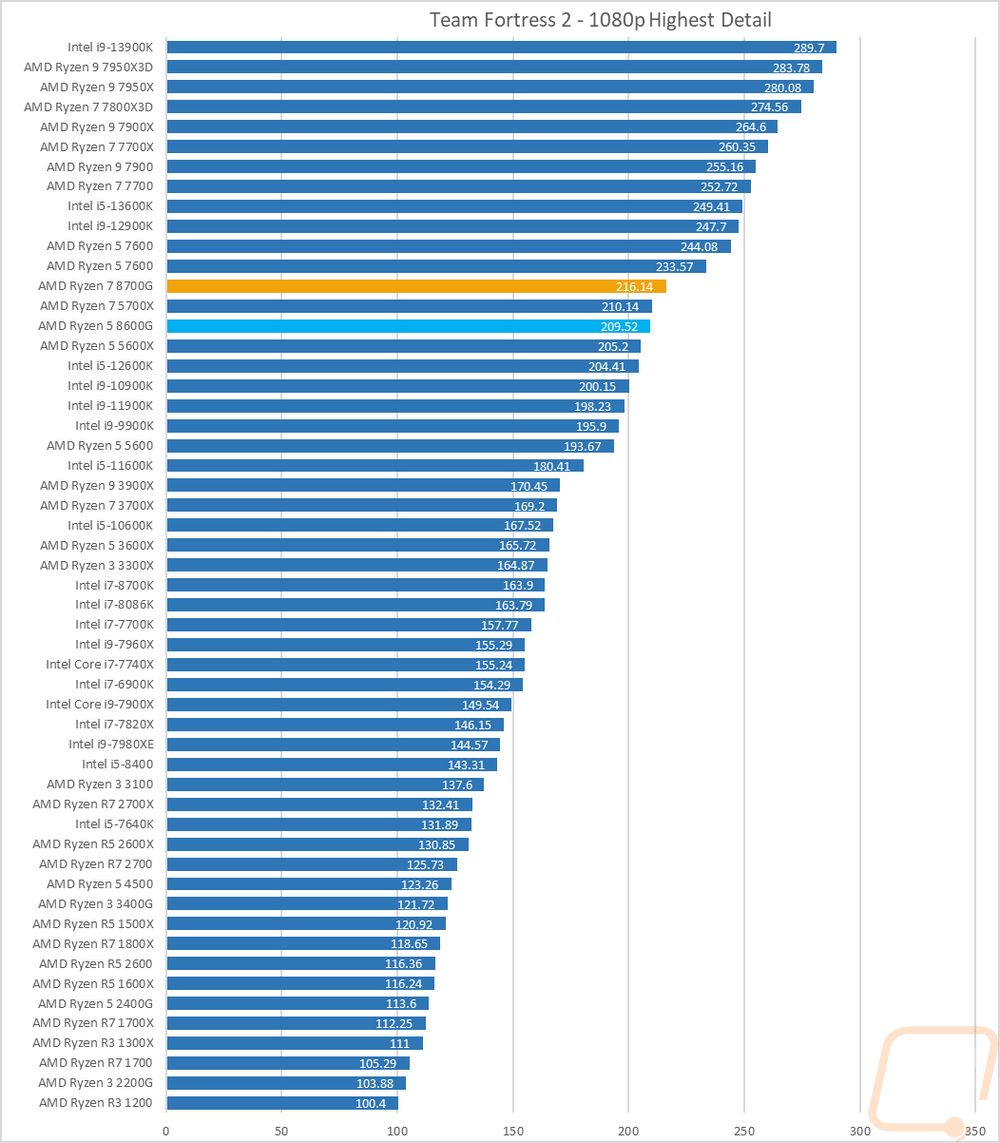
Team Fortress 2 |
1080p – high, very high, high, reflect world, high, enabled, 8x msaa, x16, multicore on. TF2 version is locked to previous version that supports older replay files currently until this issue is fixed https://bit.ly/2vOebin |
|
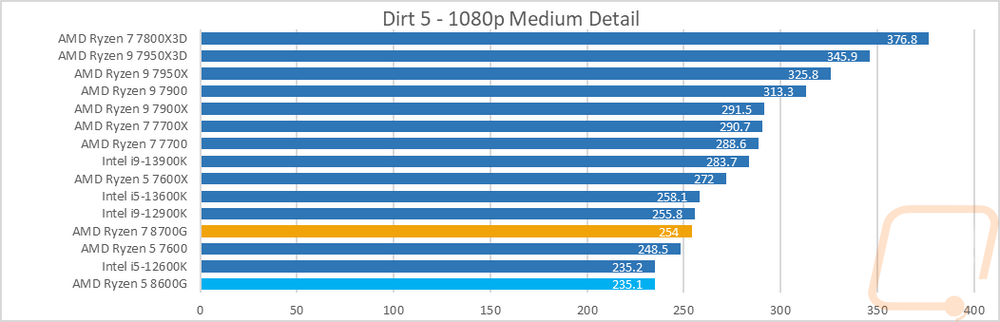
Dirt 5 |
Built-in benchmark, running at 1080p on all three resolution settings, V-Sync is turned off, dynamic resolution is turned off, and on the medium detail setting |
|
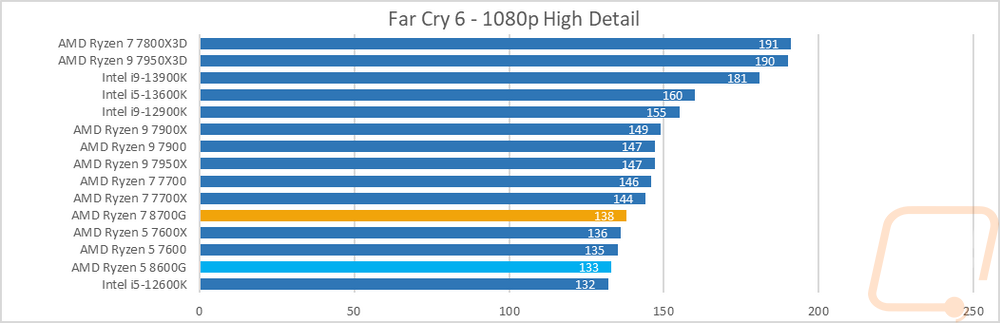
Far Cry 6 |
1080p with High Detail setting using the built-in benchmark |
|
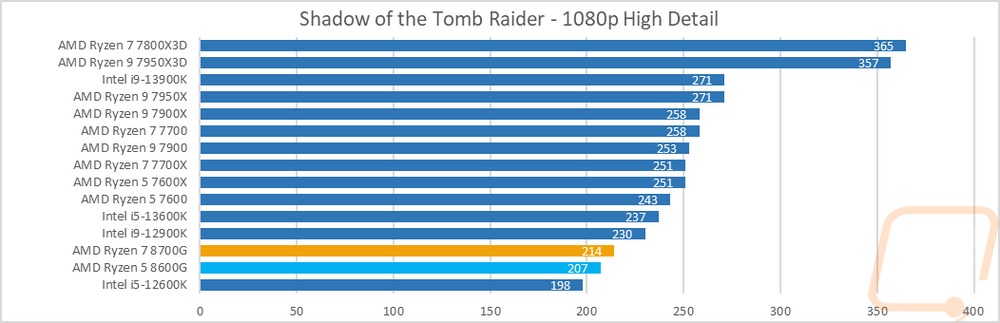
Shadow of the Tomb Raider |
Built-in benchmark, 1080p, high detail setting, RTX/DLSS Off |
|
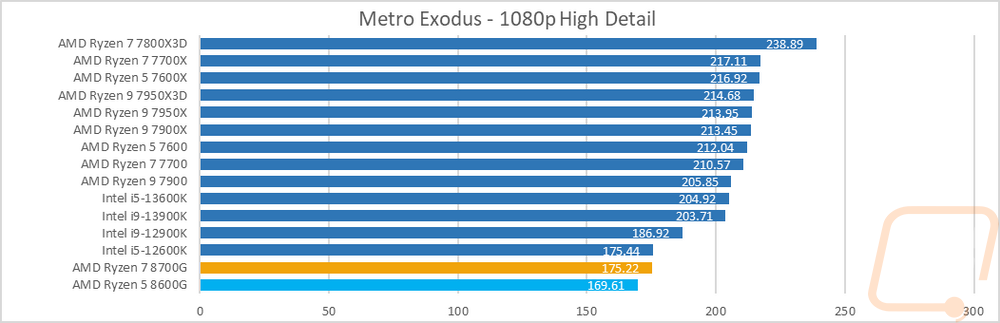
Metro Exodus |
Default benchmark with High profile which has 1080p and high detail |
|
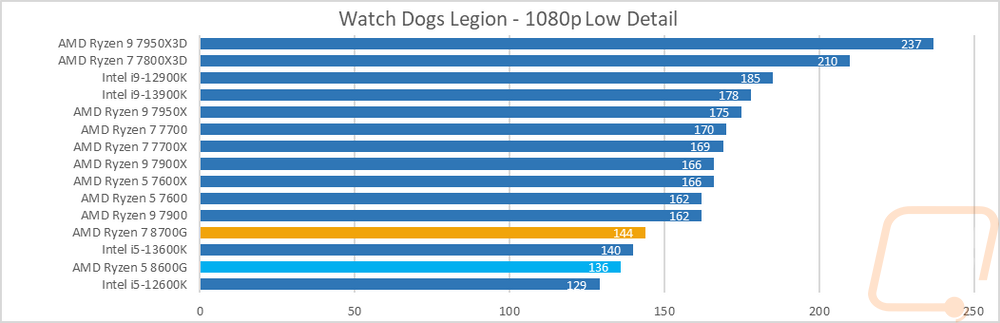
Watch Dogs Legion |
Built in benchmark, 1080p, dx12, low detail |
|
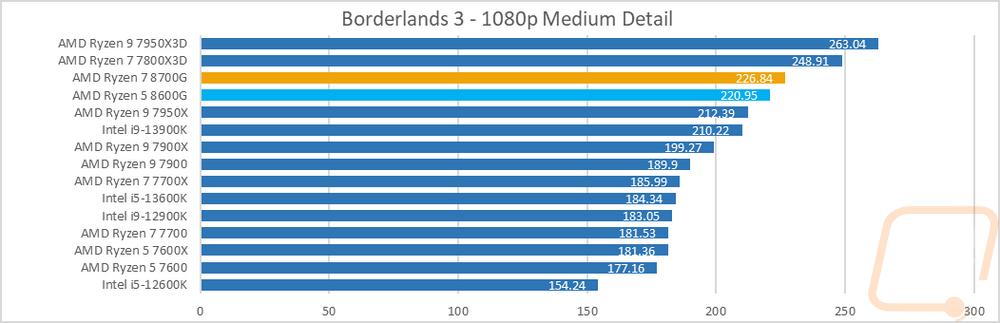
Borderlands 3 |
Built-in benchmark. fullscreen, 1080p, medium quality, dx11 |
|
Power Usage |
Idle and load testing using a Kill-A-Watt and wPrime to put the CPU under load and again with the AIDA64 FPU CPU workload |
|
Temps |
Aida64 FPU stability test to load and record temperature readings |
|
AIDA64 |
Memory, Cache, and FLOPS testing done with built-in GPGPU and Memory benchmarks |
|
Onboard Testing Procedures |
|
|
3DMark |
Fire Strike and Time Spy benchmarks GPU score not the overall score |
|
Unigine Superposition |
720p Low and 1080p Medium settings |
|
Team Fortress 2 |
1080p – high, very high, high, reflect world, high, enabled, 8x msaa, x16, multicore on. https://bit.ly/2vOebin |
|
Tom Clancy's Ghost Recon: Wildlands |
Built-in Benchmark, 1080p, Low detail setting |
|
Tomb Raider |
Adrenaline Action Benchmark Tool on the “Medium” quality setting at 1080p |
|
Hitman: Absolution |
Adrenaline Action Benchmark Tool on the “Medium” quality setting at 1080p |
|
Borderlands 3 |
In-Game benchmark, 1080p, Low detail preset |
|
Far Cry 5 |
1080p, Lowest Detail setting, In-game benchmark |
|
Shadow of the Tomb Raider |
1080p, Low Detail setting, In-game benchmark, RTX/DLSS off |

CPU Performance
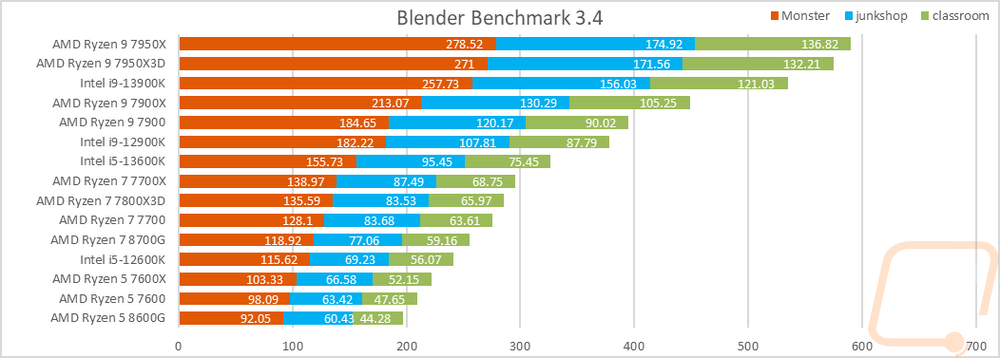
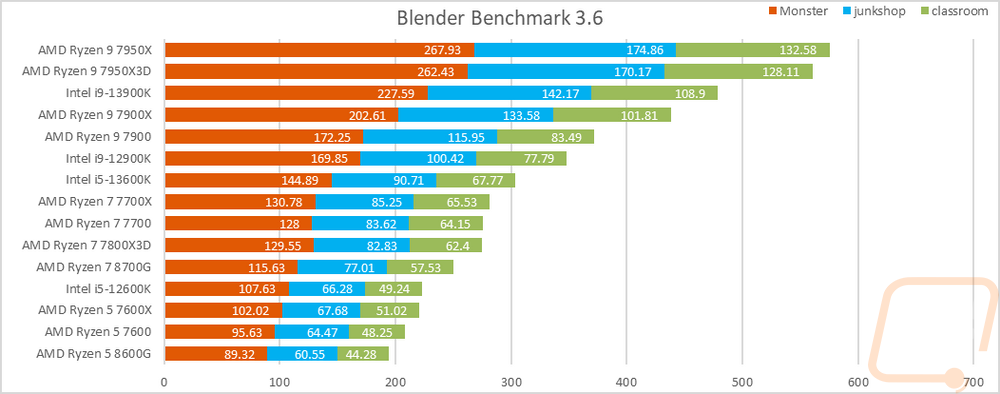
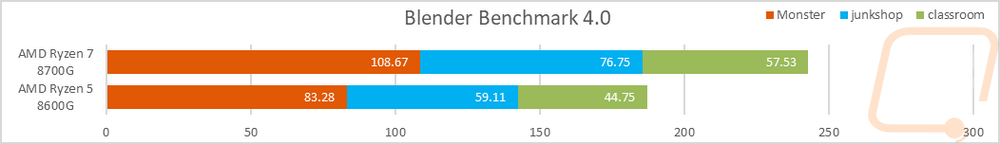
To start testing off I went with a rendering-focused benchmark with the always popular Blender. This software is always updating and with that the benchmark changes as well so I have run with a few versions here simply because with the latest 4.0 version I haven’t had the chance to get more CPUs on the bench to compare against the 8700G and 8600G. I have all three tests stacked together so we can see an overall of them altogether. Blender loves the higher core counts but clock speed does still make a difference. But how did the two new CPUs perform? Well In Belnder 3.4 and 3.6 the combined results put the 8700Gjust under the 7700 and 7700X which is about where I would expect it to be. The 8600G is farther down the chart of course and is at the bottom of the CPUs tested below the Ryzen 5 7600 on both.
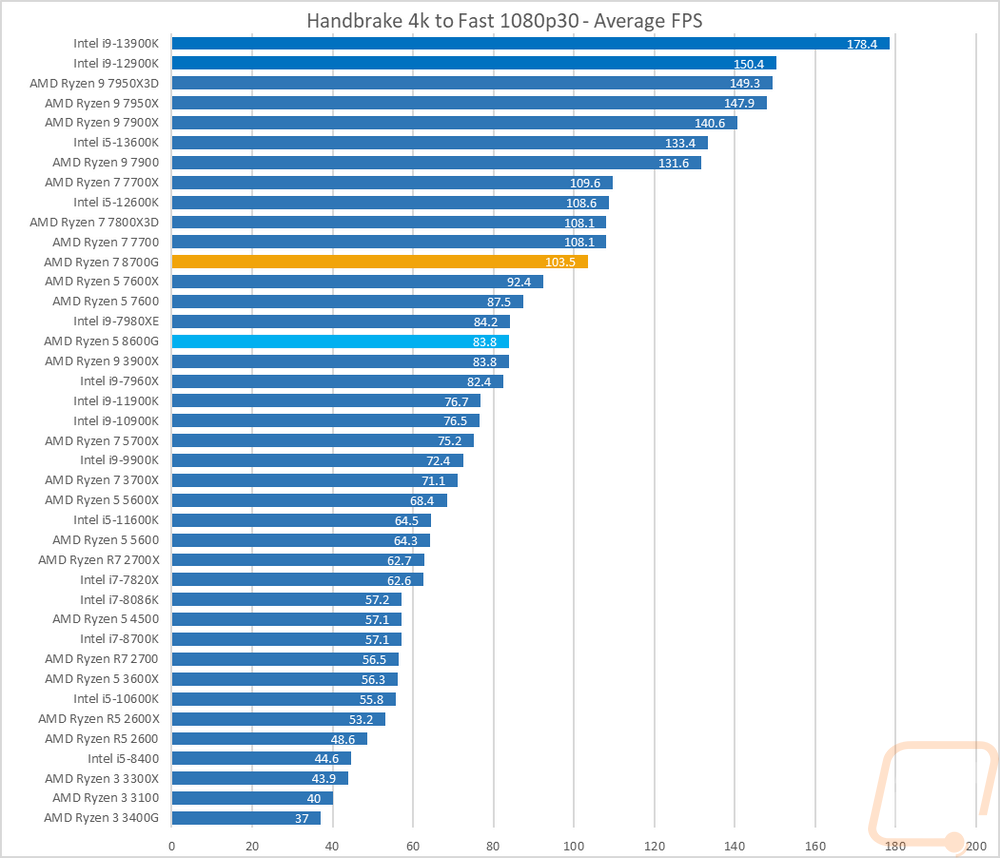
Continuing with the video encoding theme I also have Handbrake which is an open-source transcoder. For this test I am taking a 4k video down to 1080p 30 FPS, the results are the average FPS of that task. The 8700G at 103.5 FPS is right behind the 7700 and the 7800X3D. The 8600G is behind the 7600 as well as behind a few of the old high core count Intel’s from the older enthusiast platform that would run alongside of the Xeon line. This puts it ahead of CPUs like the i9-11900K and 10900K which were monsters when they came out.
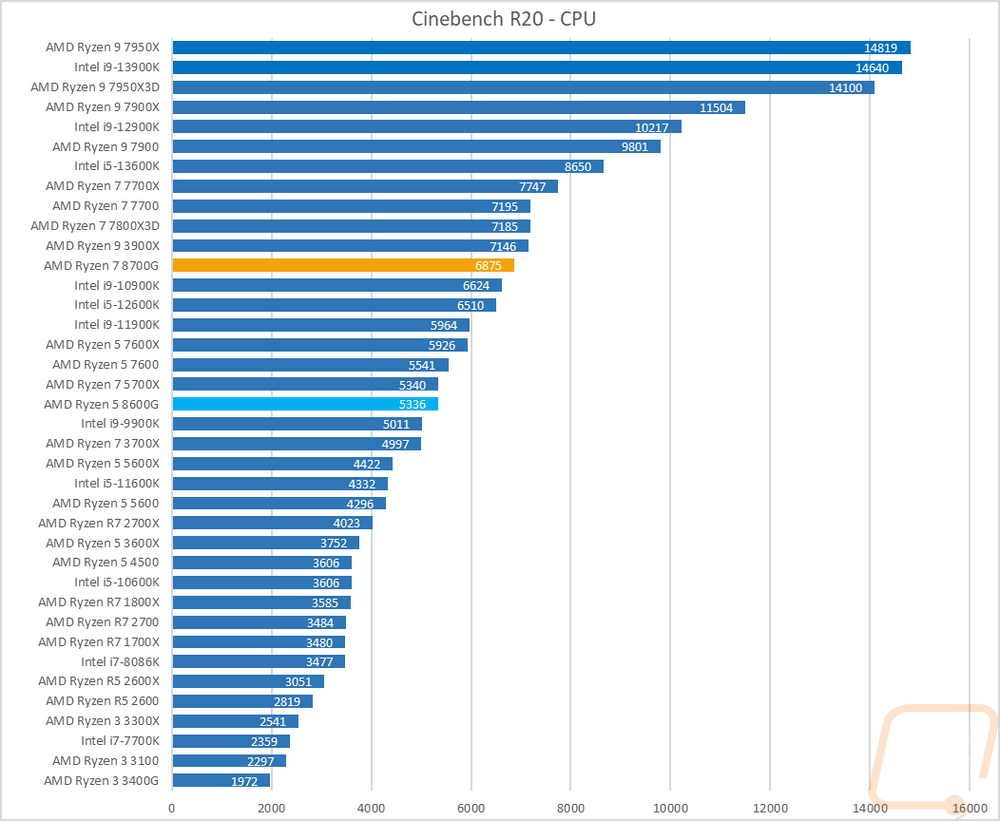
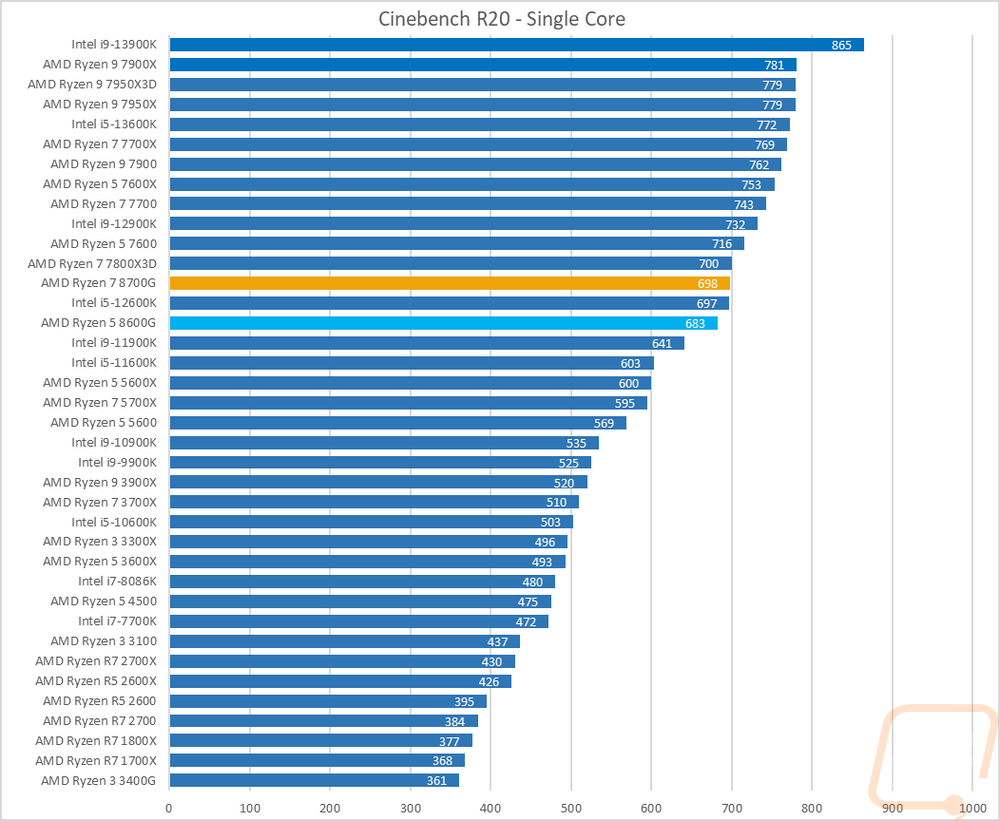
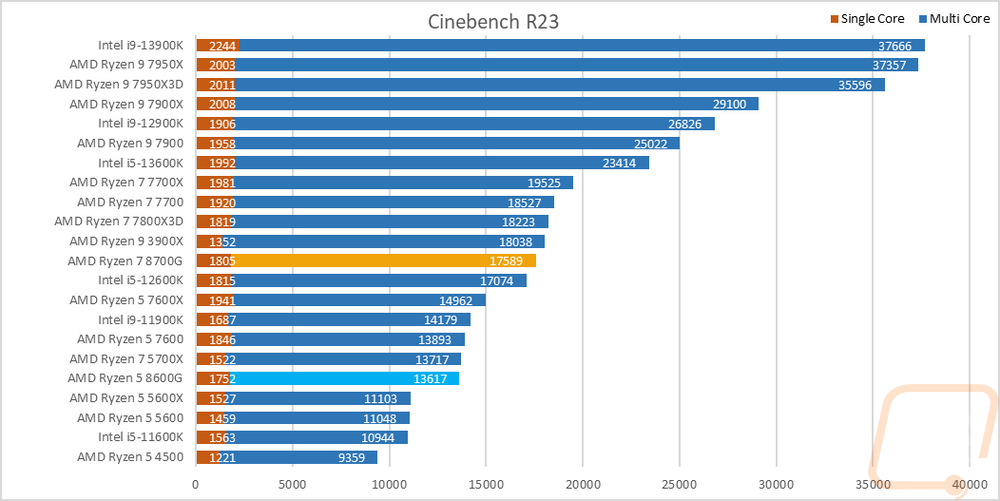
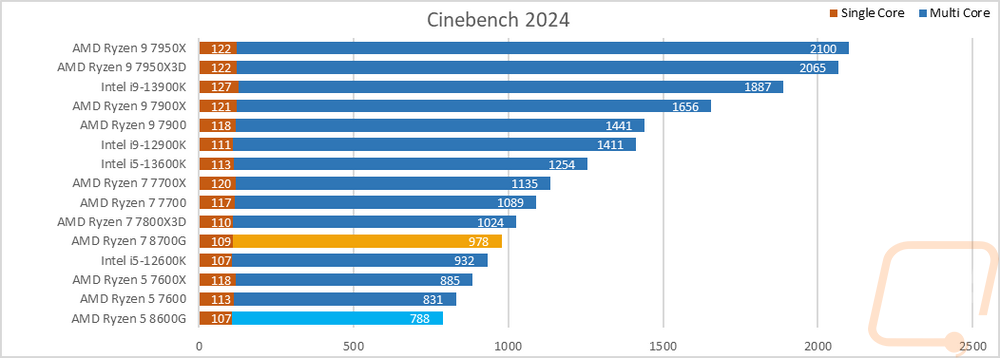
For the always popular Cinebench, I am testing with the older Cinebench R20 and R23 as well as the new 2024 edition as well. I always like Cinebench because we have multi-core and single-core performance which gives us a good look at the performance of the whole CPU and IPC performance. In R20 on the multi-core test, the 8700G is again right behind the Ryzen 7 7700. The 8600G on the other hand is a little farther down with its lower core count but still did well sitting behind the Ryzen 5 7600. For their single core results in R20, they are both up farther in the chart with the 8700G being slightly higher and right with the 7800X3X and the 8600G just behind the 7600. In R23 the 8700G is behind the 7700 on both multicore and single-core tests. The 8600G with its 13617 score is just behind the Ryzen 5 7600. Then in the latest 2024 test, the 8700G scored a 978 which I know I sound like a broken record but put it right behind the 7700 and the 788 for the 8600G put it at the bottom of the chart behind the 7600.
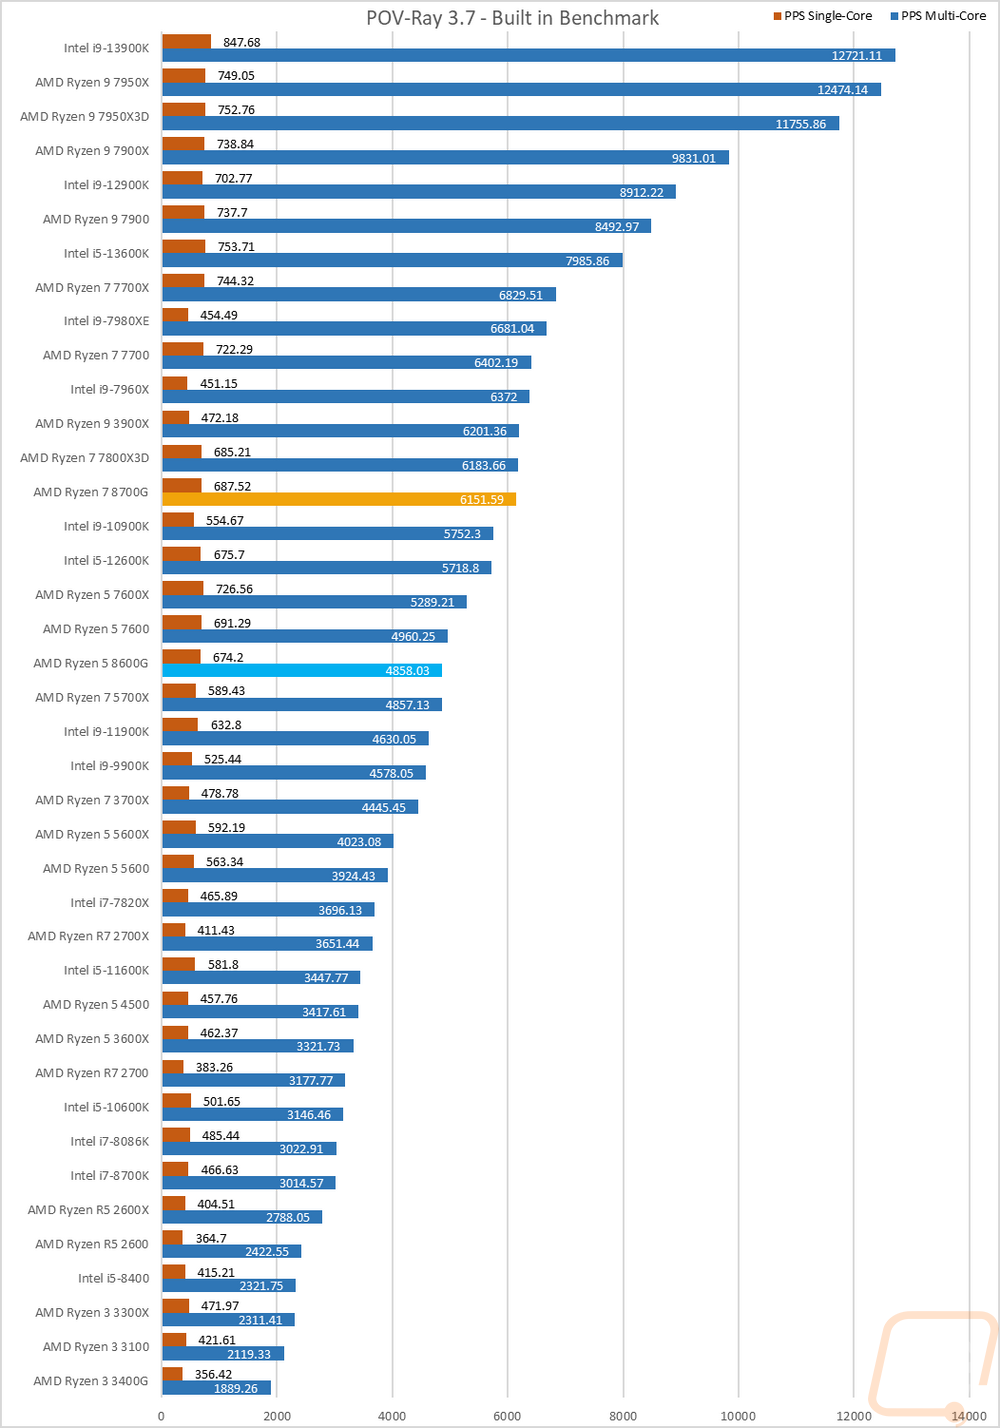
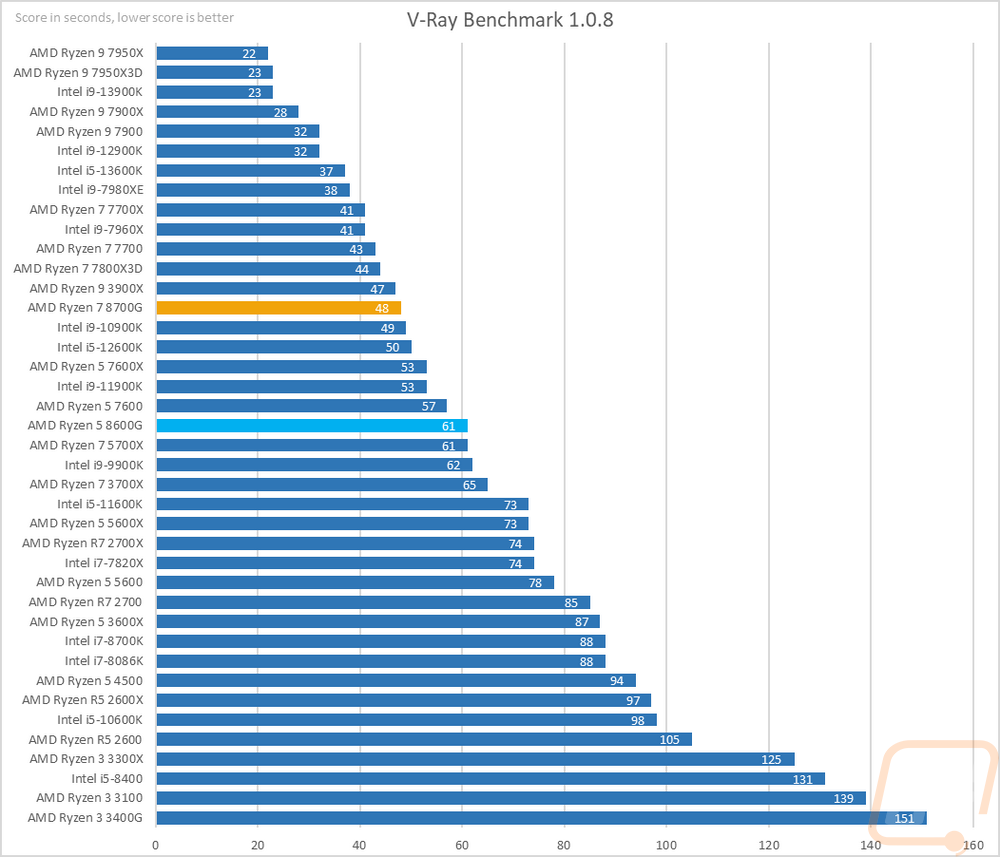
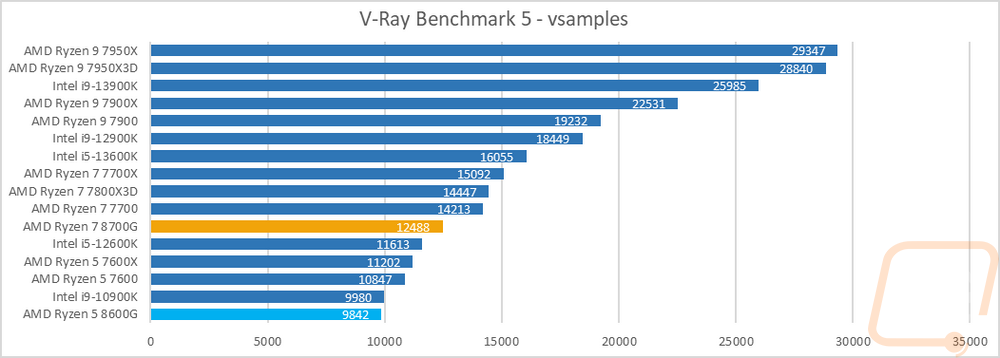
Next up we have ray tracing-focused rendering benchmarks. Here I tested the CPUs in POV-Ray and V-Ray including the newer V-Ray Benchmark 5. POV-Ray was also tested with a single core and across all of the cores. The 8700G scored a 6151 for the multi-core POV-Ray score putting it behind the 7800X3D and similar on its single-core score. The 8600G on the other hand was down farther at 4858 behind the 5700X and the 7600. In the older V-Ray 1.0.8, the 8700G came in at 48 seconds, with the 7800X3D being the closest modern CPU there and the 7700 just ahead of that. The 8600G on the other hand at 61 seconds was tied with the 5700X and just behind the 7600. In the newer V-Ray Benchmark 5, the 8700G scored 12488 which put it behind the 7700 with a big gap between the two, and the 8600G scored a 9842 putting it at the bottom of the chart behind the 10900K.
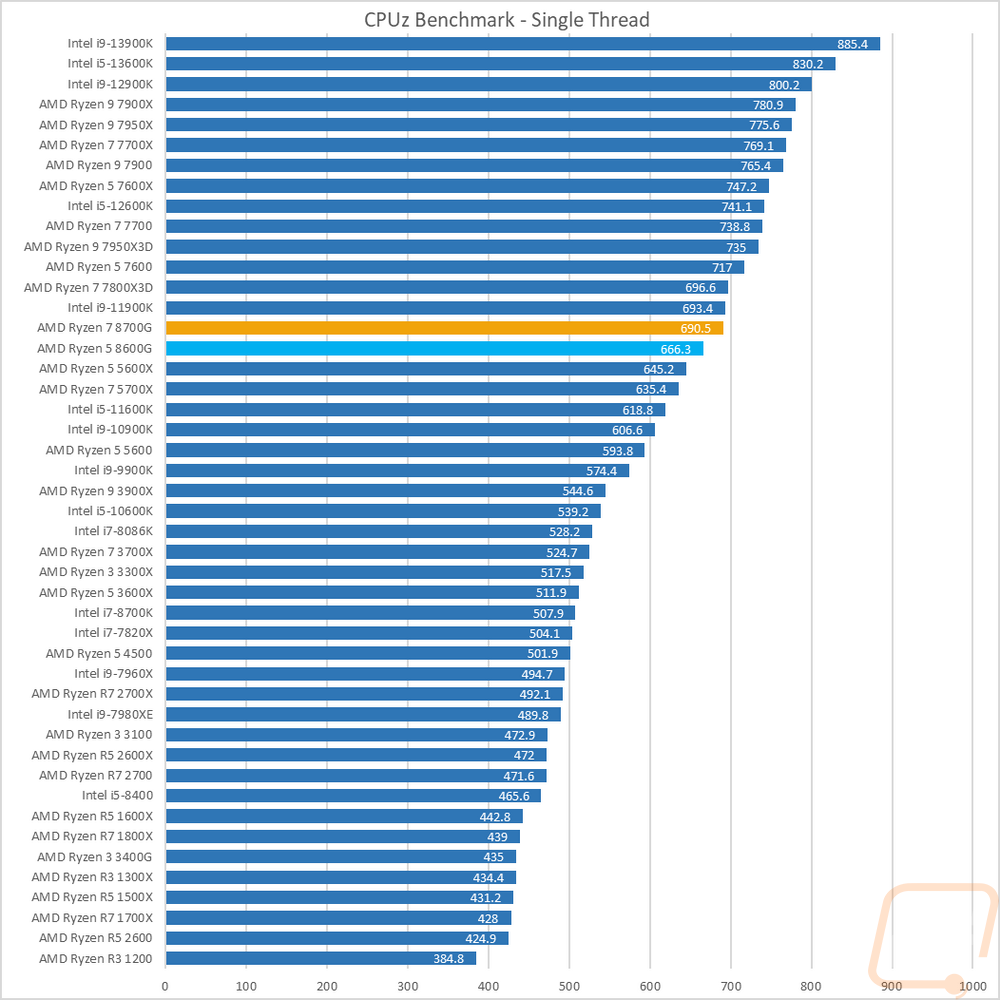
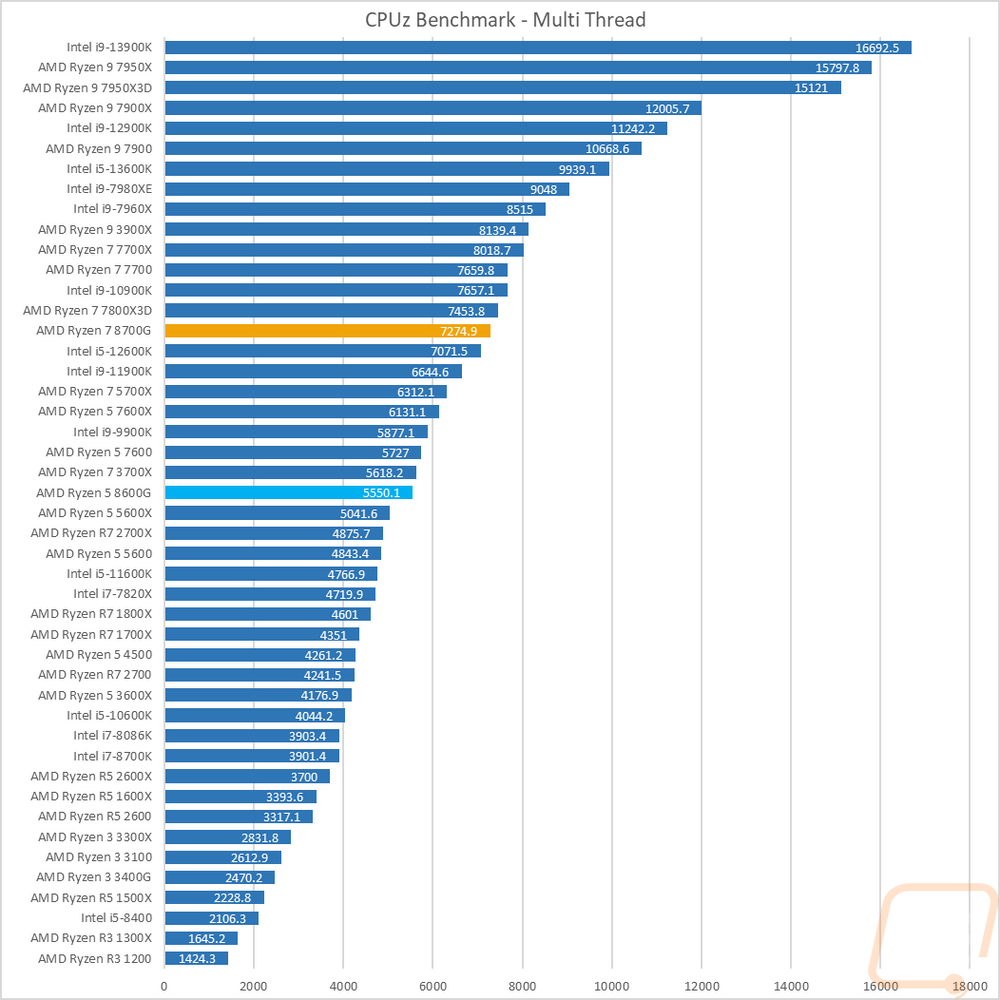
I also tested using the CPUz’s built-in benchmark which does run on a single thread and with all threads. In the multi-thread test, the 8700G scored 7274 putting it right behind the 7800X3D again. The 8600G on the other hand with its 6 cores was lower with a 5550 putting it behind the 5700X and 7600. For single-core results, the 8600Ga and 8700G are a lot closer. The 690.5 for the 8700G is behind the 11900K and not far behind the 7800X3D. The 8600G had a 666.3 which puts it behind the 8700G.
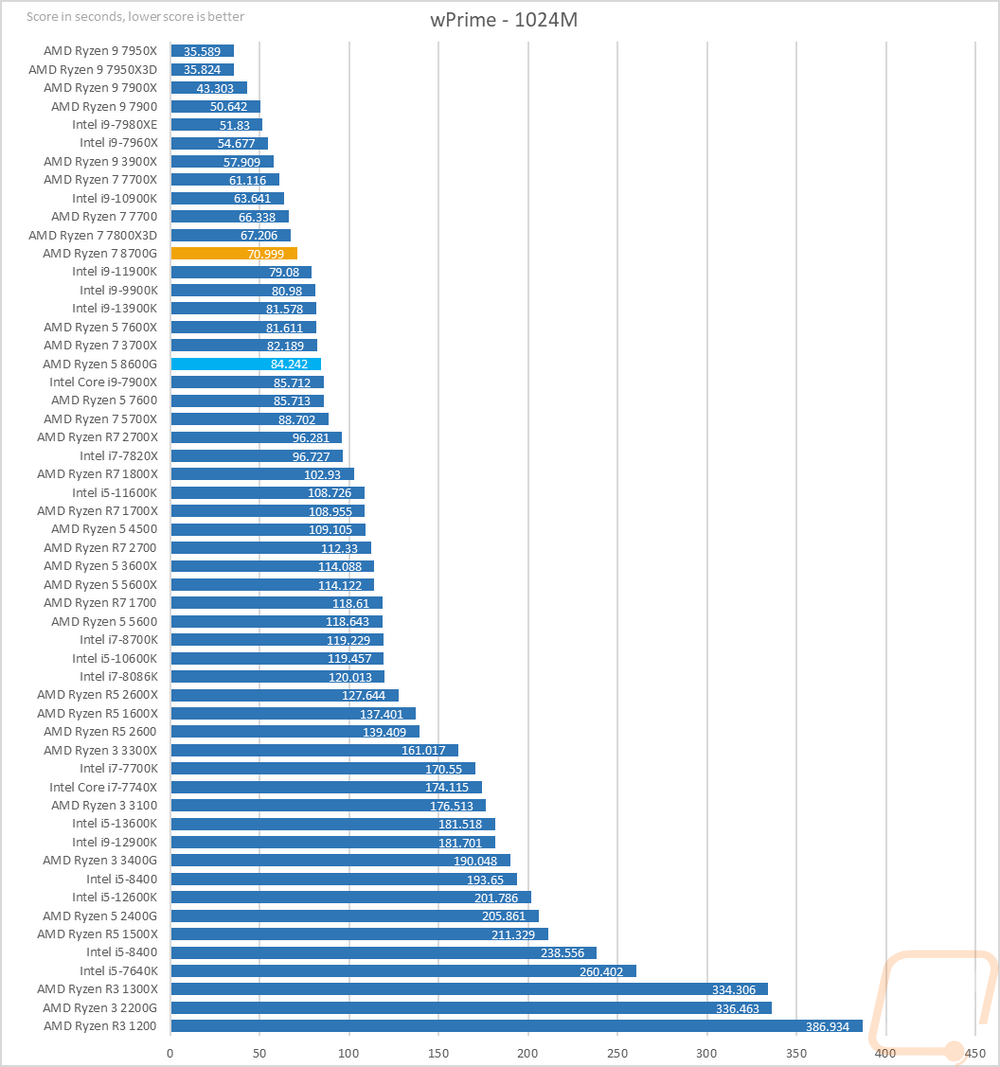
Next, we have wPrime which is a classic overclocking benchmark that calculates pi out to 1024 million digits and is timed. This is a multi-thread heavy test which has the older high-core count CPUs still all over the top of the charts and you can see that with the top CPUs sitting at 8 or more cores. The 8700G with its 8 cores came in with a 70.999 putting it behind the 7700 but ahead of the 11900K. The 8600G took 14 seconds longer with its 84.242 score putting it ahead of the Ryzen 5 7600.
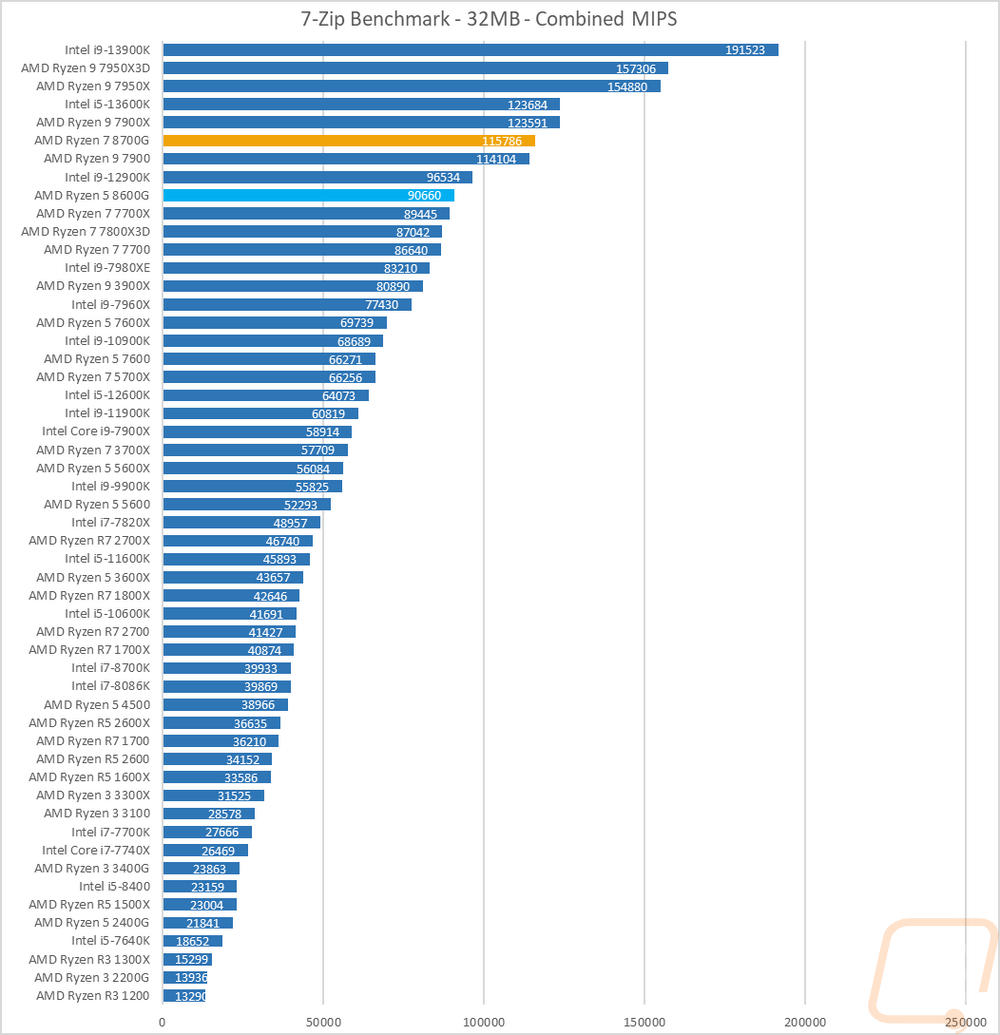
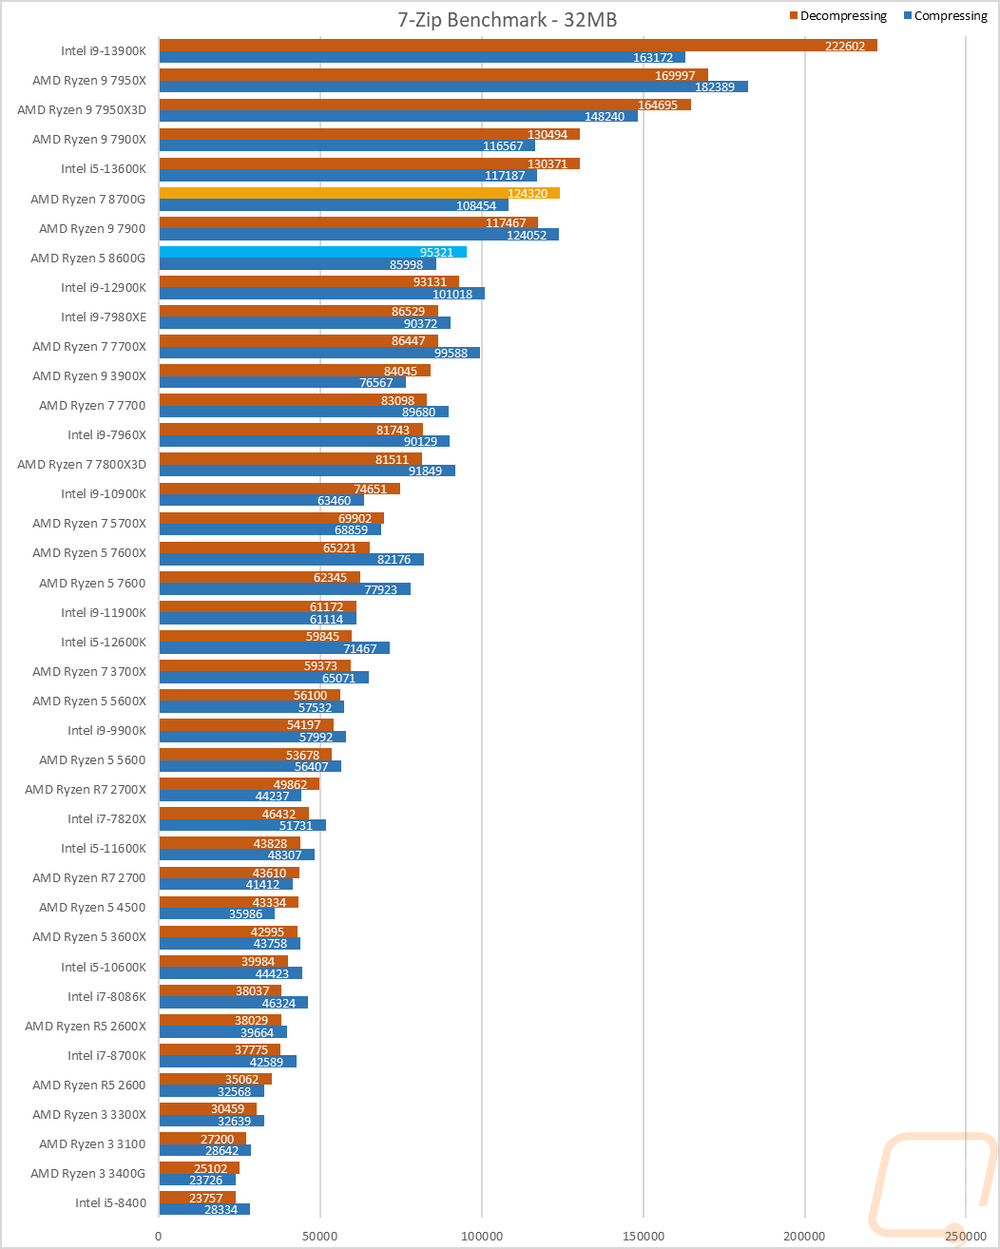
7 Zip is another open-source program, this time for compressing and decompressing all of your files. Here I have run the benchmark and we have three results. The combined MIPS is a combination of compressing and decompressing performance. Then I have it broken down between the two. The combined results have the 8700G with a score of 115786 which was surprisingly good, putting it up ahead of the Ryzen 9 7900 and behind the 13600K. The 8600G also did well with a 90660 putting it ahead of the 7700X. The split results show the same thing and show that both CPUs favored the decompressing test with that ahead on both whereas most CPUs favor the compression test.
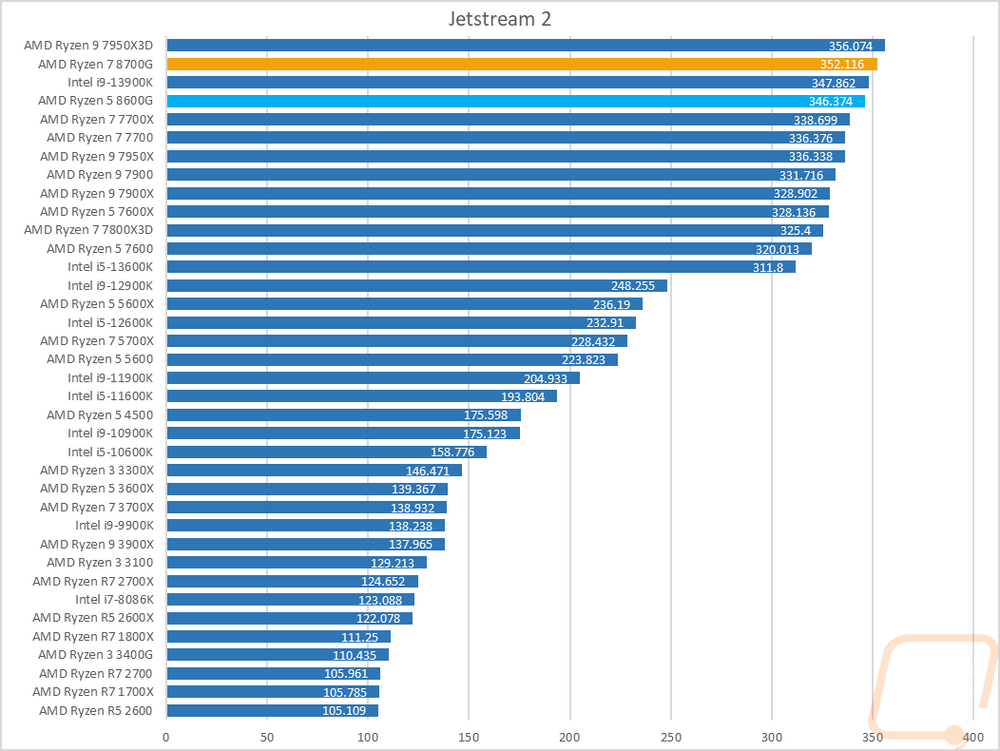
Jetstream 2 is a compilation benchmark that takes a long list of HTML5 and Java in-browser tests and runs them all three times and puts together an overall score. I love this benchmark because let's be honest, most people are using their browser more than any other game or program. Jetstream gives some interesting results sometimes though but it tends to prefer high IPC or single-core performance and there are some situations where it prefers lower core-count CPUs. The 8700G and 8600G are a great example of where this test doesn’t always care about the highest-end CPUs, both scored right up in the top end behind the 7950X3D.
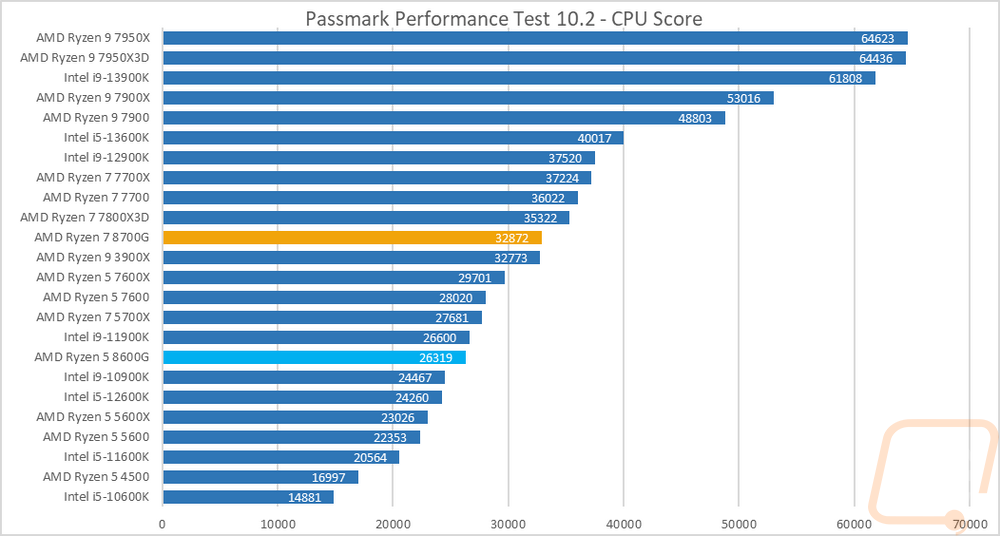
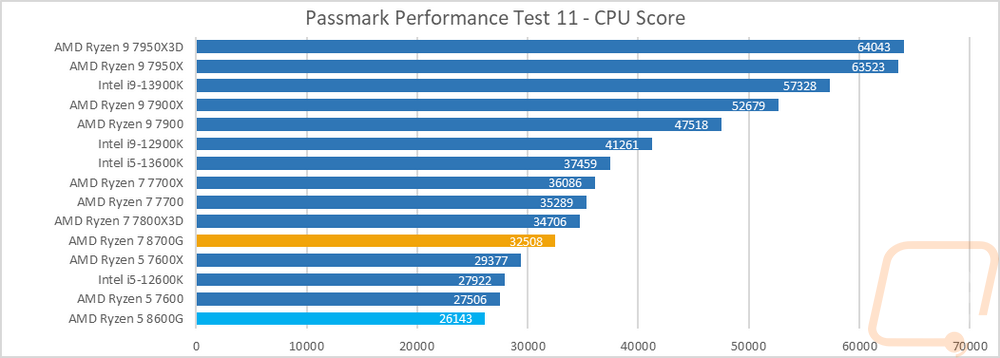
For Passmark Performance Test I used the latest version, Performance Test 11 and also tested with the older Performance Test 10 as well. I only look at the overall CPU score which takes a few different synthetic benchmarks and combines the results to put together an overall score. This is a test that does favor multi-threaded performance over IPC. In Performance Test 10 the 8700G came in behind the 7700, no surprises there, and the 8600G was just behind the 5700X and 7600, again no surprises. In Performance Test 11 the 8700G is just behind the 7800X3D and the 7700. The 8600G is down at the bottom of the chart behind the 7600 and the 12600K.
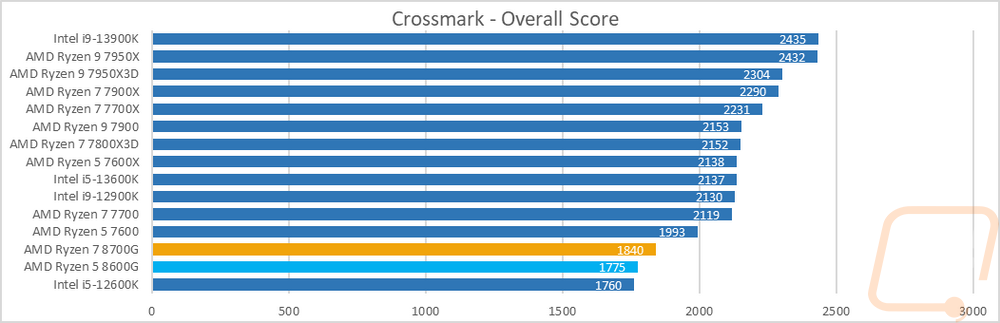
Crossmark is from BAPCo which also makes SYSmark and this is a cross-platform test where you can compare performance between phones and both Windows and Mac computers. This is the start of our overall PC benchmarks and Crossmark uses a mix of real-world tests to output an overall score. The 8700G scored an 1840 which wasn’t as high as I expected it to be. This put it down below the 7600. The 8600G which is normally behind the 7600 wasn’t far behind, putting it ahead of the 12600K but behind the 8700G.
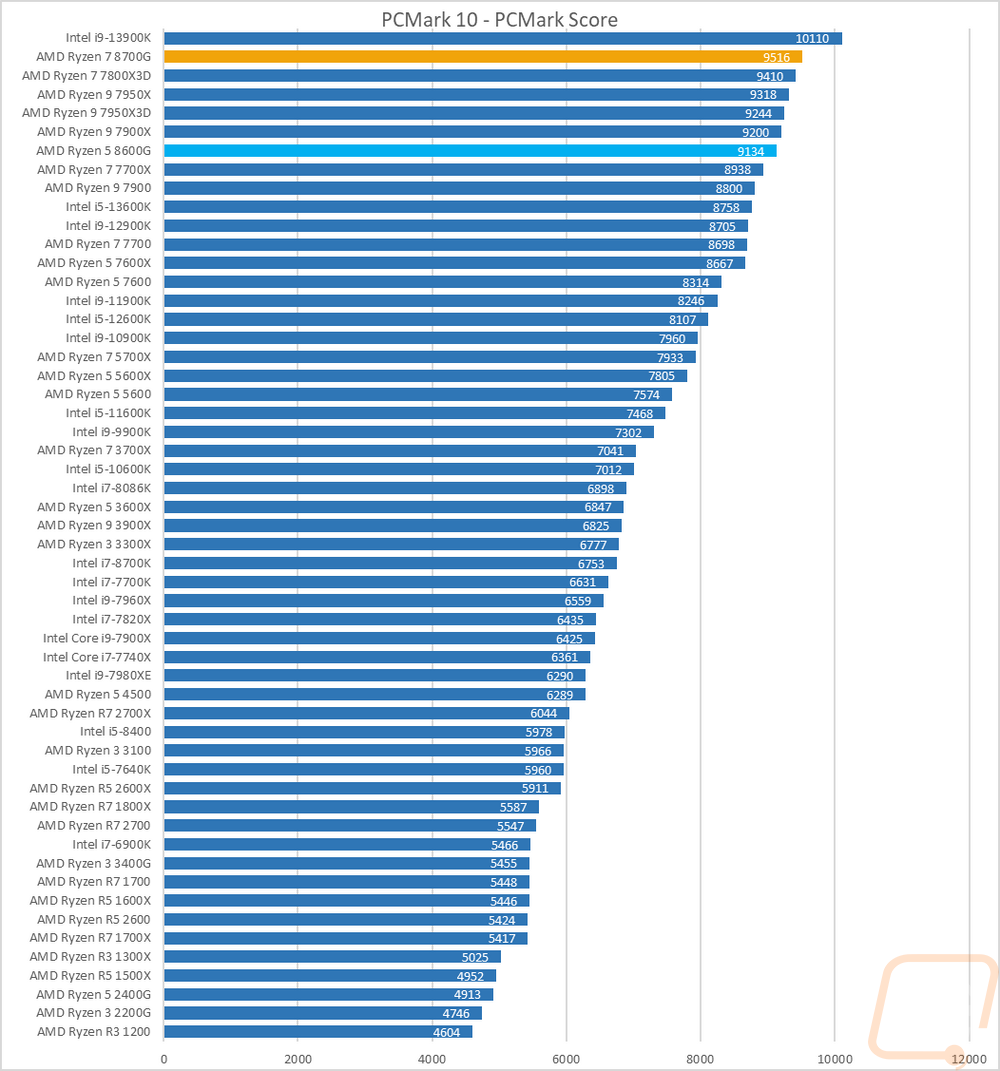
PCMark 10 is a great test because it tests things like video calls, browser performance, Excel, and Word performance to give an idea of real-world performance. It tends to like higher clock speeds but does take raw core count into account as well which you can see. The Ryzen 7 8700G scored a 9516 here which put it right up in the top section of our chart ahead of the 7800X3D and behind the 13900K. The 8600G was down a little lower with its score of 9134 but this is still up in the top group in front of the 7950X even.
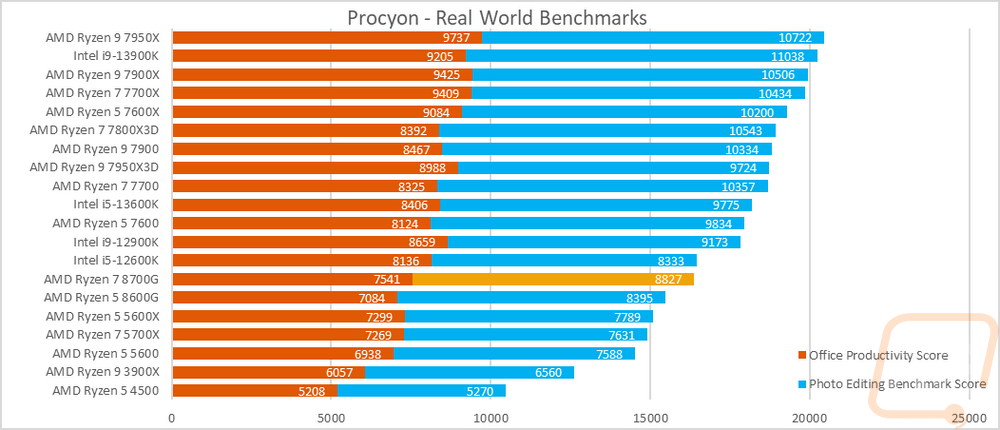
We recently added even more real-world testing with the UL Procyon Benchmarks which are as real-world as they can get using the actual programs that you would use in each test. There are two overall benchmarks, first is the Office Productivity Benchmark which uses Microsoft Office 365 to test actual performance in Word, Excel, PowerPoint, and Outlook. The second benchmark is the Photo Editing Benchmark which is run using the latest version of Photoshop as well as Lightroom Classic to look at photo editing performance. I have both scores stacked together to get an overall look at the performance. The Ryzen 7 8700G has a combined score of 16368 and the 8600G 15479, both are right next to each other here sitting behind the 12600K and ahead of the older 5600X.
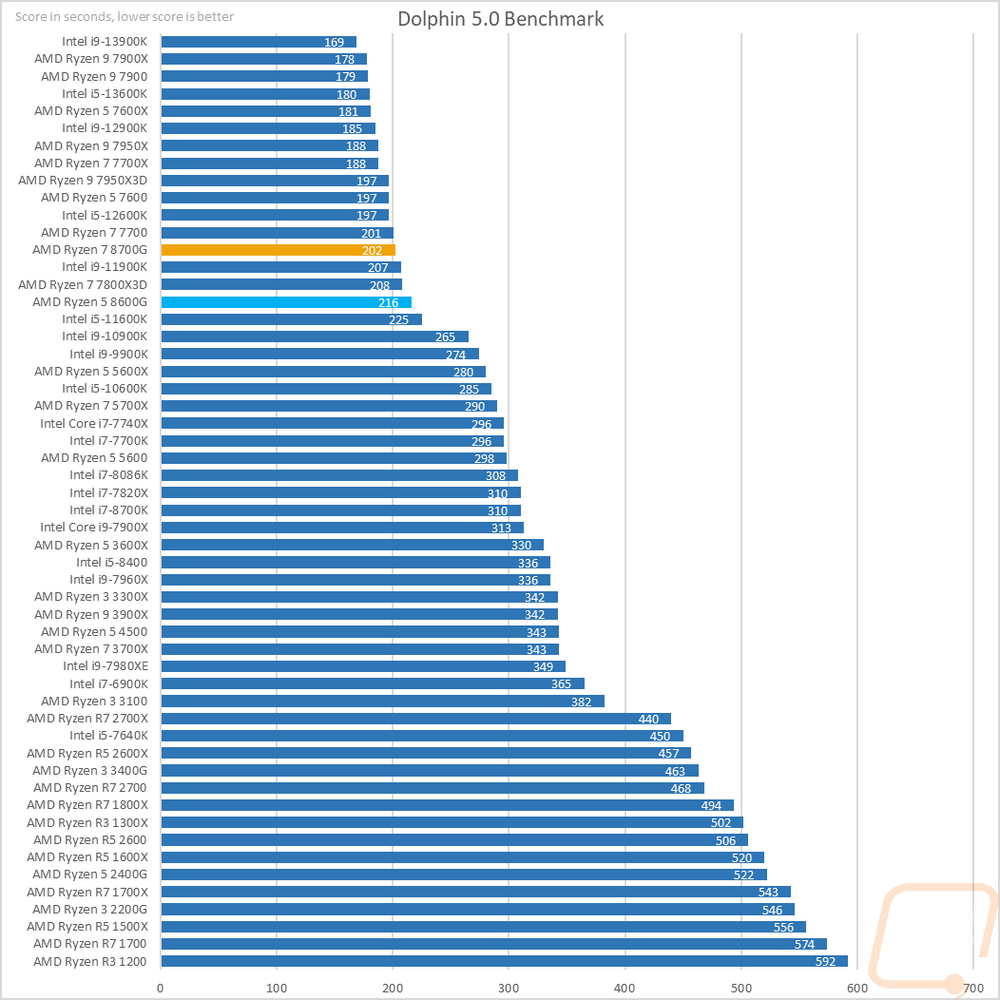
Moving the focus over towards gaming my next test is using Dolphin 5.0 Benchmark. Dolphin 5.0 is a Wii emulator and like most emulators, it doesn’t care about high core counts at all. In fact, it only runs two in total. Clock speeds are king here most of the time which is why all of the 5 GHz+ CPUs are at the top of the chart here. The 8700G took 202 seconds to run the test putting it just behind the 7700. The 8600G took 216 seconds isn’t too far behind the 8700G, at 216 seconds it is behind the 7800X3D.
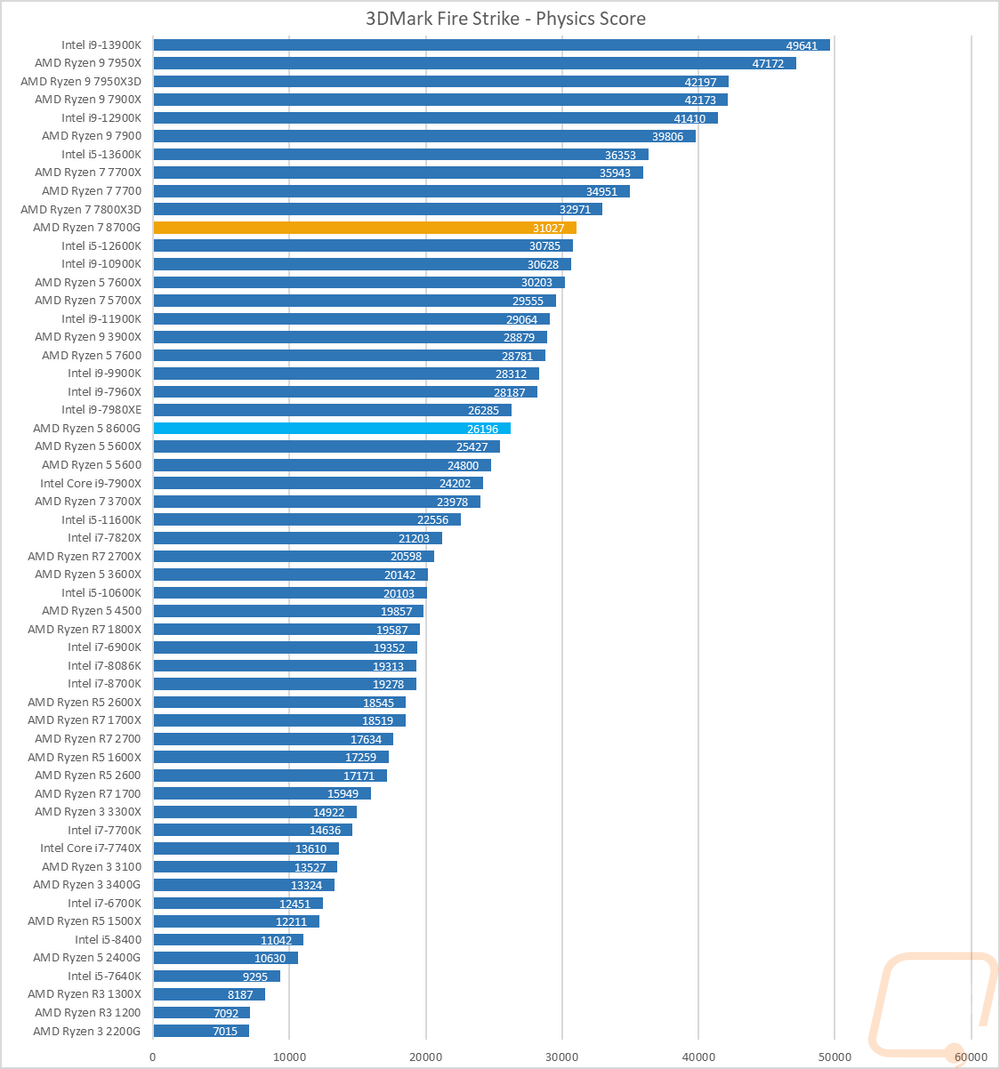
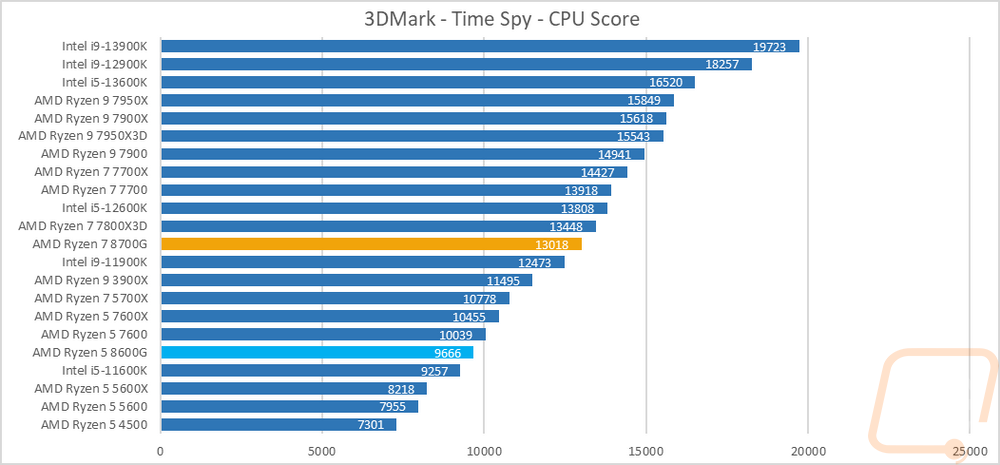
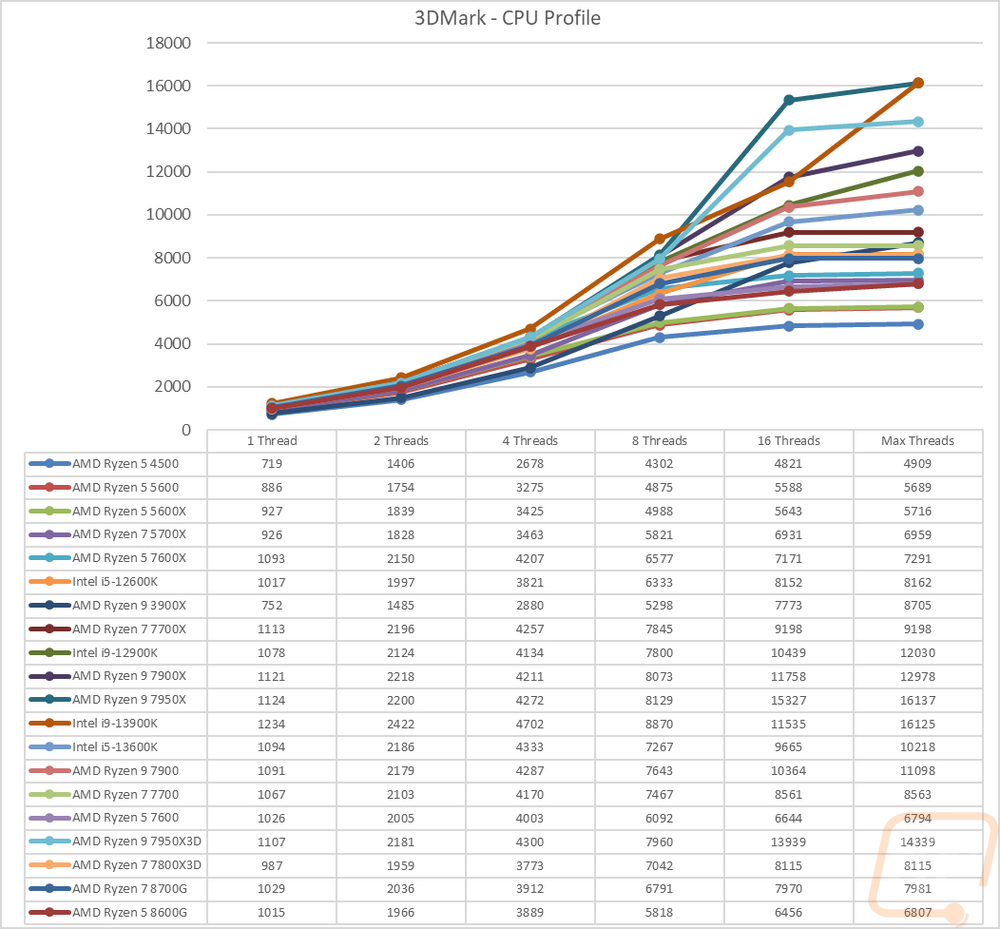
Before diving into game testing I wanted to check out synthetic performance using 3DMark. I tested with the older DX11 Fire Strike test as well as the newer DX12 Time Spy. I also added the new 3DMark CPU Profile benchmark into the mix as well which does a good job of showing the full range of thread counts that you might see being used in games as well as a max threads option that does everything above 16 threads. In the Fire Strike test, the 8700G scored a 31027 in the Fire Strike test putting it behind the 7800X3D which has a big gap between the two. The 8600G is down closer to the middle of the chart sitting ahead of the 5600X and a few CPUs behind the Ryzen 7600. In Time Spy the results are similar but with a smaller gap between the 8700G and the 7800X3D, same with the 8600G and the 7600. In the 3Dmark CPU profile, the 8700G and 8600G hold their own in the early low thread count tests because of their high clock speeds. The 8600G does start to drop off at 8 threads and ends up behind the 7500X in the end. The 8700G does better but ends up behind the 7800X3D once again.
I did of course test the two new CPUs in games as well. I will dive into testing the integrated GPU in the next section. Here though they are paired up with a powerful GPU (the RTX 4090) and I compare CPU to CPU performance. In TF2 where we have a lot of CPUs tested, the game is CPU limited so the difference between the CPUs is a little more obvious. The 8700G came in at 216 FPS sitting behind the Ryzen 5 7600. The 8600G is just 7 FPS below that and sits between the older 5700X and 5600X there. When we get into some of the other games the 8600G is done at the bottom or near the bottom in a lot of the games trading places with the 12600K often. The 8700G did better but is still in the bottom half in most of the games except for Borderlands 3.
Last up I also run a few tests in AIDA64, these take a look at cache performance for L1, L2, and L3 cache as well as memory speeds, Precision FLOPS, and Integer IOPS. With the larger cache size, the Ryzen 7 8700G performed a lot better in the cache tests than the Ryzen 5 8600G did. The 6400 MHz G.Skill memory used helped in the memory speed tests as well whereas the other AM5 Ryzen CPUs were all tested with 6000 MHz memory.
|
AIDA64 |
L1 Cache Read |
L1 Cache Write |
L1 Cache Latency |
L2 Cache Read |
L2 Cache Write |
L2 Cache Latency |
L3 Cache Read |
L3 Cache Write |
L3 Cache Latency |
|
|
GB/s |
GB/s |
ns |
GB/s |
GB/s |
ns |
GB/s |
GB/s |
ns |
|
AMD Ryzen R7 2700X |
999.43 |
502.5 |
1 |
978.03 |
495.12 |
2.8 |
414.95 |
417.71 |
8.8 |
|
AMD Ryzen R5 2600X |
768.13 |
388.05 |
1 |
729.37 |
366.01 |
2.9 |
429.09 |
323.83 |
9.1 |
|
Ryzen 5 2400G |
485.01 |
238.29 |
1 |
459.8 |
232.2 |
3.1 |
222.96 |
181.6 |
9.6 |
|
Ryzen 3 2200G |
460.55 |
227.41 |
1.1 |
352.84 |
177.56 |
3.3 |
137.3 |
171.2 |
10.2 |
|
Intel i7-8700K |
1595.6 |
803.65 |
0.9 |
640.37 |
397.14 |
2.6 |
337 |
213.67 |
11 |
|
Intel i5-8400 |
1417.2 |
710.79 |
1 |
543.81 |
352.9 |
3.1 |
270.89 |
186.82 |
13 |
|
Intel Core i9-7980XE |
3758.3 |
1896.7 |
1.1 |
1671.7 |
1069.9 |
5.6 |
229.61 |
118.4 |
21 |
|
Intel Core i9-7960X |
3532.3 |
1785.2 |
1 |
1571.6 |
1003.5 |
5.1 |
220.22 |
121.04 |
19.8 |
|
Intel Core i7-7820X |
1969.9 |
995.02 |
1 |
884.63 |
574.74 |
5.6 |
114.4 |
103.57 |
19.2 |
|
Intel Core i5-7640X |
1044.8 |
31888 |
1 |
397.26 |
247 |
2.9 |
228.31 |
163.86 |
11.1 |
|
Intel Core i9-7900X |
2418.5 |
709.16 |
1 |
1037.3 |
521.94 |
5.2 |
124.16 |
106.78 |
21.2 |
|
Intel Core i7-7740X |
1102.7 |
561.25 |
0.9 |
424.55 |
304.3 |
2.7 |
287.01 |
186.67 |
21.2 |
|
Intel i7-6900K |
1963.9 |
999.59 |
1 |
710.28 |
310.34 |
4.1 |
243.96 |
195.41 |
14.6 |
|
Intel i7-7700K |
1114.6 |
560.82 |
0.9 |
415.45 |
285.97 |
2.7 |
234.5 |
188.7 |
10.4 |
|
Intel i7-5960X |
1748.5 |
874.6 |
1.2 |
623.08 |
272.77 |
3.5 |
260.72 |
184.92 |
15.3 |
|
AMD Ryzen R7 1800X |
917.46 |
460.16 |
1.1 |
831.95 |
446.37 |
4.7 |
388.18 |
386.01 |
12.4 |
|
AMD Ryzen R7 1700X |
867.89 |
435.33 |
1.2 |
809.29 |
419.38 |
5 |
369.75 |
350.31 |
12.9 |
|
AMD Ryzen R7 1700 |
793.9 |
398.12 |
1.3 |
742.92 |
389.73 |
5.4 |
334.36 |
332.12 |
14.2 |
|
AMD Ryzen R5 1600X |
689.47 |
345.95 |
1.1 |
630.99 |
334.93 |
4.7 |
386.48 |
326.86 |
12.3 |
|
AMD Ryzen R5 1500X |
446.84 |
224.01 |
1.1 |
306.82 |
211.58 |
11.8 |
306.82 |
211.58 |
11.8 |
|
AMD Ryzen R5 2600 |
685.38 |
344.05 |
1 |
669.28 |
333.5 |
3.1 |
381.16 |
320.56 |
9.8 |
|
AMD Ryzen R7 2700X |
849.91 |
426.09 |
1 |
837.76 |
418.75 |
3 |
357.51 |
356.71 |
9.4 |
|
Intel i7-8086K |
1596.4 |
803.56 |
0.9 |
623.36 |
423.53 |
2.6 |
380.04 |
243.73 |
10.9 |
|
Intel i9-9900K |
2375.6 |
1195.4 |
0.8 |
907.65 |
626.34 |
2.4 |
302.01 |
221.1 |
11 |
|
AMD Ryzen 9 3900X |
3098.6 |
1551.4 |
0.9 |
1545.3 |
1416.8 |
2.8 |
1014.4 |
836.39 |
11.5 |
|
AMD Ryzen 7 3700X |
2133.2 |
1072.9 |
0.9 |
1069.1 |
993.49 |
2.8 |
611.53 |
573.21 |
10.2 |
|
AMD Ryzen 5 3600X |
1547.4 |
779.24 |
1 |
777.62 |
745.3 |
2.8 |
584.93 |
538.45 |
10.4 |
|
AMD Ryzen 3 3400G |
508.97 |
253.87 |
1 |
490.26 |
247.04 |
3 |
233.57 |
193.62 |
9.3 |
|
AMD Ryzen 3 3300X |
1080.5 |
541.5 |
0.9 |
541.84 |
530.5 |
2.7 |
322.13 |
321.33 |
11.1 |
|
AMD Ryzen 3 3100 |
965.85 |
484.67 |
1 |
485.55 |
460.71 |
3.1 |
374.11 |
343.53 |
11.8 |
|
Intel i5-10600K |
1676.6 |
840.87 |
0.8 |
662.98 |
452.67 |
2.5 |
361.35 |
238.47 |
10.5 |
|
Intel i9-10900K |
3162.1 |
1586.7 |
0.8 |
1201.8 |
759.97 |
2.4 |
407.66 |
245.94 |
11.4 |
|
AMD Ryzen 5 5600X |
1721.4 |
869.69 |
0.9 |
851.89 |
831.97 |
2.6 |
276.24 |
298.84 |
11 |
|
Intel i9-11900K |
4542.8 |
2299.3 |
1 |
1413.2 |
691.62 |
2.5 |
330.32 |
213.28 |
11.4 |
|
Intel i5-11600K |
3412.3 |
1724.9 |
1 |
960.91 |
526.76 |
2.7 |
319.1 |
198.57 |
11.4 |
|
Intel i9-12900K |
2310 |
1438.7 |
1 |
1233.5 |
562.72 |
2.9 |
678.84 |
418.11 |
19.8 |
|
Intel i5-12600K |
1461.1 |
971.78 |
1.1 |
846.4 |
360.51 |
3.2 |
598.86 |
292.09 |
21.4 |
|
AMD Ryzen 5 4500 |
1561.9 |
784.1 |
1 |
785.34 |
751.61 |
2.9 |
350.05 |
571.19 |
10.5 |
|
AMD Ryzen 5 5600 |
1646.6 |
831.24 |
0.9 |
832.43 |
767.22 |
2.7 |
445.8 |
437.73 |
11.9 |
|
AMD Ryzen 7 5700X |
2267.8 |
1157.8 |
0.9 |
1147.6 |
1026.1 |
2.6 |
501.53 |
526.11 |
11.5 |
|
AMD Ryzen 7 7700X |
2722.9 |
1381 |
0.7 |
1361.1 |
1305.1 |
2.7 |
887.95 |
901.2 |
10.1 |
|
AMD Ryzen 5 7600X |
1996.3 |
1019.3 |
0.7 |
1020.9 |
999.93 |
2.6 |
847.43 |
847.61 |
10.5 |
|
AMD Ryzen 9 7950X |
5252.2 |
2685 |
0.7 |
2615.6 |
2588.4 |
2.6 |
1293.7 |
1357.3 |
9.9 |
|
AMD Ryzen 9 7900X |
4042.4 |
2051.4 |
0.7 |
2008.5 |
1956.3 |
2.5 |
1278.6 |
1394.1 |
9.8 |
|
Intel i9-13900K |
2005.7 |
872.39 |
0.9 |
2280.2 |
851.63 |
3.7 |
1729.2 |
619.38 |
18.3 |
|
Intel i5-13600K |
3218.4 |
1472.5 |
1.1 |
1156 |
479.87 |
4.5 |
907.63 |
406.76 |
14.9 |
|
AMD Ryzen 9 7900 |
3839.2 |
2023.6 |
0.7 |
1925.5 |
1865.1 |
2.7 |
1146 |
1046.4 |
10.3 |
|
AMD Ryzen 7 7700 |
2630.8 |
1333.7 |
0.8 |
1336.2 |
1298.2 |
2.9 |
826.97 |
879.08 |
10.4 |
|
AMD Ryzen 5 7600 |
1898 |
963.23 |
0.8 |
964.63 |
946.49 |
2.9 |
698.77 |
690.84 |
10.8 |
|
AMD Ryzen 9 7950X3D |
4734.9 |
2518.4 |
0.8 |
2558.7 |
2422.3 |
2.7 |
1314.4 |
1376.8 |
12.5 |
|
AMD Ryzen 7 7800X3D |
2342.7 |
1239.1 |
0.8 |
1252.6 |
1171.8 |
3.1 |
674.02 |
703.18 |
12.8 |
|
AMD Ryzen 7 8700G |
2350.8 |
1228 |
0.8 |
1230.7 |
1219.8 |
2.8 |
867.87 |
893.95 |
11.4 |
|
AMD Ryzen 5 8600G |
1777.2 |
930.44 |
0.8 |
941.76 |
941.91 |
2.9 |
721.29 |
702.59 |
10.7 |
|
AIDA64 |
Memory Read |
Memory Write |
Memory Latency |
Single-Precision FLOPS |
Double Precision FLOPS |
AES-256 |
24-bit Integer IOPS |
32-bit Integer IOPS |
64-bit Integer IOPS |
|
|
MB/s |
MB/s |
ns |
GFLOPS |
GFLOPS |
MB/s |
GIOPS |
GIOPS |
GIOPS |
|
AMD Ryzen R7 2700X |
50214 |
48578 |
65 |
507.9 |
253.9 |
70514 |
127.7 |
127.7 |
64.22 |
|
AMD Ryzen R5 2600X |
50273 |
48346 |
65.5 |
383.2 |
191.4 |
51932 |
95.82 |
95.82 |
48.15 |
|
Ryzen 5 2400G |
45967 |
47850 |
66.6 |
235.9 |
117.8 |
32388 |
58.94 |
58.98 |
29.67 |
|
Ryzen 3 2200G |
35567 |
36240 |
118.4 |
225.8 |
112.6 |
27603 |
56.32 |
56.32 |
28.3 |
|
Intel i7-8700K |
38421 |
40175 |
57.9 |
825 |
412.5 |
29406 |
370 |
370 |
51.55 |
|
Intel i5-8400 |
38096 |
40549 |
59.8 |
728.8 |
364.5 |
25192 |
323.5 |
323.5 |
45.55 |
|
Intel Core i9-7980XE |
77004 |
68888 |
73.4 |
1831 |
915.5 |
69377 |
821.2 |
821.3 |
121.6 |
|
Intel Core i9-7960X |
79416 |
71554 |
74.9 |
1681 |
840.6 |
65409 |
754 |
753.9 |
114.7 |
|
Intel Core i7-7820X |
76049 |
73759 |
71.6 |
944.9 |
472.5 |
36420 |
423.7 |
423.7 |
63.85 |
|
Intel Core i5-7640X |
30786 |
31888 |
68.5 |
536.5 |
268.2 |
18547 |
238.1 |
138.1 |
33.53 |
|
Intel Core i9-7900X |
76856 |
72856 |
72.8 |
1148 |
574.5 |
45506 |
515.1 |
515 |
79.76 |
|
Intel Core i7-7740X |
38455 |
40596 |
53.2 |
575.4 |
287.8 |
20503 |
258.1 |
258 |
35.97 |
|
Intel i7-6900K |
66786 |
68130 |
61.9 |
1023 |
511.7 |
36340 |
255.9 |
255.9 |
63.96 |
|
Intel i7-7700K |
38498 |
40448 |
52.7 |
575.7 |
287.9 |
20519 |
258 |
258 |
35.98 |
|
Intel i7-5960X |
66108 |
49545 |
62.8 |
895.5 |
447.7 |
31783 |
223.9 |
223.9 |
55.97 |
|
AMD Ryzen R7 1800X |
44031 |
43425 |
81.8 |
472.4 |
236.2 |
64016 |
118.1 |
118.1 |
59.03 |
|
AMD Ryzen R7 1700X |
44493 |
43749 |
78.3 |
446.8 |
223.4 |
61730 |
111.7 |
111.7 |
55.84 |
|
AMD Ryzen R7 1700 |
45343 |
43777 |
82.6 |
408.5 |
204.3 |
56811 |
102.1 |
102.1 |
51.05 |
|
AMD Ryzen R5 1600X |
44452 |
43918 |
83.7 |
354.9 |
177.5 |
49340 |
88.74 |
88.73 |
44.34 |
|
AMD Ryzen R5 1500X |
44289 |
43746 |
83.1 |
229.8 |
114.8 |
31983 |
57.43 |
57.45 |
28.72 |
|
AMD Ryzen R5 2600 |
50385 |
48499 |
66.5 |
351 |
175.4 |
48939 |
88.03 |
88.02 |
44.01 |
|
AMD Ryzen R7 2700 |
50088 |
48343 |
65.9 |
434.3 |
217.2 |
60336 |
108.6 |
108.6 |
54.68 |
|
Intel i7-8086K |
39069 |
40675 |
56.2 |
824.9 |
412.5 |
29397 |
369.9 |
369.9 |
51.55 |
|
Intel i9-9900K |
39682 |
41015 |
51.1 |
1226 |
613 |
45542 |
550 |
549.8 |
79.79 |
|
AMD Ryzen 9 3900X |
53981 |
52271 |
70.7 |
1546 |
772.1 |
106943 |
385.7 |
385.7 |
96.57 |
|
AMD Ryzen 7 3700X |
51498 |
28739 |
67.3 |
1078 |
537.8 |
74474 |
271 |
271.2 |
67.77 |
|
AMD Ryzen 5 3600X |
50769 |
28736 |
68.9 |
799.5 |
400 |
55456 |
198.6 |
198.6 |
49.64 |
|
AMD Ryzen 3 3400G |
49936 |
53502 |
67.1 |
257.2 |
128.5 |
35736 |
64.16 |
64.16 |
32.25 |
|
AMD Ryzen 3 3300X |
51435 |
28743 |
66.4 |
551.6 |
276.1 |
38176 |
138.7 |
138.7 |
34.65 |
|
AMD Ryzen 3 3100 |
50246 |
28734 |
71.1 |
497.6 |
248.7 |
34946 |
124.4 |
124.4 |
31.09 |
|
Intel i5-10600K |
43340 |
43430 |
48.2 |
863.8 |
431.9 |
30782 |
387.2 |
386.9 |
53.99 |
|
Intel i9-10900K |
44972 |
43808 |
50.5 |
1632 |
815.7 |
58163 |
731.3 |
731.2 |
102 |
|
AMD Ryzen 5 5600X |
50972 |
28772 |
59.2 |
891.9 |
445.8 |
61623 |
709.6 |
709.7 |
55.72 |
|
Intel i9-11900K |
44919 |
43343 |
51.8 |
1068 |
534.2 |
164966 |
547 |
547 |
182.7 |
|
Intel i5-11600K |
43953 |
43468 |
55.6 |
838.7 |
419.4 |
123767 |
429.3 |
429.3 |
143.4 |
|
Intel i9-12900K |
71418 |
72395 |
82 |
695.7 |
247.9 |
140499 |
400.6 |
400.6 |
166.2 |
|
Intel i5-12600K |
65416 |
71336 |
87.8 |
432.5 |
216.2 |
86470 |
252.7 |
252.7 |
96.22 |
|
AMD Ryzen 5 4500 |
52683 |
53191 |
82.8 |
806 |
402.6 |
56578 |
201.5 |
201.3 |
50.35 |
|
AMD Ryzen 5 5600 |
48444 |
28753 |
70.9 |
853.2 |
426.2 |
107839 |
675.8 |
679.6 |
53.38 |
|
AMD Ryzen 7 5700X |
47858 |
28760 |
68.2 |
1158 |
577.9 |
137459 |
919.1 |
912.9 |
74.38 |
|
AMD Ryzen 7 7700X |
58755 |
80120 |
70 |
1392 |
694.6 |
192730 |
1205 |
1205 |
602.4 |
|
AMD Ryzen 5 7600X |
54720 |
80771 |
69.5 |
1046 |
523.1 |
147661 |
912.5 |
912.5 |
456.4 |
|
AMD Ryzen 9 7950X |
67342 |
76712 |
69 |
2735 |
1364 |
379510 |
2370 |
2370 |
1184 |
|
AMD Ryzen 9 7900X |
68064 |
78123 |
67.7 |
2062 |
1029 |
288134 |
1792 |
1789 |
895.4 |
|
Intel i9-13900K |
76006 |
68902 |
86.1 |
2238 |
1116 |
157028 |
831.4 |
831.4 |
270.6 |
|
Intel i5-13600K |
64721 |
62311 |
97.2 |
1294 |
647 |
86637 |
509.5 |
509.4 |
136.4 |
|
AMD Ryzen 9 7900 |
73968 |
73494 |
69.4 |
2007 |
998.7 |
267499 |
1710 |
1709 |
855.9 |
|
AMD Ryzen 7 7700 |
58694 |
79929 |
68.9 |
1369 |
684.7 |
185084 |
1192 |
1192 |
594.3 |
|
AMD Ryzen 5 7600 |
59454 |
81467 |
69.6 |
988.6 |
494.3 |
140625 |
861.9 |
861.2 |
431.2 |
|
AMD Ryzen 9 7950X3D |
77677 |
80314 |
68.1 |
2619 |
1311 |
178269 |
2239 |
2239 |
1120 |
|
AMD Ryzen 7 7800X3D |
65343 |
81313 |
71.9 |
1241 |
620.3 |
89694 |
1076 |
1076 |
538.3 |
|
AMD Ryzen 7 8700G |
75149 |
99082 |
74.5 |
1277 |
638.1 |
88895 |
1108 |
1108 |
554.1 |
|
AMD Ryzen 5 8600G |
75418 |
99134 |
71.6 |
969.3 |
484.6 |
69303 |
842.7 |
843.2 |
421.4 |
Onboard Video Performance
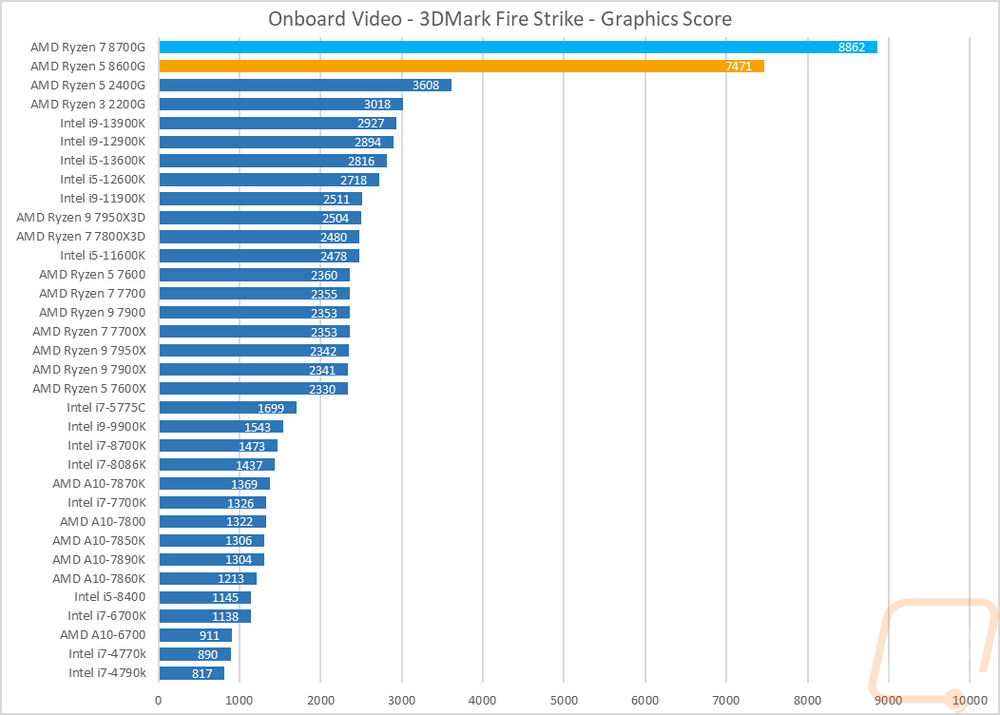
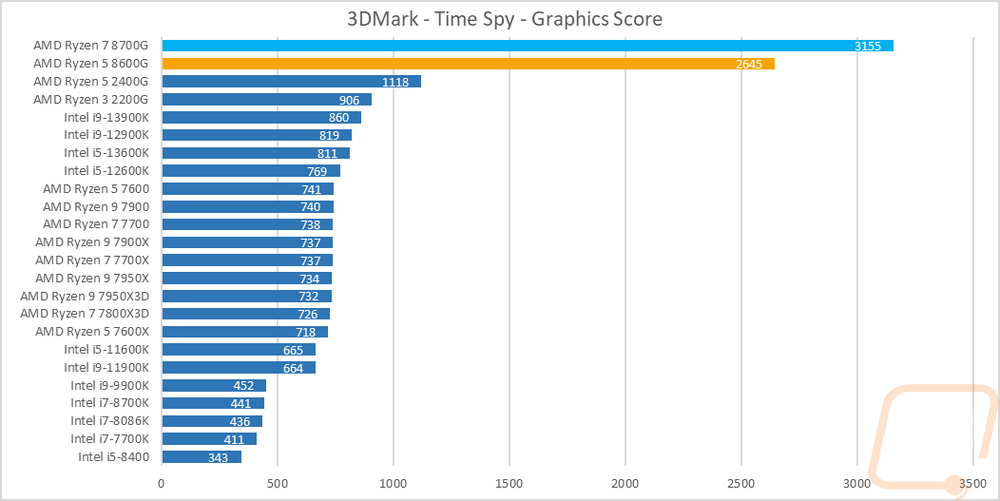
While CPU performance is important, especially if you plan on upgrading one of the 800G Series CPUs with a dedicated GPU in the future. It’s onboard video performance that I’m the most excited to see with these, without that why not go with one of the other Ryzen CPUs? I always keep an eye on onboard performance though, even with some of the other CPUs that wouldn’t make sense for you to plan on using it long term so we do already have a test suite in place for checking it out. You will notice that all of the tests are a big step down from what you would see in any video card or base CPU tests, that is because even with a solid integrated GPU the expectation is still 1080p with low settings. The goal here is to be able to play the games in general, not get high detail or resolutions though AMD does have Hyper-RX with fluid motion to help as well. Most of these are looking at base performance however for a direct comparison with other iGPUs. First up is checking out a few tests in 3DMark. Specifically the older Fire Strike benchmark and the newer Time Spy which is DX12. I only used the graphics score, not the total score to take the CPU performance out of the equation as much as possible. These are also a great way to compare results with any of the dedicated GPUs as well. One thing is for sure, the 8700G and 8600G really messed up the scale of our charts here with them both being more than double and almost triple as fast as any of the other CPUs tested here. It’s the same on both tests but really does show just how far AMD has come along here from the 2400G to the 8700G with us missing out on coverage on CPUs like the 5700G which might bridge that gap slightly.
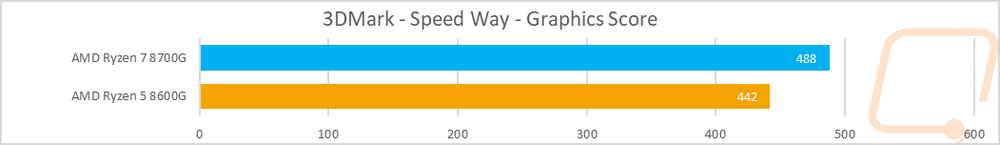
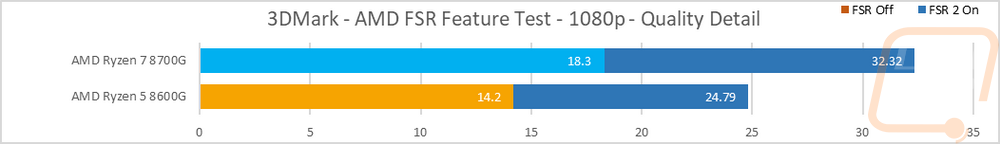
While in 3DMark I did also run the newer Speed Way benchmark on both CPUs just for future reference on the future-looking test that includes more ray tracing and higher detail levels. Without any point of reference it is hard to see where they fit, but just know this test would most likely just not run on most of the other CPUs tested in the past. Comparing this to dedicated GPU results the new 7600 XT scored a 1916, Nvidia’s RTX 3050 is 1465, and the older RX 6500 XT scored just a 180 when I tried to run it on this. I also tested with the 3DMark AMD FSR Feature test which compares performance with FSR 2 on and off. I did the test at 1080p with the detail quality set at quality which if I were gaming I might actually run it here on a higher quality but you can see how with both CPUs it gives a huge performance improvement. Taking an unplayable 18 FPS up to 32 FPS which is playable but not smooth.
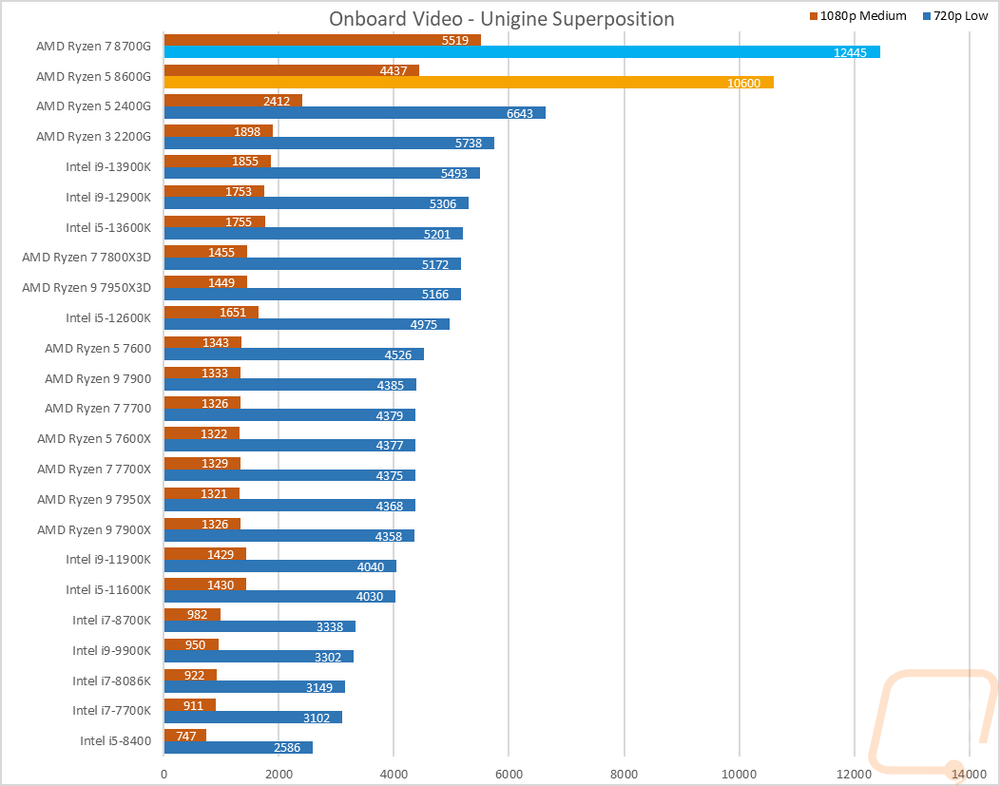
In Unigine Superposition I ran the 1080p medium detail and 720p low detail tests and while not to the same extreme as we saw in 3DMark the Ryzen 7 8700G and Ryzen 5 8600G are both way out in front of the rest of the CPUs here, doubling the scores in both the 1080 Medium detail setting and 720p low detail tests.
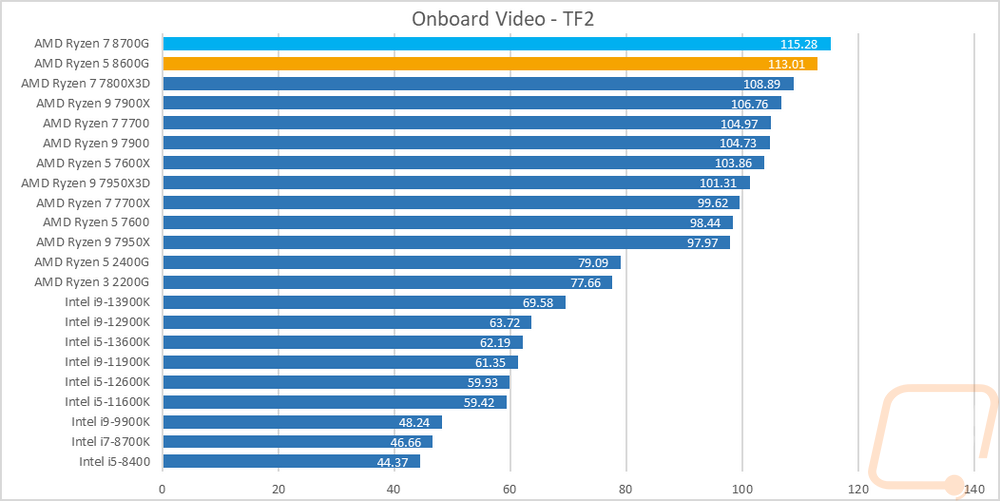
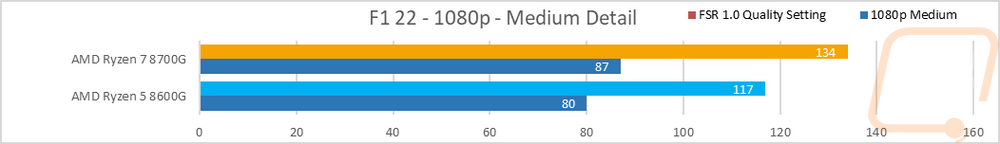
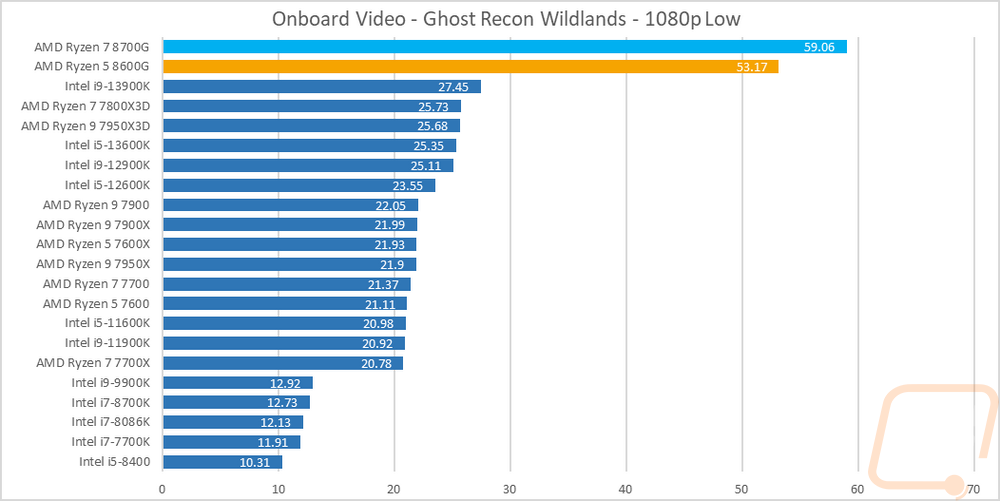
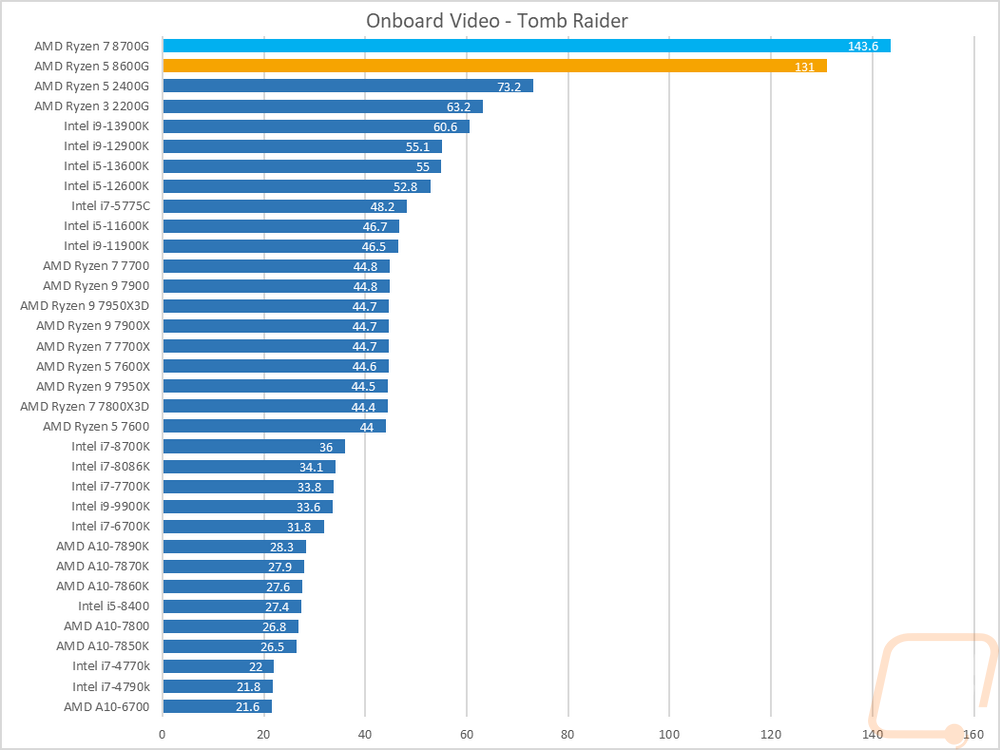
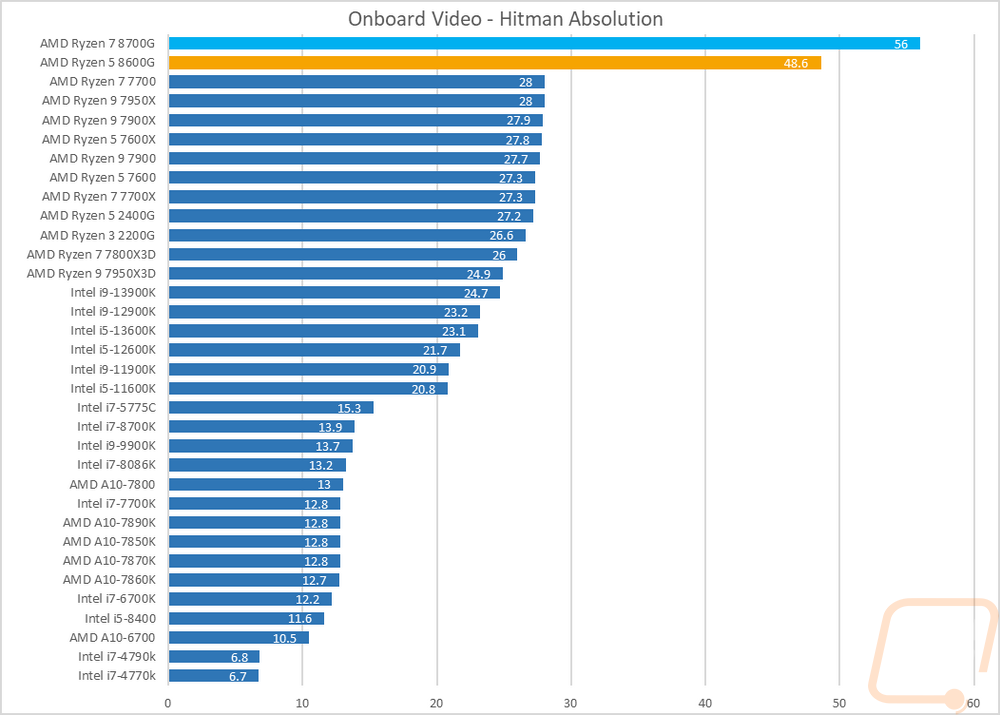
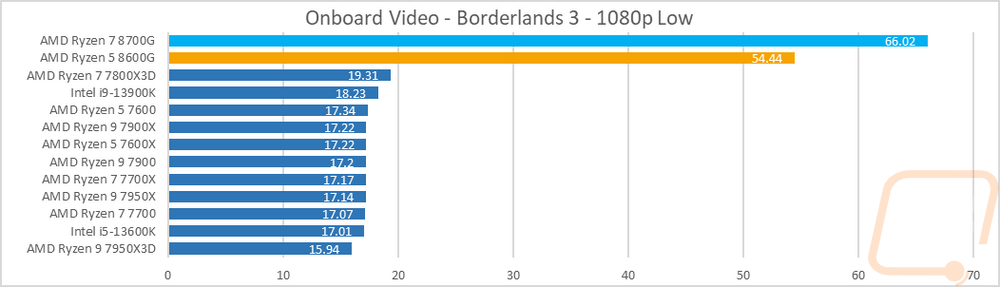
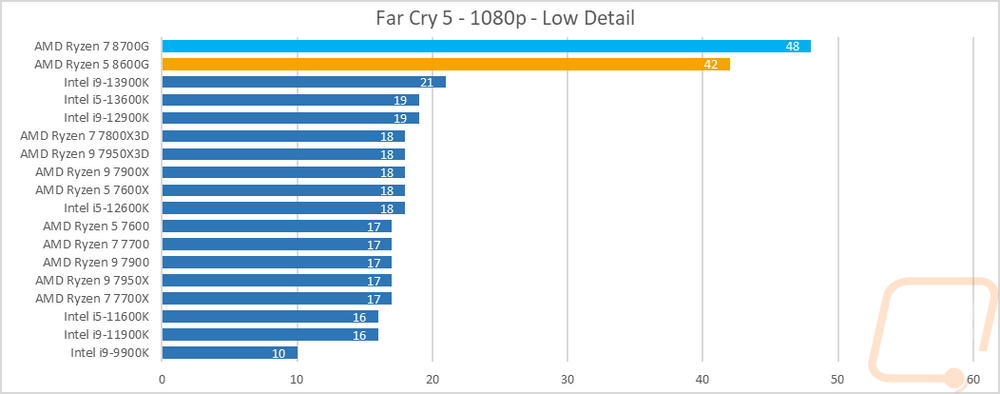
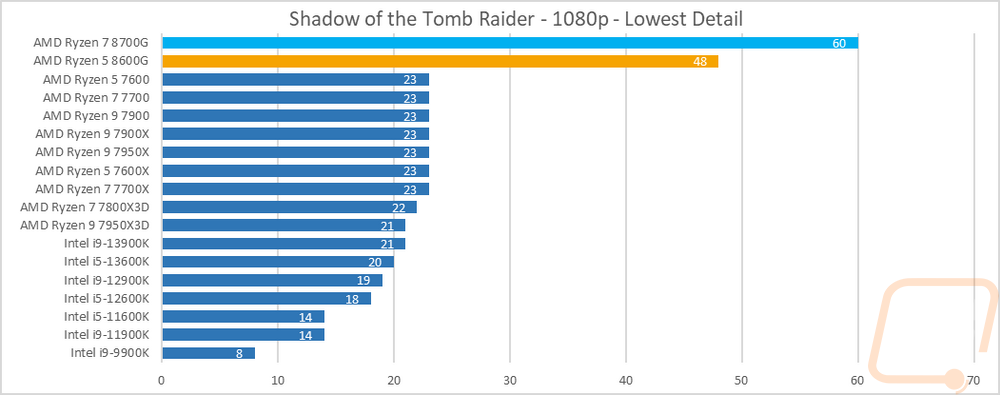
Then from there on, I jumped into game tests. Some of our tests are older games but I did also add in a few newer games as well to get an idea of newer games when tested at 1080p and low or medium settings. With most of the results, you can once again see the 8700G and 8600G way out in front of the rest of the CPUs. In games like Shadow of the Tomb Raider, this has the 8700G at a nice and playable 60 FPS, same with Borderlands 3. Those are older games of course but it does show that even before getting into Hyper-RX these are capable and in those situations utilizing the tools that AMD is offering you could start to turn the detail up as well. In F1 22 which is a newer game even without FSR 1 both were over 80 FPS when playing at medium detail, not even the lowest detail. Turning FSR 1 on put them up into a higher refresh rate range which is really noticeable on the F1 games. TF2 is the only game that isn’t showing that big of an improvement but this is also the oldest of the games tested and shows just how CPU-limited the game is, there is an improvement but it is only enough to put the two CPUs up at the top not way out in front.
Power Usage and Temperatures
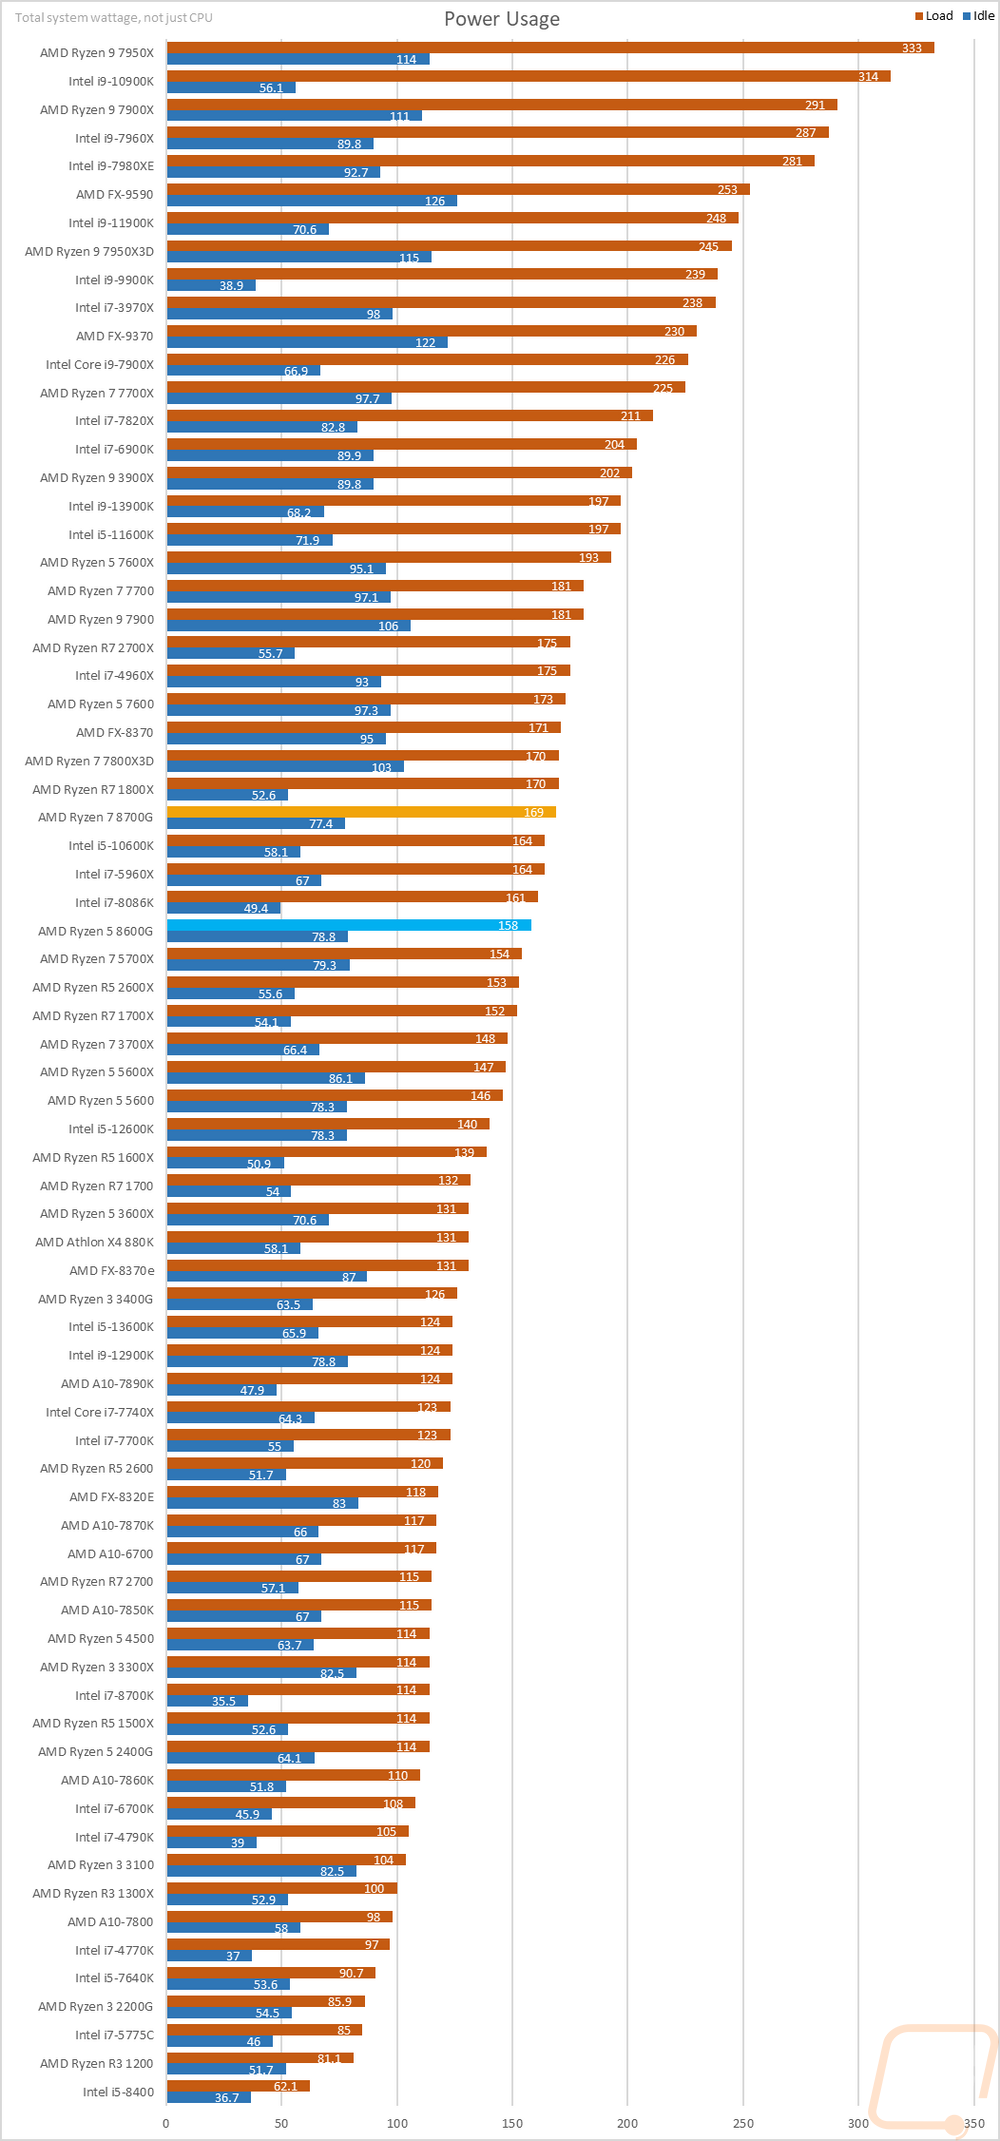
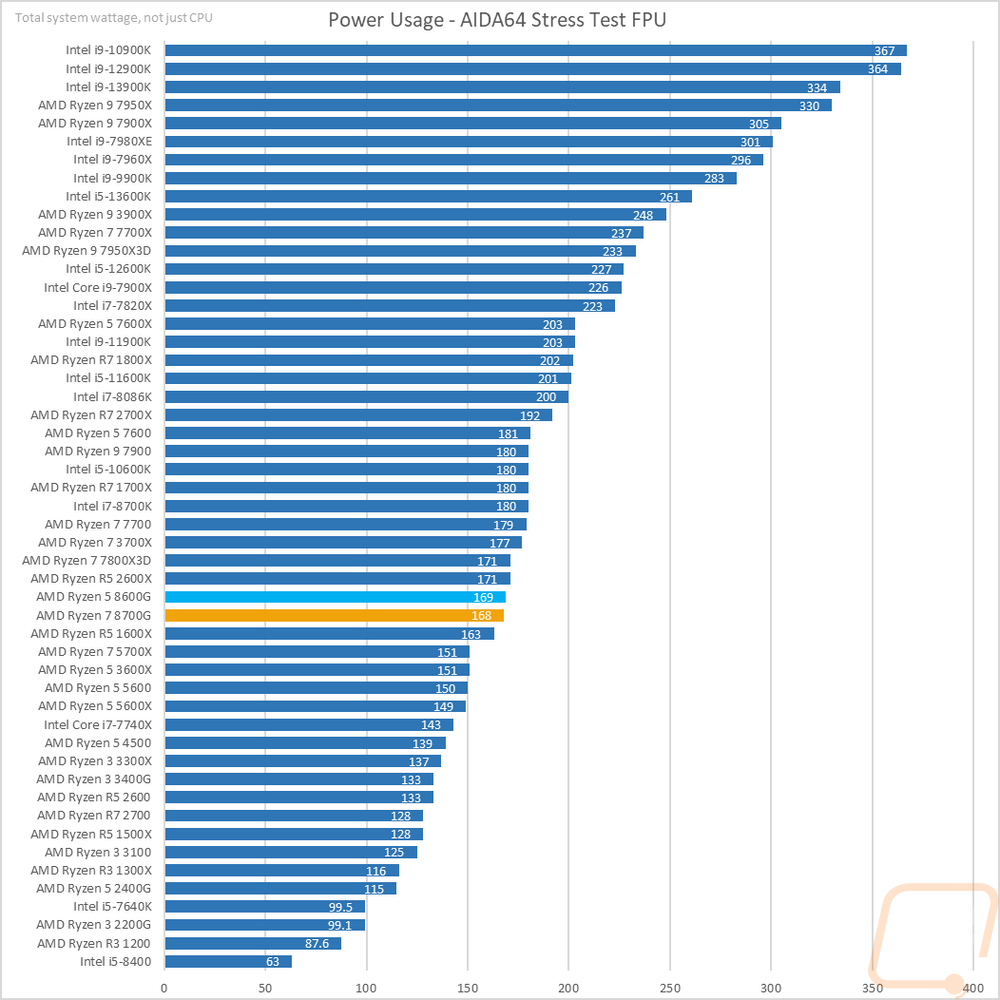
For some people, performance is the only thing important, but for others, power usage and temperatures also play a role so we do take a look at both of those as well. This is especially important in SFF or even just smaller mid-sized builds and it affects the components you need to get for your system as well as your PSU and cooler. To take a look at power usage I ran three different tests. I noted the idle power draw of our entire system then I took a look at the load wattage of the system using two different workloads. One was wPrime and the second was AIDA64 using their FPU workload which is extremely demanding. At idle the testbench with the Ryzen 7 8700G pulled 77.4 watts and with the Ryzen 5 8600G it pulled 78.8, really a wash between the two but this is more than what I’ve seen on older Intel CPUs but a big improvement over some of the highest end Ryzen CPUs. The 7950X in our launch testing was pulling 114 watts on a similar configuration. The first under-load power test was when running wPrime and we see that wattage goes up from the high 70’s up to 169 for the 8700G and 158 for the 8600G. They do have the same listed TGP but the lower core count CPU does pull a little less here. This was better than with the 7700X and 7700, AMD has continued to improve on this with the closest of the 7000 Series Ryzen CPUs being the 7600 which pulled 173. Using AIDA64’s FPU stress test does normally change the total wattage usage but it didn’t change things for the 8700G which was already at its TGP so it stayed at 169 watts. The 8600G however did pull more here and went up to 169 watts to match the 6700G.
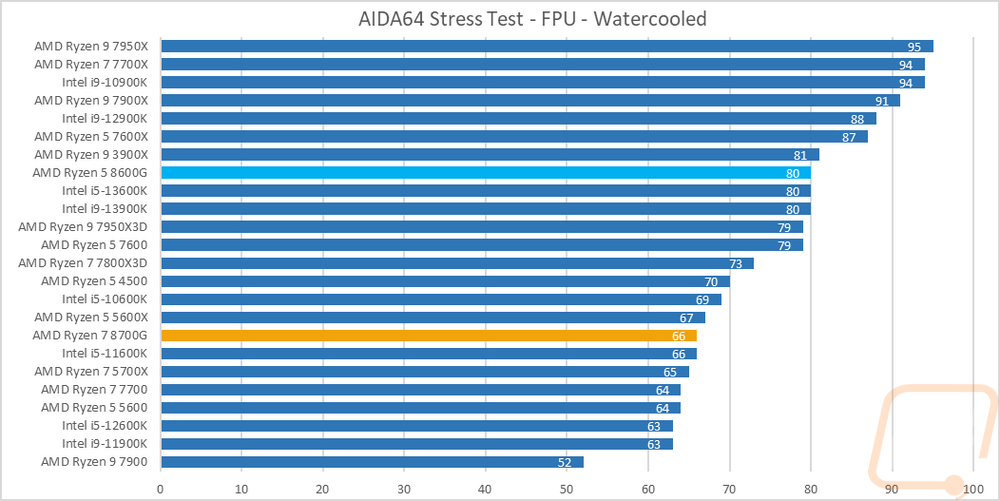
I’ve spoken in the past about how temperature testing isn’t an end all be all result. CPU to CPU with the same CPU can be different and that gets even more complicated once you add in different motherboards and BIOS revisions as well. Not to mention different coolers. In this case, both the 8700G and 8600G were tested using a 360 mm AIO water cooler and in the same situation. I even ran this test multiple times with the same results. Our results are going to be a little confusing though. The 8700G came in at 66c each time I tested it whereas the 8600G shows 80c. They pull the same wattage when using AIDA64’s Stress test so there isn’t any reason for those results to be far far apart but they are. With that, there isn’t any good reason to compare them with the other CPUs as we don’t know which result is accurate but I did want to at least address it here.
Overall and Final Verdict
With the testing out of the way, we can finally step back and get a better idea of where the Ryzen 7 8700G and Ryzen 5 8600G are sitting right now. AMD’s new 8000G Series CPUs pair up Zen 4 CPUs with their Radeon 700M series of mobile GPUs with the goal being to create a desktop APU that is capable of some gaming without having to pair it up with a dedicated GPU and they have done just that. The Ryzen 7 8700G has the same Radeon 780M GPU that is used with the Ryzen Z1 in devices like the ROG Ally so we already knew it was capable. The performance fits what you would expect for a handheld console as well with it being capable at 1080p on the lowest settings and when utilizing tech like AMDs Hyper-RX you can see smooth gameplay at higher detail settings as well. This isn’t going to be a replacement for a dedicated GPU if you are looking to game at higher resolutions or if you want the highest detail settings in all of the latest games. But it is great to see an integrated GPU that is capable enough that you can trust it to handle mid-level 1080p gaming. The best part with that is you can build a system using this and leave the possibility of upgrading in the future open whereas with the mobile applications, you would be locked in.
Speaking of, the 8700G and 8600G were both capable CPUs when paired up with a dedicated GPU. In my testing, the Ryzen 5 8600G was consistently running just behind the 7600 and the 5700X. The 8700G with its higher boost clock speed and 8 cores was a little faster and running behind the 7700. So you won’t have to worry if you will be held back with an upgrade in the future. For pricing the Ryzen 7 8700G has an MSRP of $329 and the Ryzen 5 8600G is cheaper at $229. Both end up being a really good value once you figure in the cost of buying even a low-end video card and that is ignoring that AMD has also integrated AI processing into these as well. But with that said, if you are looking at picking either CPU up and pairing it up with a GPU you would be better served going with a model with less of a focus on the integrated GPU. The 8700G consistently performed just under the Ryzen 7 7700 which can be found for $315. The 8600G is priced similarly to the 7600 and it came in just behind consistently as well. But overall AMD set out to pair up capable CPUs with integrated graphics that are usable for gaming and that were extremely successful at that. These will be at the top of my recommendation list for anyone who wants light gaming capabilities at 1080p, once you take out the cost of an expensive video card you have a great value build with room to upgrade in the future.


Live Pricing: HERE

Live Pricing: HERE


