In-Game Benchmarks
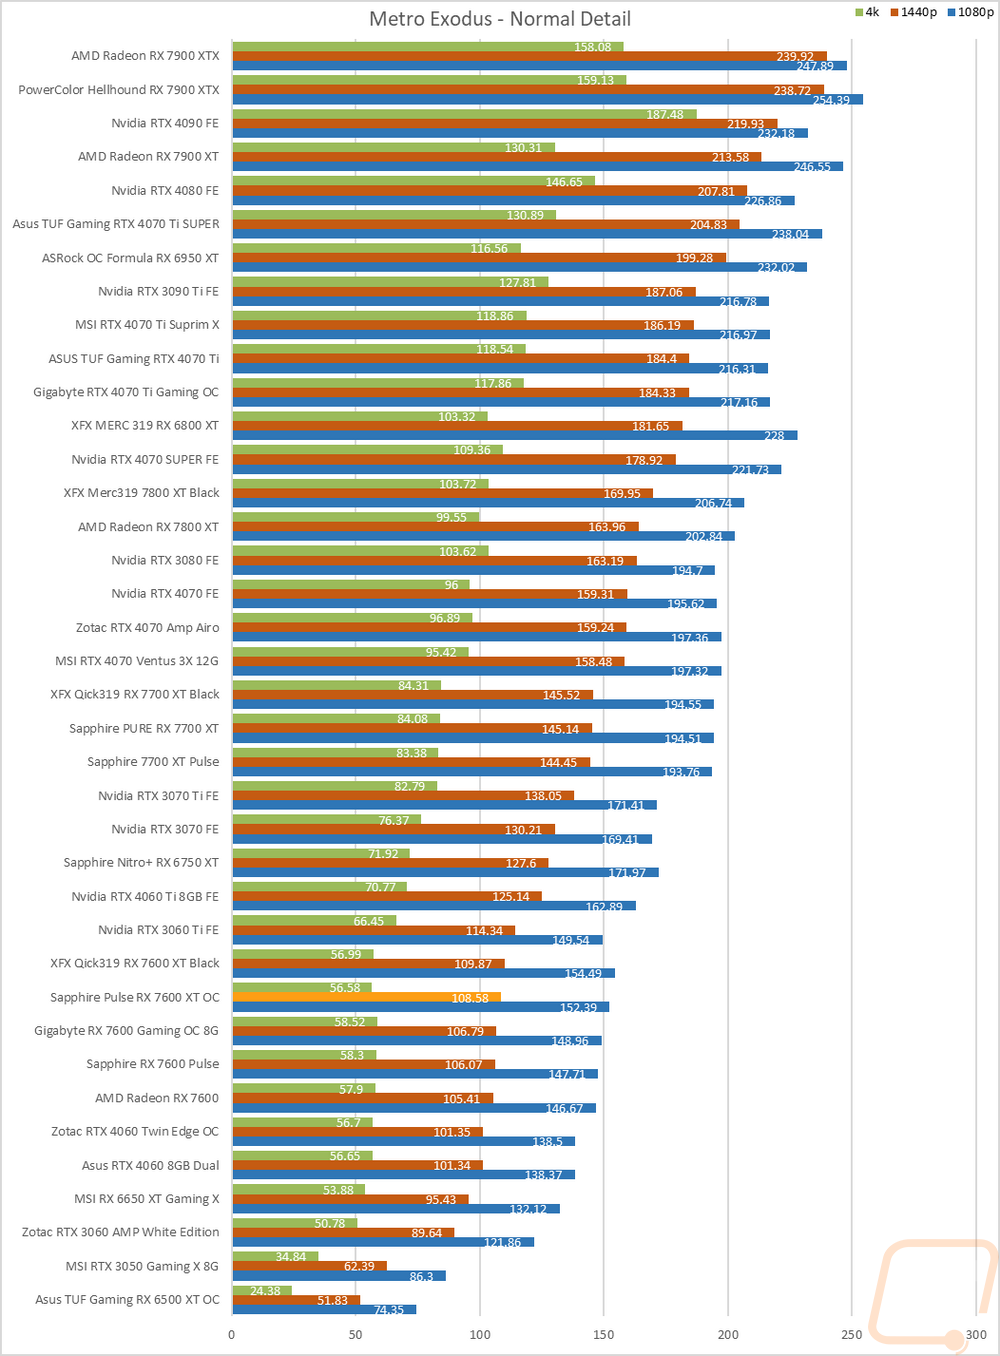
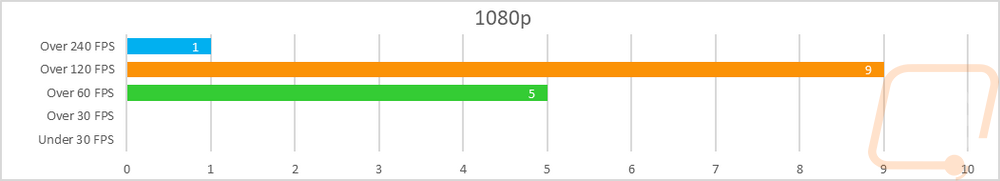
Now we finally get into the in game performance and that is the main reason people pick up a new video card. To test things out I ran through our new benchmark suite that tests 8 games at three different resolutions (1080p, 1440p, and 4k). Most of the games tested have been run at the highest detail setting and a mid-range detail setting to get a look at how turning things up hurts performance and to give an idea of if turning detail down from max will be beneficial for frame rates. In total, each video card is tested 45 times and that makes for a huge mess of results when you put them all together. To help with that I like to start with these overall playability graphs that take all of the results and give an easier-to-read result. I have one for each of the three resolutions and each is broken up into four FPS ranges. Under 30 FPS is considered unplayable, over 30 is playable but not ideal, over 60 is the sweet spot, and then over 120 FPS is for high refresh rate monitors.
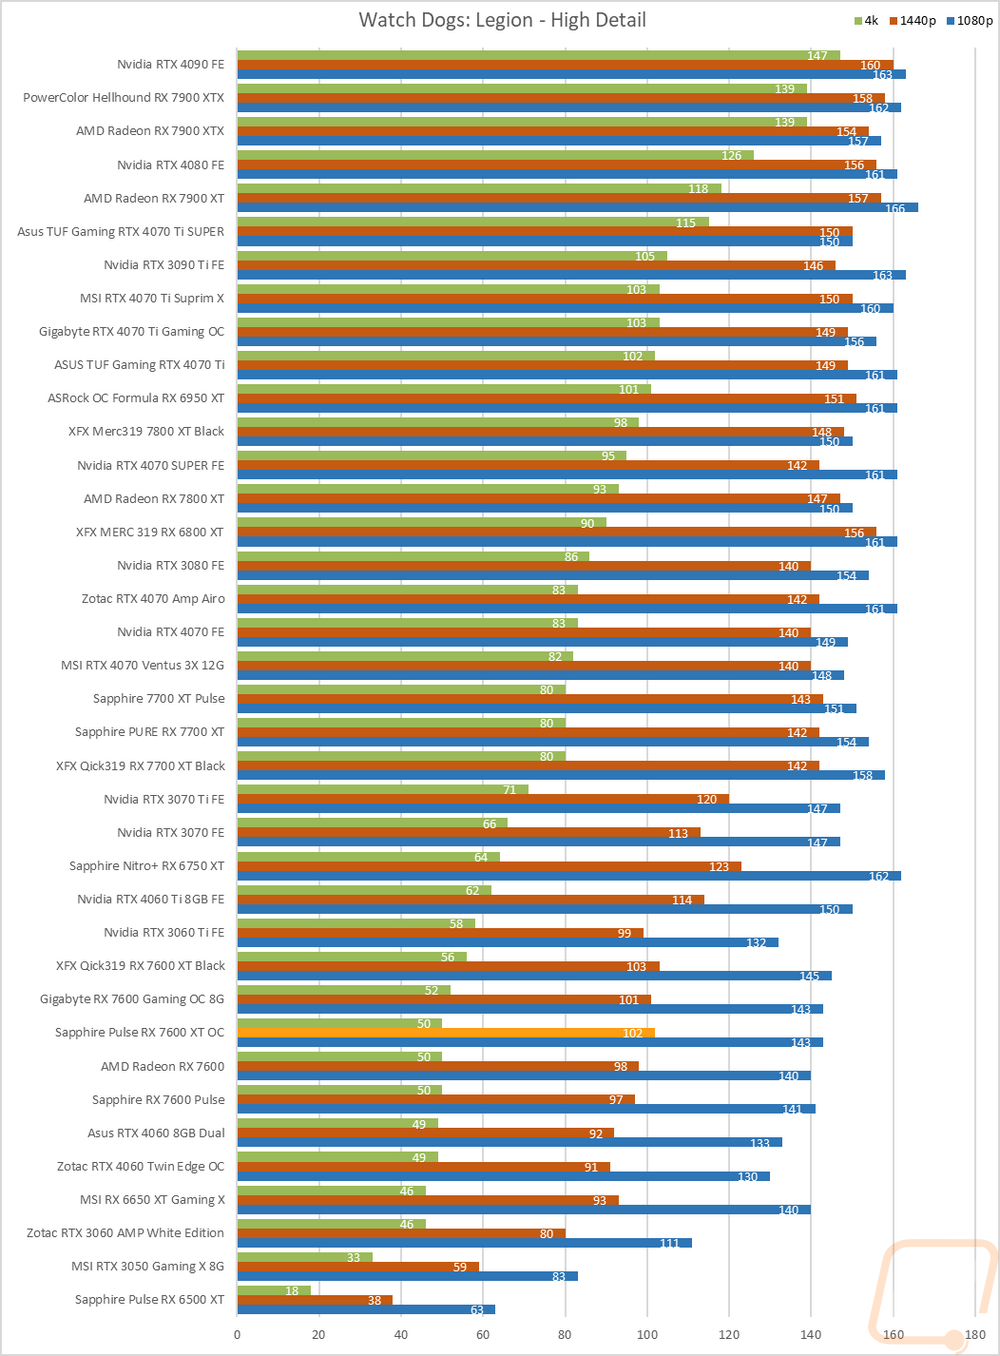
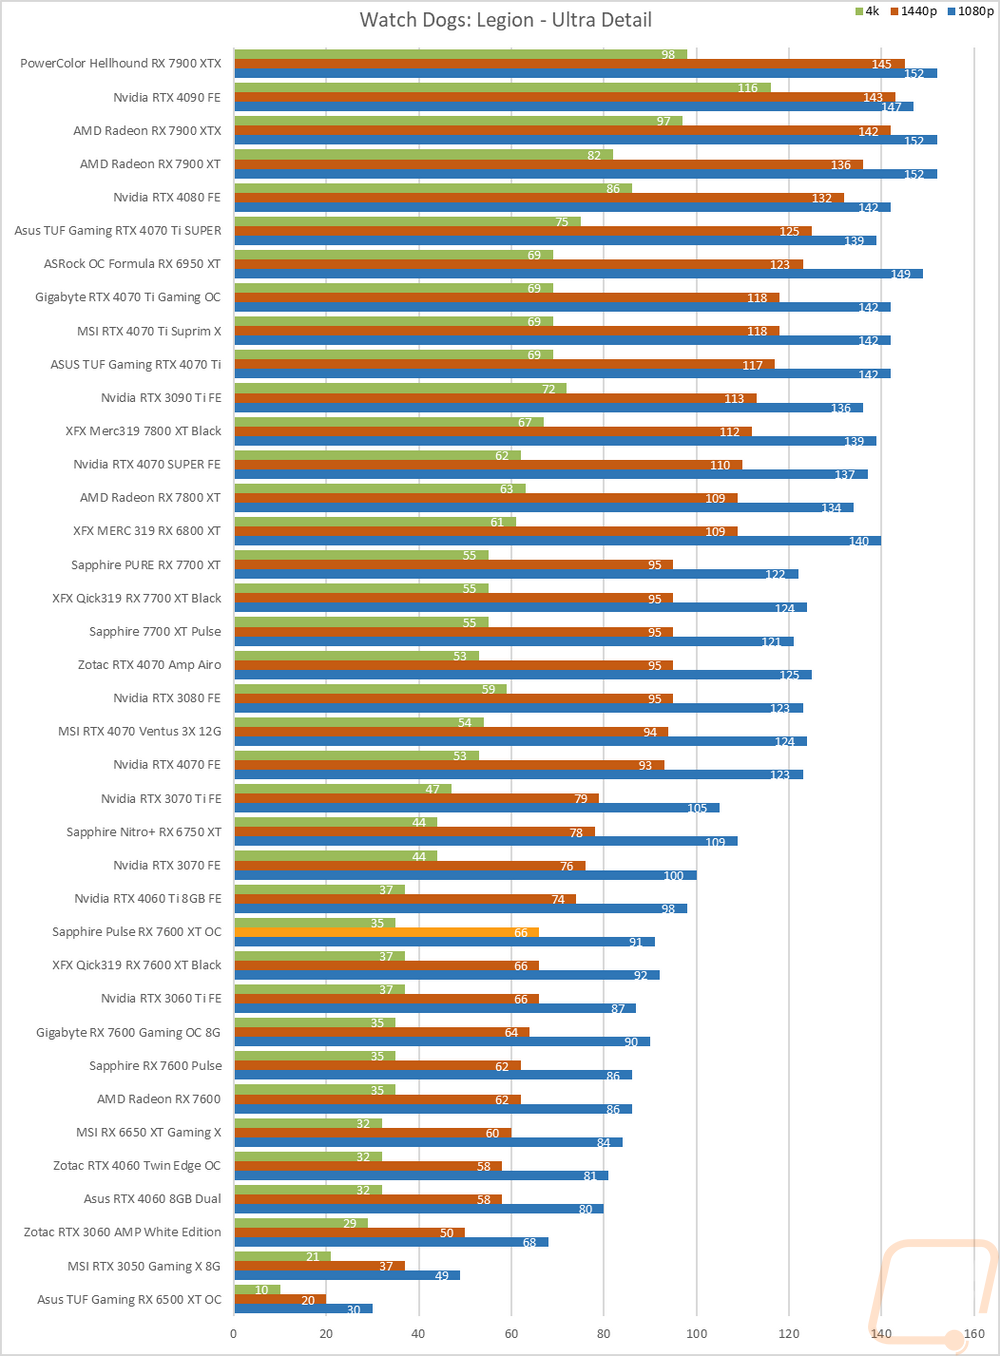
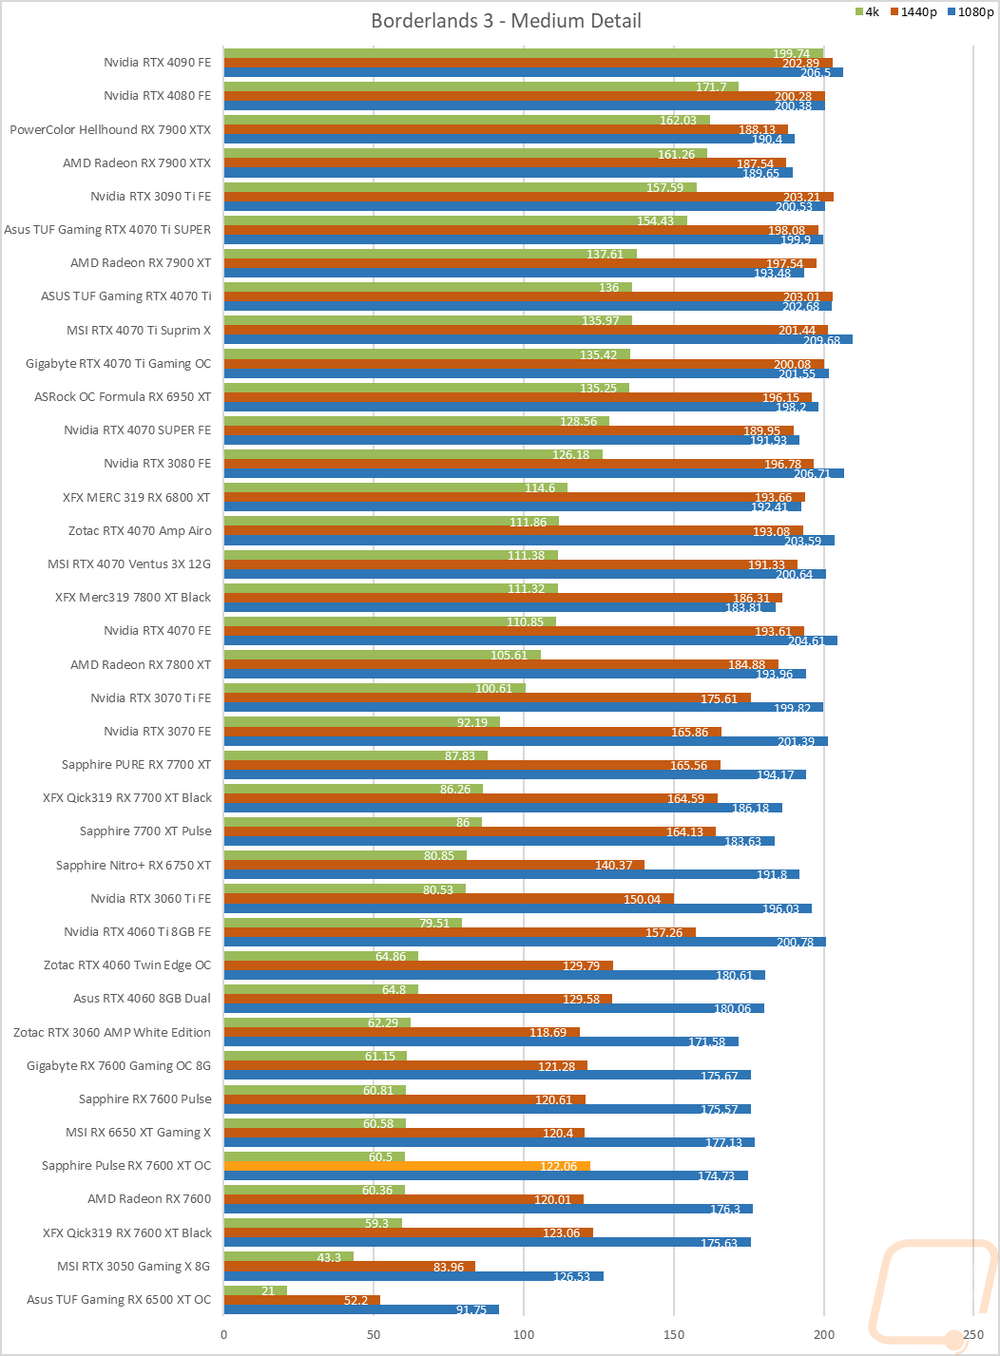
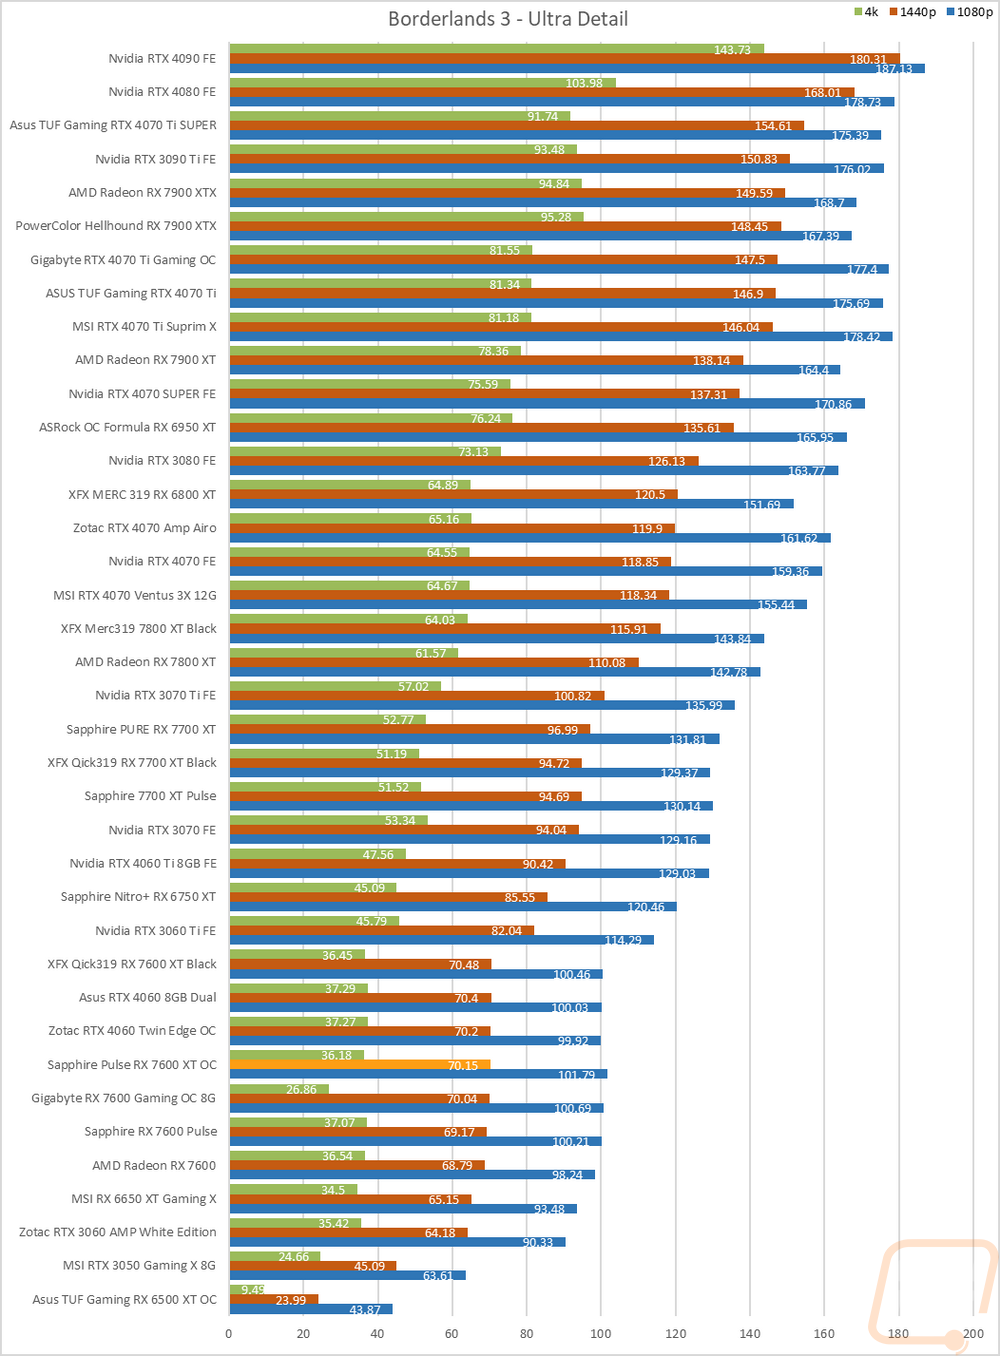
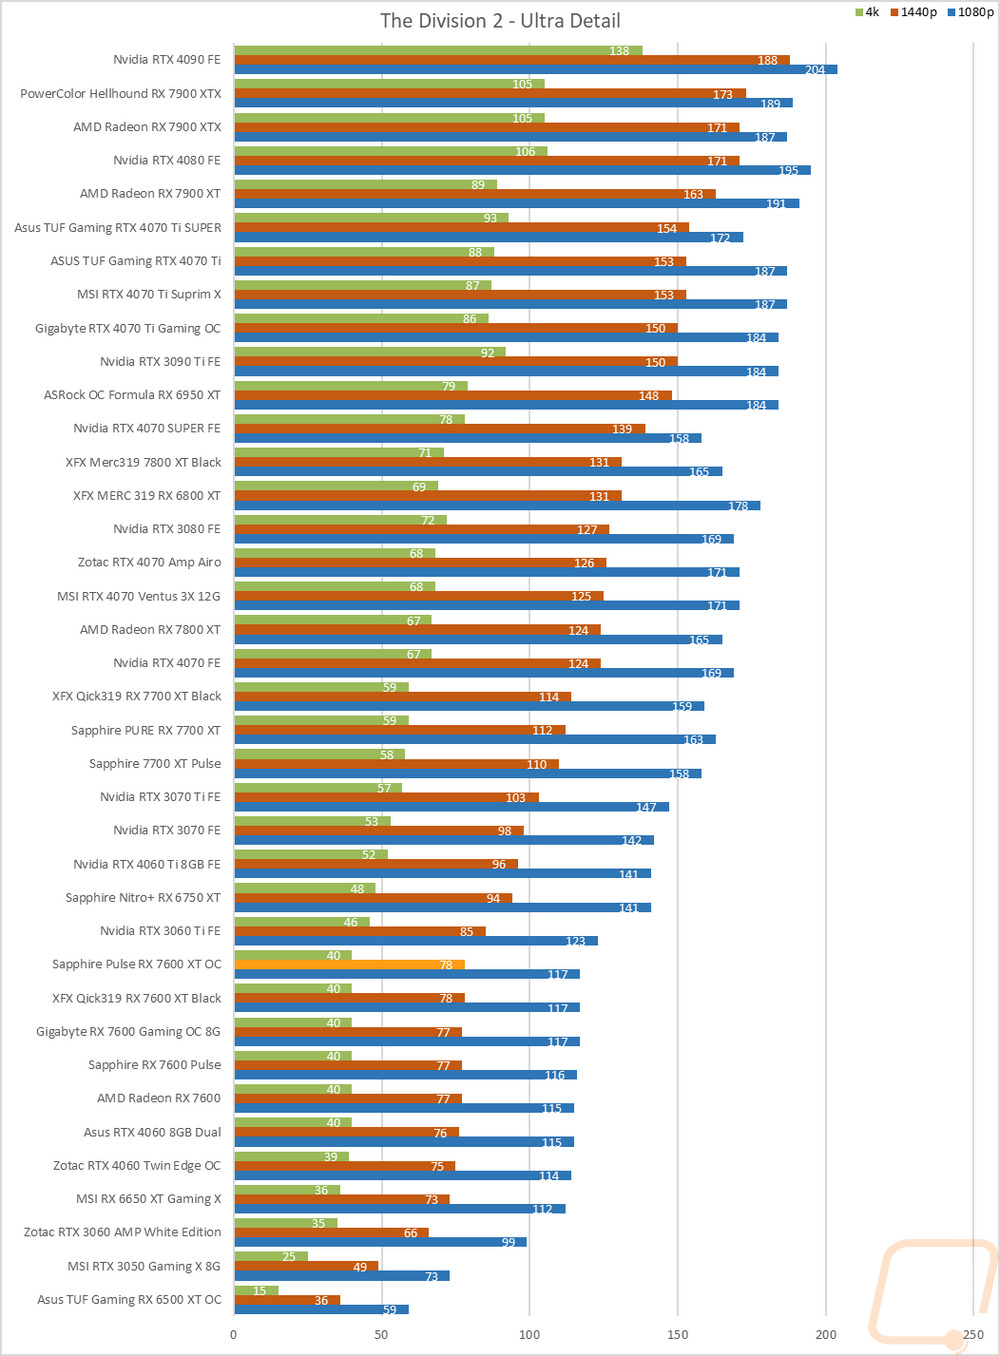
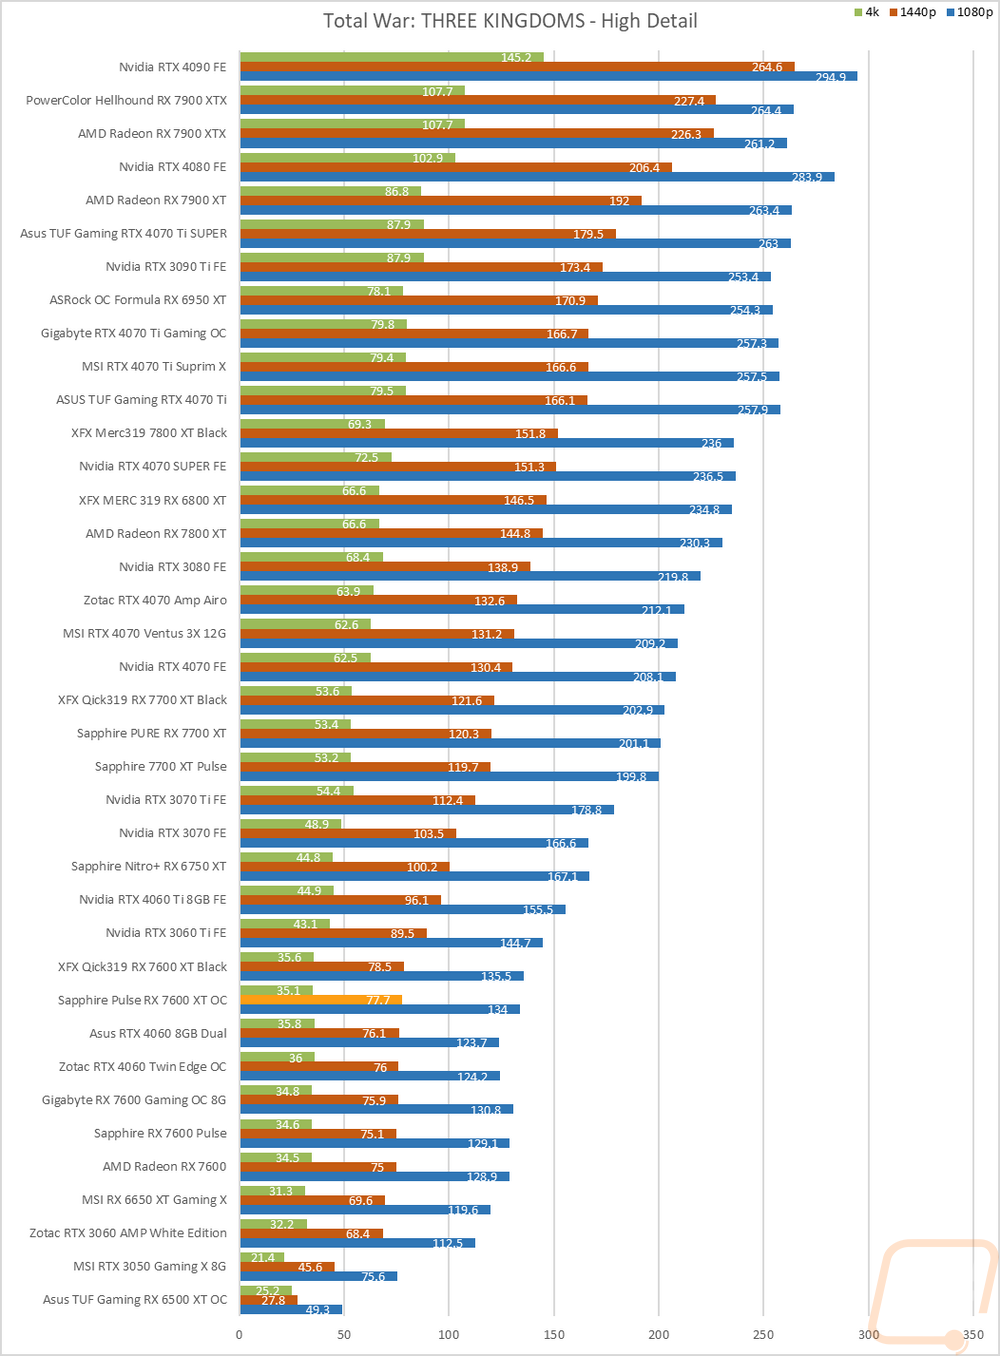
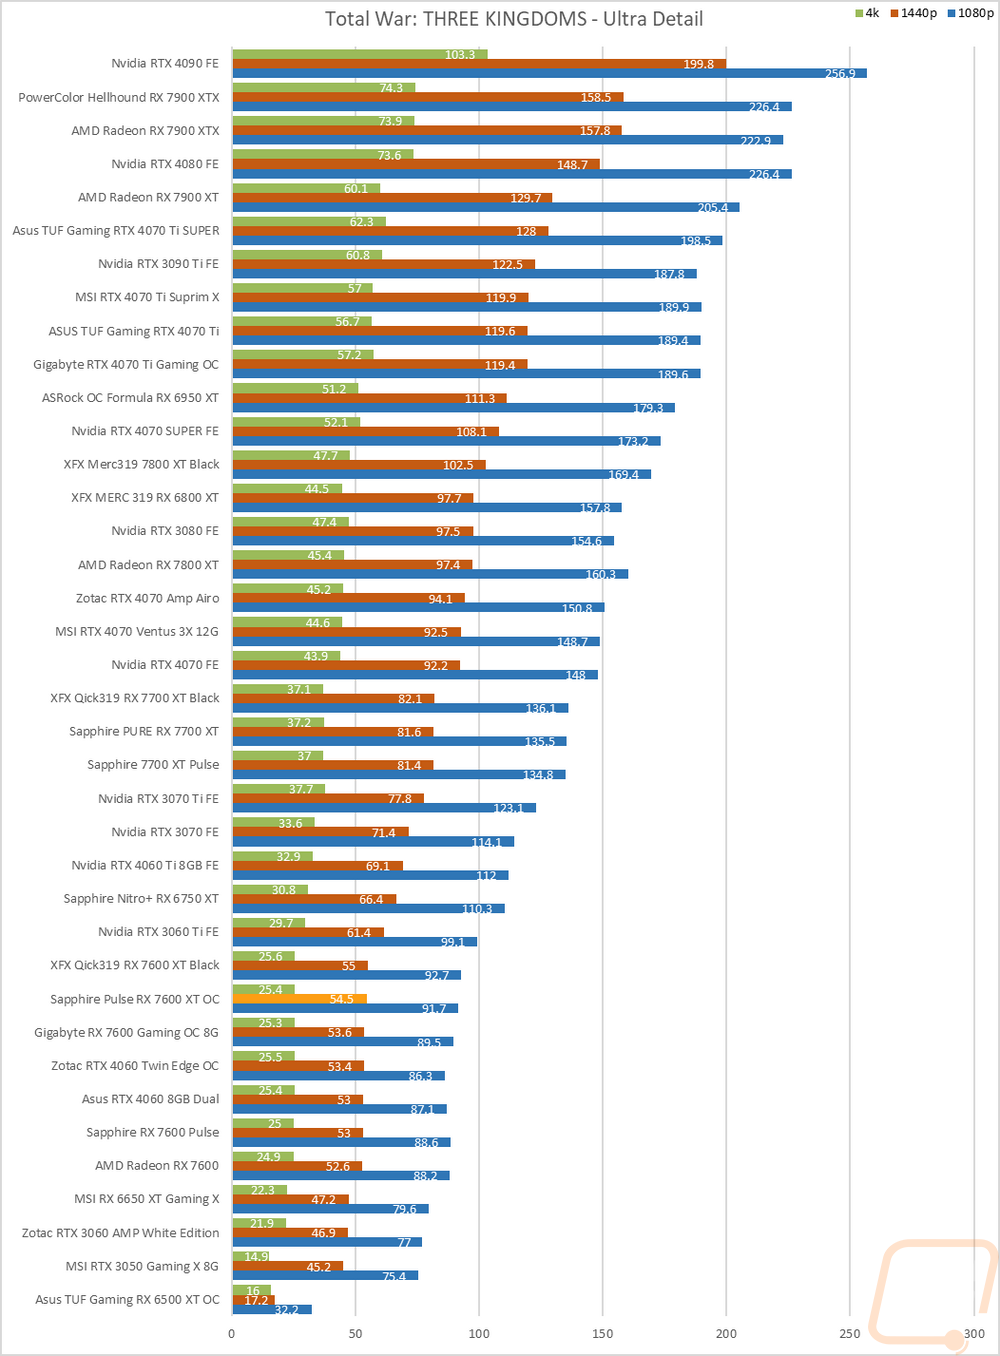
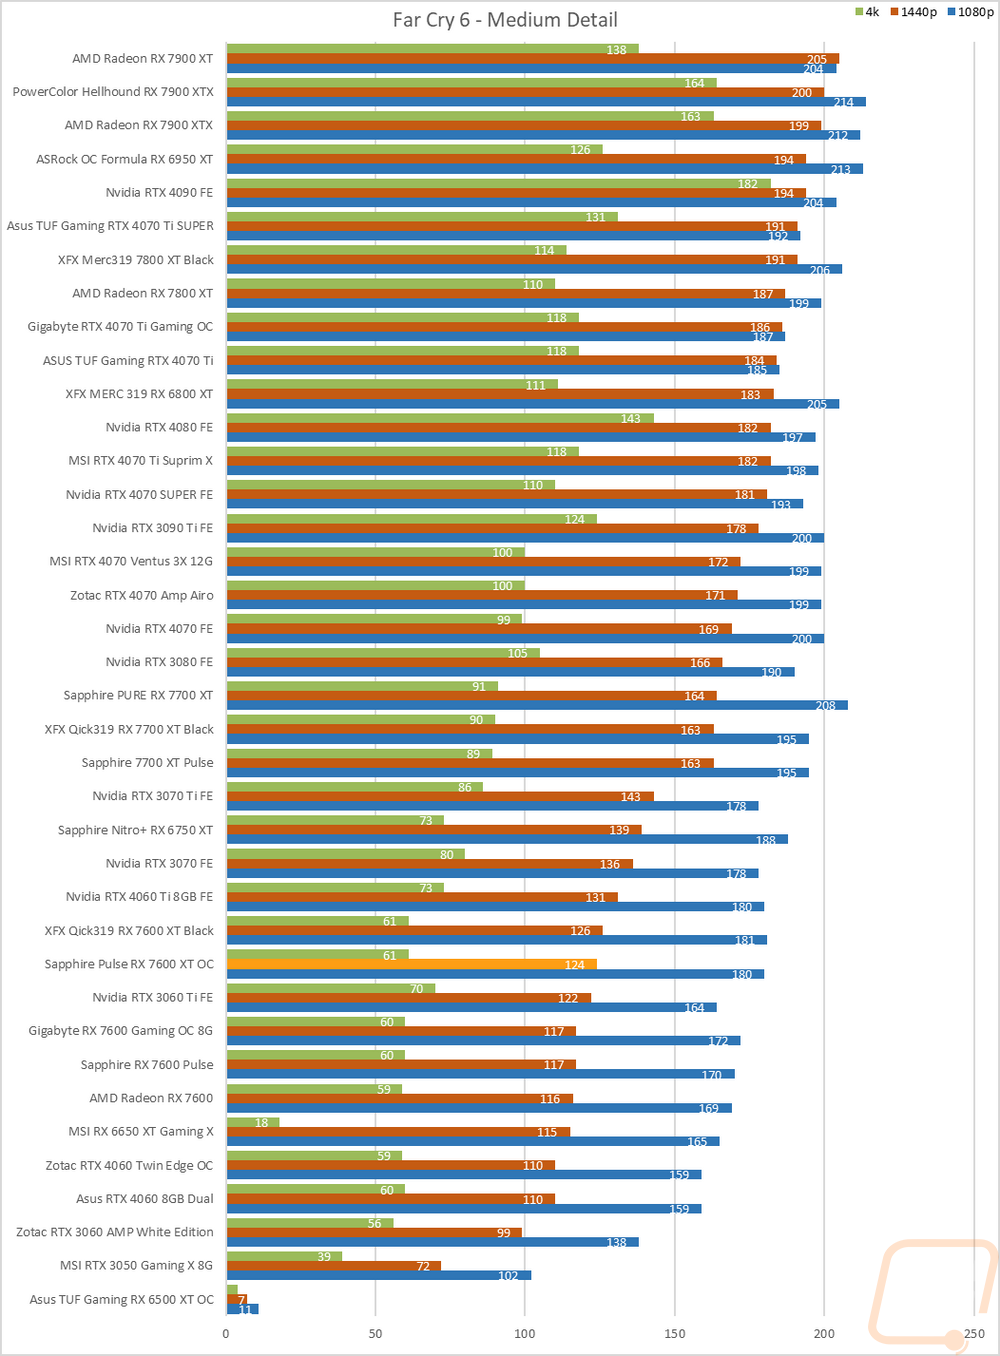
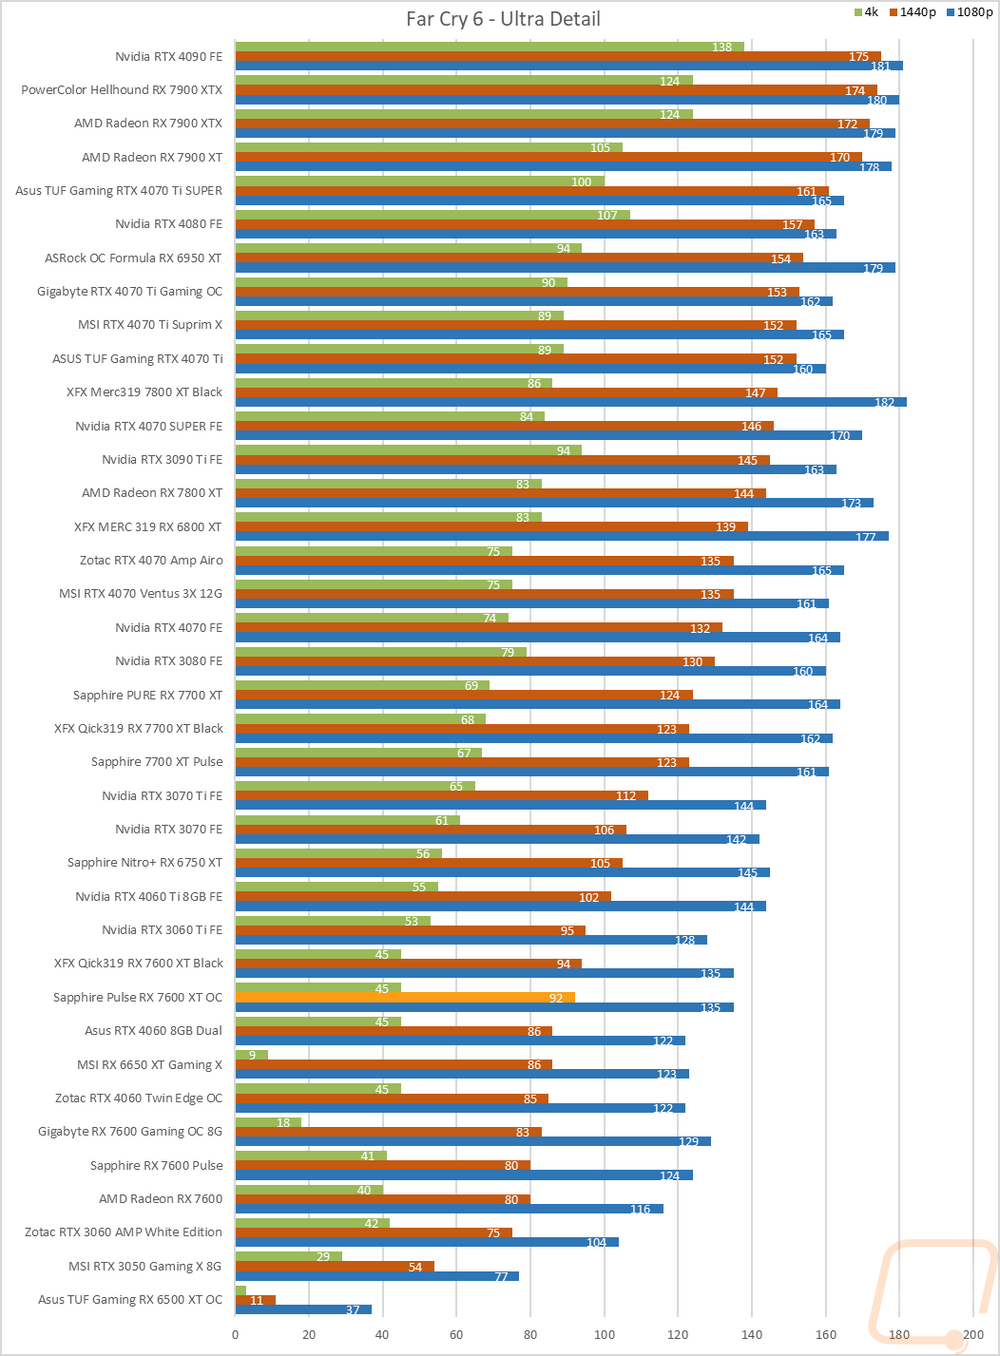
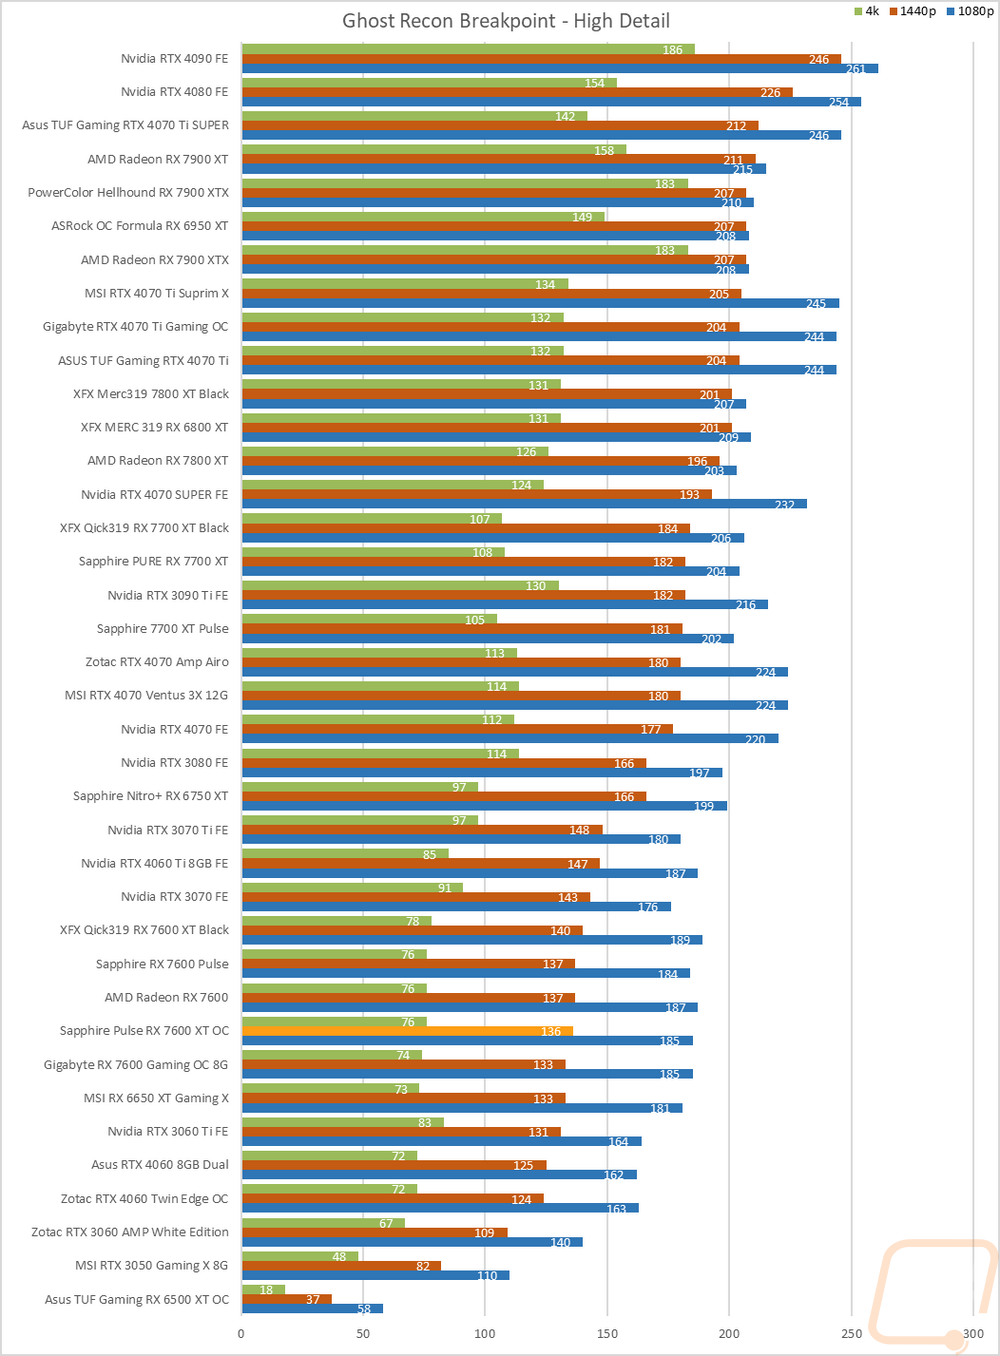
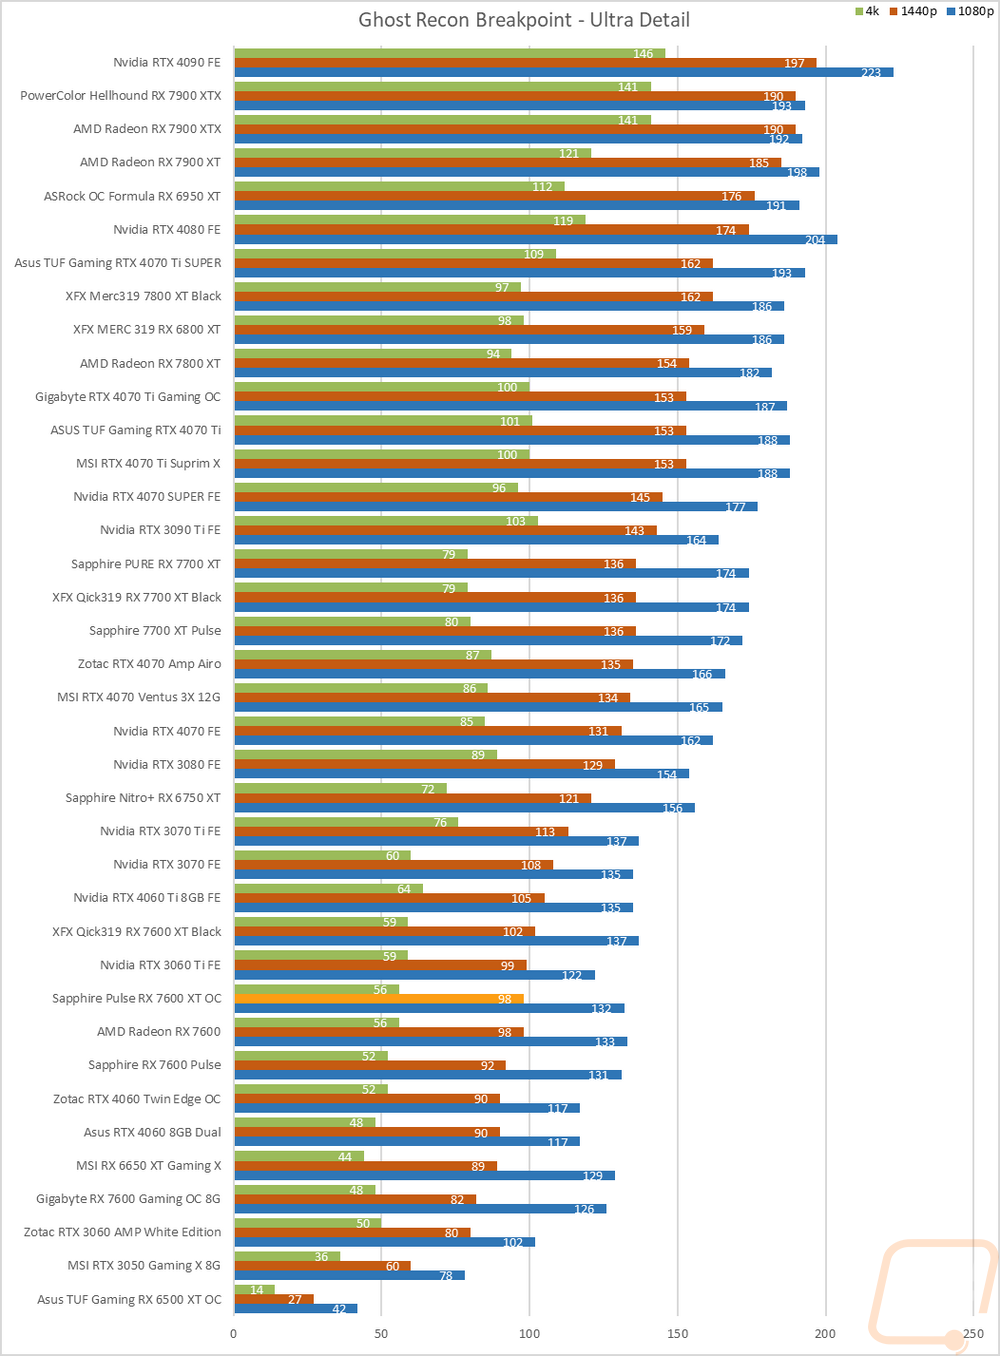
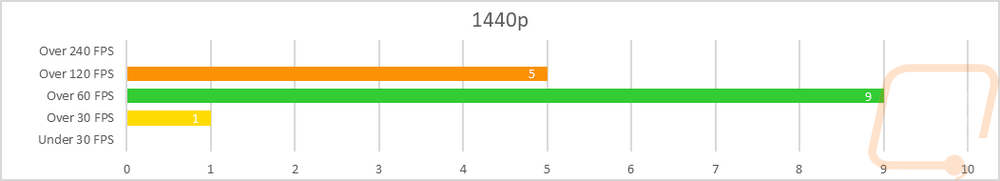
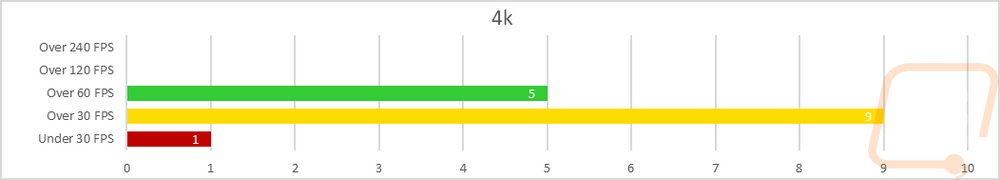
So how did the Pulse RX 7600 XT OC do? Well at 1080p, its targeted resolution it kicked butt. All of the results came in over 60 FPS but a majority were up over 120 FPS with 9 over 120 FPS and 5 in the 60-119 range. There was also one that reached over 240 FPS as well. At 1440p it was still capable with just one result in that playable but not smooth 30-59 FPS range. 9 results were over 60 FPS and the other 5 were up over 120 FPS. Then at 4K, it's no surprise that performance dropped but what will be a surprise is that the Pulse RX 7600 XT OC still was playable with most of the results. One was under 30 FPS but 9 were in that 30-59 FPS range and 60 results ended up over 60 FPS. Overall what this tells us is that the Pulse RX 7600 XT OC is perfect for 1080p gaming and capable of handling 1440p as long as you play with the settings slightly. I wouldn’t get into 4k gaming with it though.
Of course, I have all of the actual in game results as well for anyone who wants to sort through the wall of graphs below. I have also put together averages for the Sapphire Pulse RX 7600 XT OC and a few other cards so we can get a good look at how they compare. The Sapphire Pulse RX 7600 XT OC and the XFX 7600 XT both sit up ahead of the RX 7600 with the gap between the two GPUs not as big as you might expect, 5 FPS at 1080p and a little less at 1440p. This was 10 FPS ahead of the RTX 4060 however but the RTX 4060 Ti is still out in front at all three resolutions. The big surprise for me was that the Sapphire Pulse RX 7600 XT OC which has the same boost clock speed as the XFX is behind the XFX across the board. I have to assume that there is a difference in the power profile and or cooling making that difference but we will get into that here soon.
|
|
1080p |
1440p |
4k |
|
MSI RX 6650 XT Gaming X |
138 |
93.9 |
42.9 |
|
Zotac RTX 4060 Twin Edge OC |
135.7 |
94.4 |
50.1 |
|
AMD Radeon RX 7600 |
140.8 |
96.7 |
50.4 |
|
Sapphire Pulse RX 7600 XT OC |
145.2 |
99.8 |
51 |
|
XFX Qick319 RX 7600 XT Black |
146.5 |
101.1 |
52.2 |
|
Nvidia RTX 4060 Ti 8GB FE |
160.1 |
115.3 |
62 |