In-Game Benchmarks
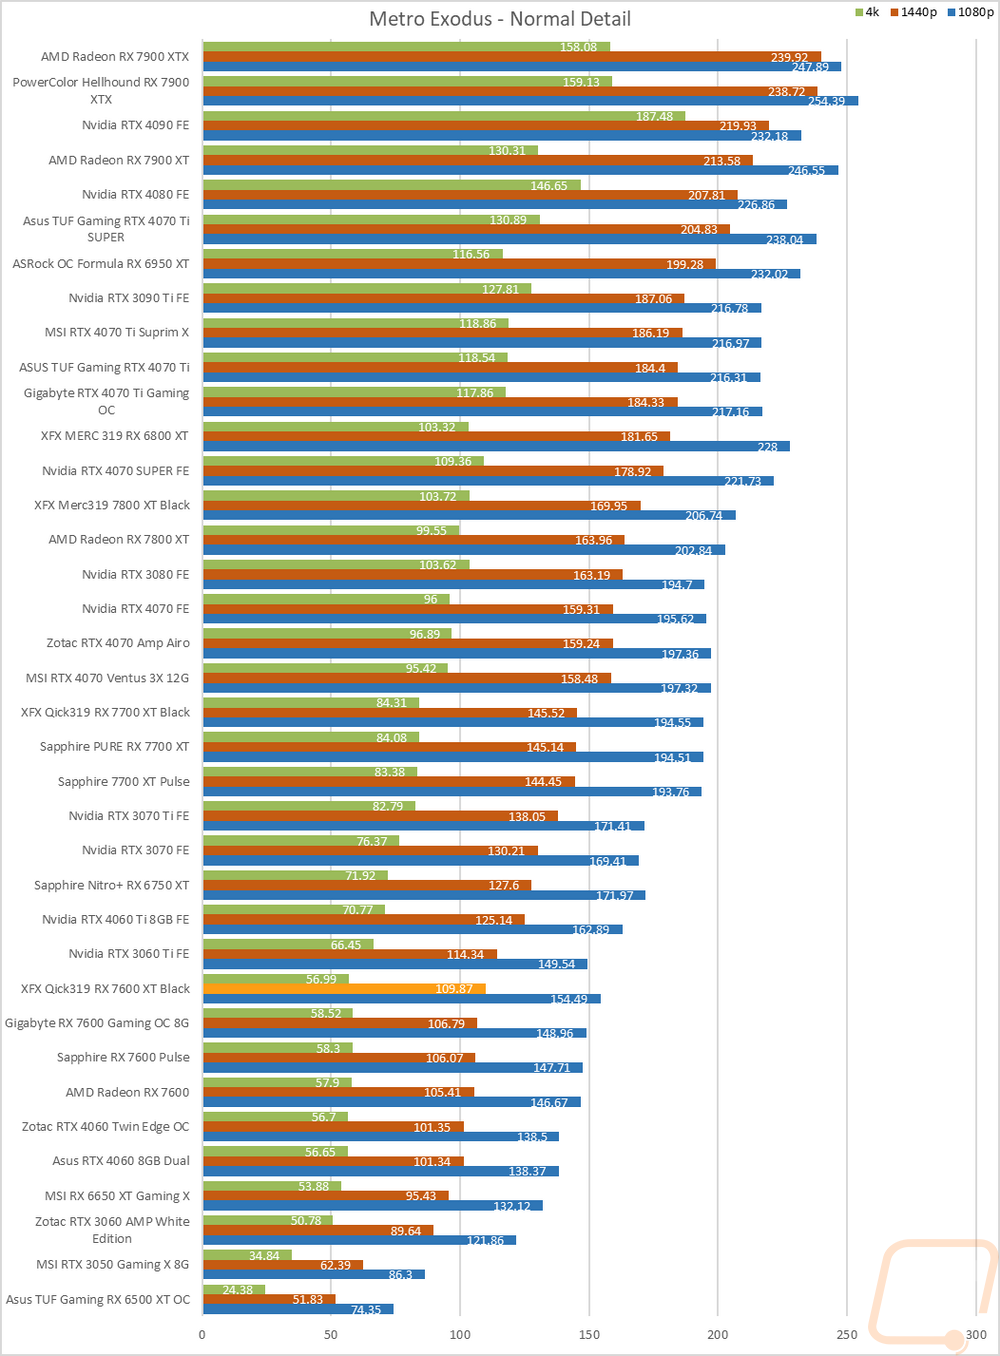
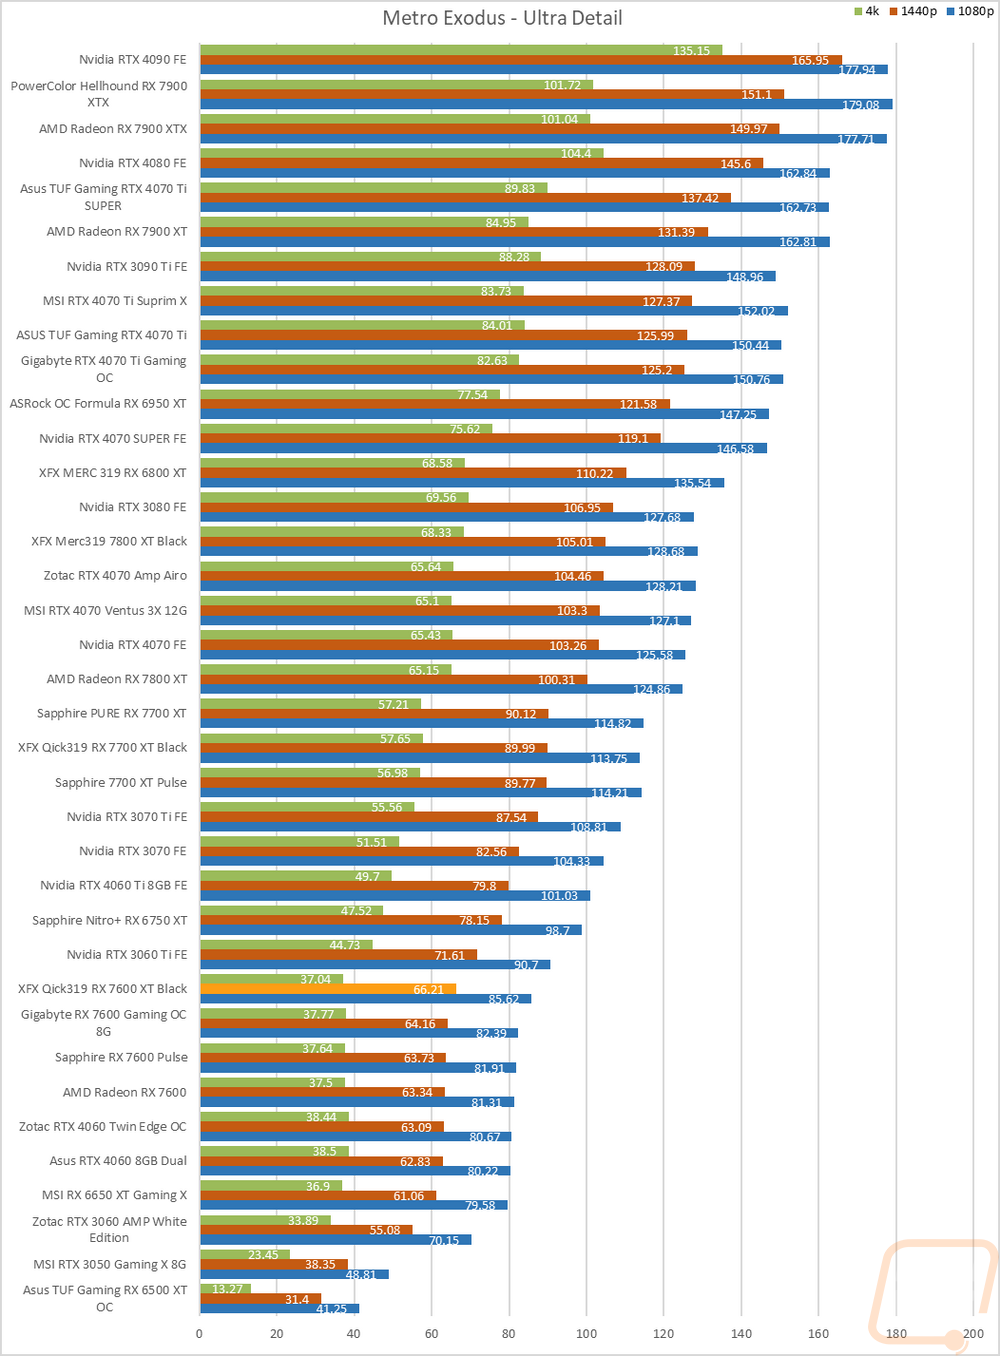
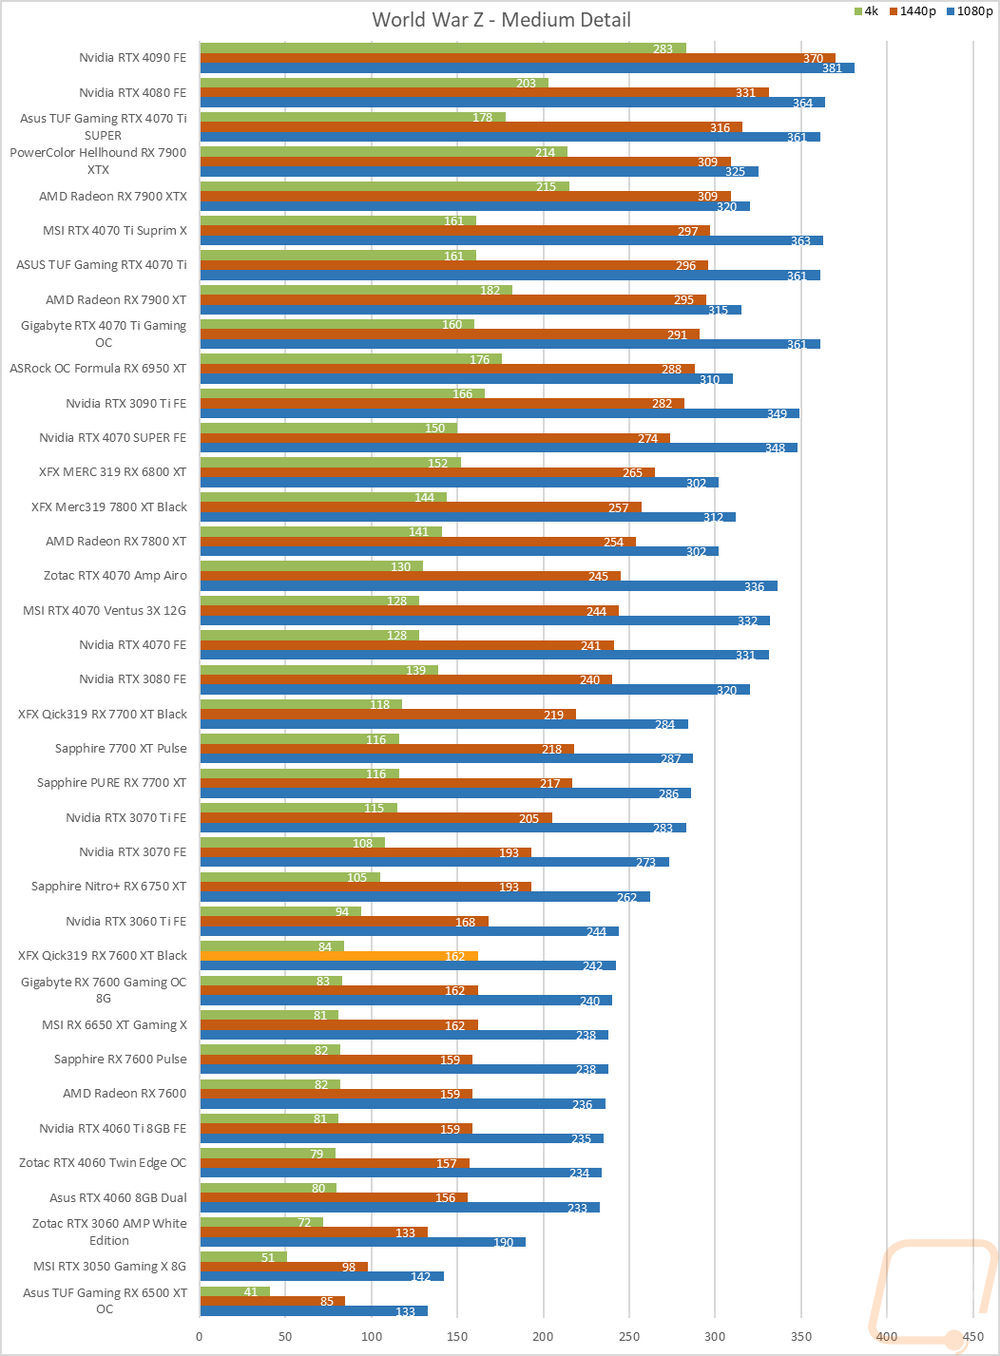
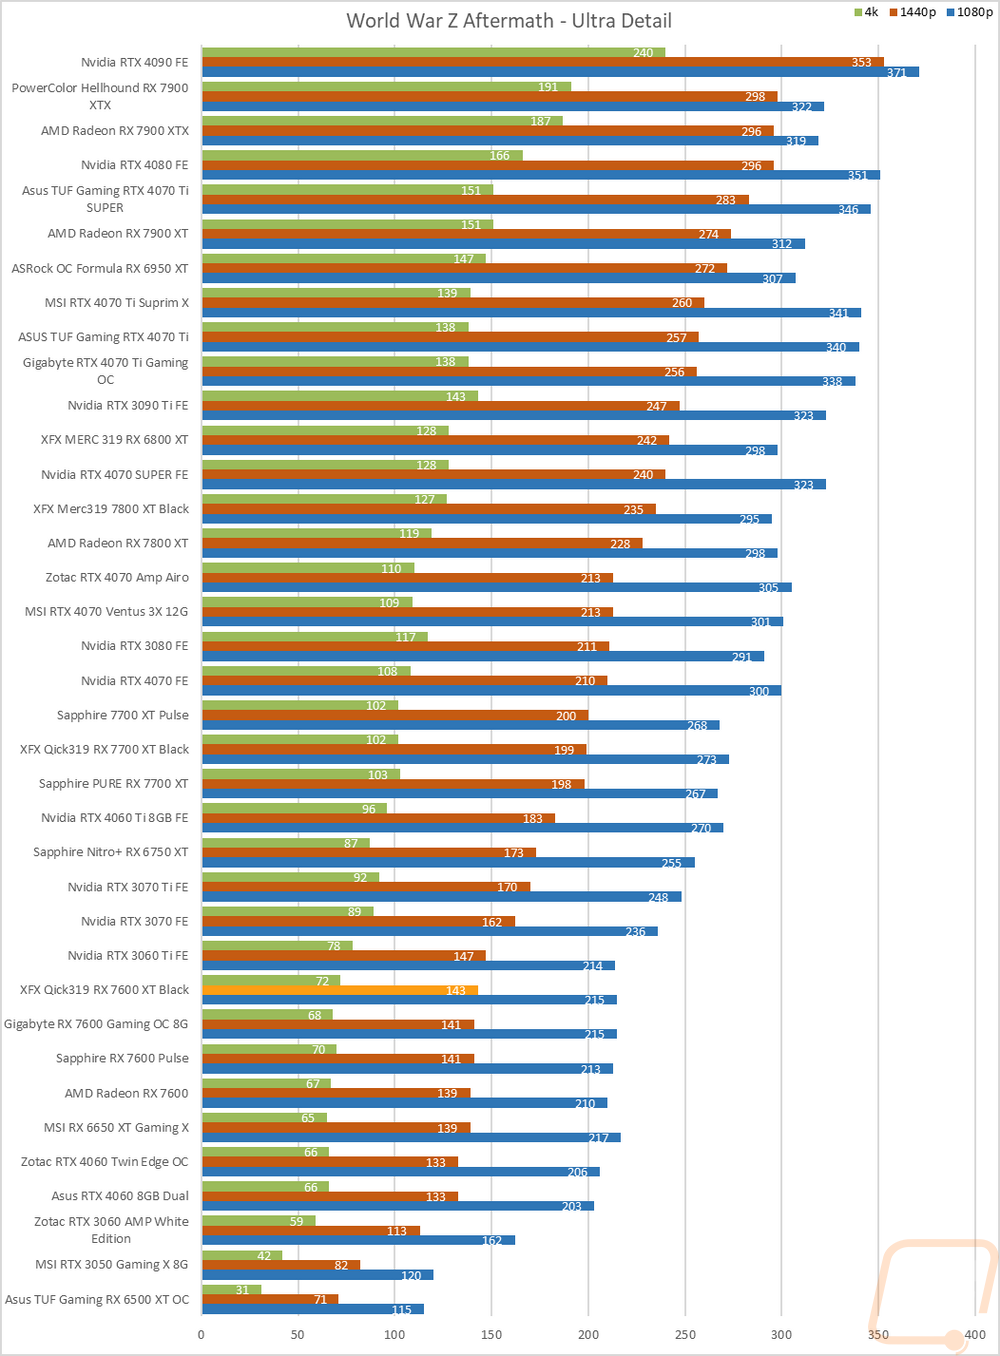
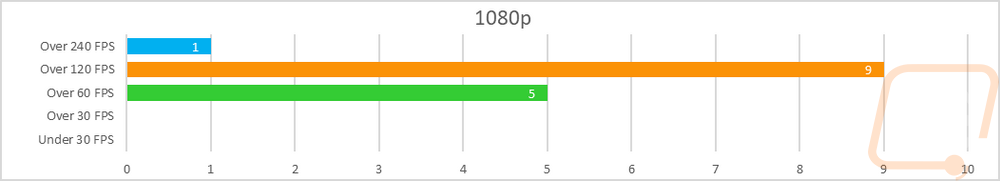
Now we finally get into the in game performance and that is the main reason people pick up a new video card. To test things out I ran through our new benchmark suite that tests 8 games at three different resolutions (1080p, 1440p, and 4k). Most of the games tested have been run at the highest detail setting and a mid-range detail setting to get a look at how turning things up hurts performance and to give an idea of whether turning detail down from max will be beneficial for frame rates. In total, each video card is tested 45 times and that makes for a huge mess of results when you put them all together. To help with that I like to start with these overall playability graphs that take all of the results and give an easier-to-read result. I have one for each of the three resolutions and each is broken up into four FPS ranges. Under 30 FPS is considered unplayable, over 30 is playable but not ideal, over 60 is the sweet spot, and then over 120 FPS is for high refresh rate monitors.
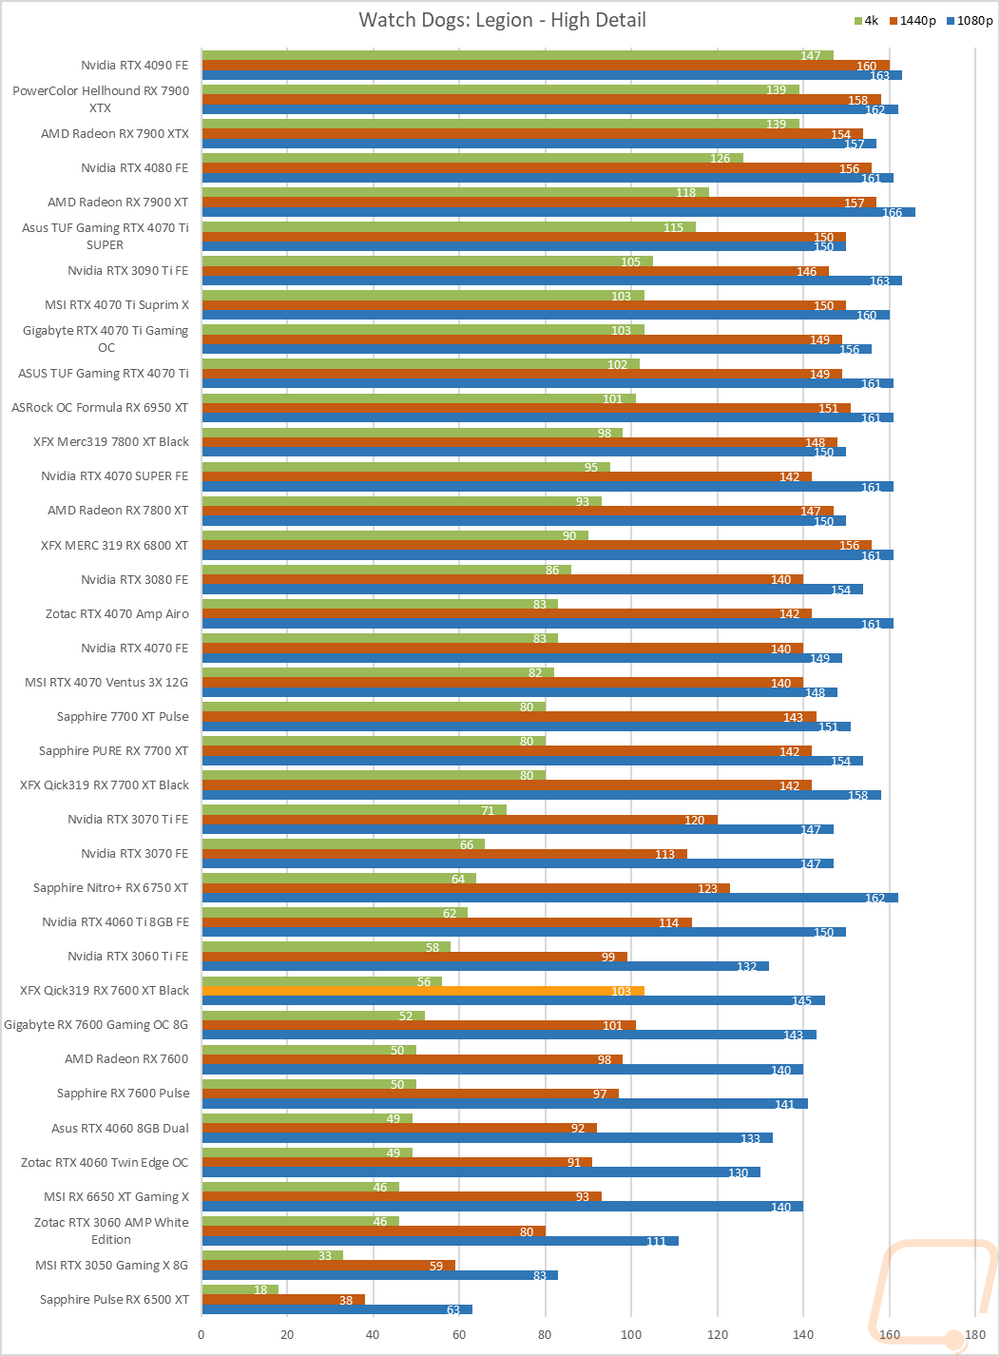
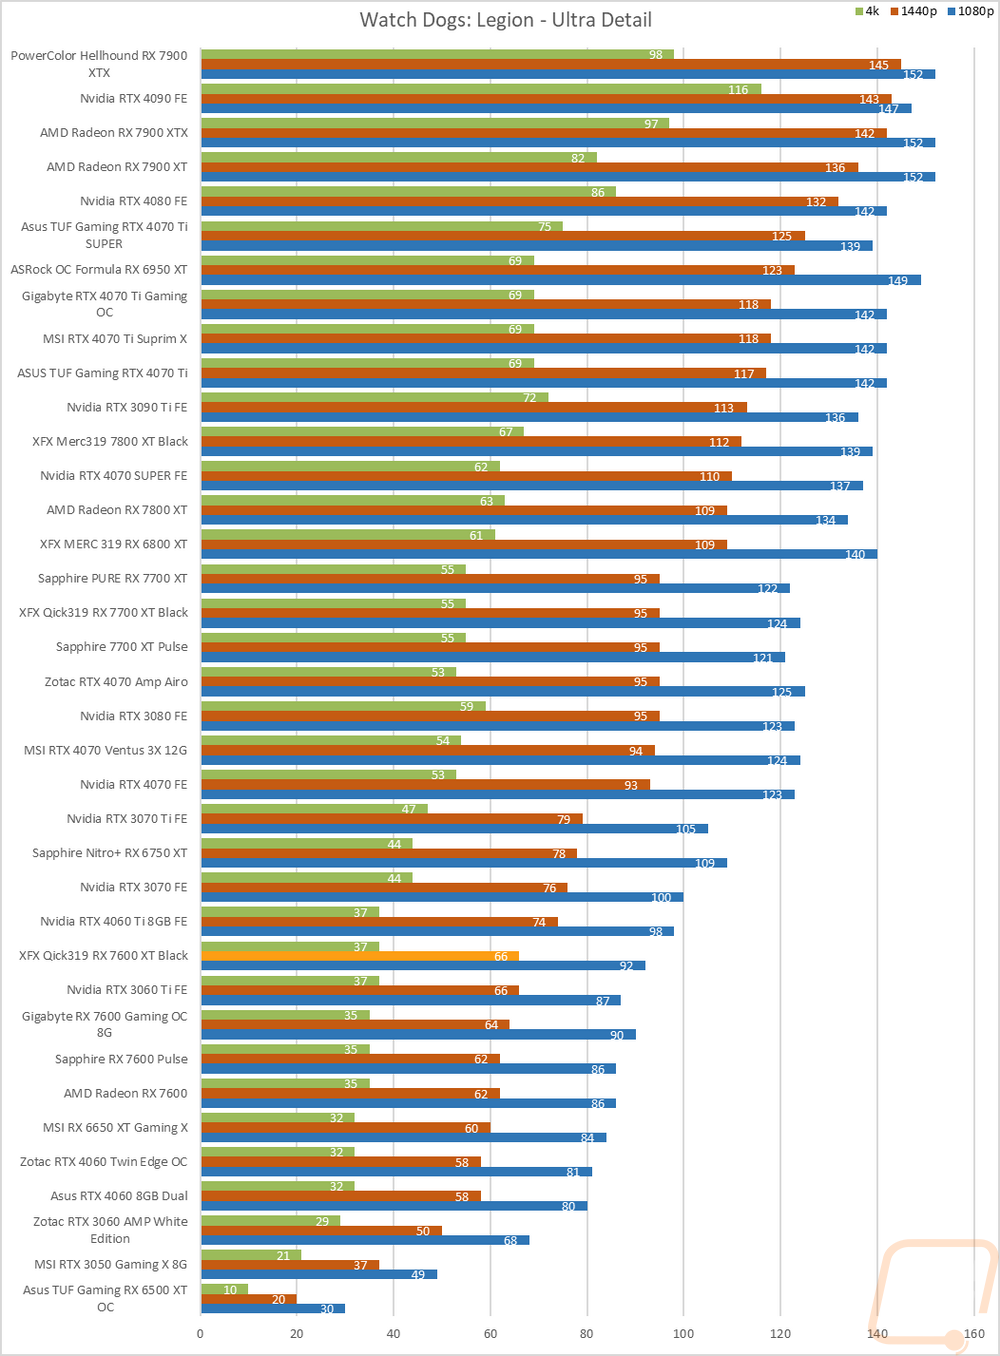
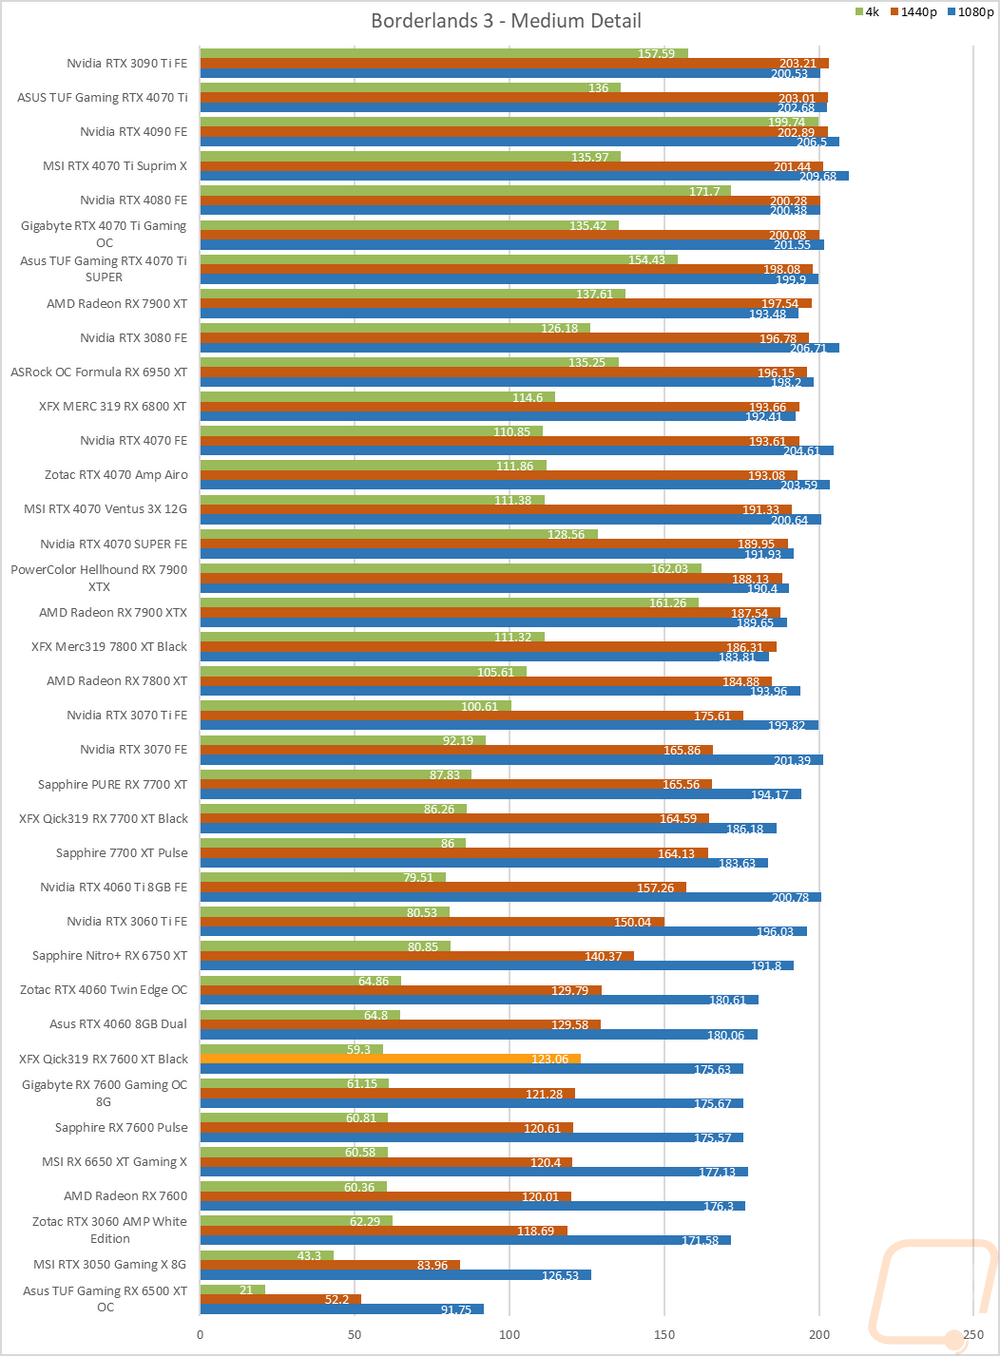
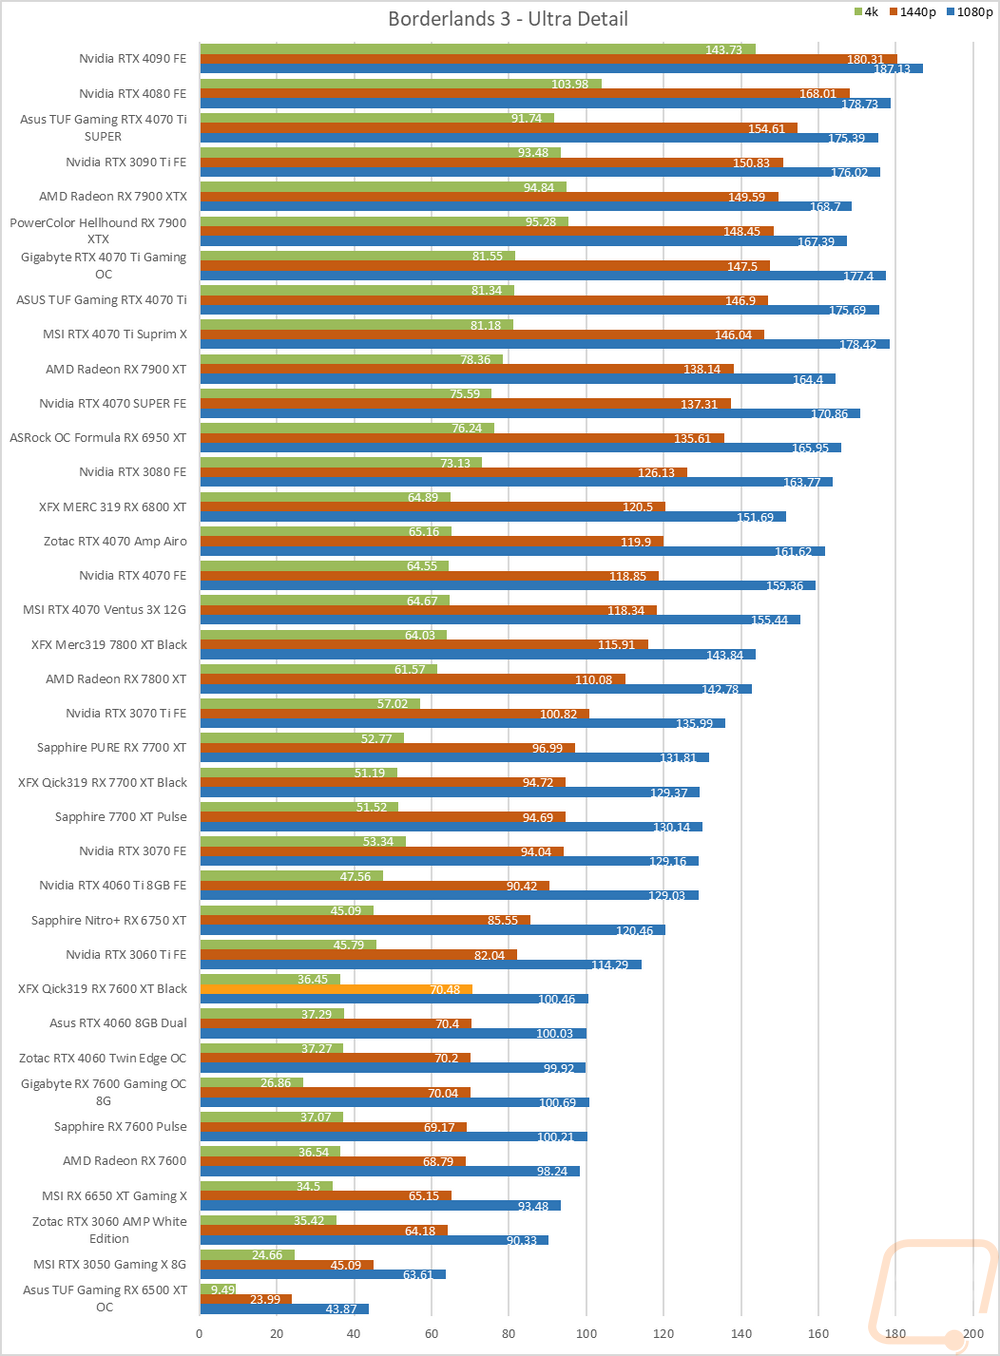
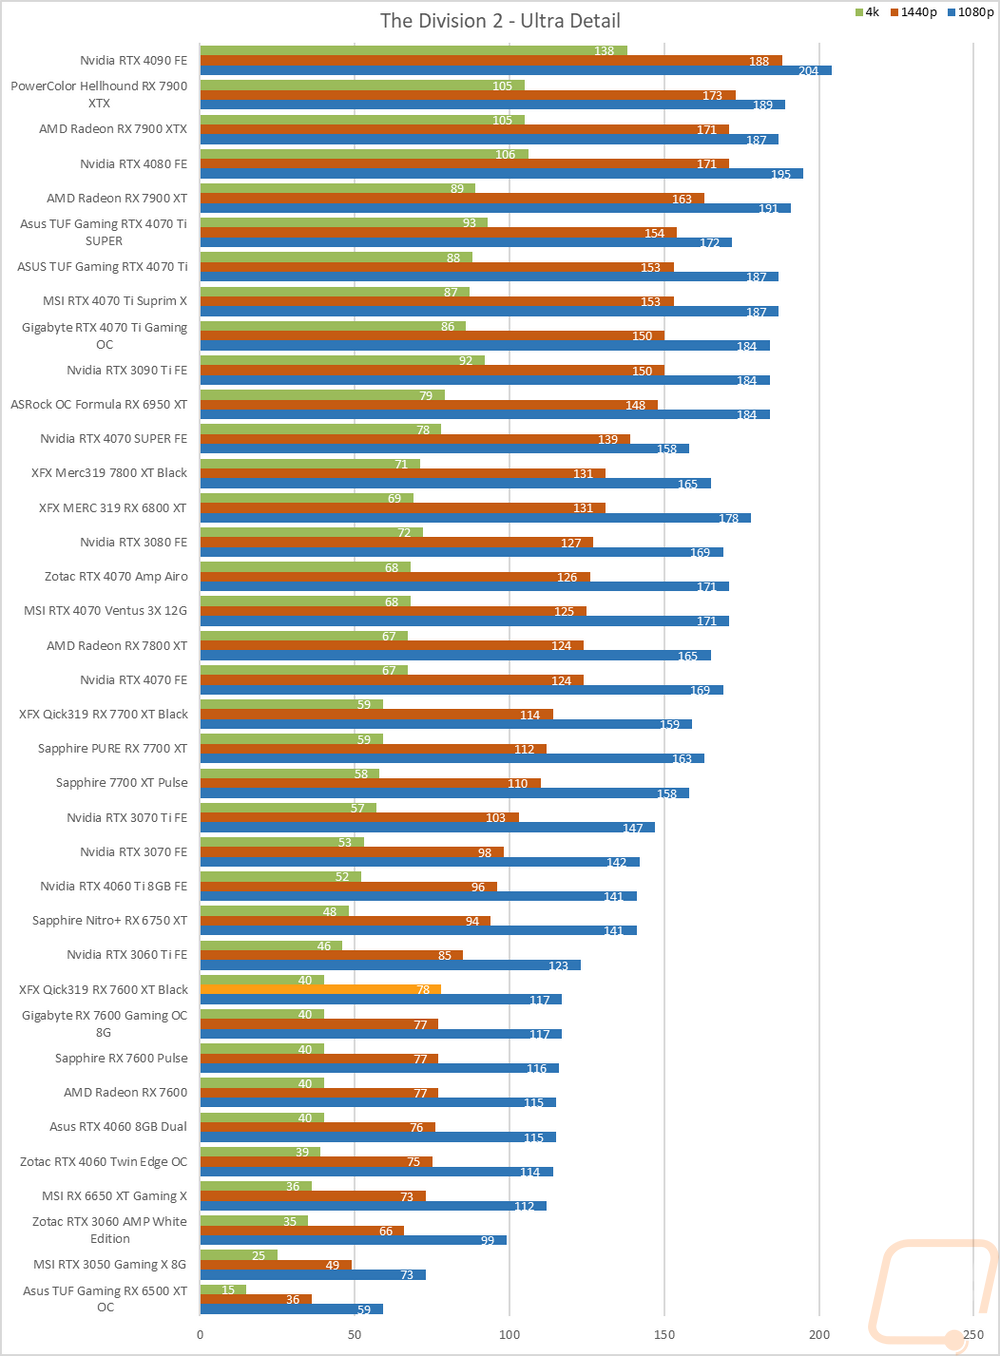
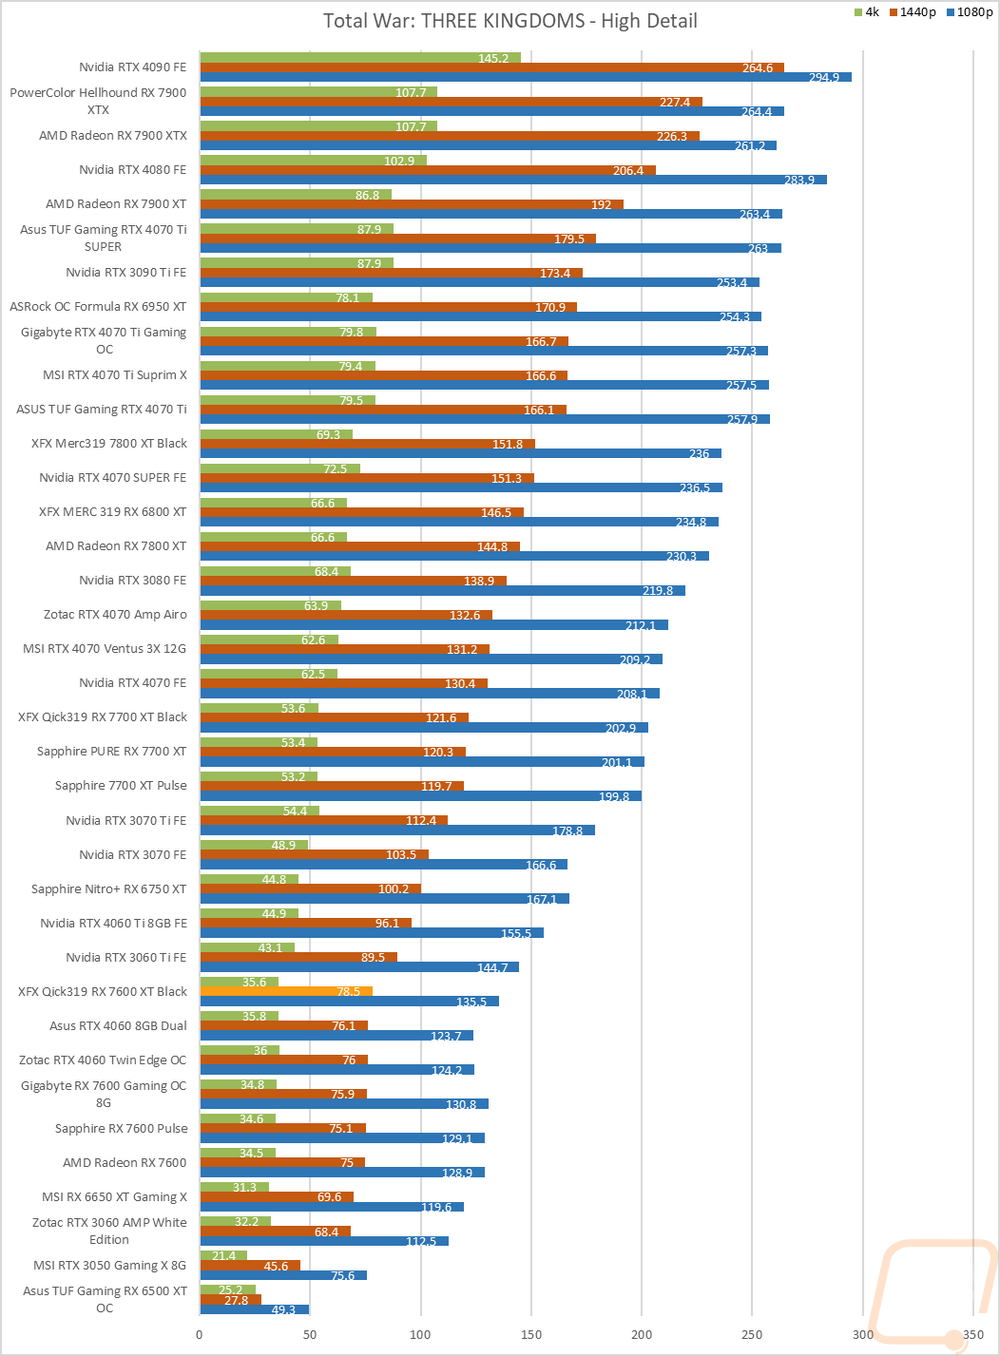
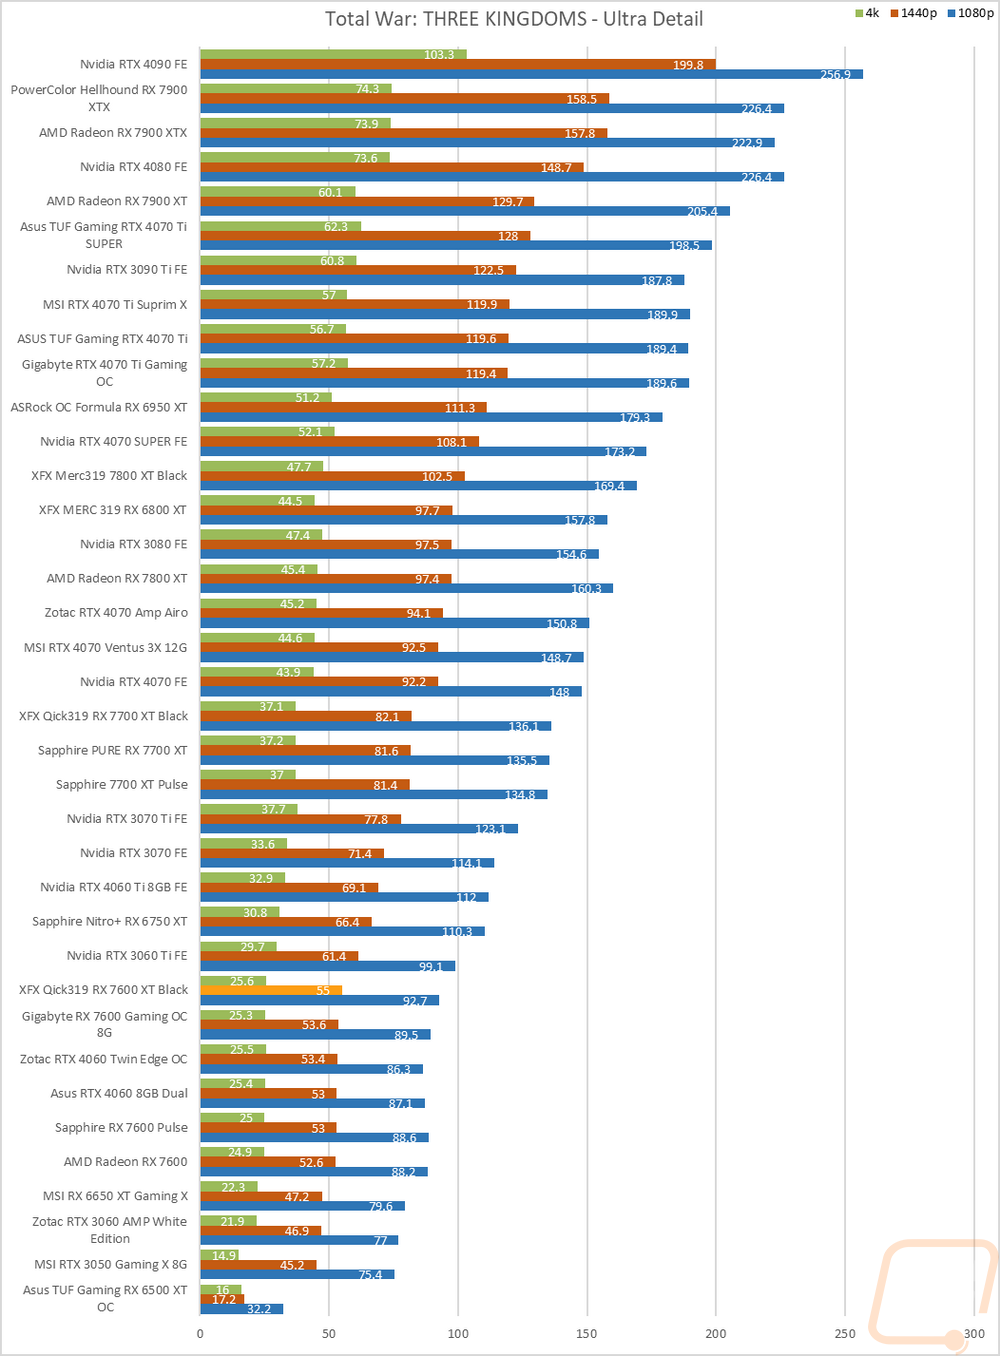
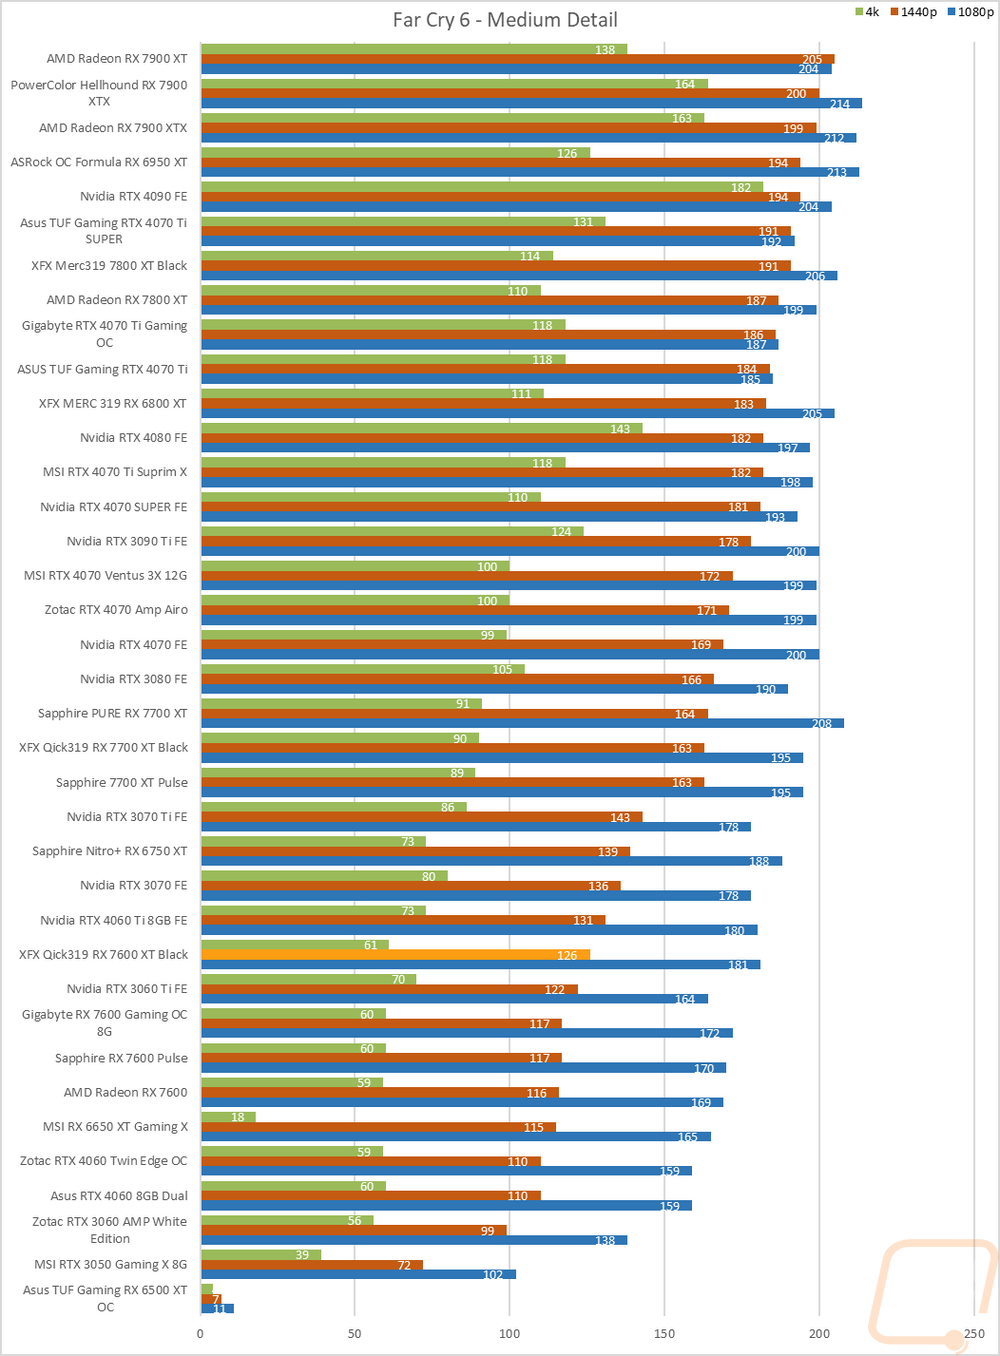
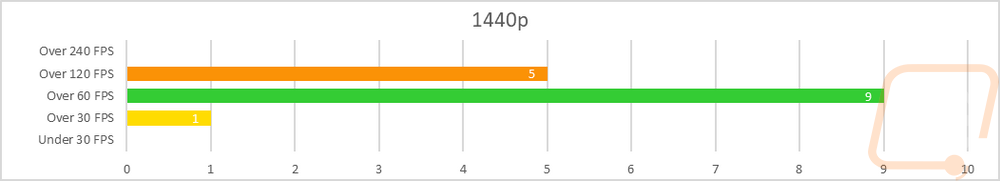
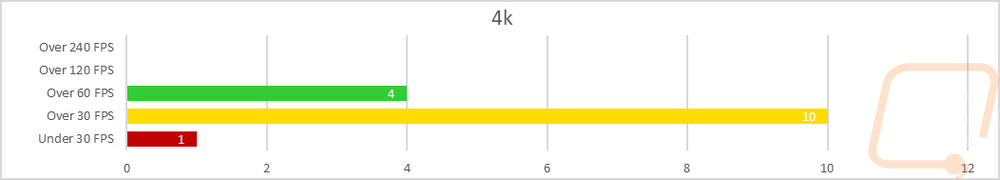
So how did the XFX Qick319 RX 7600 XT Black do? At 1080p, which is the target resolution for the 7600 XT, all of the results came in at 60 FPS or higher with 1 reaching over 240 FPS, 9 over 120 FPS, and 5 over 60 FPS. At 1440p the XFX Qick319 RX 7600 XT Black still has 5 results coming in at over 120 FPS. A majority of the results (nine) are over 60 FPS but there was one result that fell in that playable but not smooth 30-59 FPS range. At 4k there weren’t really any surprises, this isn’t a card designed for 4K gaming. Four results did come in over 60 FPS but 10 were in that 30-59 FPS playable but not smooth range and one was down under 30 FPS as well.
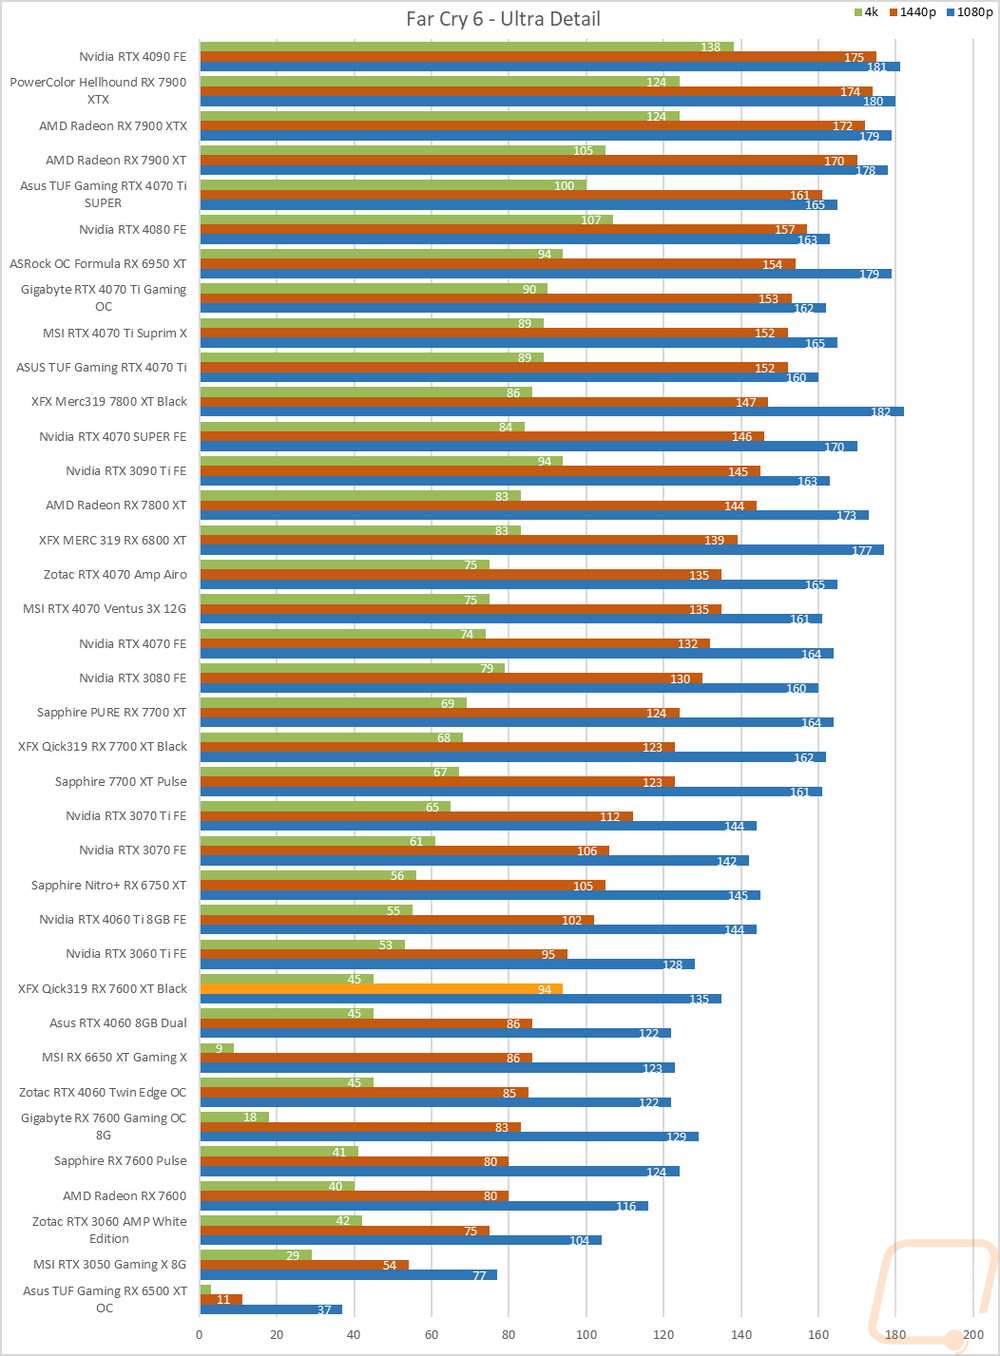
Of course, I have all of the actual in game results as well for anyone who wants to sort through the wall of graphs below. I also put together the averaged numbers for the XFX Qick319 RX 7600 XT Black alongside of the stock clocked RX 7600, an overclocked RX 6650 XT, an overclocked RTX 4060, and the Founders Edition RTX 4060 Ti 8GB as well for comparison. Going in, after seeing the synthetic performance numbers I was a little concerned that the XFX Qick319 RX 7600 XT Black even with its overclock over the 2755 MHz clock speed of the 7600 XT wouldn’t set itself apart from the RX 7600. But Beyond clock speeds, the XFX Qick319 RX 7600 XT Black does have the upgraded memory as well, did that change things at all? Well, the XFX Qick319 RX 7600 XT Black at 1080p sits almost 6 FPS above the 7600. At 1440p it is 4 FPS higher and then at 4k the difference was 2 FPS. This was a 4% improvement at 1080p, 5.1% at 1440p, and 3.6% at 4k which isn’t too bad. Both cards outperformed the RTX 4060 across the board and no surprises with the 4060 Ti even with just 8GB VRAM was still out in front at all three resolutions.
|
|
1080p |
1440p |
4k |
|
MSI RX 6650 XT Gaming X |
138 |
93.9 |
42.9 |
|
Zotac RTX 4060 Twin Edge OC |
135.7 |
94.4 |
50.1 |
|
AMD Radeon RX 7600 |
140.8 |
96.7 |
50.4 |
|
XFX Qick319 RX 7600 XT Black |
146.5 |
101.1 |
52.2 |
|
Nvidia RTX 4060 Ti 8GB FE |
160.1 |
115.3 |
62 |