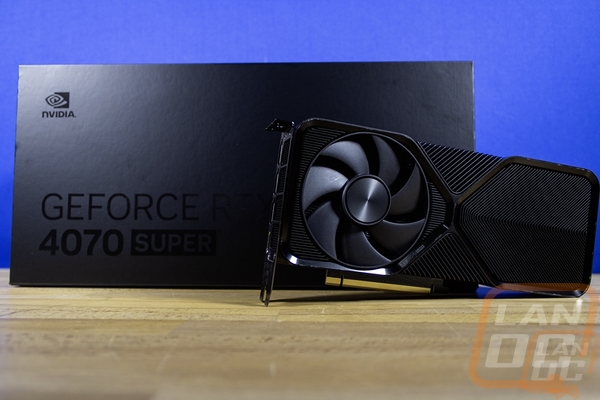
Nvidia introduced a refreshed 2000 Series lineup back in 2019 with models having a SUPER designation at the end and here we are 5 years later and this year at CES they did that once again with their 4000 Series of cards, skipping the 3000 Series. Their CES press conference announced the new RTX 4080 SUPER, RTX 4070 Ti SUPER, and the RTX 4070 SUPER. The last of which goes on sale tomorrow January 17th but ahead of that we have the chance to take a look at the Nvidia Founders Edition of the RTX 4070 SUPER to see what it is all about so let’s dive in.
Product Name: Nvidia RTX 4070 SUPER Founders Edition
Review Sample Provided by: Nvidia
Written by: Wes Compton
Amazon Affiliate Links: HERE
What’s so SUPER
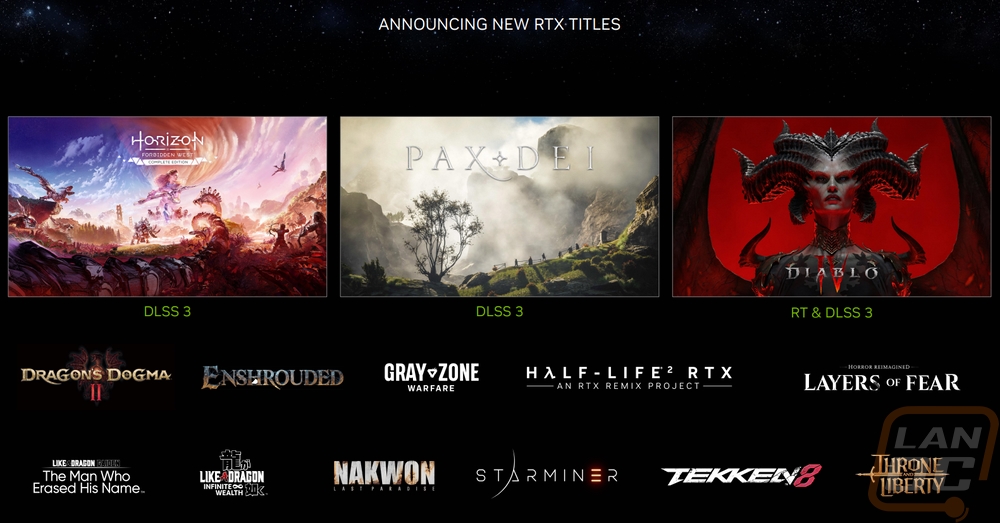
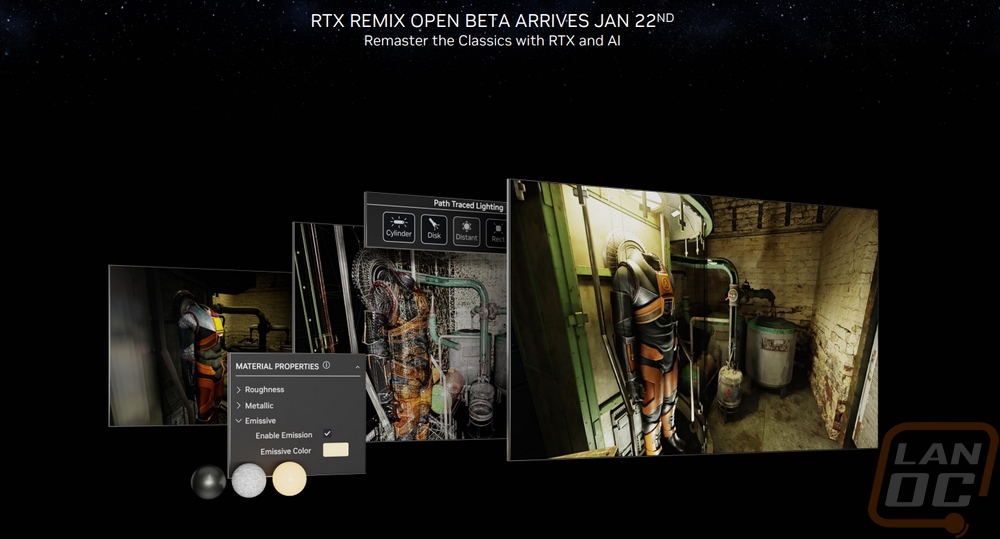
Nvidia’s CES announcements were all covered in their video but to hit a few highlights before getting into what the three new SUPER cards have to offer. They touched on a few new upcoming RTX supported titles. One of those is Half-Life 2 RTX which was done using the RTX Remix tool. That tool is going into open beta offering an easy way for modders and developers to upgrade past and current games to utilize RTX technology. Anything that makes it easier to do will only help get more support and in this case, we can potentially see upgraded games that we would have never seen otherwise which is exciting.
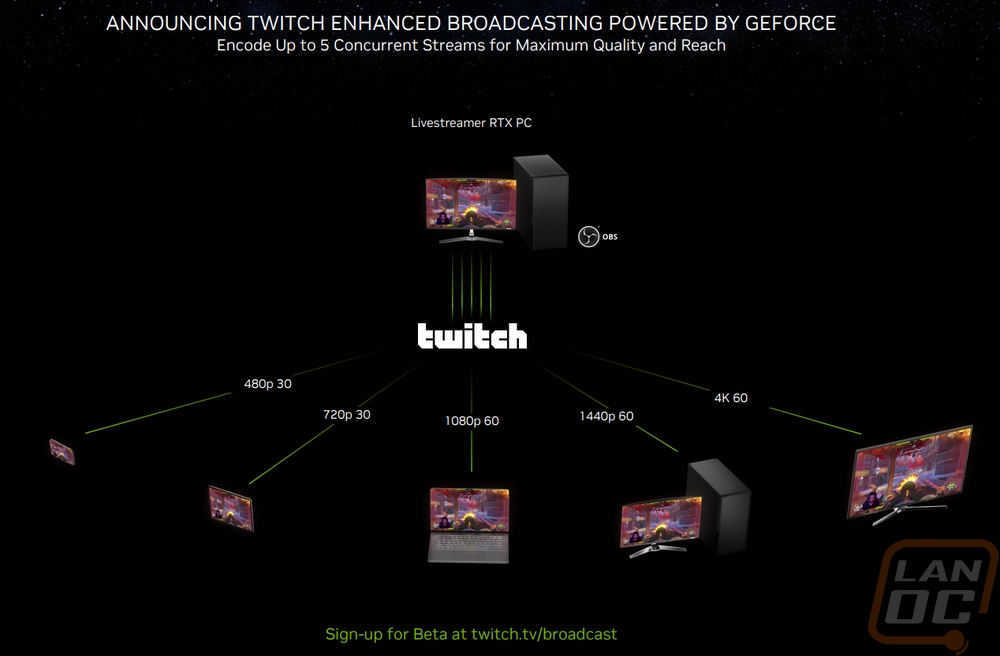
Nvidia and Twitch announced a new way for Twitch streamers to now offer a better range of resolutions. In the past, for anyone who isn’t one of their main partnered streamers you are stuck with just one resolution. This way you will be able to stream at a range of resolutions and frame rates. Viewers who have the bandwidth can enjoy better quality 4k 60 FPS streams but users on mobile or lower-performing internet connections will still be able to watch as well.
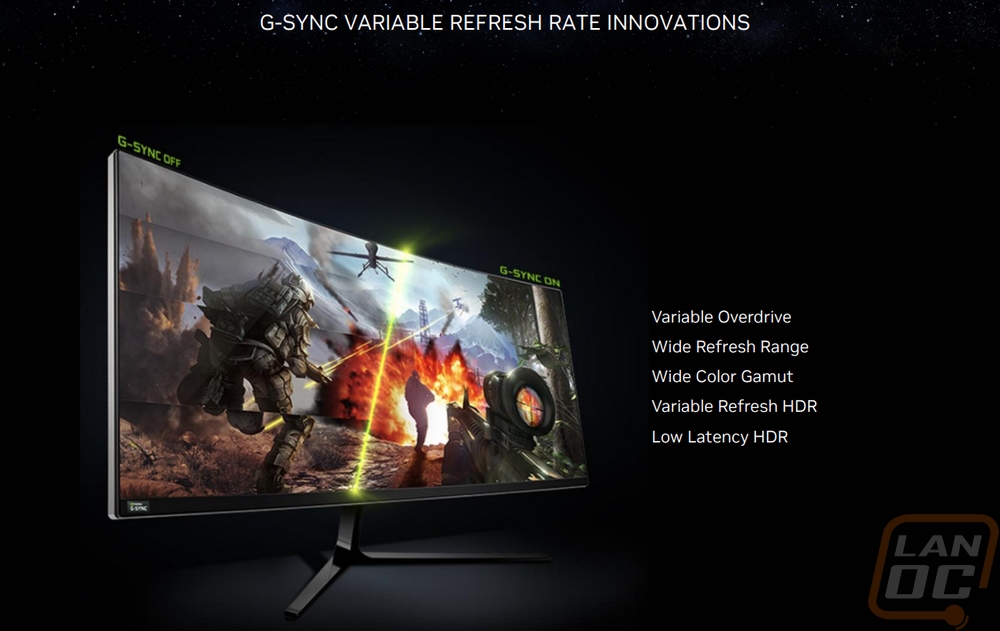
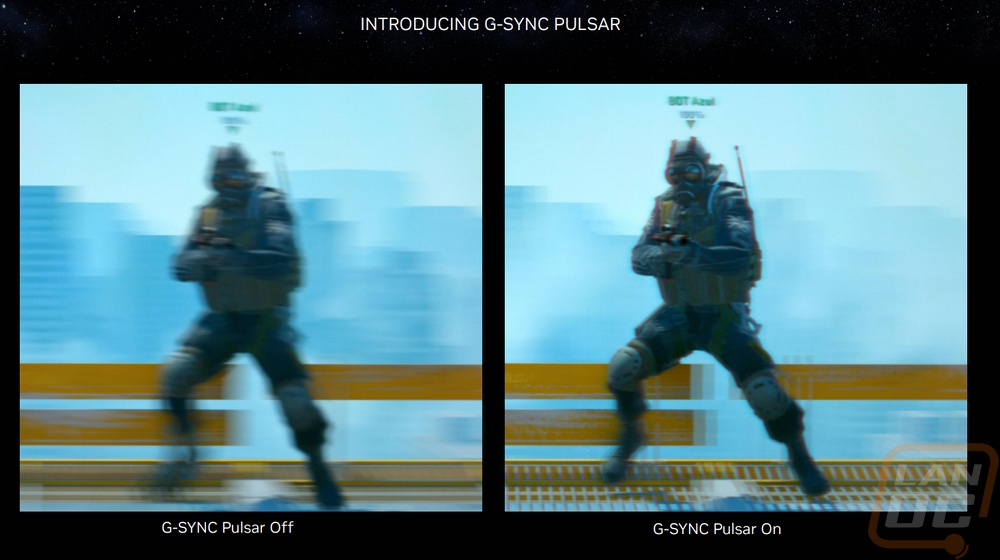
They announced improvements in G-Sync variable refresh rate. Along with that, they covered G-Sync Pulsar which is part of their VRR or variable refresh rate technology. Pulsar bridges the gap between using variable refresh rate and ultra low motion blur to get a smooth experience but cut out the blur that you can get with it.
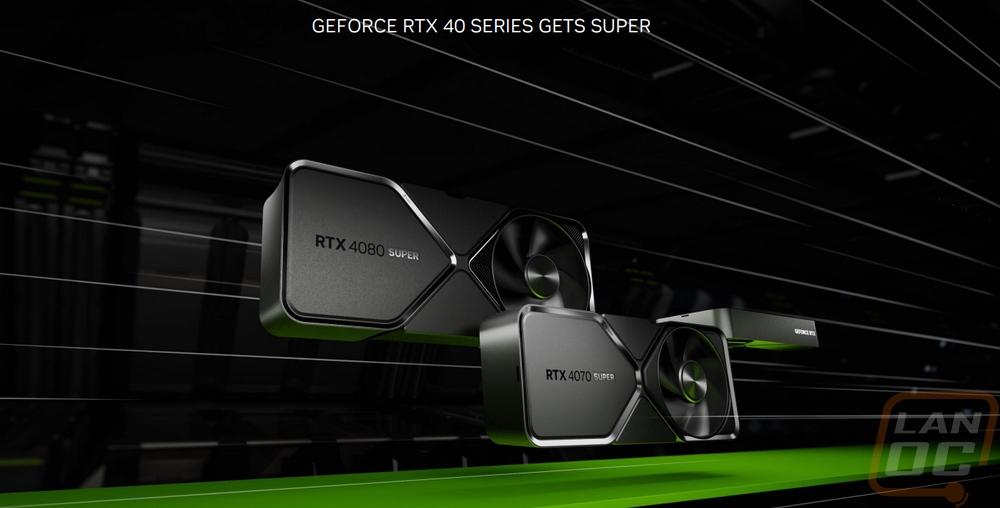
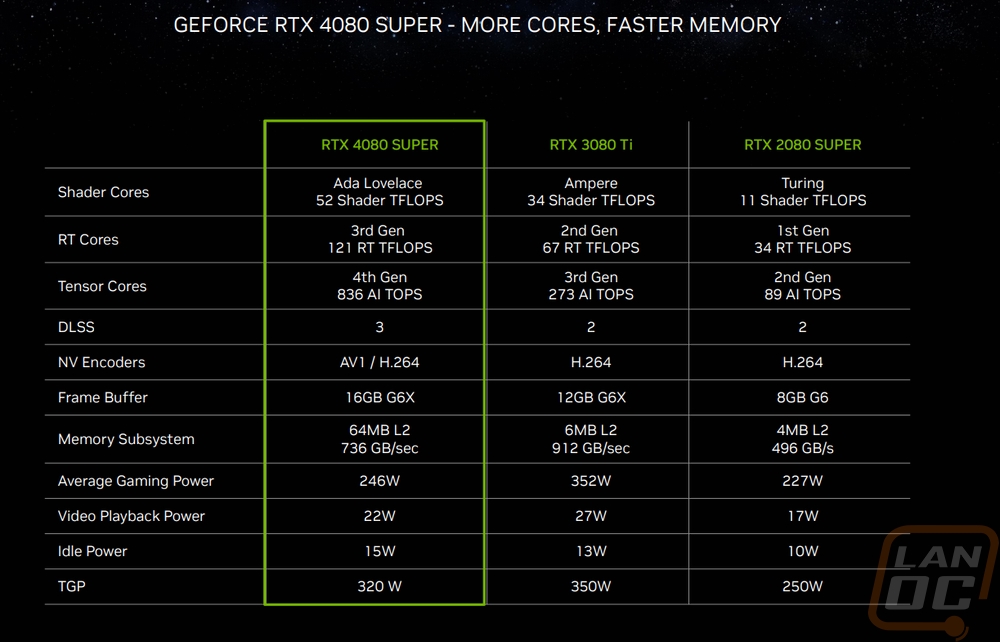
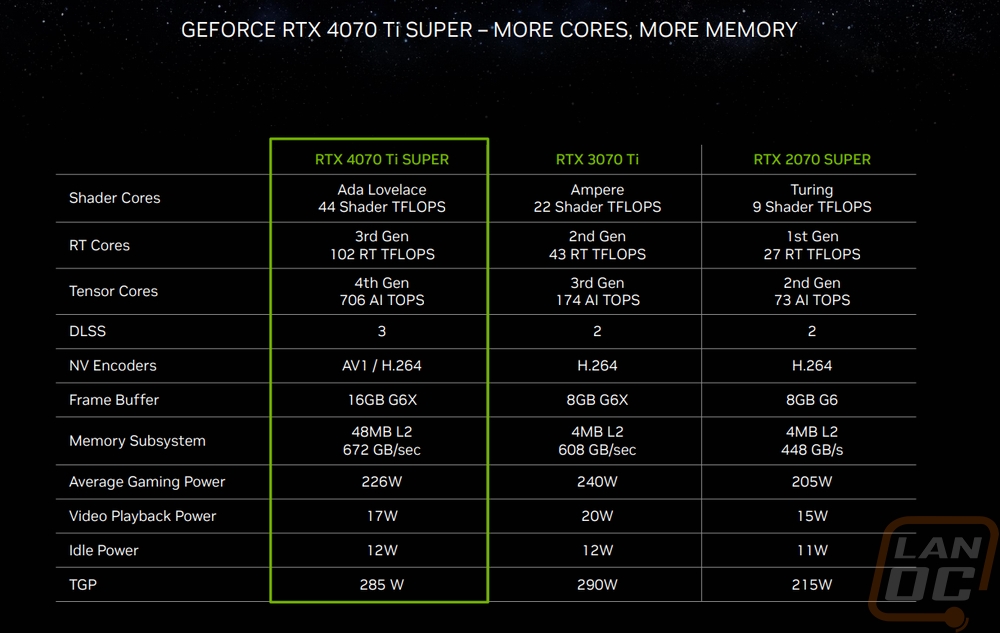
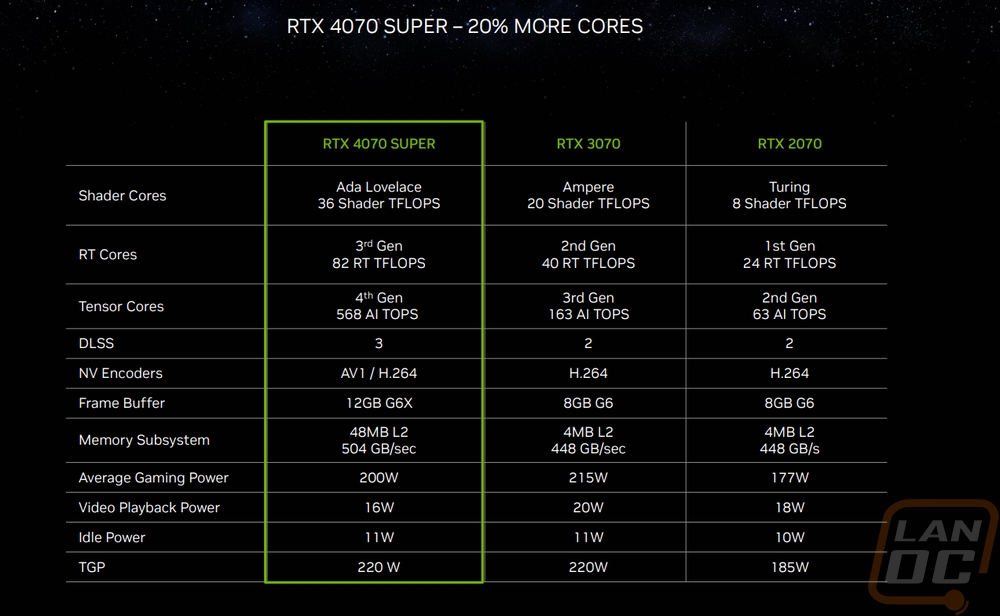
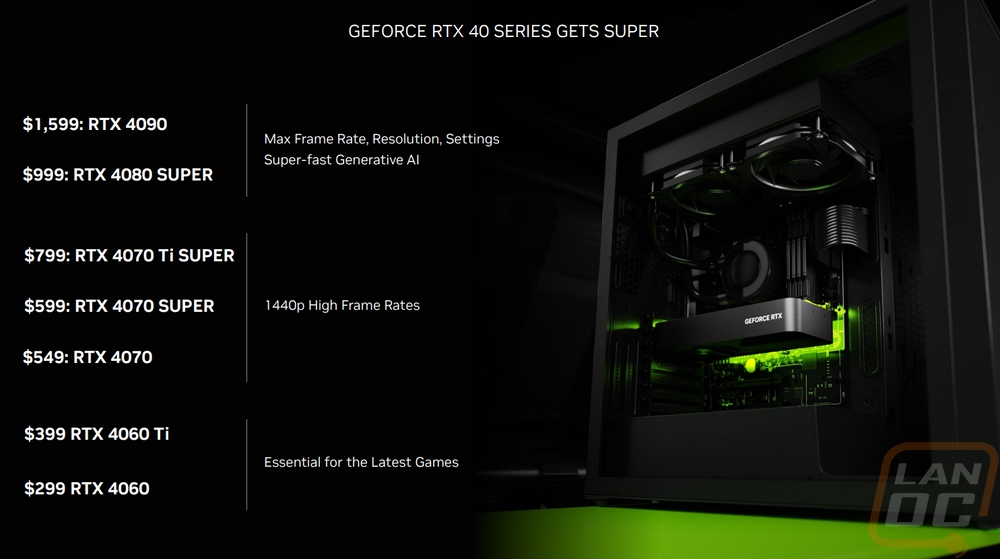
They then of course announced the three new SUPER cards and showed where all three will fit in their updated lineup. The RTX 4080 SUPER will replace the RTX 4080 and sit behind the RTX 4090 still. That will have an MSRP of $999, $200 less than the original MSRP of the RTX 4080. The new card has a faster base clock of 2295 MHz vs 2205 MHz on the 4080 and 40 MHz more on the boost clock with it now at 2550 MHz. The real improvement comes from more cores going from 9728 CUDA cores up to 10240. The RTX 4070 Ti SUPER replaces the RTX 4070 and has an MSRP of $799, the same as the original launch price of the RTX 4070. It gets a memory clock speed improvement but like with the 4080 SUPER, it's big improvements with the CUDA core count jumping up from 7680 up to 8448 which is a big improvement. With all of these cards, the tensor cores and RT cores will also scale up at the same rate as the CUDA cores as well. Lastly the RTX 4070 SUPER doesn’t replace the original RTX 4070, the original is staying in the lineup. The 4070 will now be $549, $50 less than its launch price and the RTX 4070 SUPER takes up that $599 price point and fits in between the 4070 and 4070 Ti SUPER. The CUDA core count goes from 5888 up to 7168, a 21.7% improvement and the same boost and memory clock speeds. Nvidia did bump up the power usage slightly with the 4070 SUPER now having a TGP of 220 Watts to the 200 Watts on the 4070, the 4080 SUPER and 4070 Ti SUPER both stay the same at 285 Watts and 320 watts respectively. Overall though I like that as a refresh the focus is on adding more cores, not cranking up clock speeds which we have seen with things like the RX 480 to RX 580.
|
Specifications |
RTX 2070 SUPER |
RTX 4070 |
RTX 4070 SUPER |
RTX 4070 Ti |
|
Graphics Processing Clusters |
5 or 6 |
4 |
5 |
5 |
|
Texture Processing Clusters |
20 |
23 |
28 |
30 |
|
Streaming Multiprocessors |
40 |
46 |
56 |
60 |
|
CUDA Cores |
2560 |
5888 |
7168 |
7680 |
|
Tensor Cores |
320 |
184 (4th Gen) |
224 (4th Gen) |
240 (4th Gen) |
|
RT Cores |
40 |
46 (3rd Gen) |
56 (3rd Gen) |
60 (3rd Gen) |
|
Texture Units |
160 |
184 |
224 |
240 |
|
ROPs |
64 |
64 |
80 |
80 |
|
Boost Clock |
1770 MHz |
2475 MHz |
2475 MHz |
2610 MHz |
|
Memory Clock |
1750 MHz |
1313 MHz |
1313 MHz |
1313 MHz |
|
Memory Data Rate |
14 Gbps |
21 Gbps |
21 Gbps |
21 Gbps |
|
L2 Cache Size |
4 MB |
36 MB |
48MB |
49 MB |
|
Total Video Memory |
8 GB GDDR6 |
12 GB GDDR6X |
12 GB GDDR6X |
12 GB GDDR6X |
|
Memory Interface |
256-bit |
192-bit |
162-bit |
192-bit |
|
Total Memory Bandwidth |
448.0 GB/s |
504 GB/sec |
504 GB/s |
504 GB/sec |
|
Texture Rate (Bilinear) |
283.2 Gigatexels/sec |
455.4 Gigatexels/sec |
561.1 GigaTexels/second |
626 Gigatexels/sec |
|
Fabrication Process |
TSMC 12 nm |
TSMC 4N NVIDIA Custom Process |
4N NVIDIA Custom Process |
TSMC 4N NVIDIA Custom Process |
|
Transistor Count |
13.6 Million |
35.8 billion |
35.8 Billion |
35.8 billion |
|
Connectors |
1x HDMI 2.0 3x DisplayPort 1.4a 1x USB Type-C |
3 x DisplayPort 1 x HDMI |
3 x DisplayPort 1 x HDMI |
3 x DisplayPort 1 x HDMI |
|
Power Connectors |
1x 6-pin 1x 8-pin |
2x PCIe 8-pin cables OR 300w or greater PCIe Gen 5 cable |
2x PCIe 8-pin cables (adapter in box) OR 300 W or greater PCIe Gen 5 cable
|
2x PCIe 8-pin cables OR 300w or greater PCIe Gen 5 cable |
|
Minimum Power Supply |
550 W |
650 Watts |
650 Watts |
700 Watts |
|
Total Graphics Power (TGP) |
215 W |
200 Watts |
220 Watts |
285 Watts |
|
Maximum GPU Temperature |
83° C |
90° C |
90° C |
90° C |
|
PCI Express Interface |
Gen 3 |
Gen 4 |
Gen 4 |
Gen 4 |
|
Launch MSRP |
$499 |
$599 |
$599 |
$799 |
Packaging
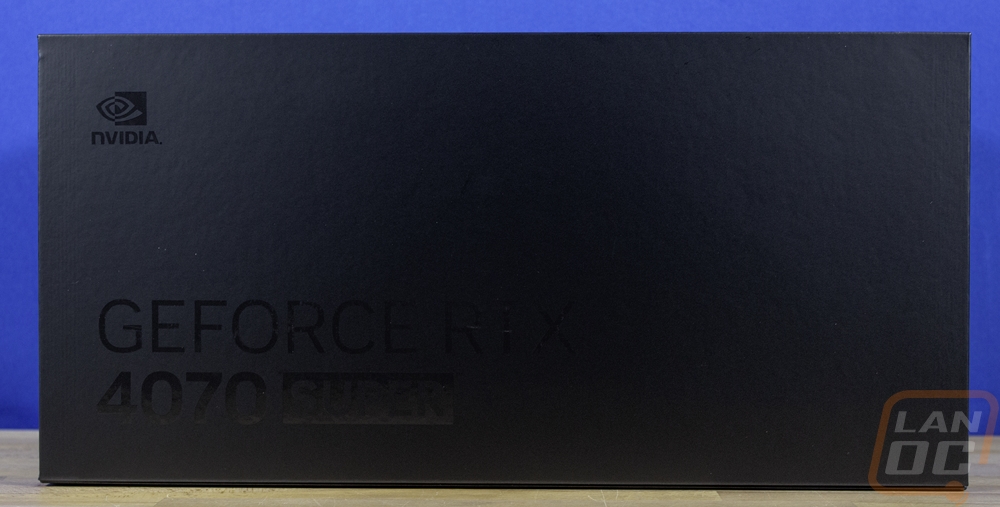
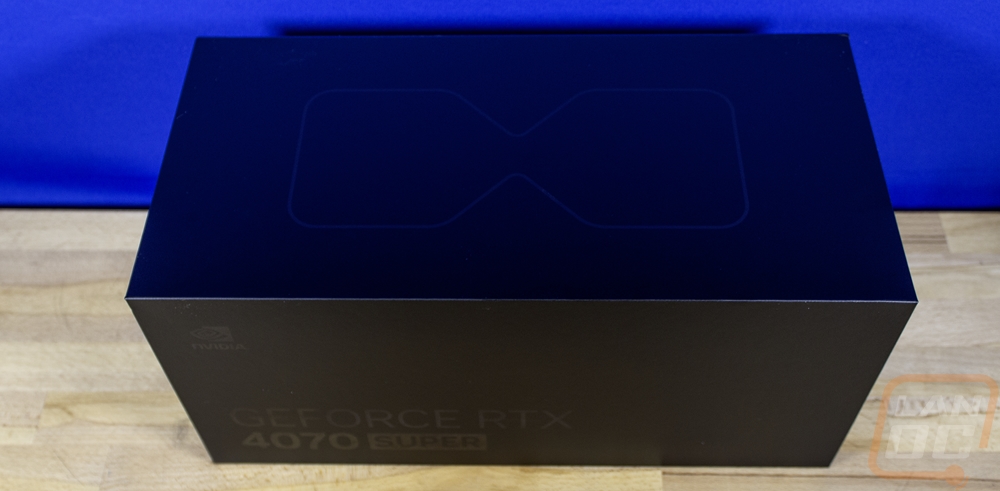
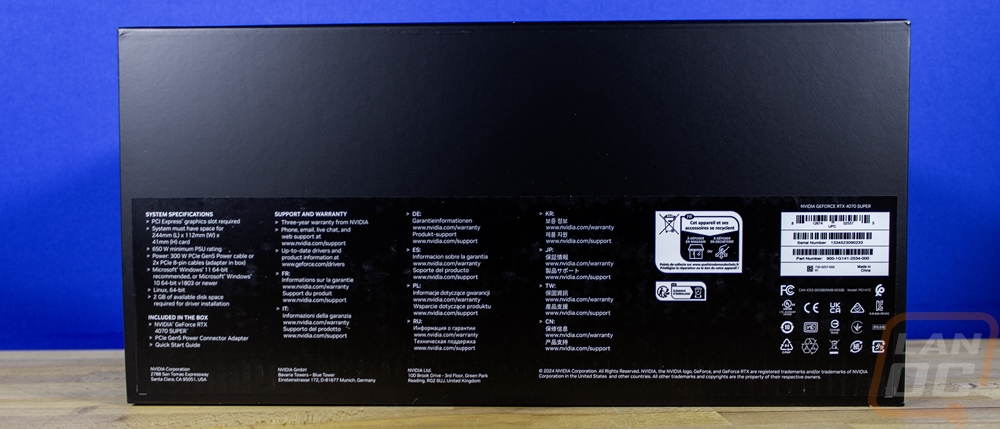
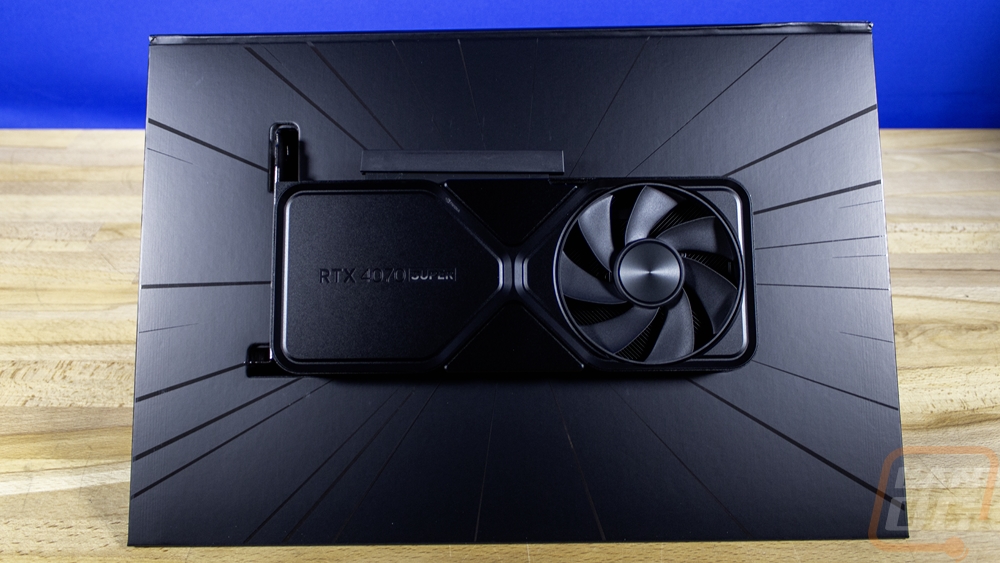
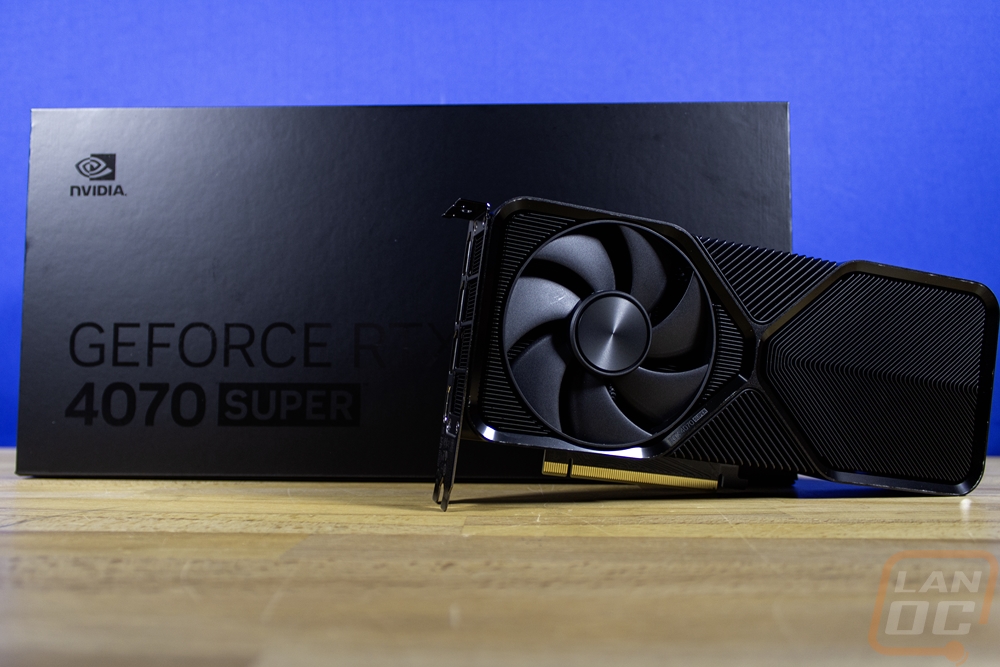
The packaging for any of the 4000 Series Founders Editon cards have had this completely unique packaging design and the RTX 4070 SUPER FE is no different. Because this card is from Nvidia they don’t have the normal bright green wrap-around or any of that and the box is all black. Even the print on the front which has the RTX 4070 SUPER FE model name is a gloss black as is the Nvidia logo in the top left corner, you can hardly see them unless the light hits it just right. Up on top the box has an hourglass-like shape on it, this is the design shape of their 4000 Series cards. Then on the back, they have one sticker that has the system specifications requirements, support and warranty information, and barcodes for the UPC and serial number are all hidden away here. What makes the box so unique though is its size and from the side video you can see a lot of the box is made from corrugated plastic and you can see all the way through to the other side in the large holes on the ends.
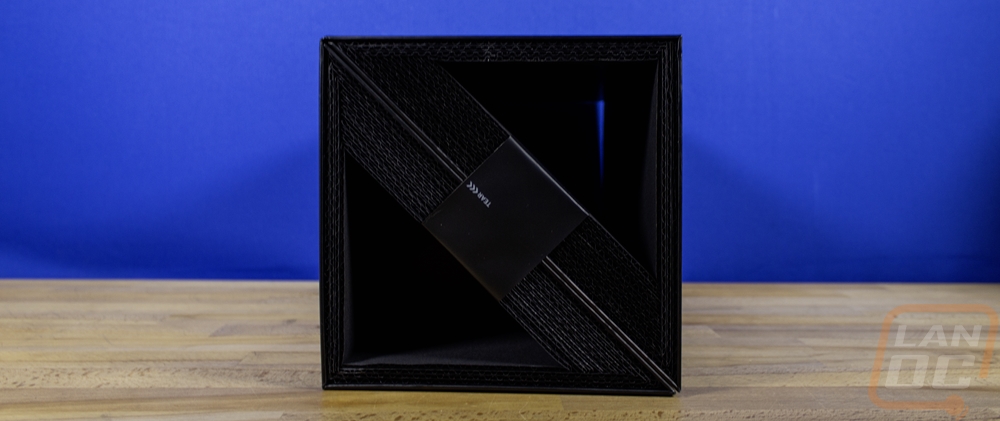
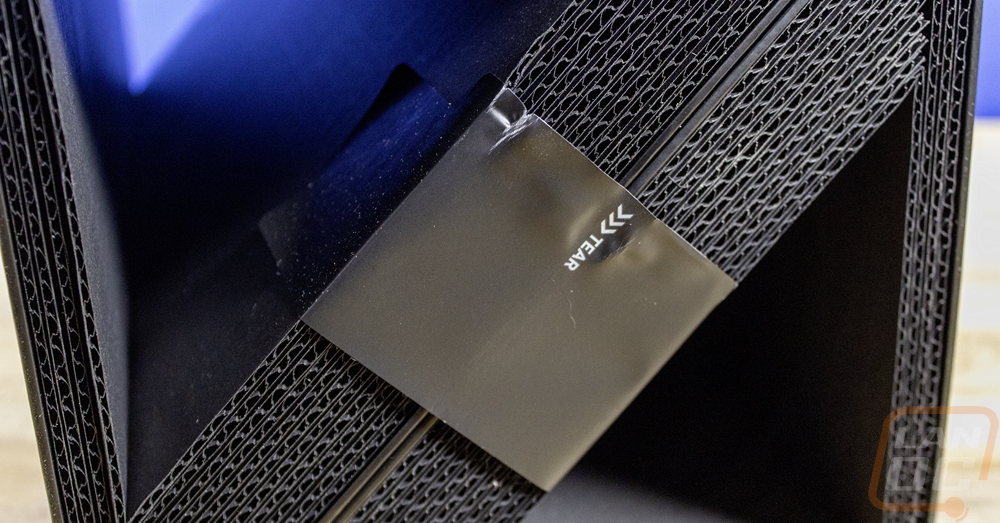
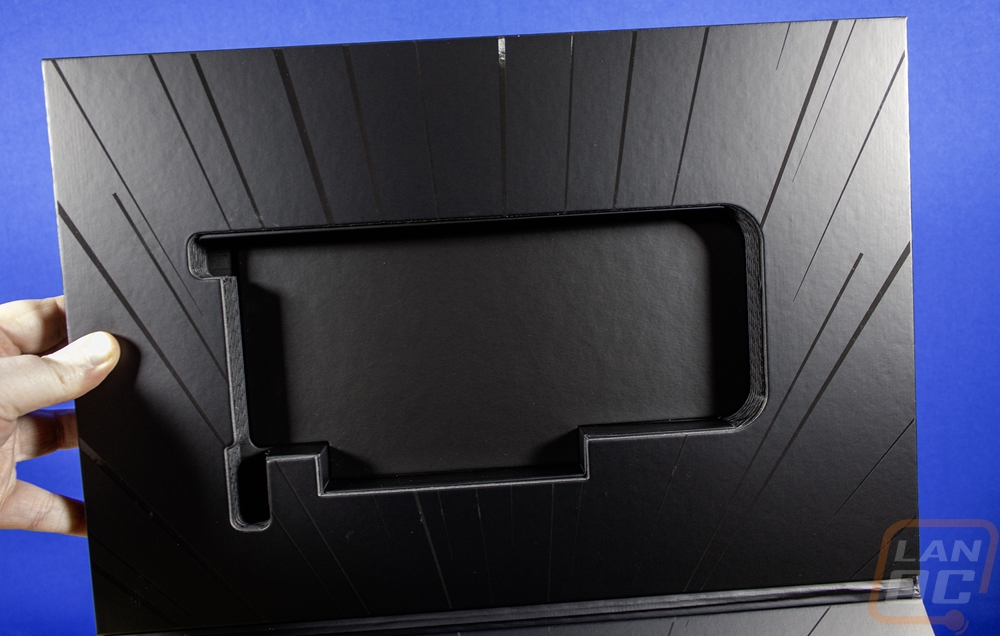
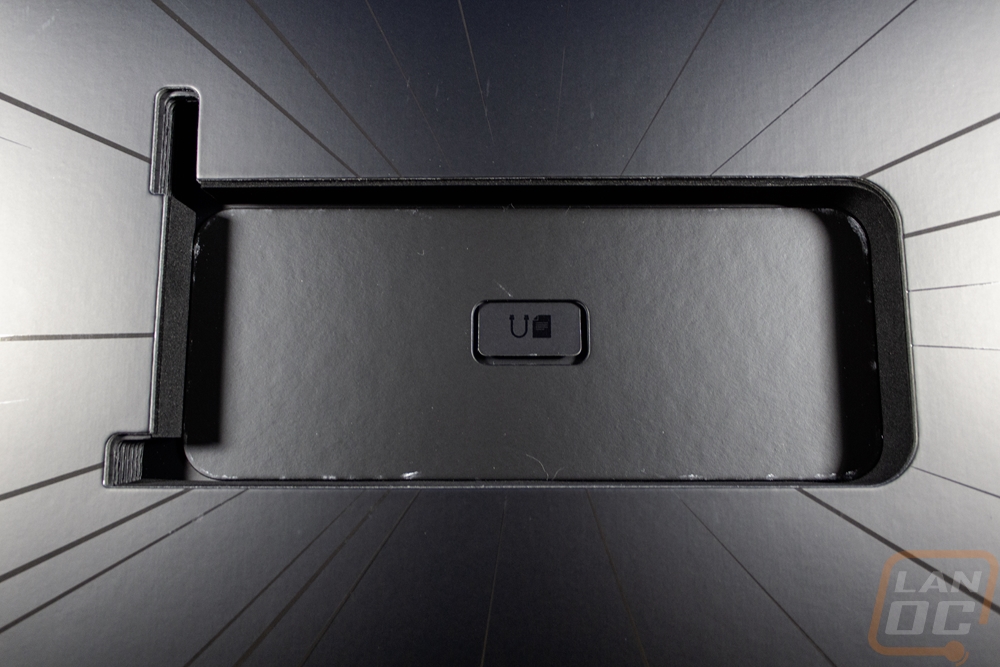
Getting in the box is normally really easy, the stickers on the sides pull off and the box just flips up but this time around the tear stickers didn’t want to tear. Once I handled that the inside is more black and has stripes of gloss black in the background. Then the corrugated plastic has a cutout on both halves in the shape of the card keeping it from moving around. The design showcases the card and you really get the unboxing experience with it not having any extra packaging that you have to remove, multiple boxes inside of boxes, or static protective bags like you see with more video cards. Under the card itself is a thick cardboard panel and a pull tab that will pull out the accessory box that is hidden in the middle under the card.
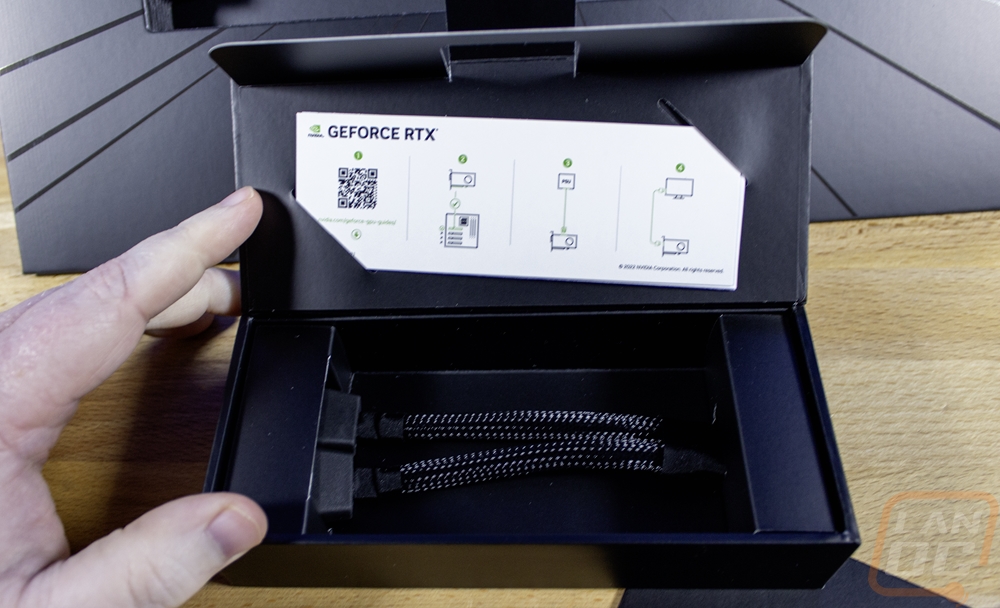
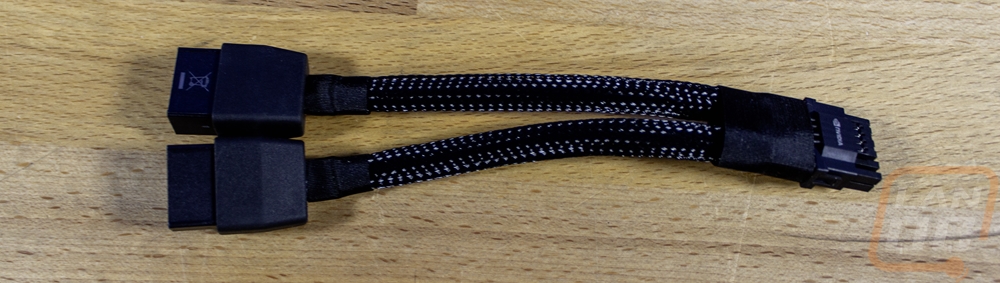
The box has a card in the top with a QR code linking you to the drivers and line drawings giving basic instructions on getting things hooked up. Then at the bottom, you get one accessory, a power adapter for the cards 12VHPWR connection for anyone who doesn’t have a new power supply with the new connection. For the RTX 4070 SUPER FE, this adapter has dual 8-pin PCIe plugs on the other end but the number of power connections on the adapter is different for other models so don’t try to use these on other cards. The 12VHPWR connection is significantly smaller and can handle more power than the older PCIe plugs but they have had issues with adapters and cards with connections that weren’t all the way seated getting hot and melting so be very careful to get things installed fully.
Card Layout and Photos
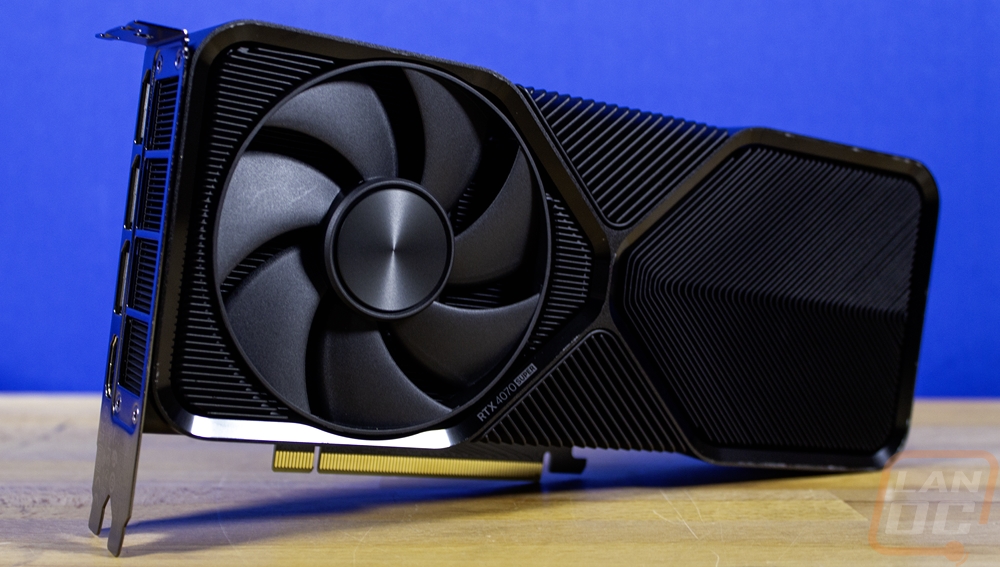
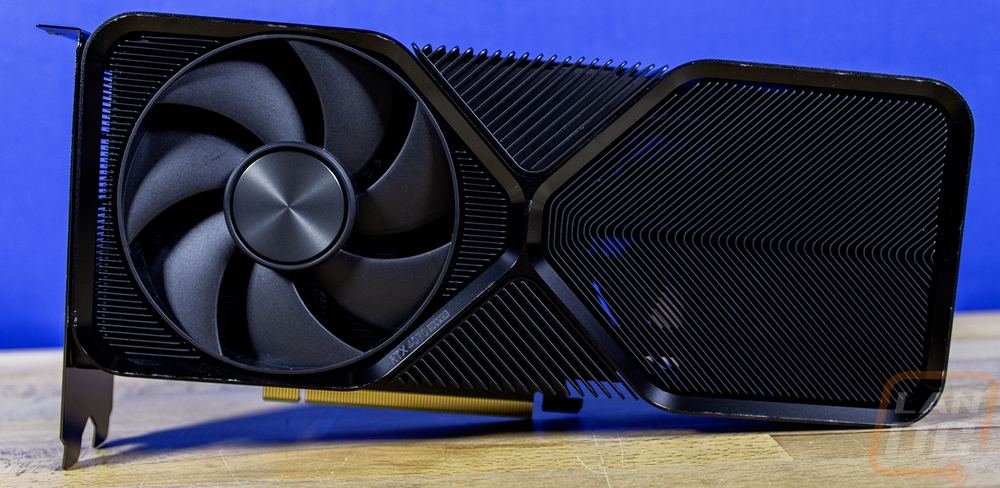
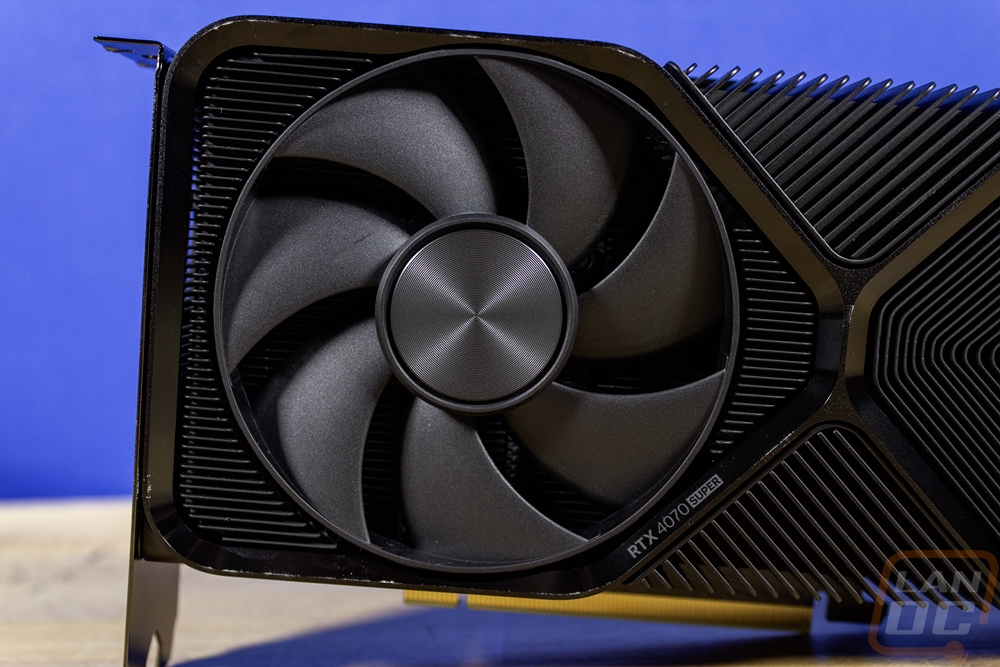
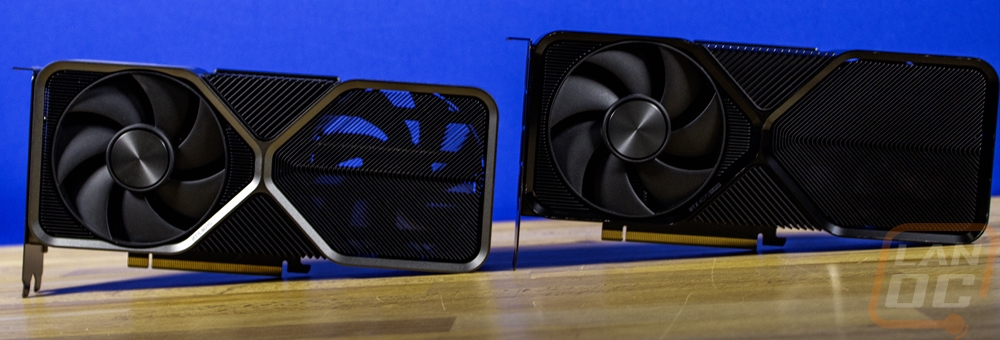
Like with the packaging, Nvidia’s Founders Edition design is like nothing else on the market. All of the aftermarket cards go with plastic fan shrouds and two or three fans on the one side of the card. The Founders Editon design is a lot more stout with an all-metal design that includes exposed heatsinks and an infinity-like shape that divides the heatsinks up. The 4070 SUPER hasn’t changed anything for styling from the original RTX 4070 other than the card now has a blacked-out finish that looks really good.
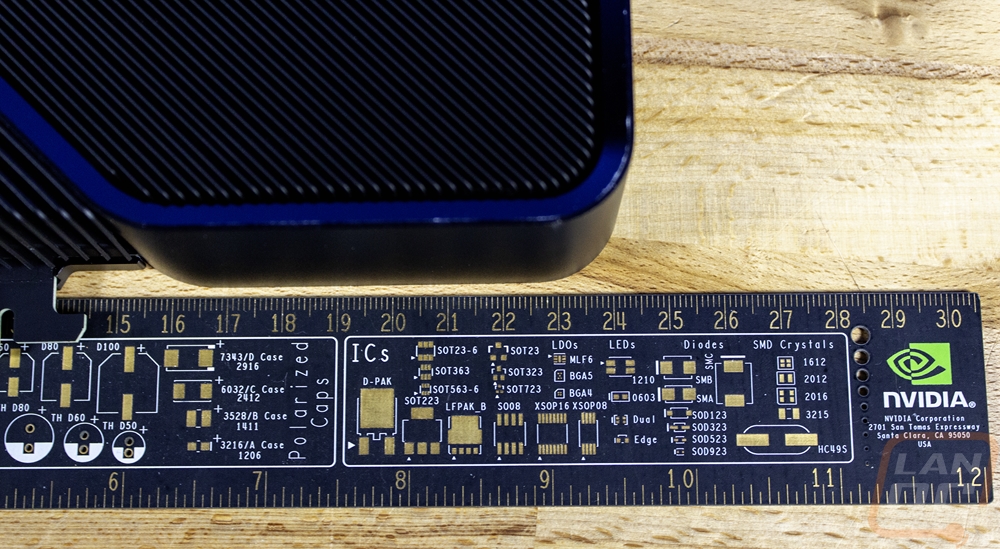
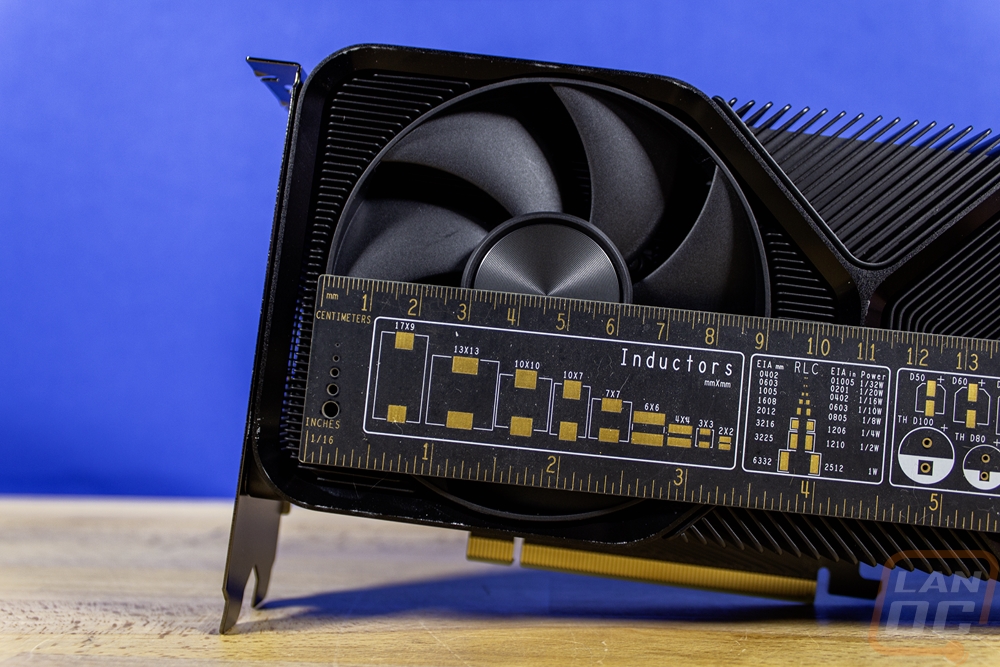
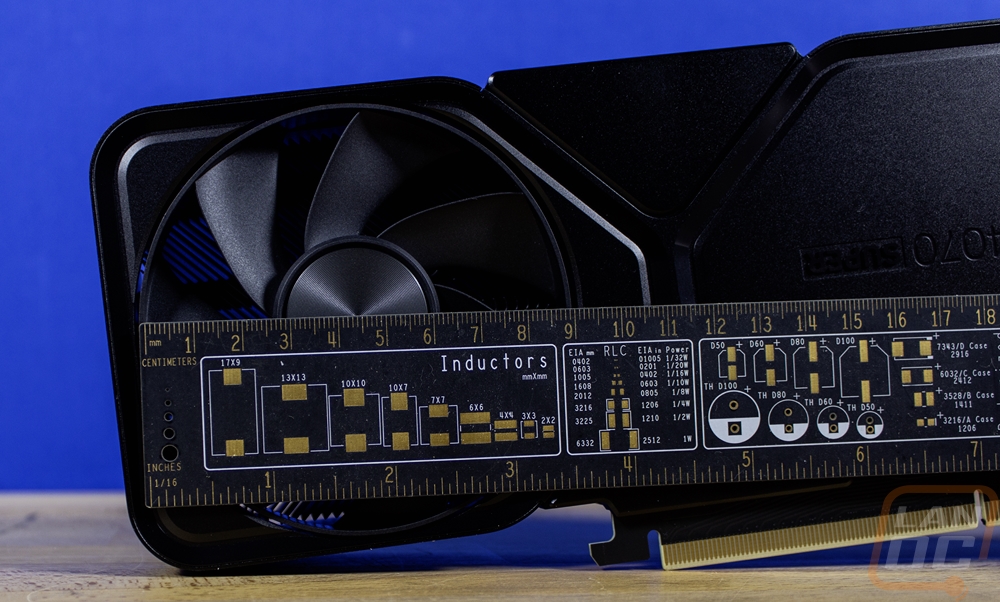
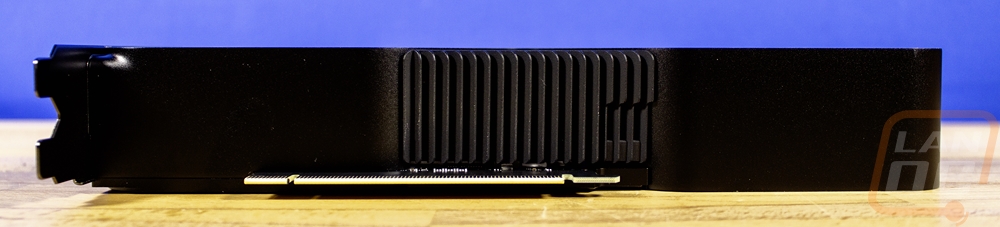
The RTX 4070 SUPER Founders Edition comes in at 240 mm long, 110 mm tall, and 40 mm thick. This is the same size as the original RTX 4070 Founders Edition. The 40 mm thickness means that it is a true 2-slot card that doesn’t hang over the third slot at all and its height means that you don’t have to worry much about the card fitting in cases, where most aftermarket cards are significantly longer and taller. The power connection is on top though so you will need to factor that in as well.
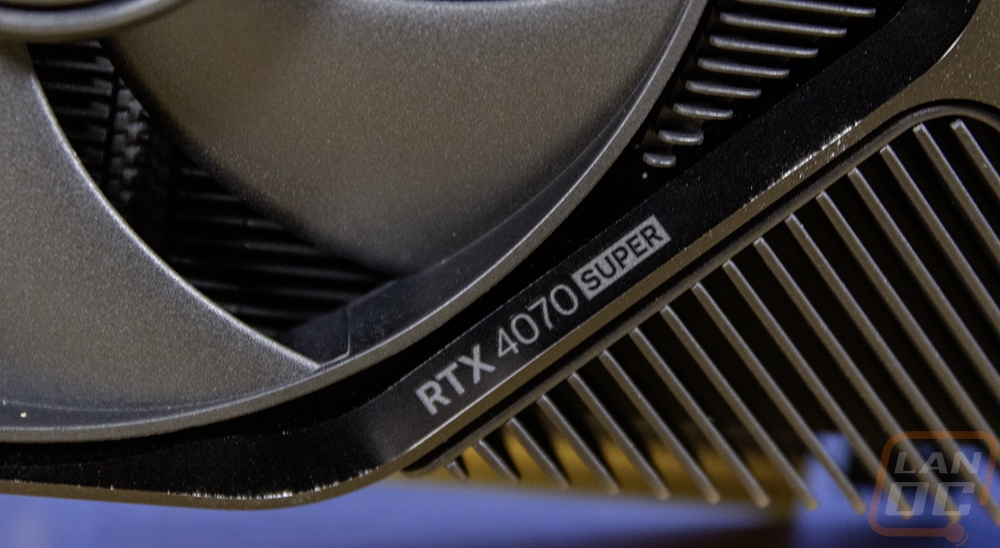
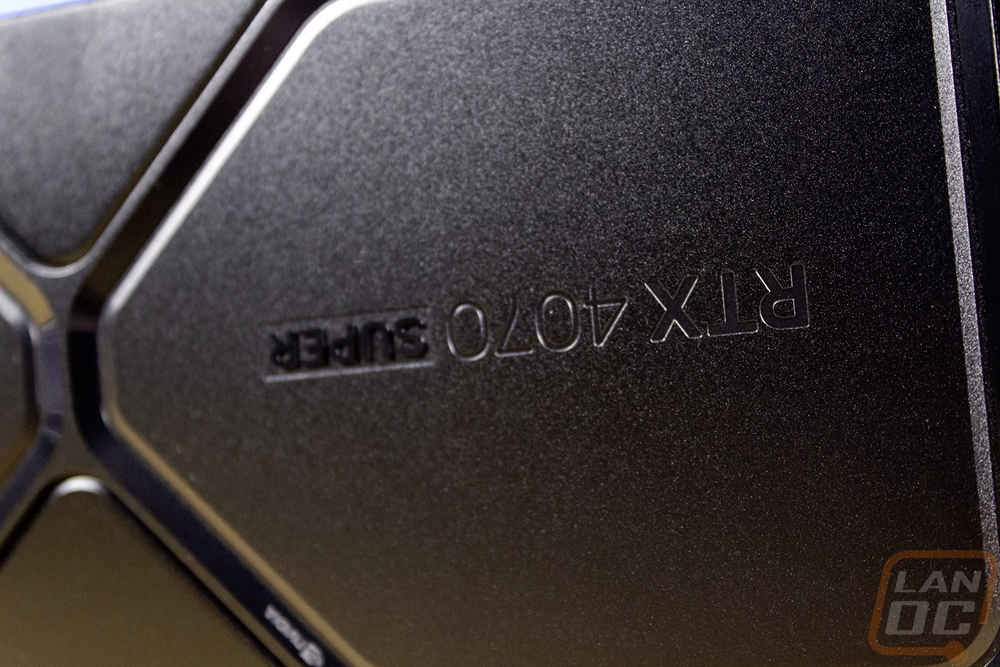
The traditional “fan-side” of the card has one fan on the left side of the card with small heatsinks fitting in the gaps around it then the X-shapped middle of the infinity shape is in the middle splitting up three more exposed heatsinks with the middle top and middle bottom heatsinks having a bigger gap between fins where the left and right heatsinks are more like a thinner sheet metal laid out in a V shape. The fan on the left is 92 mm wide. It has 7 blades and an outer ring that gives it more strength and helps focus the air to blow straight down into the heatsink below and over the PCB below as well. The fan has a machined aluminum center cap which is finished darker to match the fan. Just below the fan on the edge, they have also laser etched the RTX 4070 SUPER logo which is subtle but the only visible print on this side of the card.
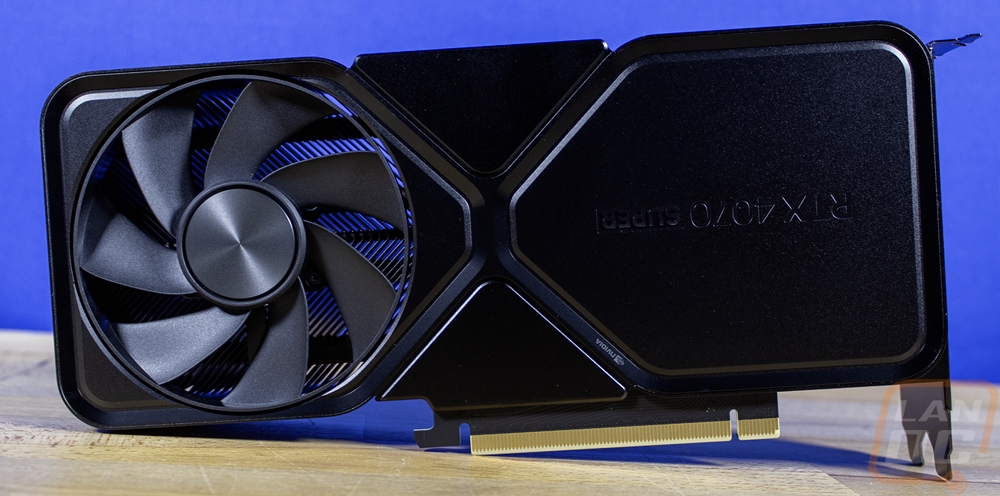
Another area the Founders Edition design is different is the second fan in this design is on the back side of the card. There have been a few aftermarket cards that have implemented this but for the most part, a blow-through design with both fans on the one side is the most common. This fan has the same 7-blade 92 mm design but the blades are flipped around to pull air through the heatsink and out this direction where on the other side the fan is pushing the air. It has the same aluminum center cap with a dark finish. The rest of the back of the RTX 4070 SUPER Founders Edition has the same X shape in the center that completes the infinity loop design but the back doesn’t have any exposed heatsinks. This side is protecting the back of the PCB and giving the card more strength. They have the Nvidia logo etched on the X trim and then the RX 4070 SUPER logo is on the main backplate with both upside down so they will be visible when the card is installed in a normal PC case configuration.
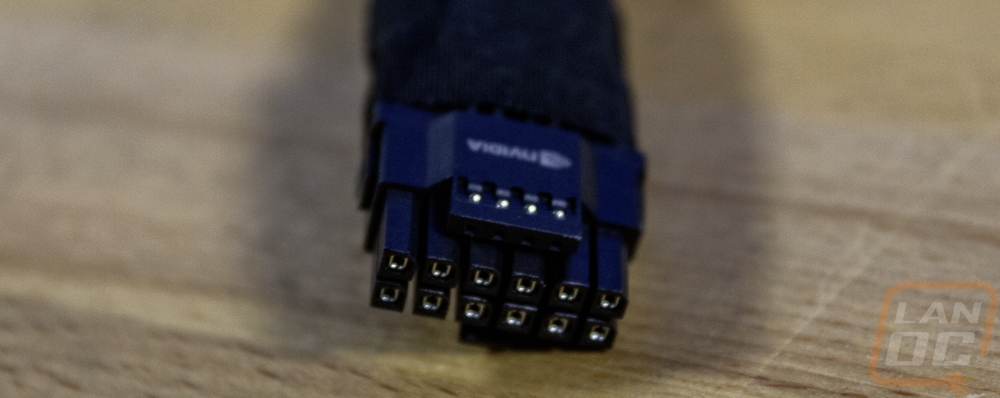
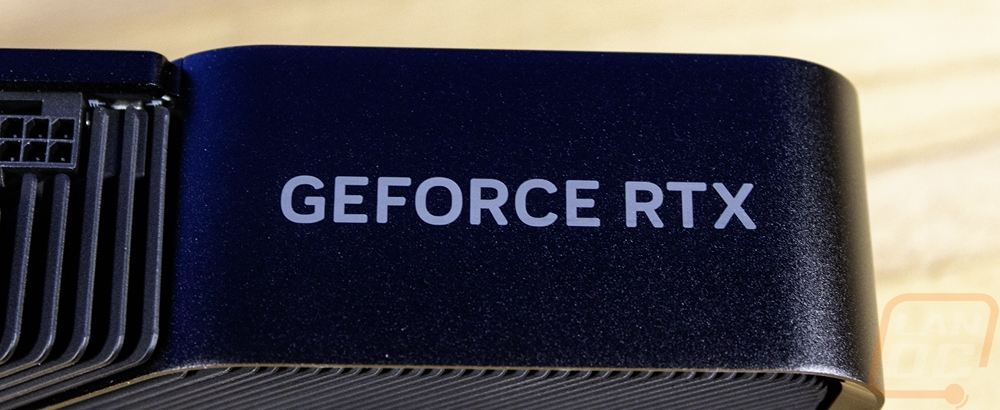
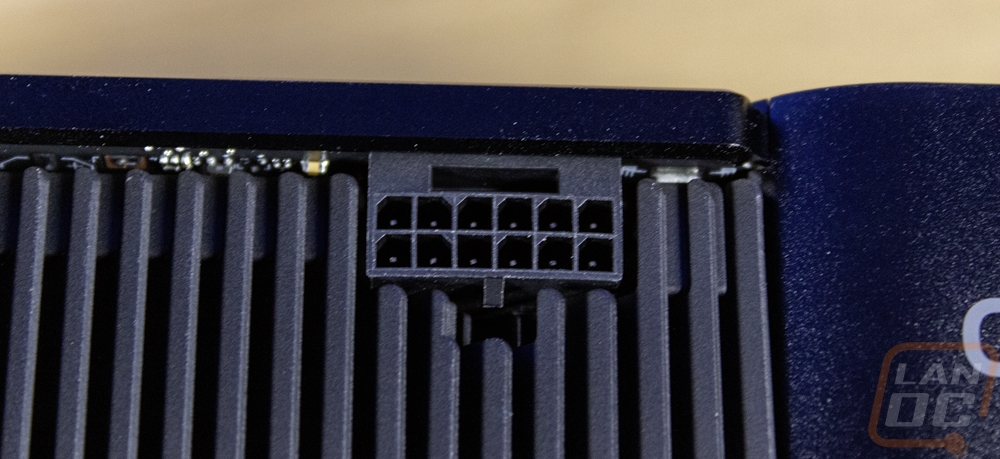
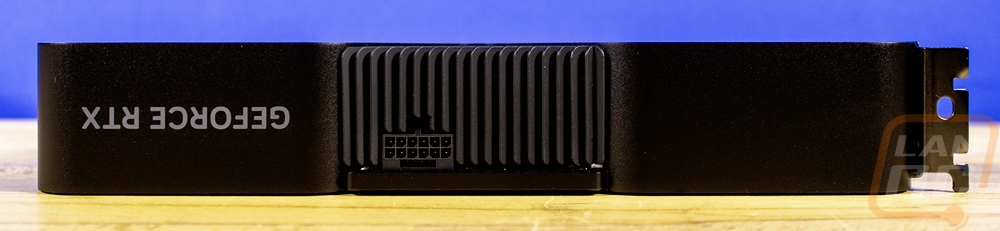
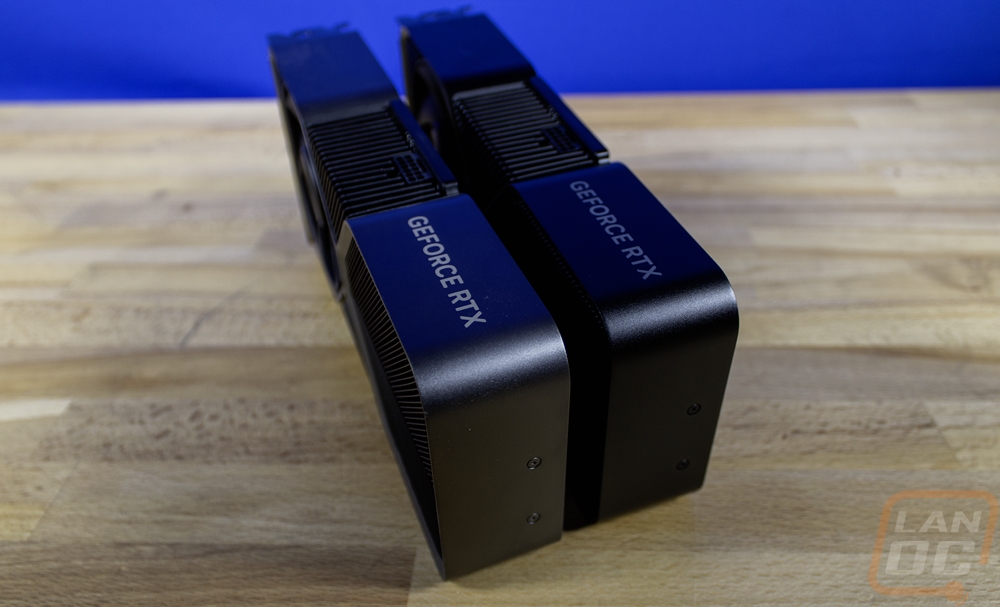
The Founders Edition design doesn’t have a standard shroud at all but the hourglass shape that wraps around the heatsink does have two sections up on top of the card. The GeForce RTX branding is printed here just like with the original RTX 4070 Founders Edition. The top of the card has the angled heatsinks exposed as well and in the middle of those they have slipped in the 12VHPWR power connection. I mentioned this with all of the 4000 Series cards but I do wish that this was angled like Nvidia did on some of the 3000 Series cards to put less strain on the connection when plugged in and to make it easier to hit the wiring which is complicated because the power connection isn’t at the end of the card but just past the middle which is where the PCB ends.
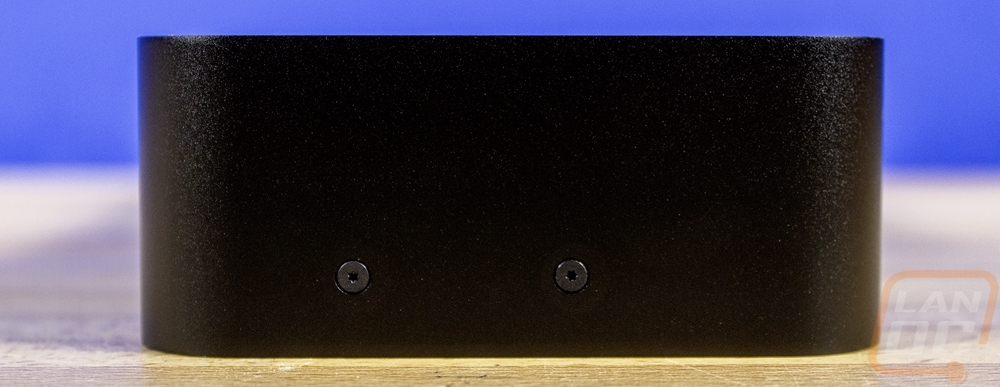
Working around the top, bottom, and end of the RTX 4070 SUPER Founders Edition the metal housing on the top that I already touched on is the same on the bottom of the card with only the PCIe slot being visible from the PCB. The metal continues around on to the end of the card where there are two removable screws. These are for cases that have built-in support to prevent sag and keep cards from moving around or putting strain on the PCIe slot.
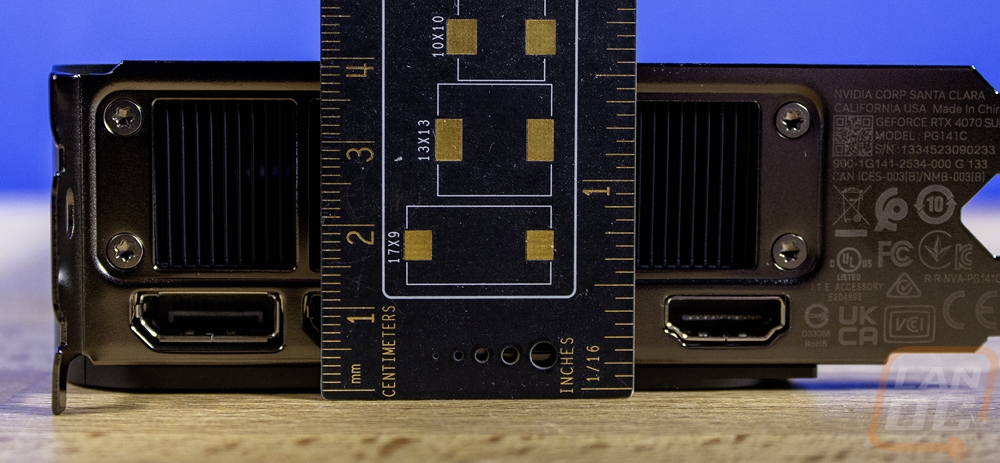
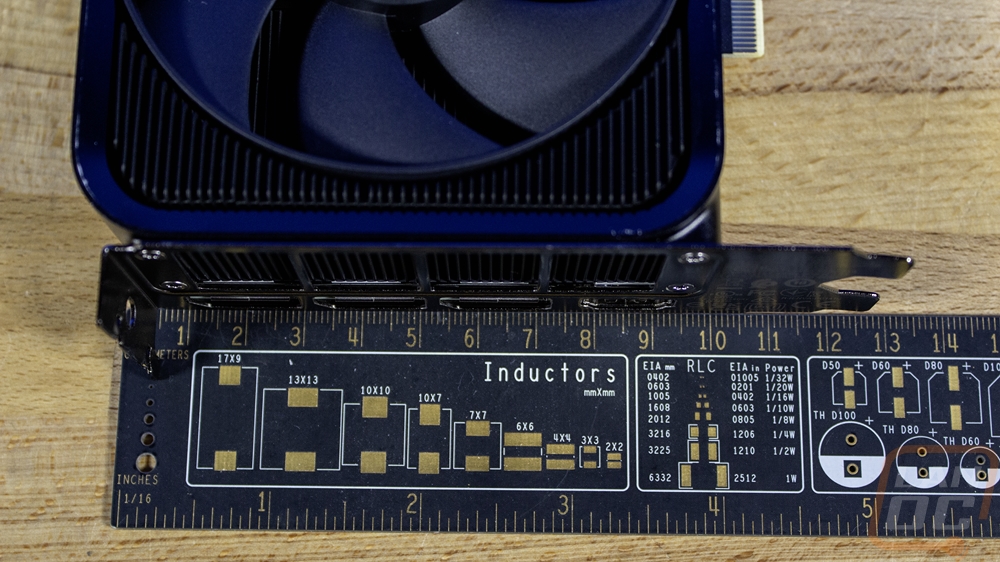
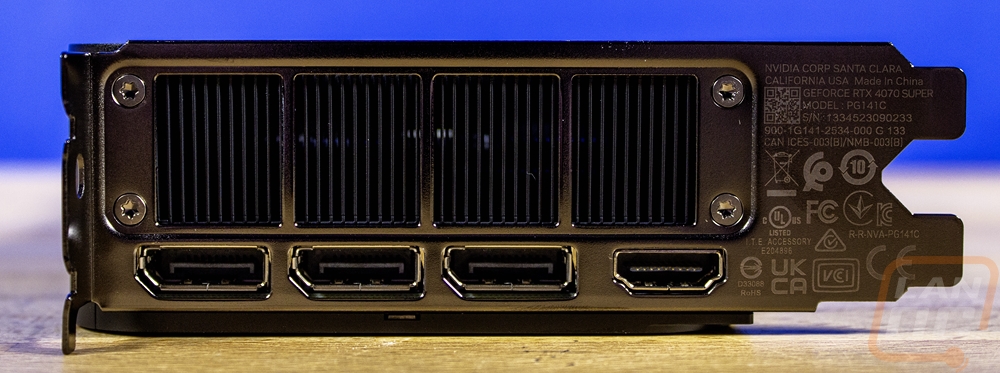
The PCI bracket end of the 4070 SUPER Founders Edition has four large openings for the card to push air out of your case even though this isn’t a blower-style card like the Founders Edition cards from years ago. The bracket itself has a tinted finish over it then down at the bottom edge Nvidia has packed all of the certification logos and required information as well as the card's serial number which is all laser etched on. For display connections, it has the “standard” layout that a majority of cards have had for a while now which is three DisplayPort connections and one HDMI. They do have the HDMI down at the bottom, not in the middle which makes it easier to find when plugging things in blindly.
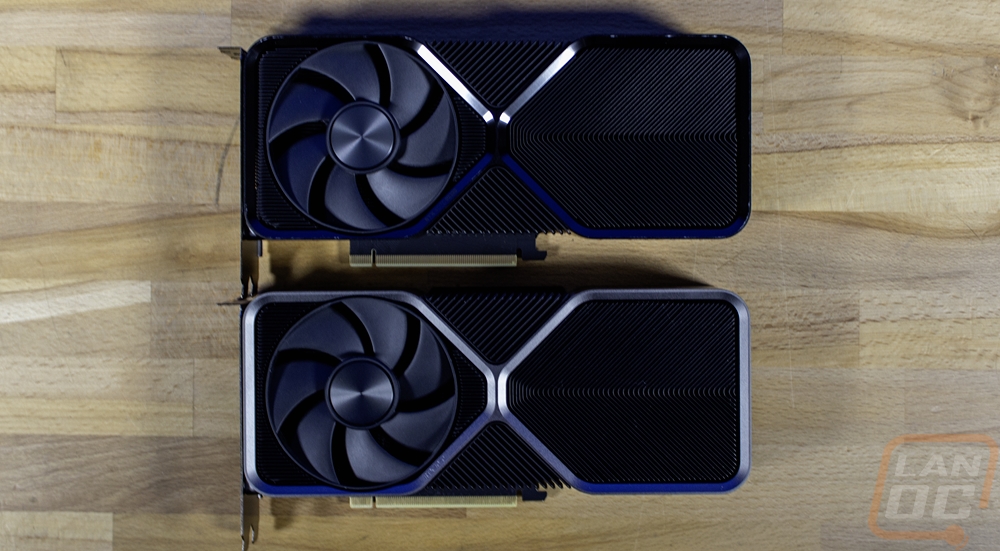
I of course have a few shots of the RTX 4070 SUPER Founders Edition and the original RTX 4070 together to get a better comparison between the two. Both cards have the same cooler size and design. It’s just the finish on the non-heatsink components being blacked out that is different. This is noticeable on the top edge but the difference is even more drastic on the trim on the sides.
Test Rig and Procedures
CPU: Intel Core-i9 13900K – Live Pricing
PL1=PL2: 253, τ: 56 / 307A
Motherboard: Asus Z790 Extreme – Live Pricing
Cooling: Corsair H100i Elite LCD Display - Live Pricing
Noctua NT-H1 Thermal Paste - Live Pricing
Memory: Crucial 32GB Kit (2 x 16GB) DDR5-5600 UDIMM– Live Pricing
Storage: Sabrent Rocket Q4 2TB – Live Pricing
Power Supply: be quiet! Dark Power Pro 13 1600W- Live Pricing
Case: Primochill Wetbench - Live Pricing
OS: Windows 11 Pro 64-bit - Live Pricing
|
Our Testing Procedures |
|
|
3DMark |
All 3DMark-based tests are done using the most recent version. We test using all three versions of Fire Strike, Both Time Spy and Time Spy Extreme, and Speed Way. Tests to look at ray tracing performance are done with Port Royal when supported and for Nvidia cards that support DLSS, the DLSS subtest is also done at 1440p with the performance setting and DLSS 2.0 as well as a look at DLSS 1, 2, and 3 at 4K. |
|
Unigine Superposition |
1080p Extreme and 4k Optimized benchmarks along with the VR Future test are done. The VR test is done at the Oculus resolution |
|
VRMark |
Only the Blue room test is run |
|
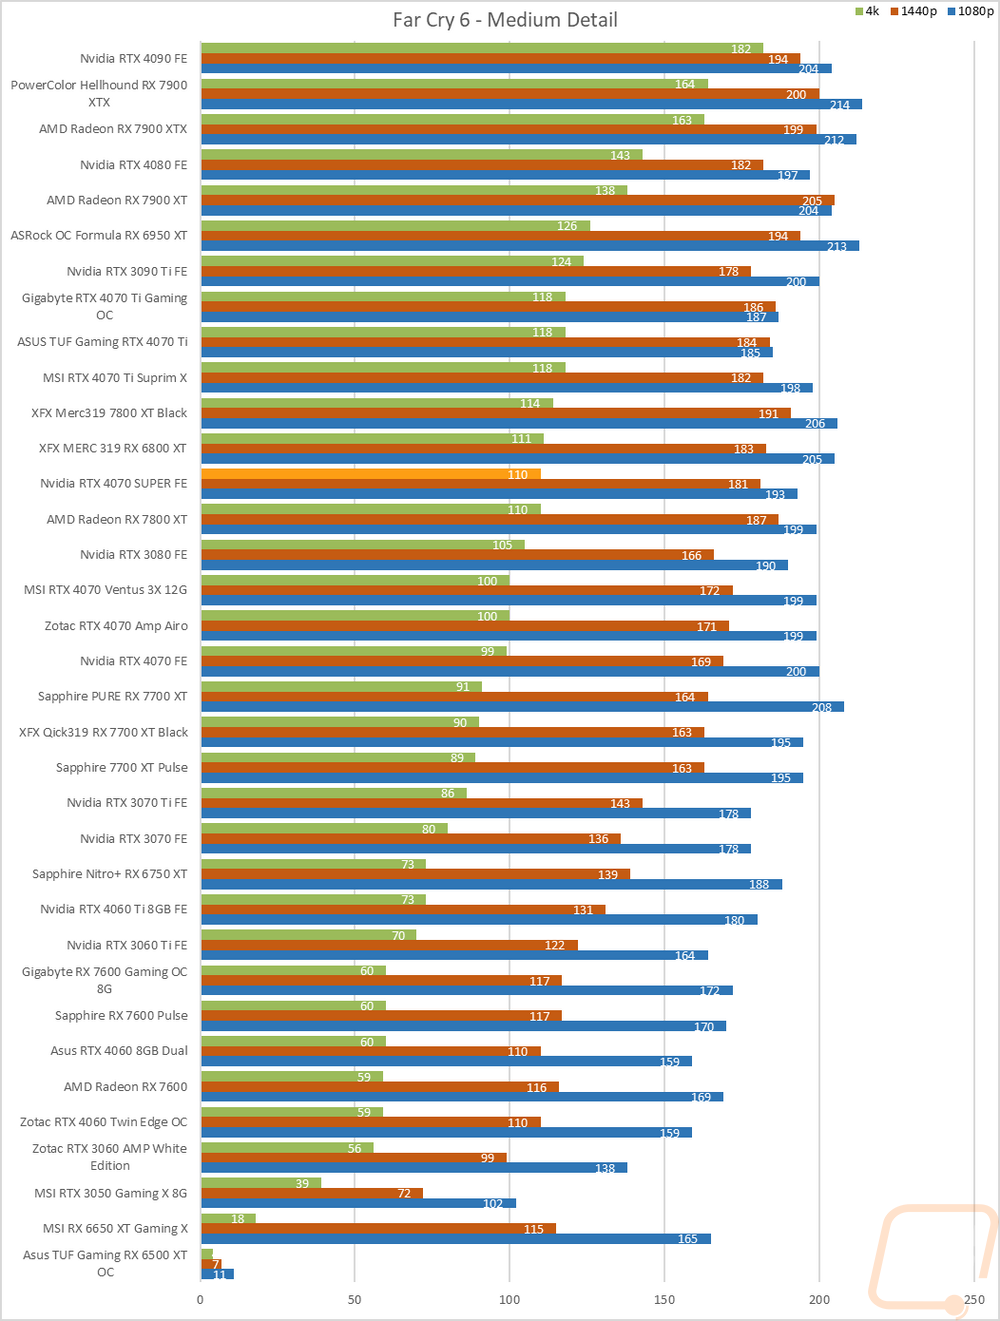
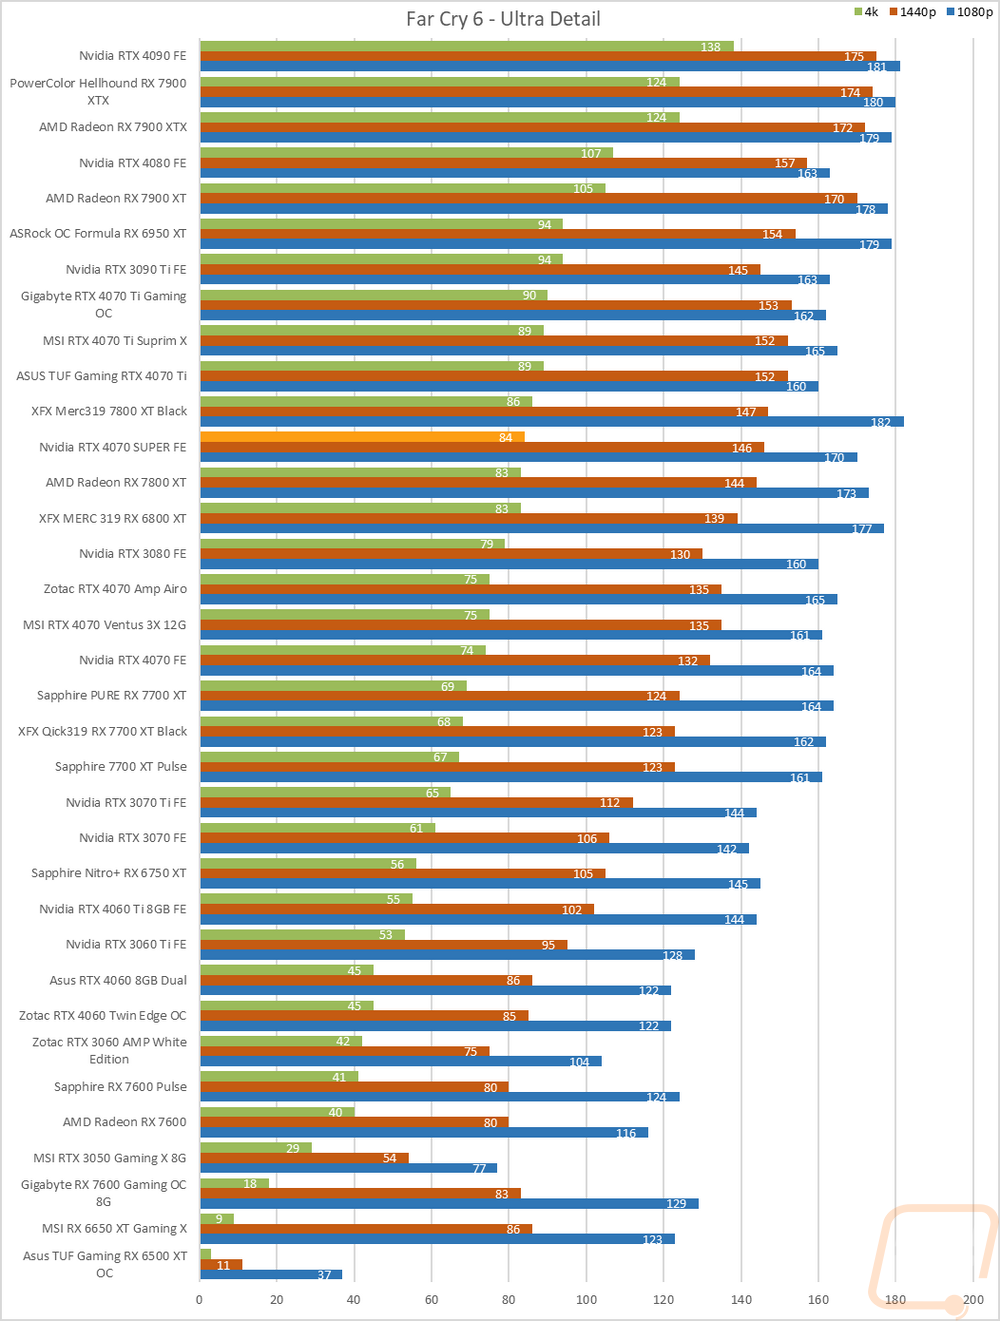
Far Cry 6 |
Built-in benchmark tested at 1080p, 1440p, and 4k with the Ultra and Medium detail settings |
|
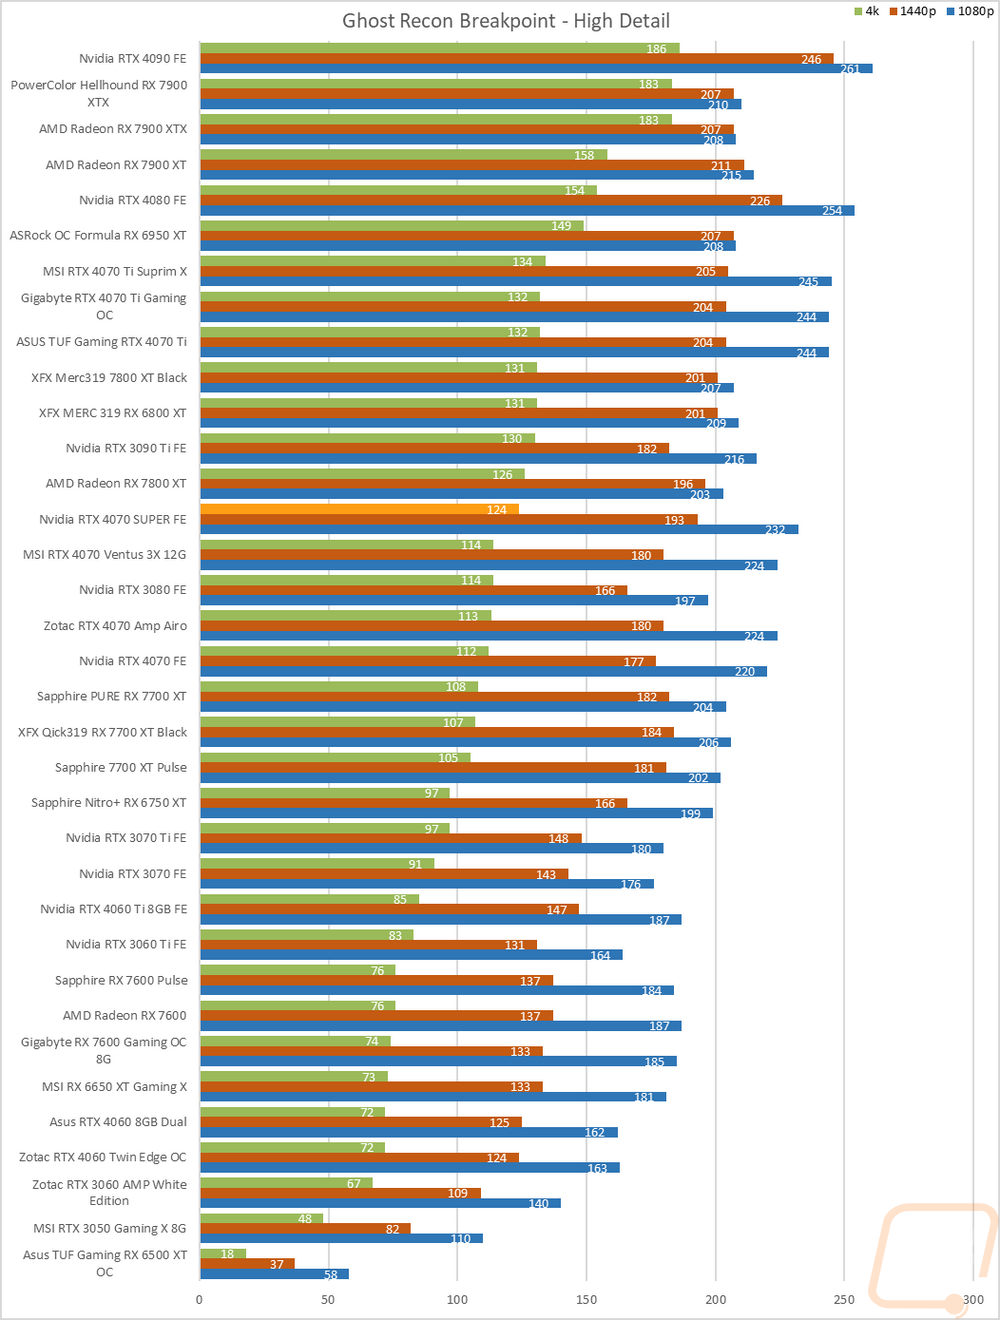
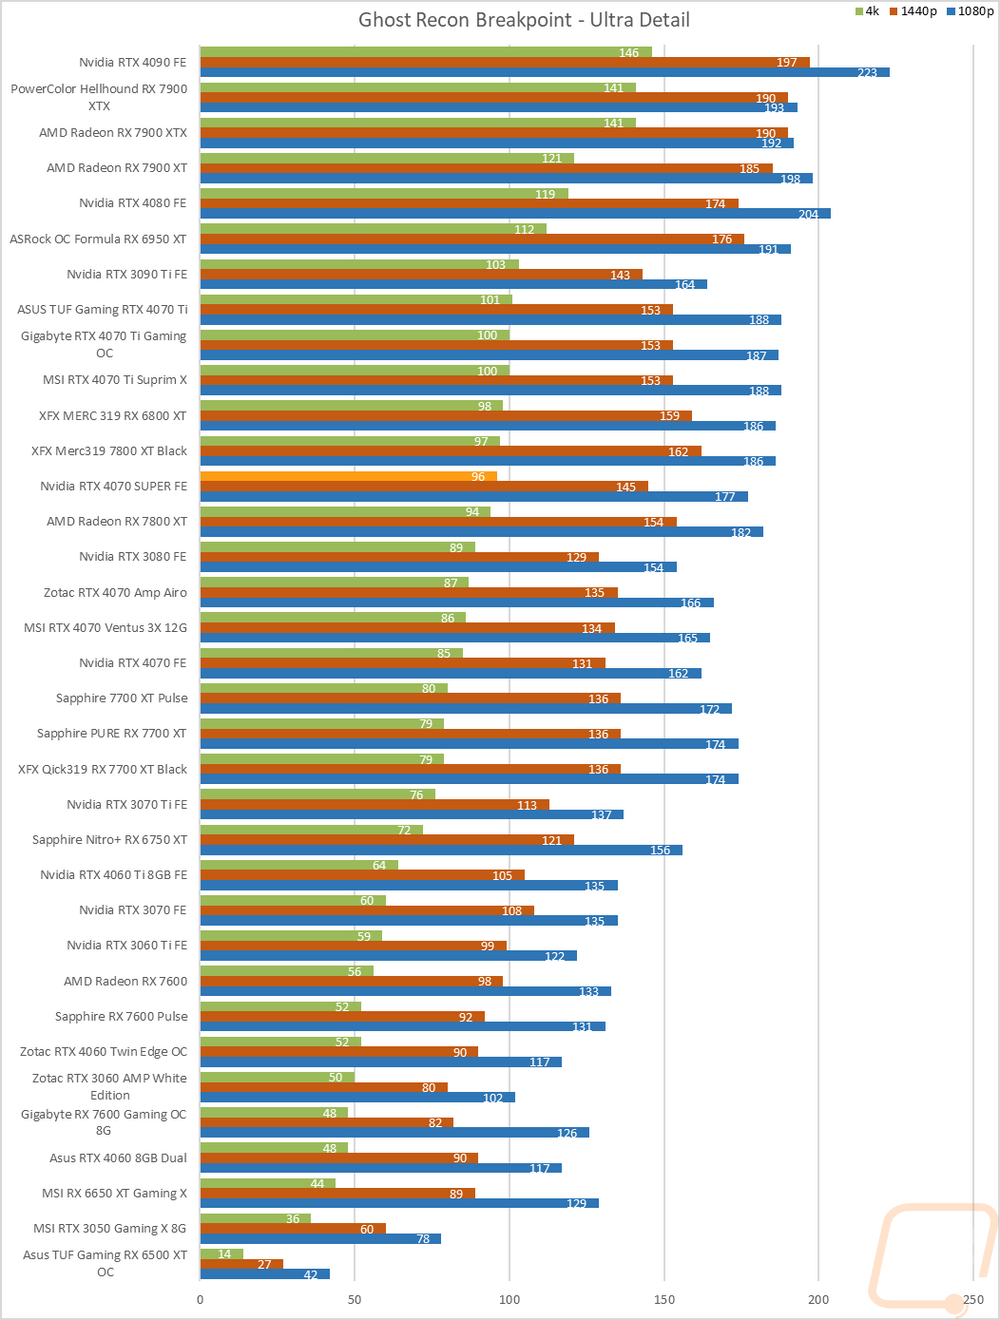
Ghost Recon Breakpoint |
Built-in benchmark tested at 1080p, 1440p, and 4k with the Ultra and Medium detail settings. Texture quality always set to high |
|
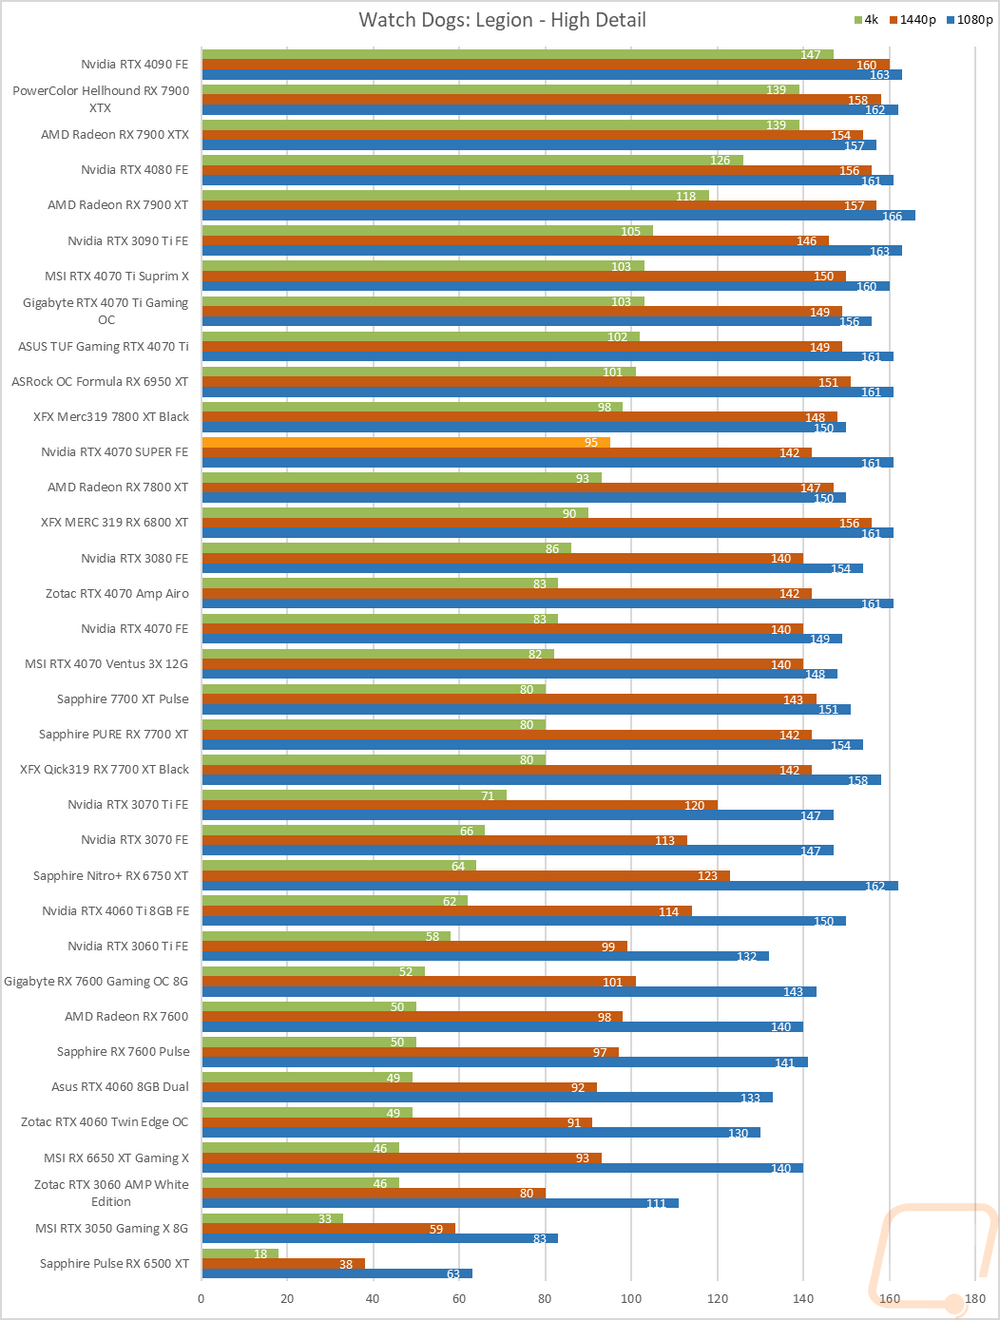
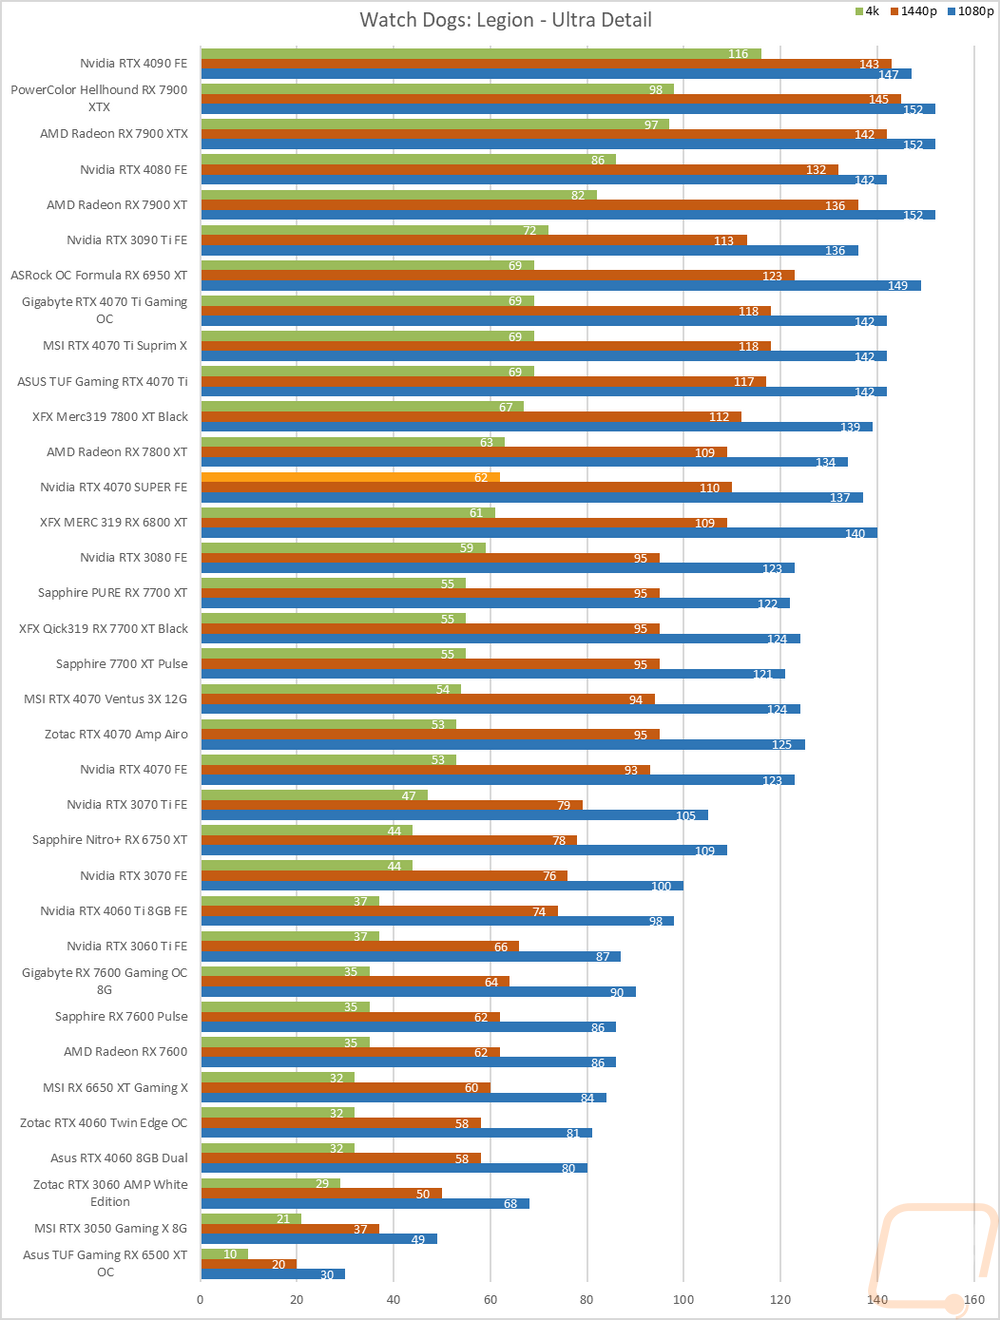
Watch Dogs: Legion |
Built-in benchmark testing at ultra and high details. Tested at 1080p, 1440p, and 4k. I also do RTX and DLSS testing on Nvidia cards at 4K using the Ultra detail settings as a base as well. |
|
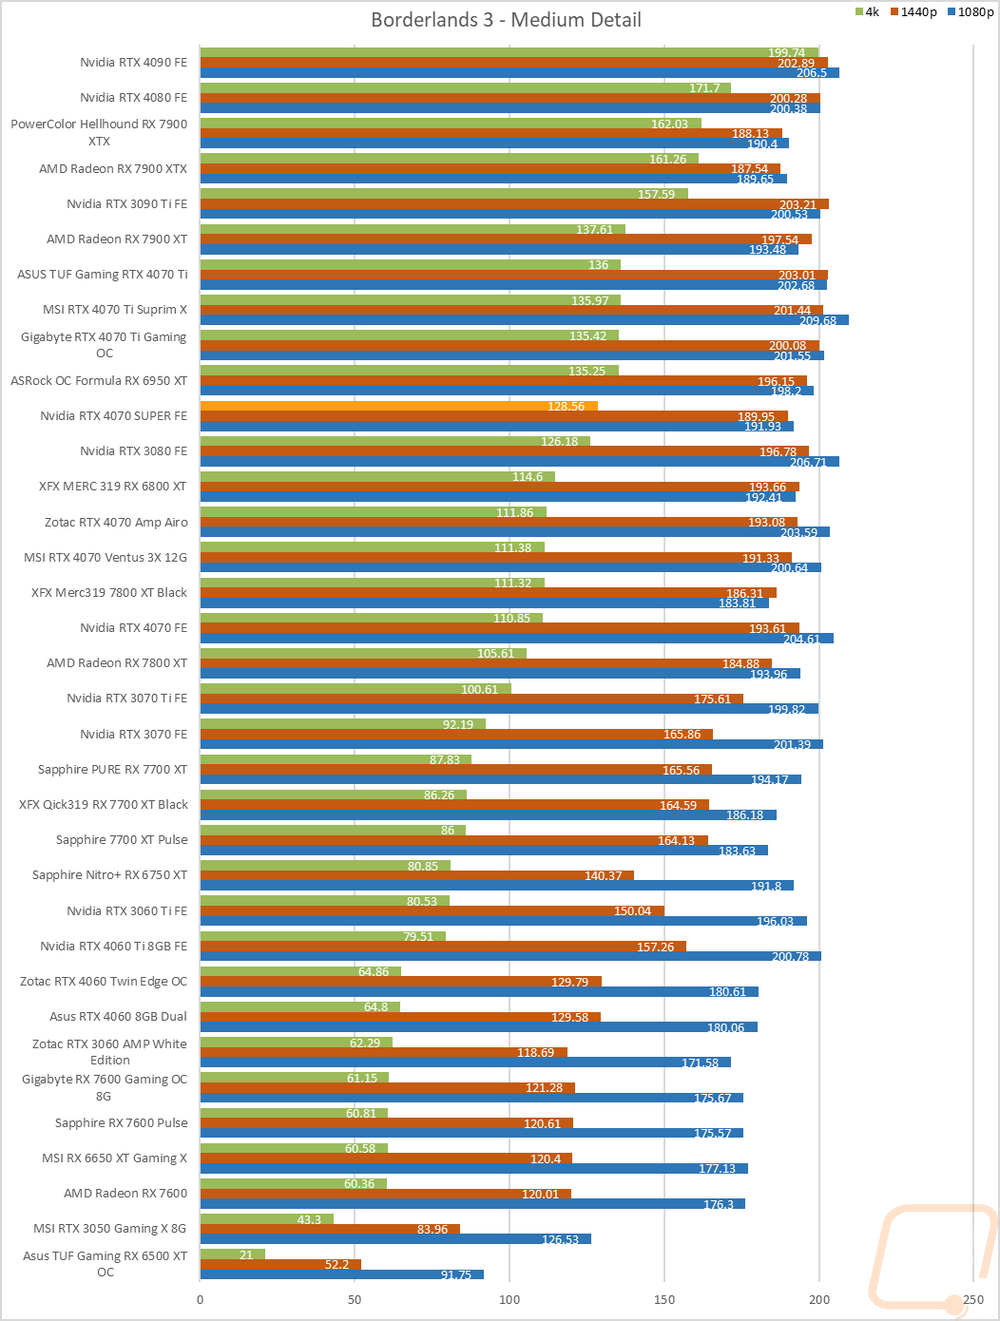
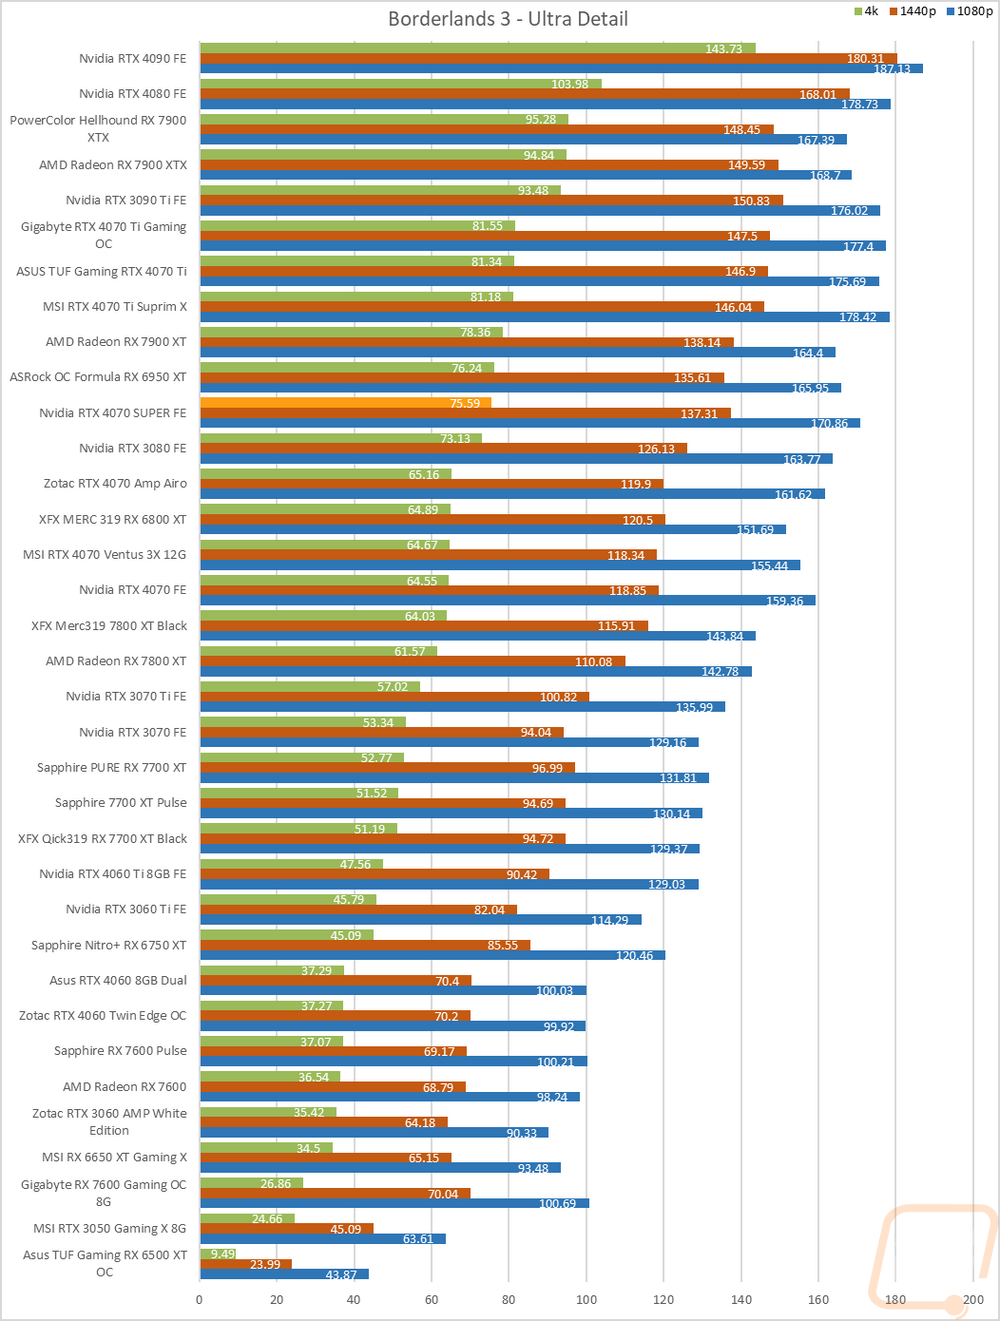
Borderlands 3 |
Built-in benchmark testing with the ultra detail setting and medium detail setting, done at full screen with default settings at 1080p, 1440p, and 4k on DX11 |
|
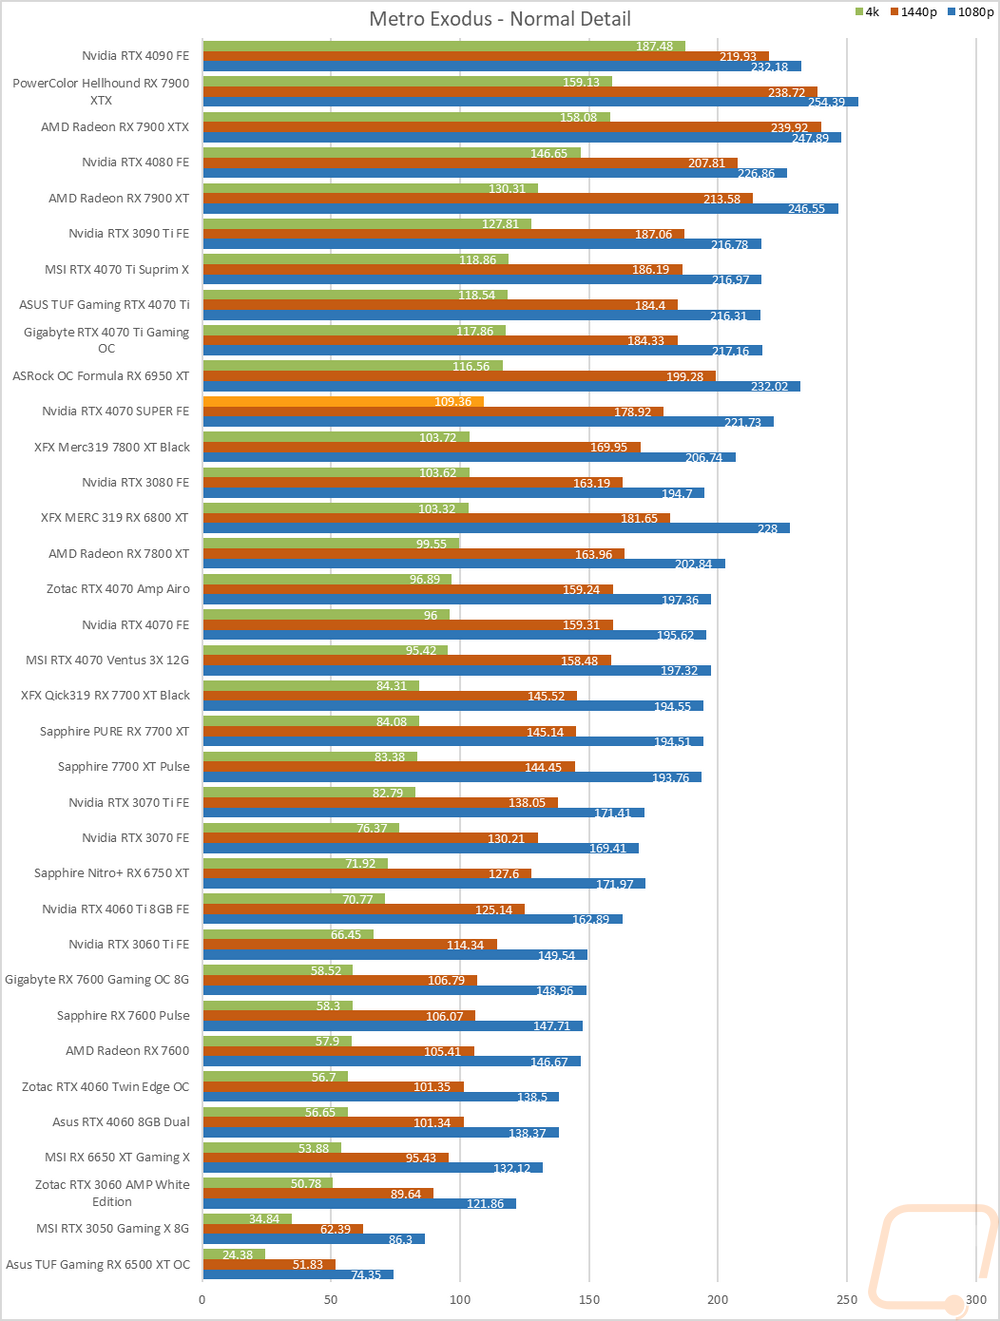
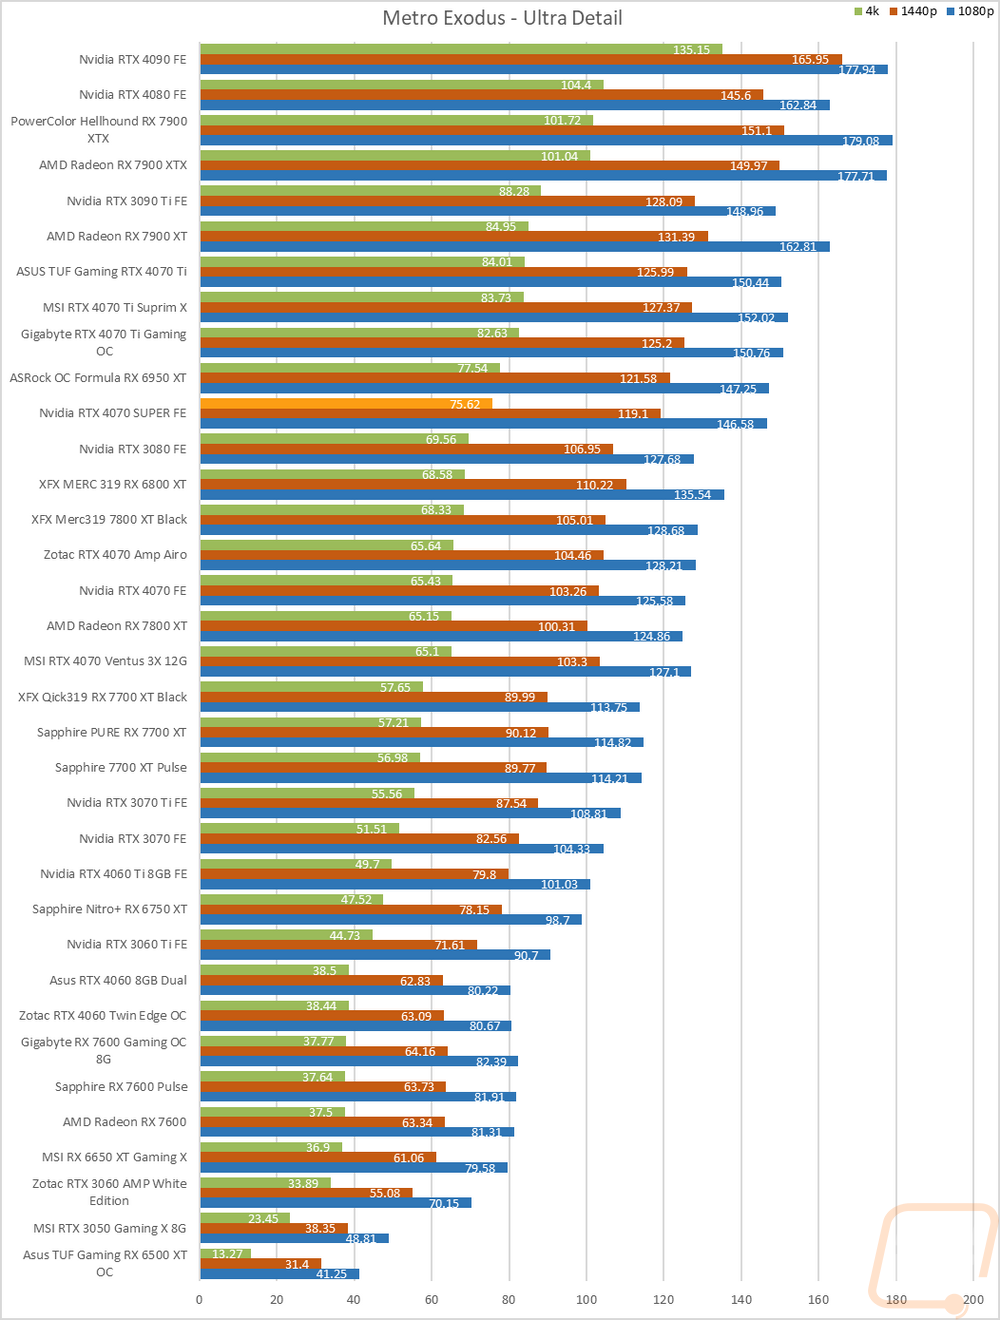
Metro Exodus |
Using built-in benchmark, testing at ultra and normal details at 1080p, 1440p, and 4k. I also do RTX and DLSS testing at 4K with the ultra-detail base settings for Nvidia cards as well. |
|
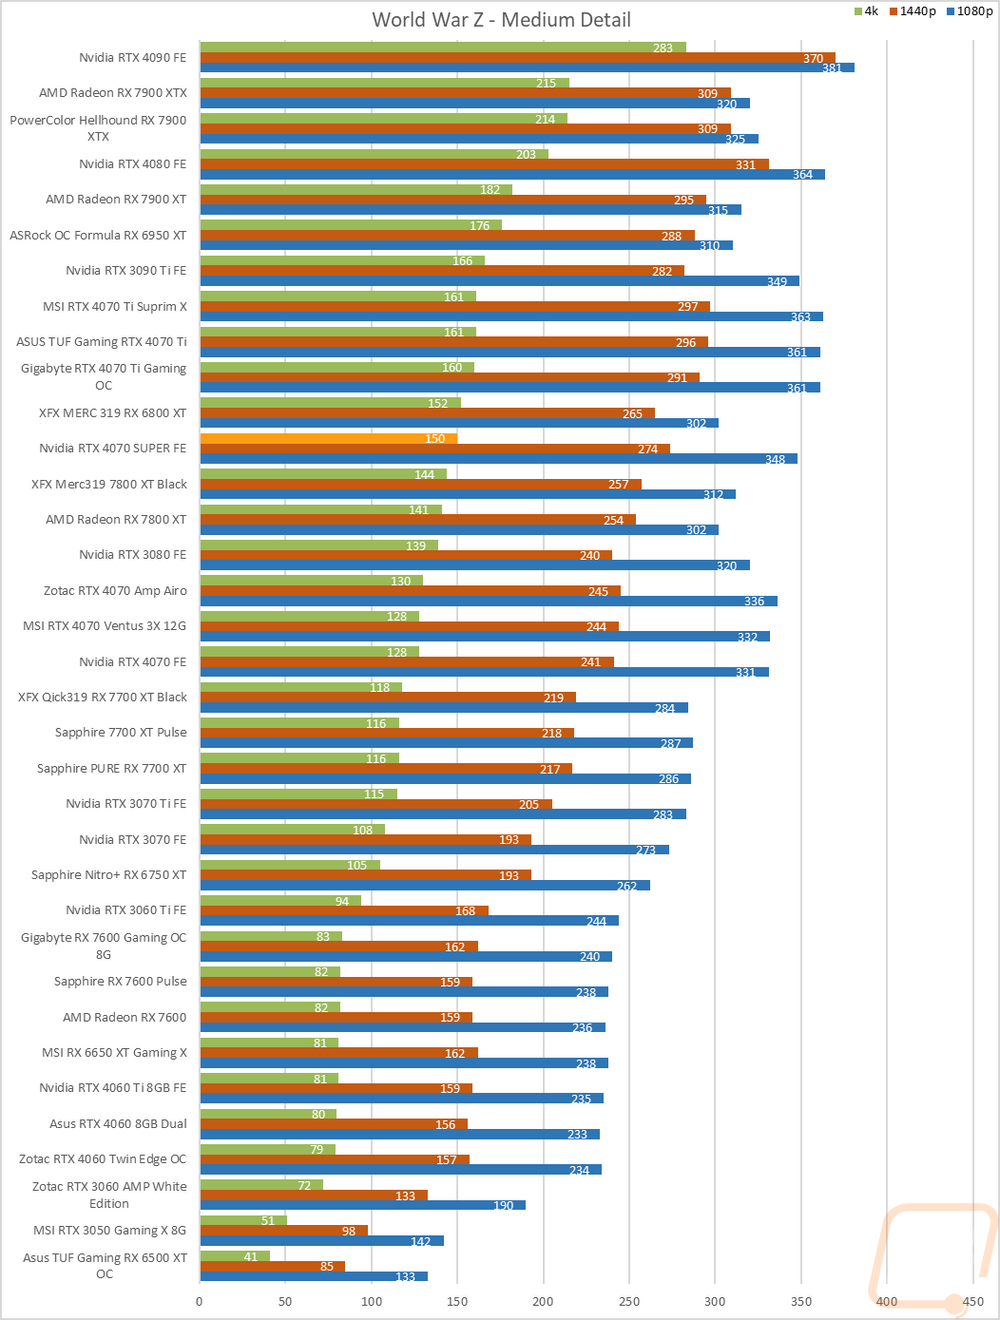
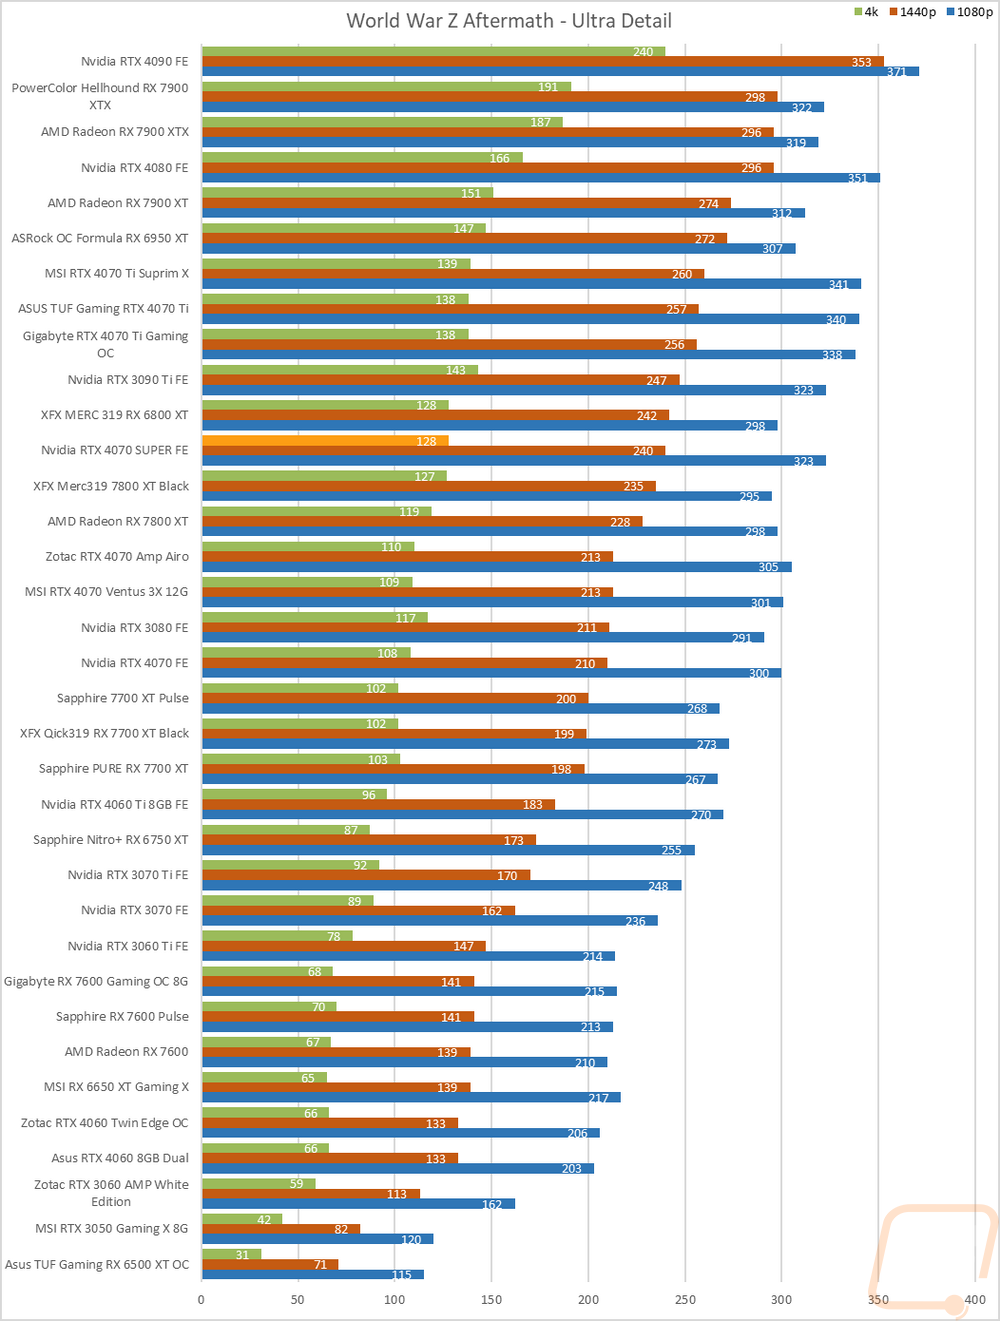
World War Z Aftermath |
Built-in benchmark in DX11 testing both the Ultra detail and Medium detail levels at 1080p, 1440p, and 4K resolutions |
|
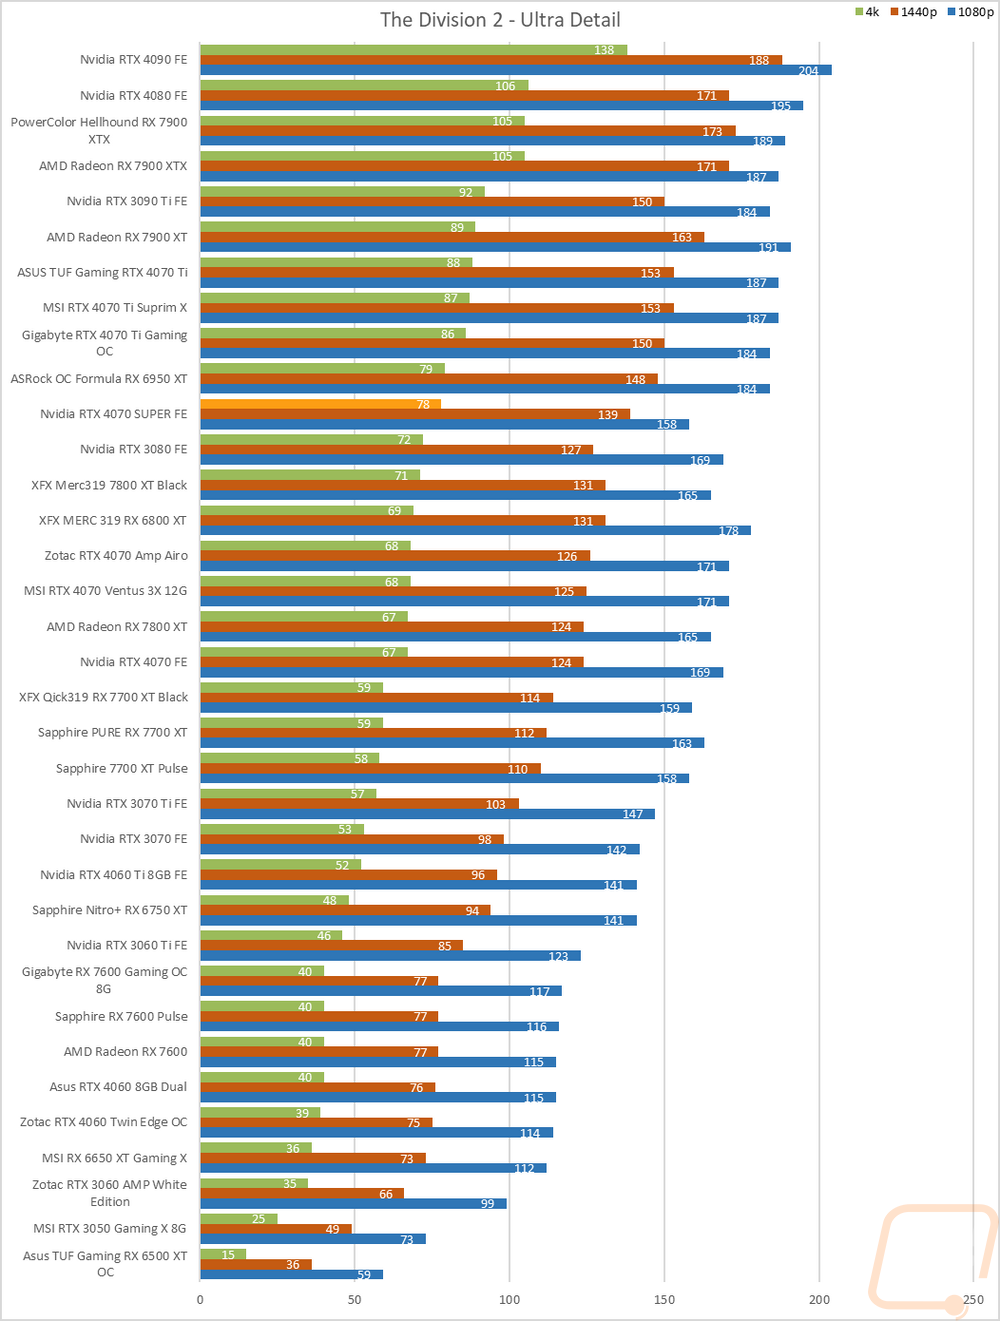
The Division 2 |
Built-in benchmark at Ultra detail with V-Sync turned off at 1080p, 1440p, and 4k resolutions. |
|
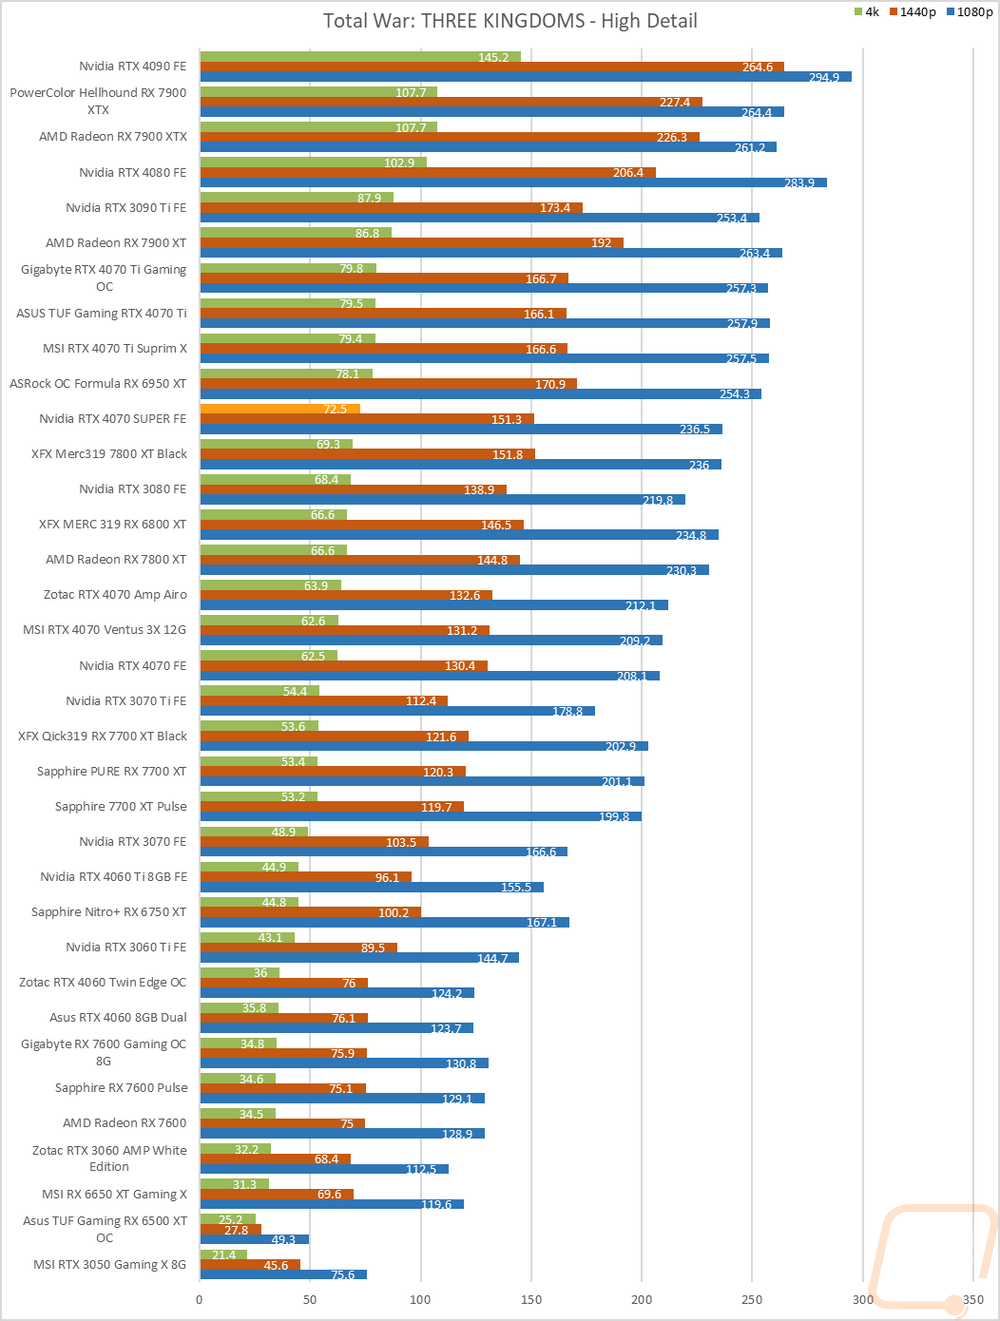
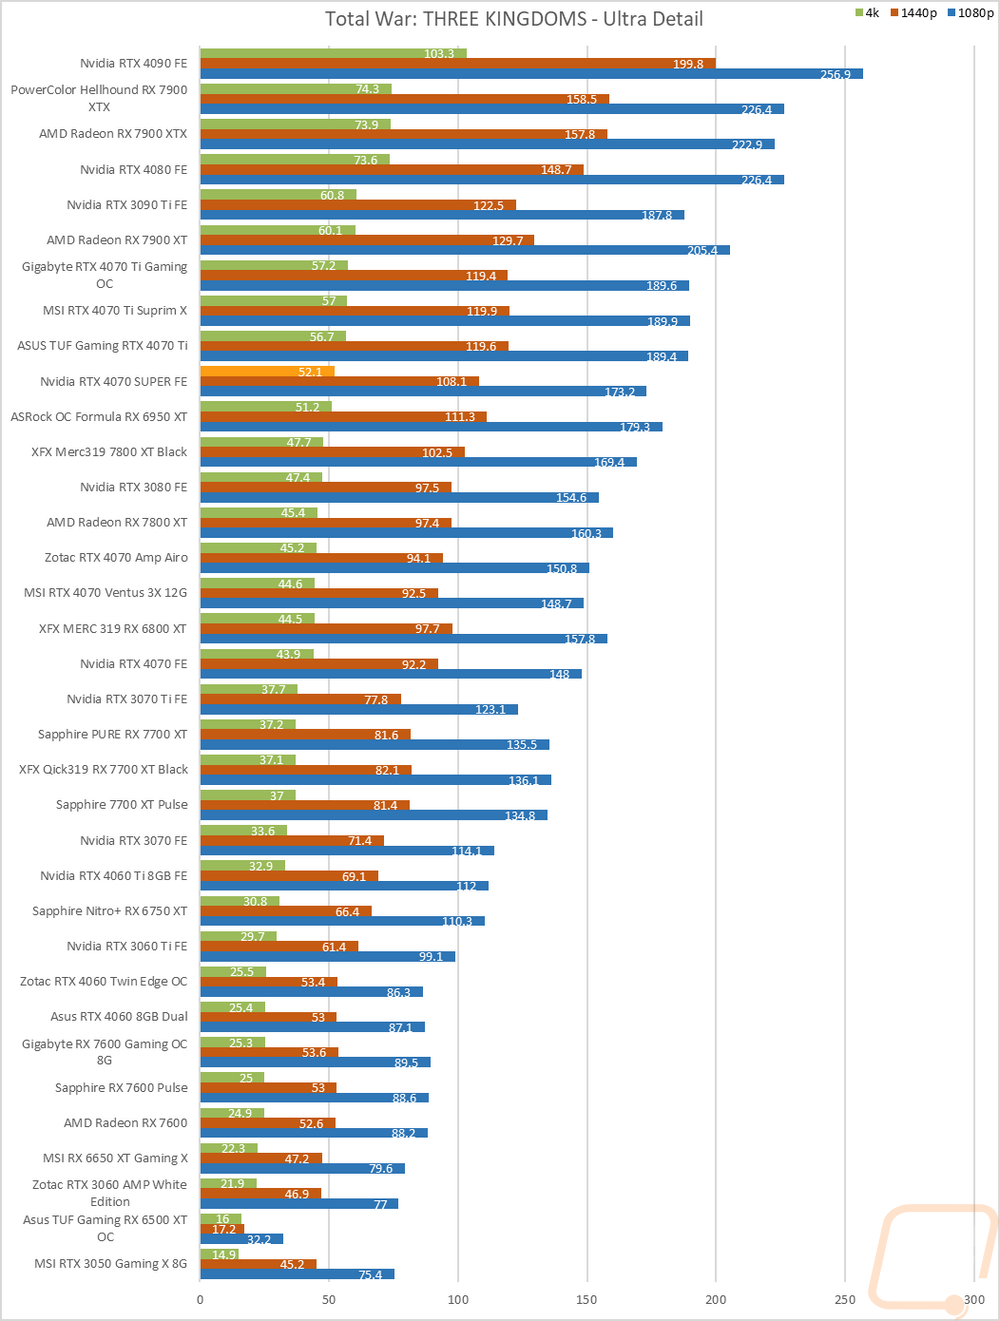
Total War: Three Kingdoms |
Built-in benchmark using the Battle Benchmark setting. Tested at 1080p, 1440p, and 4k at both high and ultra detail settings |
|
OctaneBench 2020.1 |
OctaneBench is designed to test rendering in OctaneRender. RTX and non-RTX are both ran. This is a CUDA-only test so only Nvidia cards are tested |
|
V-Ray 5 |
V-Ray 5 benchmark us run with CUDA and RTX settings on cards that support it |
|
Boundary Benchmark |
Testing different DLSS detail levels on cards that support it. All testing is done at 4k with RTX on |
|
Bright Memory Infinite RTX Benchmark |
Benchmark all of the different RTX detail levels. Resolution at 4k and DLSS on balanced for each test |
|
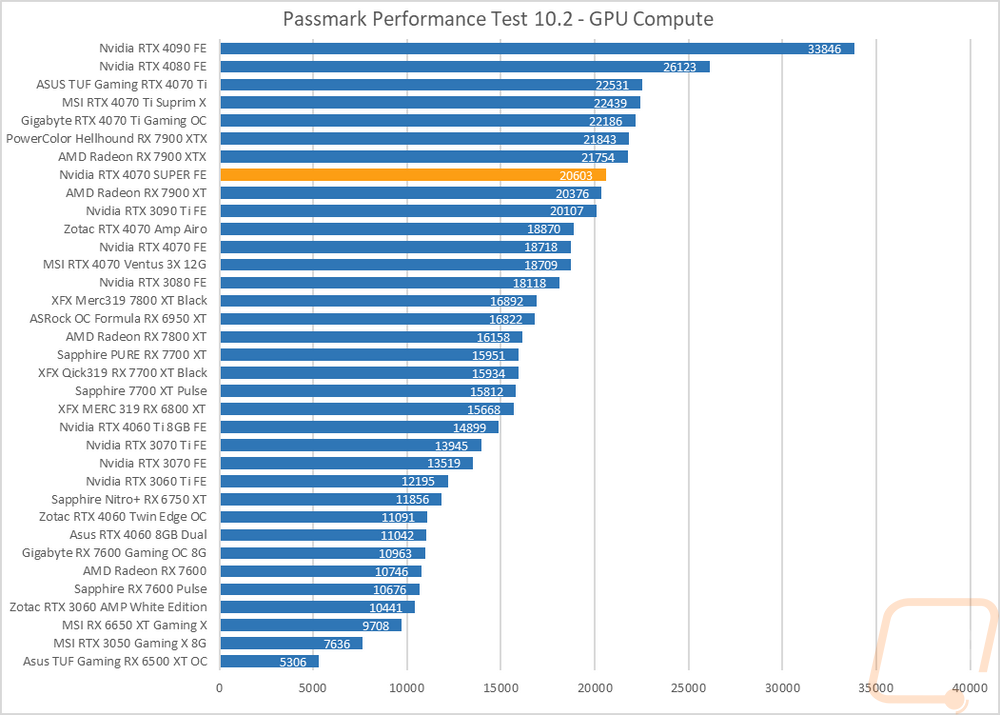
Passmark Performance Test 10.2 |
Test using the GPU Compute Score inside of PassMark's Performance Test 10.2 |
|
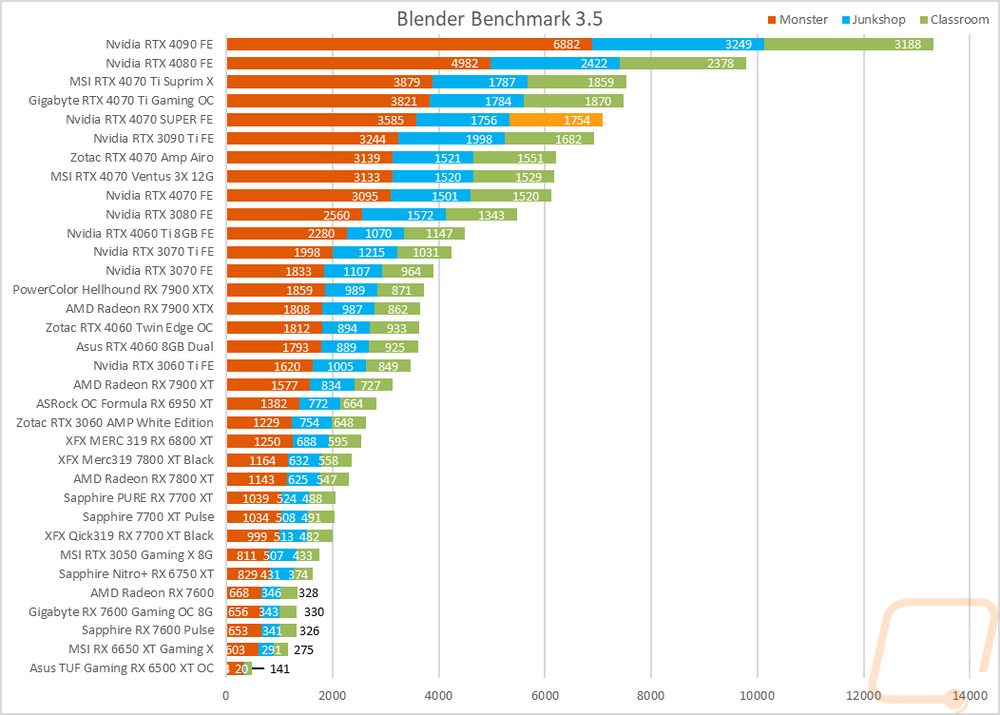
Blender |
Using the standard Blender Benchmark I run the test using the Blender 3.4 setting which tests using the Monster, Junkshop, and Classroom tests. |
|
Temperature Testing |
Using AIDA64, the GPU stress test is run for 30 minutes or until the result has leveled off. The test is run twice, once with the stock fan profile and a second time with 100% fan speed. During this, I also document the 100% fan speed RPM and document the delta between the fan profile and 100% fan speed as well as get thermal images. |
|
Power Testing |
Using a PCat v2 to monitor power between the PCIe slot and the card as well as power through the power cables I test the peak power when running ADIA64, 3DMark Speed Way, 3DMark Time Spy Extreme, FarCry 6 at 4k and Ultra Detail, Watch Dogs Legion at 4K and Ultra detail, and Blender 3.4.0. The results are then averaged as well as the highest result. |
|
Noise Testing |
Our Noise testing is done using a decibel meter 18 inches away from the video card on the bottom/fan side of the card. We test at 50% and 100% fan speeds as well as a third test while under load using AIDA64's stress test. This is done using a Protmex PT02 Sound Meter that is rated IEC651 type 2 and ANSI S1.4 type 2. Tests are done set weighted to A and set to a slow response using the max function. The ambient noise level in the testing area is 33.3 decibels. |
Synthetic Benchmarks
As always I like to start my testing with a few synthetic benchmarks. 3DMark especially is one of my favorites because it is very optimized in both Nvidia and AMD drivers. It's nice to not have to worry about it being favored too much either way and the repeatability of the results makes it a nice chance to compare from card to card, especially when comparing with the same GPU. In this case, the RTX 4070 SUPER Founders Edition is our first look at the 4070 SUPER but I will be looking to see how it compares with the original RTX 4070 and RTX 4070 Ti, and the RX 7800 XT from AMD which is selling for just under the $599 MSRP of the 4070 SUPER.
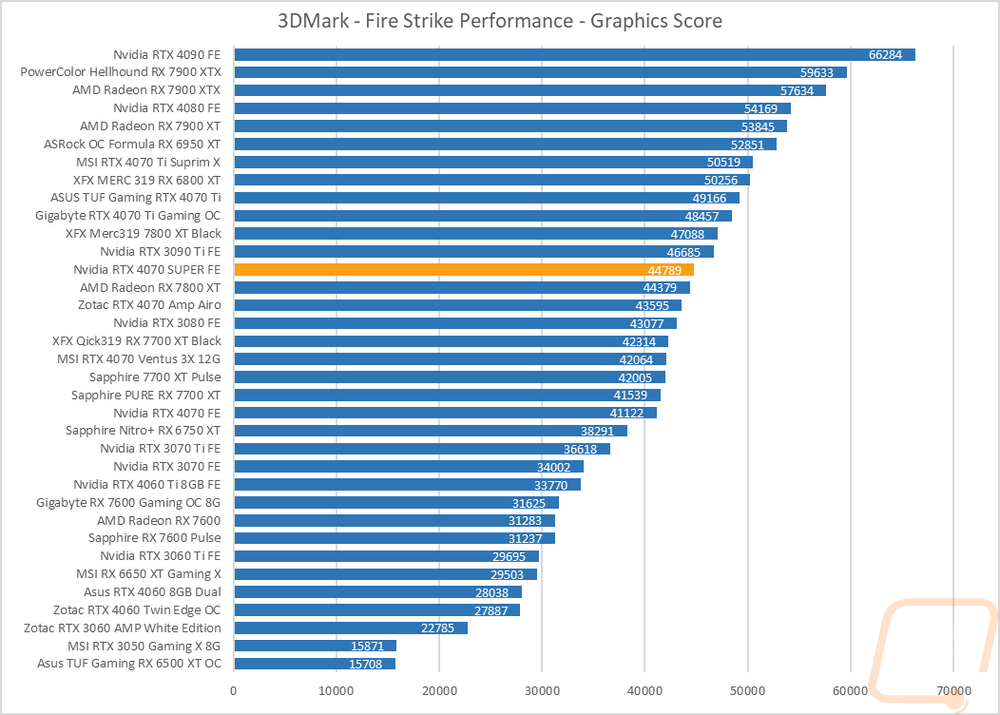
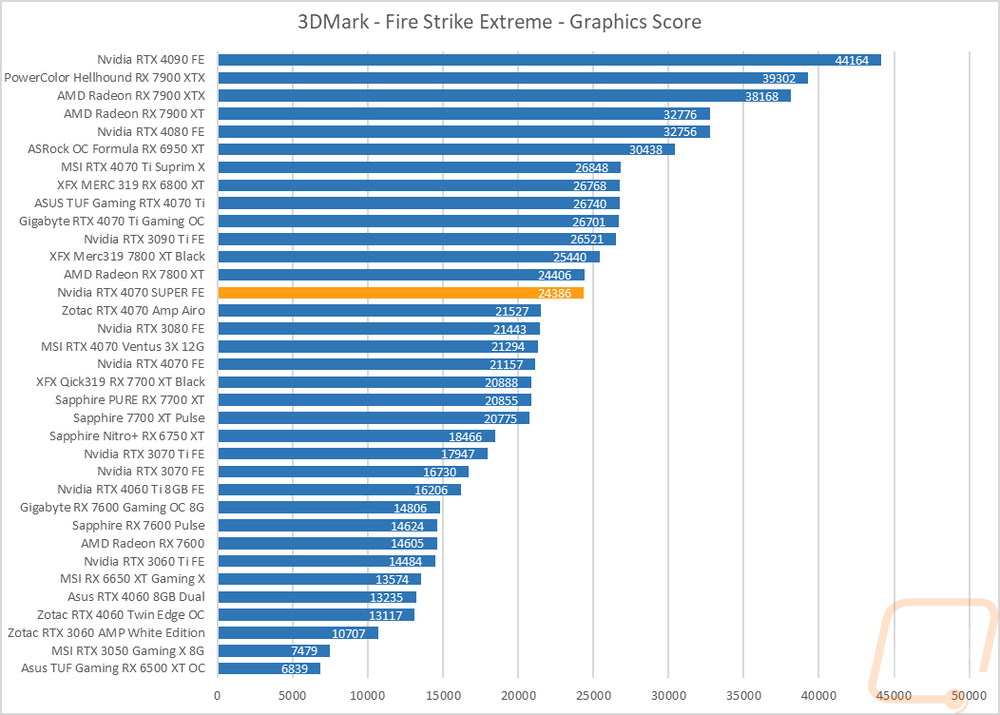
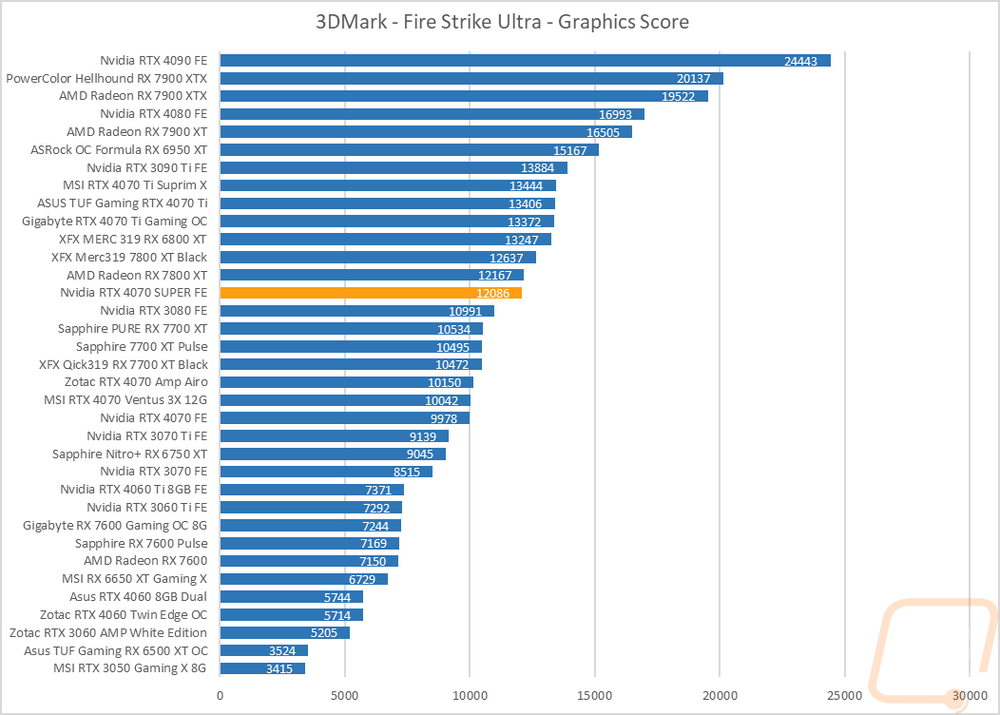
The first round of tests were done in the older Fire Strike benchmark which is a DX11 test. There are three detail levels, performance, extreme, and ultra. The RTX 4070 SUPER Founders Edition comes in sitting behind Nvidia’s flagship from last year the RTX 3090 Ti. It is ahead of the stock-clocked 7800 XT and the RTX 4070 but will be behind the 4070 Ti. In the Fire Strike Extreme test, the 7800 XT jumps ahead of the RTX 4070 SUPER Founders Edition by just a few points, and the same on the Fire Strike Ultra test as well.
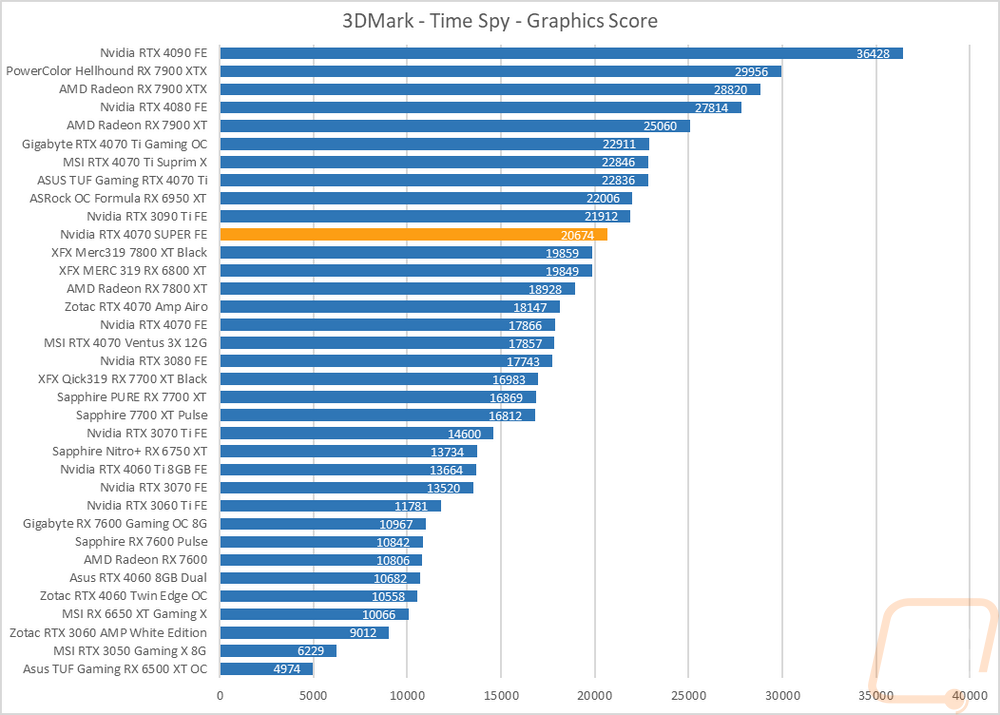
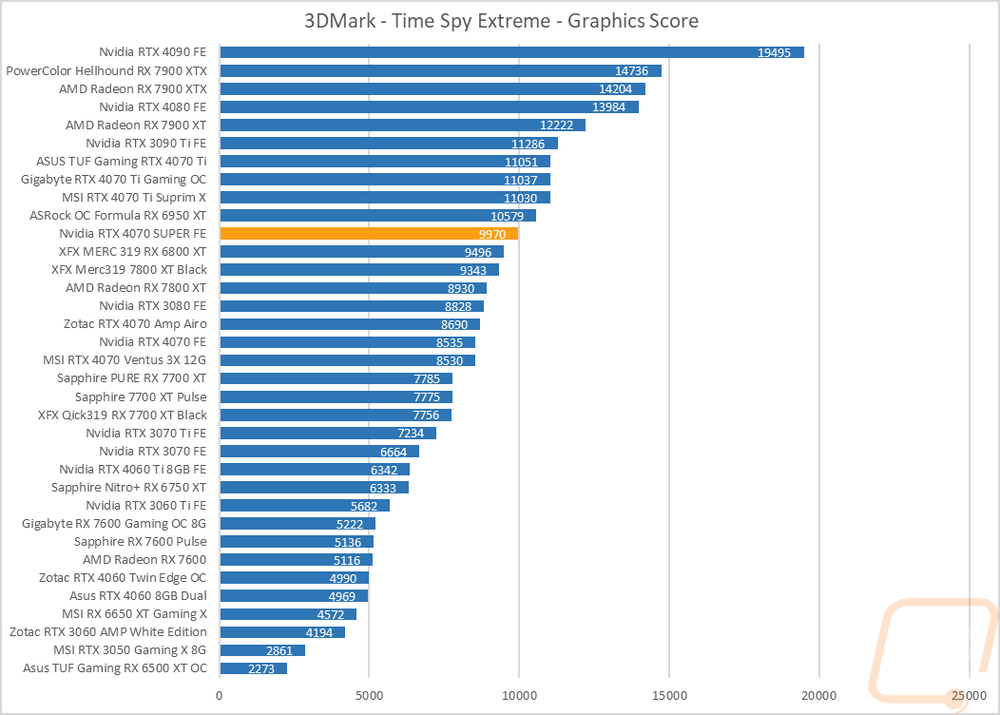
The next two were both based on the Time Spy benchmark. One is the standard test and then there is the extreme detail level. The RTX 4070 SUPER Founders Edition scored a 20674 in the base Time Spy test putting in behind the 3090 Ti and out in front of the overclocked 7800 XT by 819 points. In Time Spy Extreme the RTX 4070 SUPER Founders Edition is ahead of the 6800 XT and 7800 XT overclocked cards and going from the RTX 4070 to the 4070 SUPER is a 16.8% improvement.
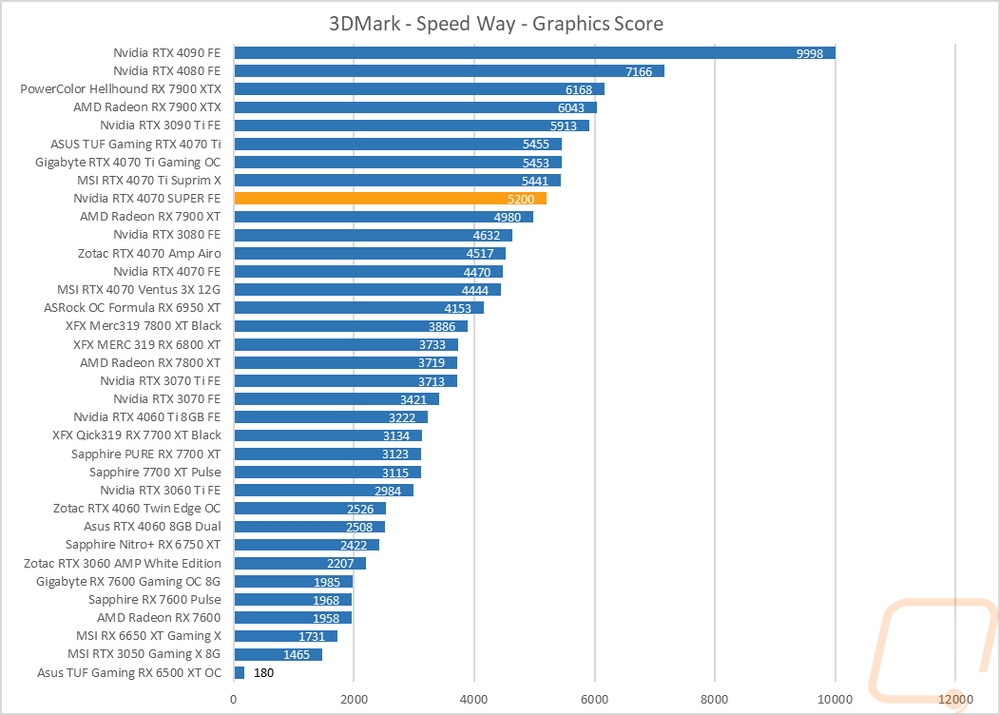
I did also test using the new 3DMark Speed Way which is their latest benchmark. Speed Way is DX12 as well but combines more future-focused tech like Ray Tracing which up until now 3DMark has only used in feature tests. All of the Nvidia cards do really well here but the RTX 4070 SUPER Founders Edition is no different. It scored a flat 5200 points sitting just behind the RTX 4070 Ti and ahead of the 7900 XT and is 16% in front of the original RTX 4070.
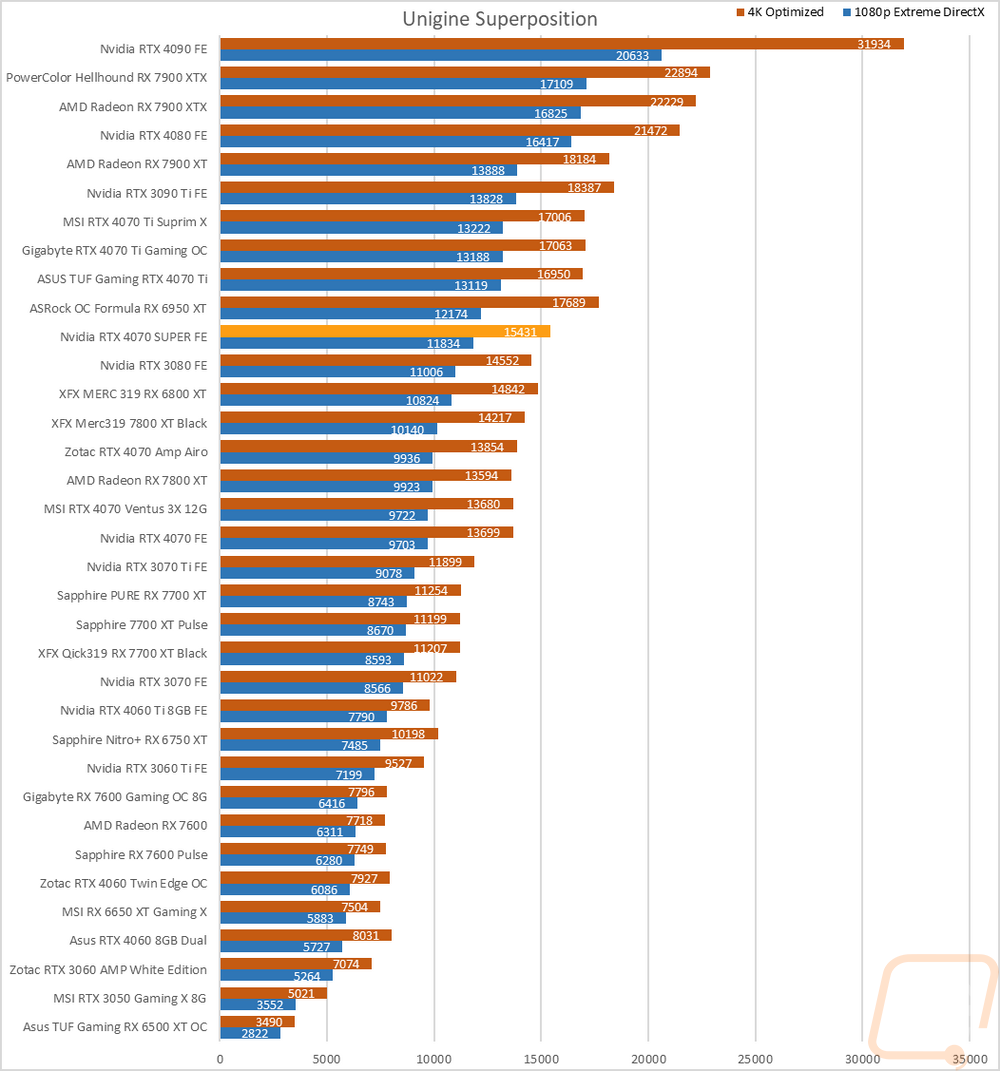
The last test was using the Unigine-based Superposition benchmark and I tested at 1080p with the extreme detail setting as well as the 4K optimized setting. In the extreme detail setting the RTX 4070 SUPER Founders Edition scored 11834 putting it under the 6950 XT and ahead of the older RTX 3080. No surprises with the 4070 Ti still out in front and the 7800 XT and original RTX 4070 are behind it. The 4K Optimized results are similar as well with just the 6950 XT moving up and away from the RTX 4070 SUPER Founders Edition.
VR Benchmarks
As for Virtual Reality, I love it but it is more demanding than traditional gaming. This is partially because of the resolutions needed to render for two eyes and because they render more than what is immediately visible. But also because of post effects to get the proper “fisheye” effect for it to look proper in your eyes with the HMD. You also have to have much higher expectations for frame rates in VR, skipping frames or lower FPS can cause motion sickness in VR. Because of that, I ran a few tests.
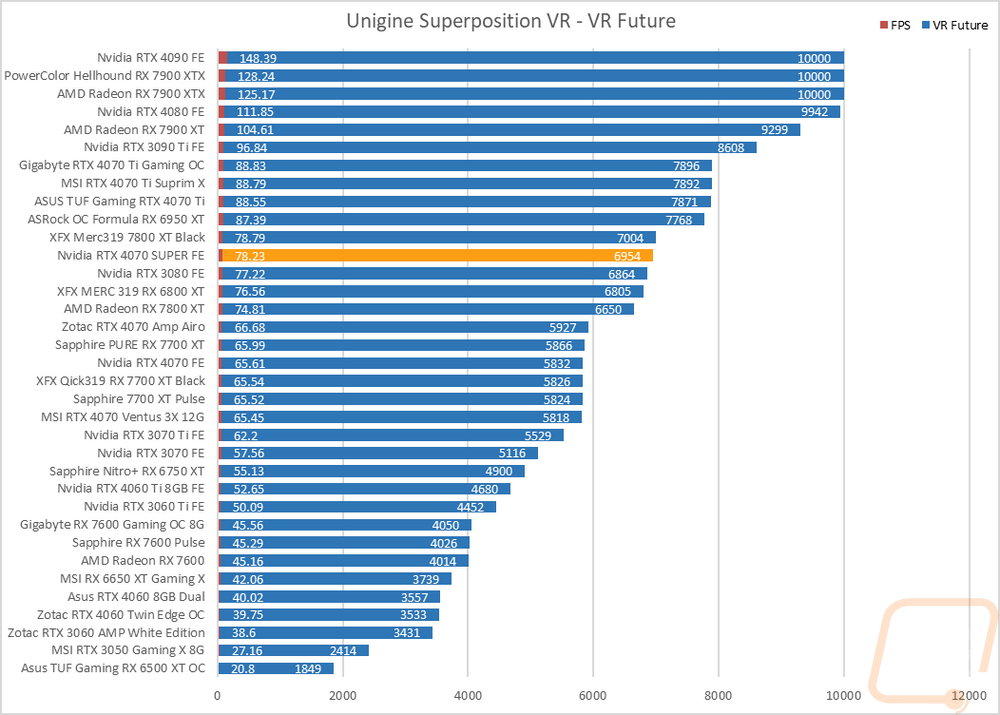
My first test was again in Superposition. This time I tested the VR Future test using the Oculus resolution. I have also included the average frame rate as well which is important for the cards at the top of the chart because for some reason Superposition is capped at 10,000 for its scores and that doesn’t show the performance gap in those cards at the top. The RTX 4070 SUPER Founders Edition outperformed the RTX 3080 and is ahead of the RTX 4070 and RX 7800 XT at its stock clocks but the 7800 XT overclocked card did edge it out slightly.
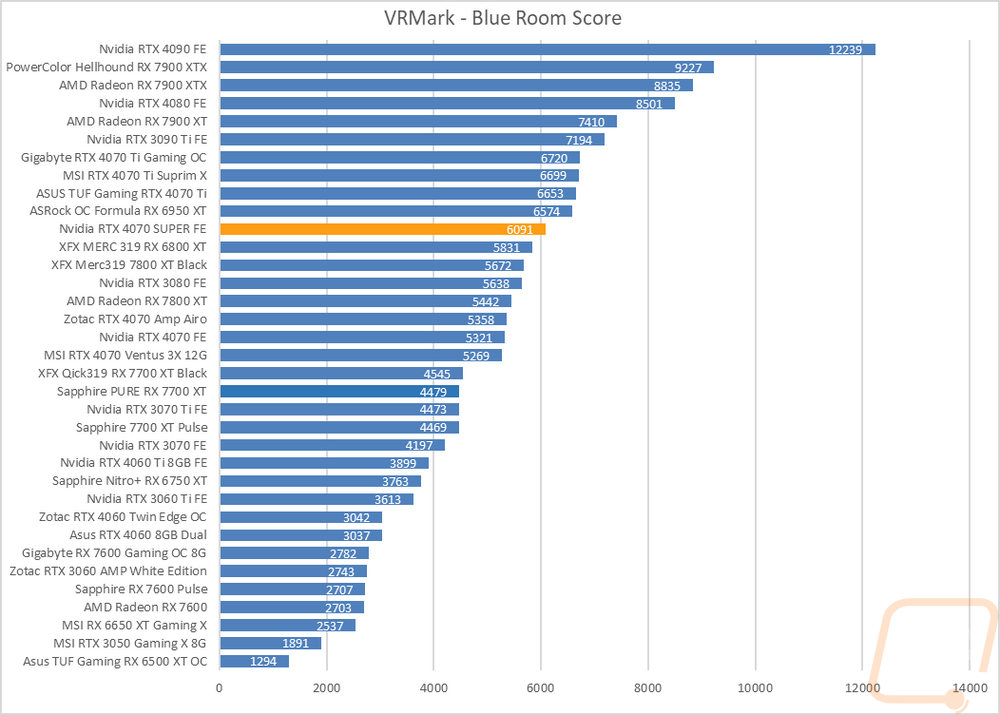
My second round of VR testing was in VRMark which has three tests that are similar to the VR tests in Superposition. I only focused on just the most demanding test called Blue Room which is looking more at future VR performance. The RTX 4070 SUPER Founders Edition scored 6091 and is sitting between the RX 6950 XT and the 6800 XT. It outperformed the 7800 XT by 12% and the original RTX 4070 by 14%.
In-Game Benchmarks
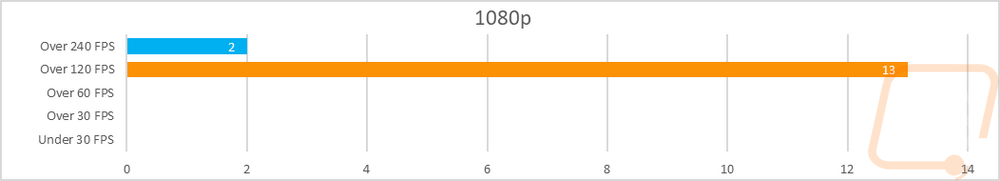
Now we finally get into the in game performance and that is the main reason people pick up a new video card. To test things out I ran through our new benchmark suite that tests 10 games at three different resolutions (1080p, 1440p, and 4k). Most of the games tested have been run at the highest detail setting and a mid-range detail setting to get a look at how turning things up hurts performance and to give an idea of whether turning detail down from max will be beneficial for frame rates. In total, each video card is tested 48 times and that makes for a huge mess of results when you put them all together. To help with that I like to start with these overall playability graphs that take all of the results and give an easier-to-read result. I have one for each of the three resolutions and each is broken up into four FPS ranges. Under 30 FPS is considered unplayable, over 30 is playable but not ideal, over 60 is the sweet spot, and then over 120 FPS is for high refresh rate monitors.
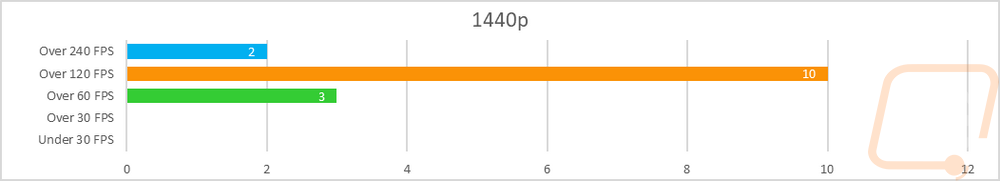
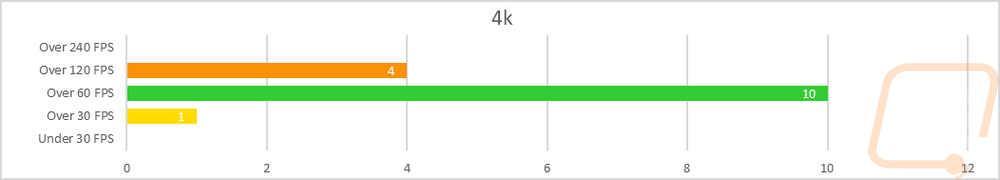
So how did the RTX 4070 SUPER Founders Edition do? Well no big surprises at 1080p, none of the games tested even at their highest detail settings proved to be a problem. Two of the results were up over 240 FPS and the rest were over 120 FPS. At 1440p we see more of a mix but the RTX 4070 SUPER Founders Edition still did really well, everything was smooth and over 60 FPS with 3 results in the 60 FPS range, 10 over 120 FPS, and two again over 240 FPS. Then at 4k, the RTX 4070 SUPER Founders Edition had just one result come in that 30-50 FPS range. 10 results were over 60 FPS and 4 were even higher in the over 120 FPS range. In other words, the RTX 4070 SUPER Founders Edition can handle all three resolutions well with high refresh 1080p and 1440p being its sweet spot.
Of course, I have all of the actual in game results as well for anyone who wants to sort through the wall of graphs below. I also have averaged out all of the results for the RTX 4070 SUPER Founders Edition along with the original RTX 4070 FE, RTX 4070 Ti, and the RX 7800 XT from AMD which is in the same price range as the 4070 SUPER. The 4070 Ti is still out ahead of all of the cards, no surprises there but the gap isn’t too much with just 9 FPS at 1440p and 8 FPS at 1080p, even at 4K the gap is 7 FPS. The 4070 SUPER averaged higher than the RX 7800 XT in all of the tests and is even farther away from the RTX 4070.
|
Average FPS |
1080P |
1440p |
4K |
|
RTX 4070 Founders Edition |
190.6 |
147.6 |
83.5 |
|
AMD RX 7800 XT |
190.7 |
156.3 |
89.3 |
|
RTX 4070 SUPER Founders Edition |
202.7 |
163.6 |
96 |
|
ASUS TUF Gaming RTX 4070 Ti |
210.7 |
174.1 |
103.6 |
Compute Benchmarks
Now some people don’t need a video card for gaming, they need the processing power for rendering or 2D/3D production, or in some cases people who game also do work on the side. So it is also important to check out the compute performance on all of the video cards that come in. That includes doing a few different tests. My first test was a simple GPU Compute benchmark using PassMark's Performance Test 10 and the RTX 4070 SUPER Founders Edition outperforms even the AMD RX 7900 XT and has a big gap between it and the next card up, the RX 7900 XTX. This of course means that it is well ahead of the 7800 XT and a big gap in front of the RTX 4070 as well.
Blender is always my favorite compute benchmark because the open-source 3D rendering software is very popular and it isn’t a synthetic benchmark. With the latest version of Blender, they redid the benchmark so we now have a new test that runs three different renderings and gives each a score. I have all three stacked together so we can see the overall performance. The RTX 4070 SUPER Founders Edition did better than I expected here, the RTX 4070 Ti is the next card up and it is out in front of the powerful previous generation flagship RTX 3090 Ti.
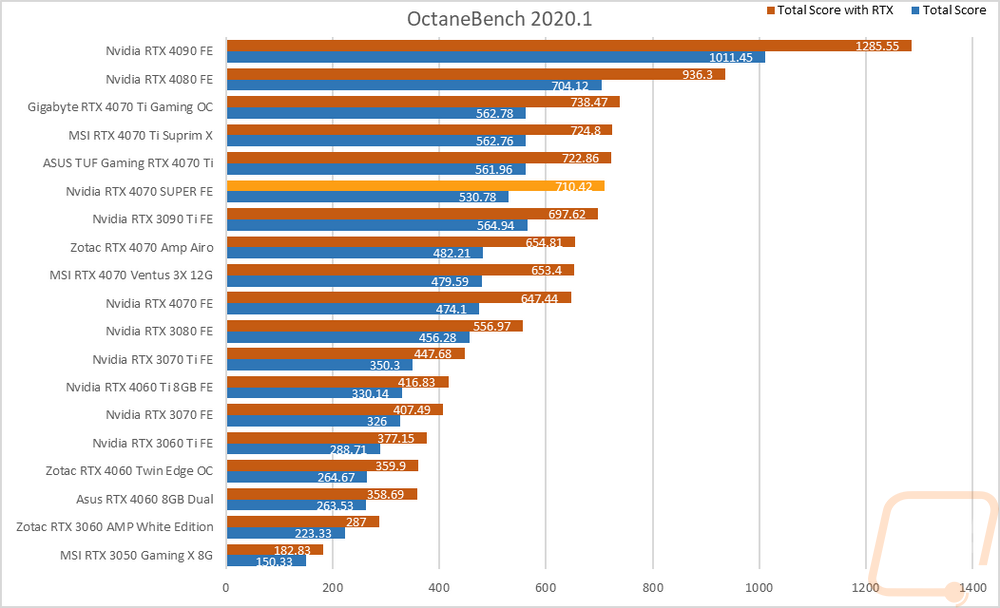
For CUDA-based cards, I also check out OctaneRender performance using their OctaneBench 2060.1 benchmark which allows me to check out both RTX and non-RTX rendering performance. Here the RTX 4070 SUPER Founders Edition is just behind the RTX 4070 Ti and way out in front of the older RTX 4070.
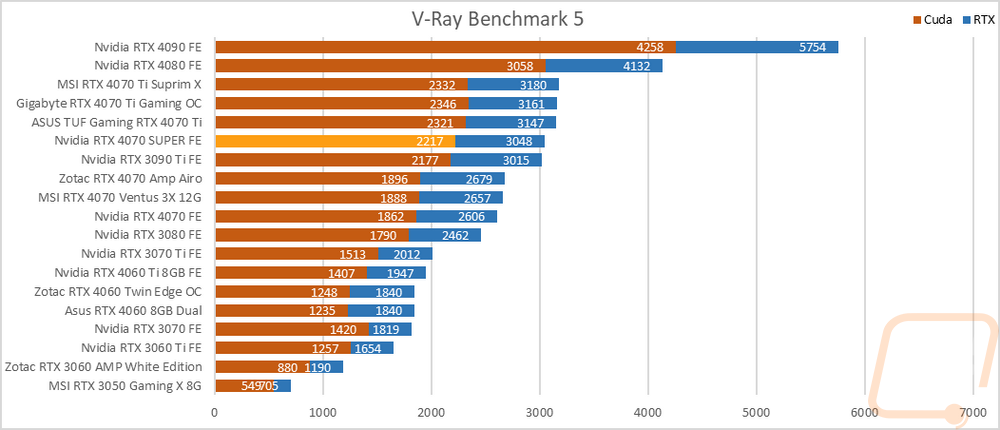
An additional CUDA-based test I also ran V-Ray Benchmark 5 to check out CUDA and RTX performance in the 3D rendering and simulation software. The RTX 4070 SUPER Founders Edition fits right below the RTX 4070 Ti and above the older RTX 3090 Ti and even though this isn’t the first time it still amazes me that this card outperforms that monster.
RTX and DLSS
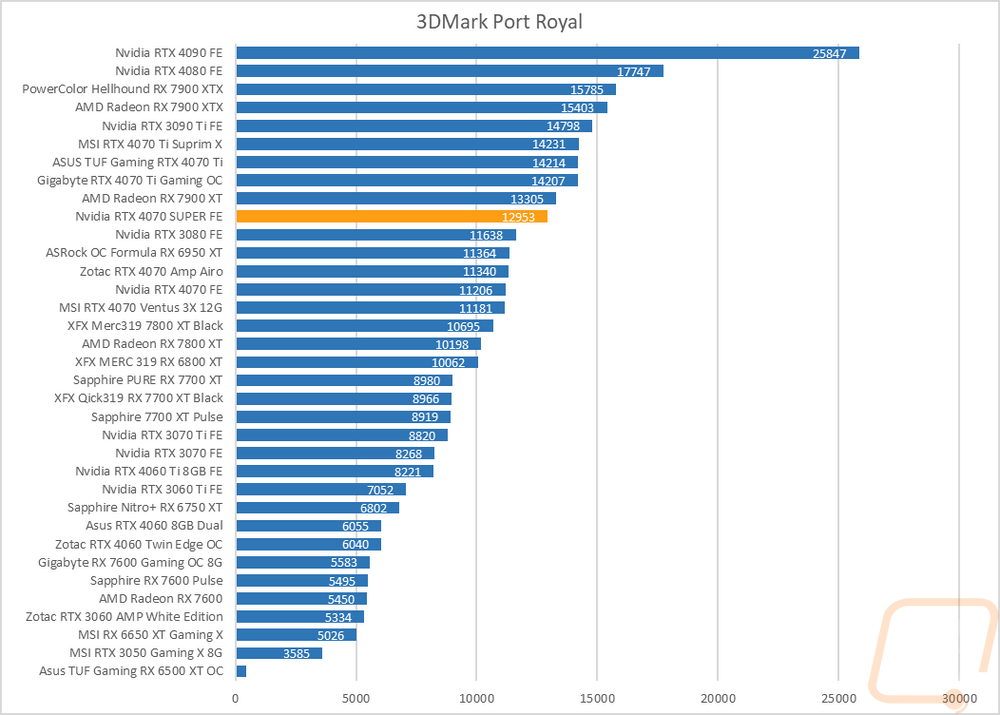
Being an RTX card I also like checking out the performance of some of Nvidia’s features. Namely the ray tracing performance and the performance improvements you can see by using DLSS combined with the tensor cores. My first test goes back to our synthetic benchmarks with 3DMark where I check out their Port Royal benchmark. This is the one test that also have AMD Ray Tracing support which is great to get a look at how different cards including older non-RTX cards perform. The RTX 4070 SUPER Founders Edition sits behind the RX 7900 XT and then there is a large gap with the RTX 3080, RTX 4070, and RX 7800 XT.
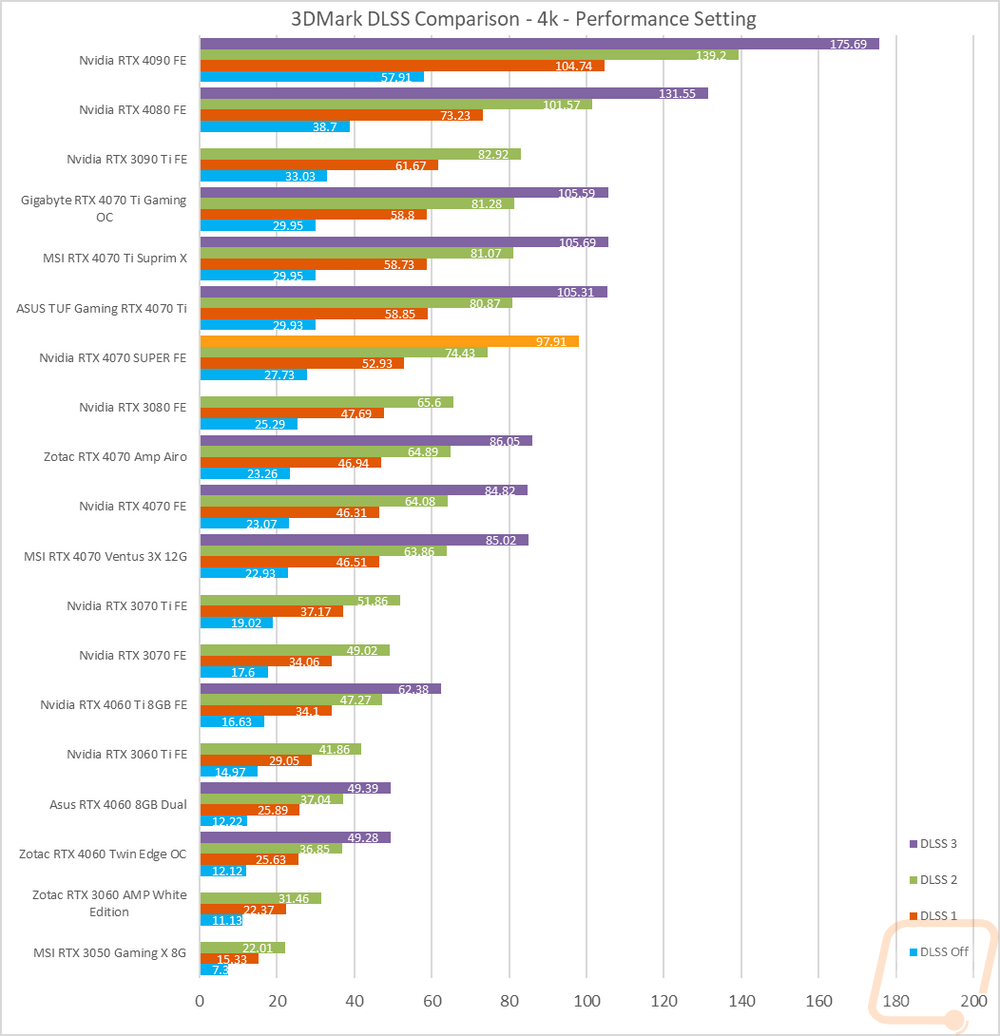
3DMark also has added in a few feature tests, one being a look at DLSS performance. For this one, I have the resolution set to 4K and I test with all three versions of DLSS as well as with it off completely. All DLSS are set to their performance setting as well to keep the results comparable. This gives us a great look at the performance improvements that DLSS has given with DLSS 3 also including frame generation. The RTX 4070 SUPER Founders Edition went from 27 FPS with DLSS off and up to 52 FPS with DLSS 1. DLSS 2 was 74 FPS and DLSS 3 with frame generation was an impressive 97 FPS, a huge jump from the original 27 FPS.
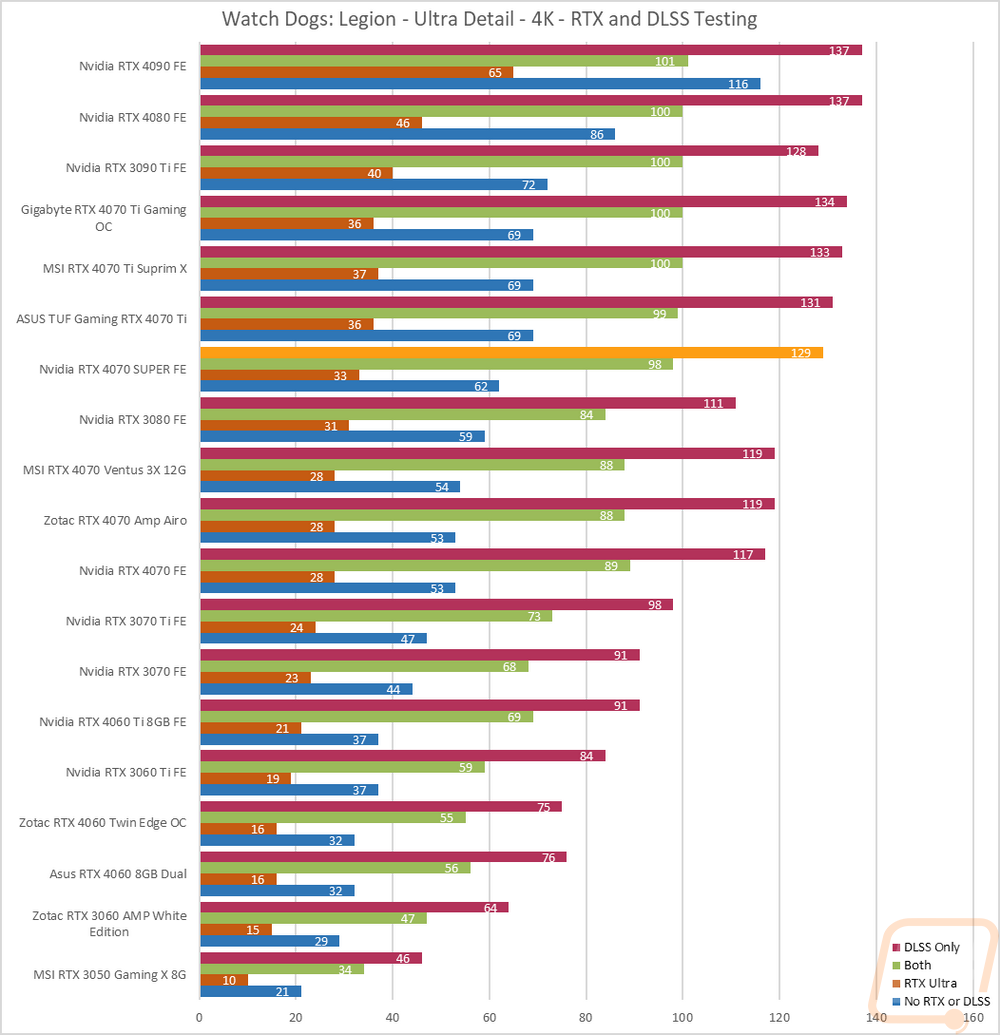
I then jumped into game tests, this time with Watch Dogs: Legion. For this one, I wanted to get an idea of the performance you will see when taking advantage of Nvidia’s RTX and DLSS features. I tested at 4k with the ultra detail setting and with ultra being the setting for DLSS and RTX when they are on as well. I then test with no RTX or DLSS on and then with RTX DLSS on and off and on together. The RTX 4070 SUPER Founders Edition sits under the RTX 4070 Ti and is ahead of the RTX 3080 and RTX 4070, no surprises there. What is interesting though is to see how with RTX only on you are getting 33 FPS but turning DLSS on performance jumps up to a usable 98 FPS. With just DLSS and no RTX that goes even higher to 129 FPS all while at 4K and the Ultra detail setting which is a higher resolution than the 4070 SUPER is targeted. DLSS opens up the ability to enjoy RTX in situations where it would make games choppy or slow and lets the RTX 4070 SUPER Founders Edition punch above its weight class when compared to cards that don’t support it.
I also wanted to take a look at DLSS 3 performance as well a little more than my initial look at it with 3DMark’s benchmark. For this, I put Nvidias Frameview to the test to run a few benchmarks using the games that currently support DLSS 3. For games with a built-in benchmark, I ran the benchmark but used frameview so we could get the FPS and 1% lows and because with some of the games frame generation is messing up their in game FPS readouts. V-Sync was turned off on all of the tests because it currently causes problems with frame generation and all of the tests were done at 1080p, 1440p, and 4k with the highest detail settings including the highest RTX settings. DLSS 3 when there is an option was set to performance.
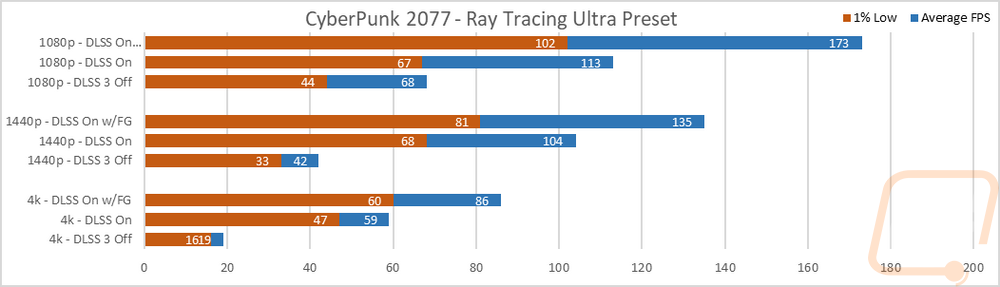
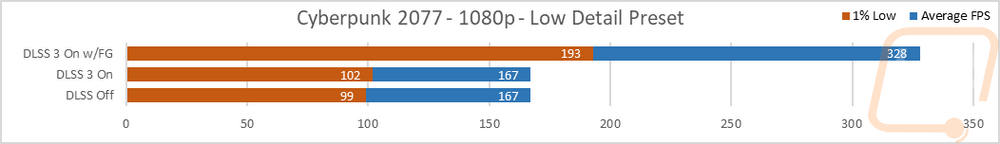
The first game tested was Cyberpunk 2077 and for this one, I tested at 1080p, 1440p, and 4K. I also did a fourth test at 1080p and low settings to get a look at how frame generation helps when CPU limited. At all three resolutions, DLSS offers a big improvement on the RTX 4070 SUPER Founders Edition, this is exaggerated even more when you go a step further and turn on frame generation as well. At 1440p, the targeted FPS of the RTX 4070 SUPER Founders Edition goes from 42 FPS average FPS up to 104 with DLSS and 135 with frame generation also on. But at 4k it is most interesting, performance goes from an unplayable 19 FPS up to 59 FPS just with DLSS and to 86 FPS with frame generation. The low detail test does a great job of showing just how frame generation can help with performance when you are in a CPU limited situation. DLSS itself didn’t change the average FPS but frame generation doubled the performance. The 1% lows are a lot lower, but still up over the 167 FPS on the other two results.
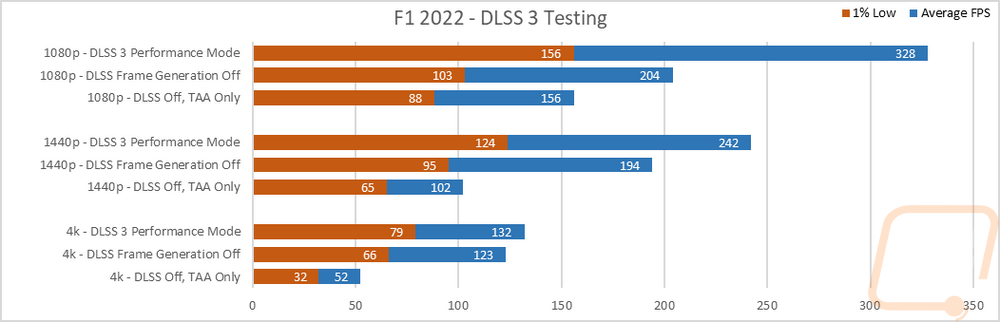
In F1 2022 I ran three tests. I tested with full DLSS, I did it again but turned off frame generation, and then tested with DLSS off and TAA on. Frame generation here was a big help at 1080p and 1440p but this is a situation where you should test and confirm things, running it at 4K didn’t offer a big improvement over DLSS without frame generation.
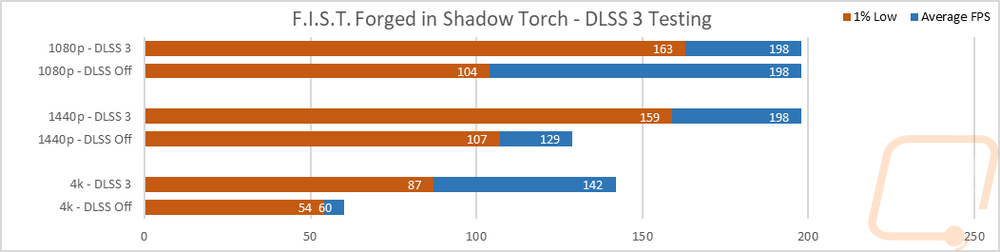
In the side scroller Forged in Shadow Torch DLSS 3 helped with the 1% lows at 1080p but the game seems to be capped at 198 for the average FPS on both results. The same goes for 1440p when DLSS is turned on but we can still see just how much performance was gained. At 4K though it is most obvious going from 60 FPS up to 142 which is a huge improvement!
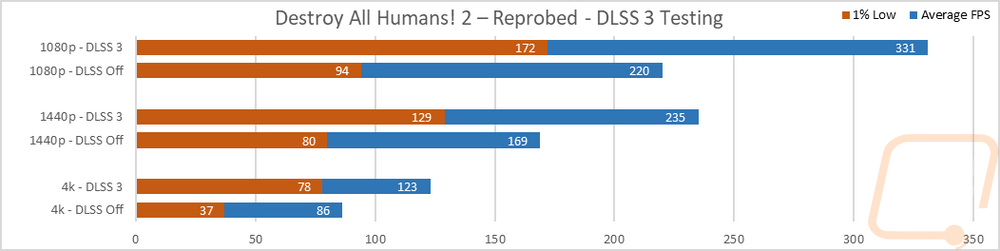
Next up was Destroy All Humans! 2 – Reprobed. The RTX 4070 SUPER Founders Edition performed well even without DLSS at all three resolutions with 4K still reaching 86 FPS but with surprisingly low 1% lows. DLSS helped improve on that a low bringing the lows up to 78 and the average up to 123 FPS. At 1440p DLSS improved the average FPS by 39% and it was even higher at 1080p going from 220 to 331 for a 50% improvement.
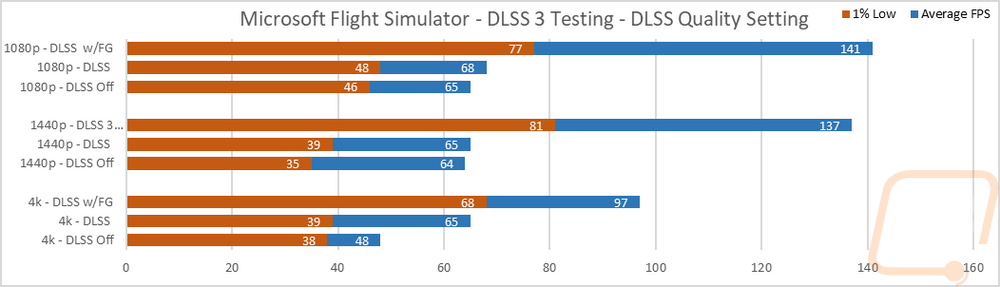
Last I look at Microsoft Flight Simulator and this is an interesting case because this is a well-known CPU-limited game. To keep things consistent the test used the landing test run over Sydney With DLSS off and again with DLSS, and a third time with DLSS on as well as frame generation. This included having DLSS on the quality setting, you can get even better performance by changing that and with the detail settings on their highest settings. I tested at 1080p, 1440p, and 4k. This is a great example of a game that is CPU limited where frame generation is the star that is able to get big performance gains that you otherwise would never get. At 1080p and 1440p especially you can see that DLSS being on made nearly no difference in performance but frame generation doubled the frame rates. Even 1% lows are well over the average frame rates without frame generation. At 4K the CPU limitations are a little less obvious, there is an improvement between having DLSS on or off but even there frame generation still gives a big improvement as well going from 48 without either, up to 65 with DLSS and 97 with DLSS and frame generation.
Cooling Noise and Power
For my last few tests, rather than focusing on in game performance, I like to check out other aspects of video card performance. These are also the most important ways to differentiate the performance between cards that have the same GPU. To start things off I took a look at power usage.
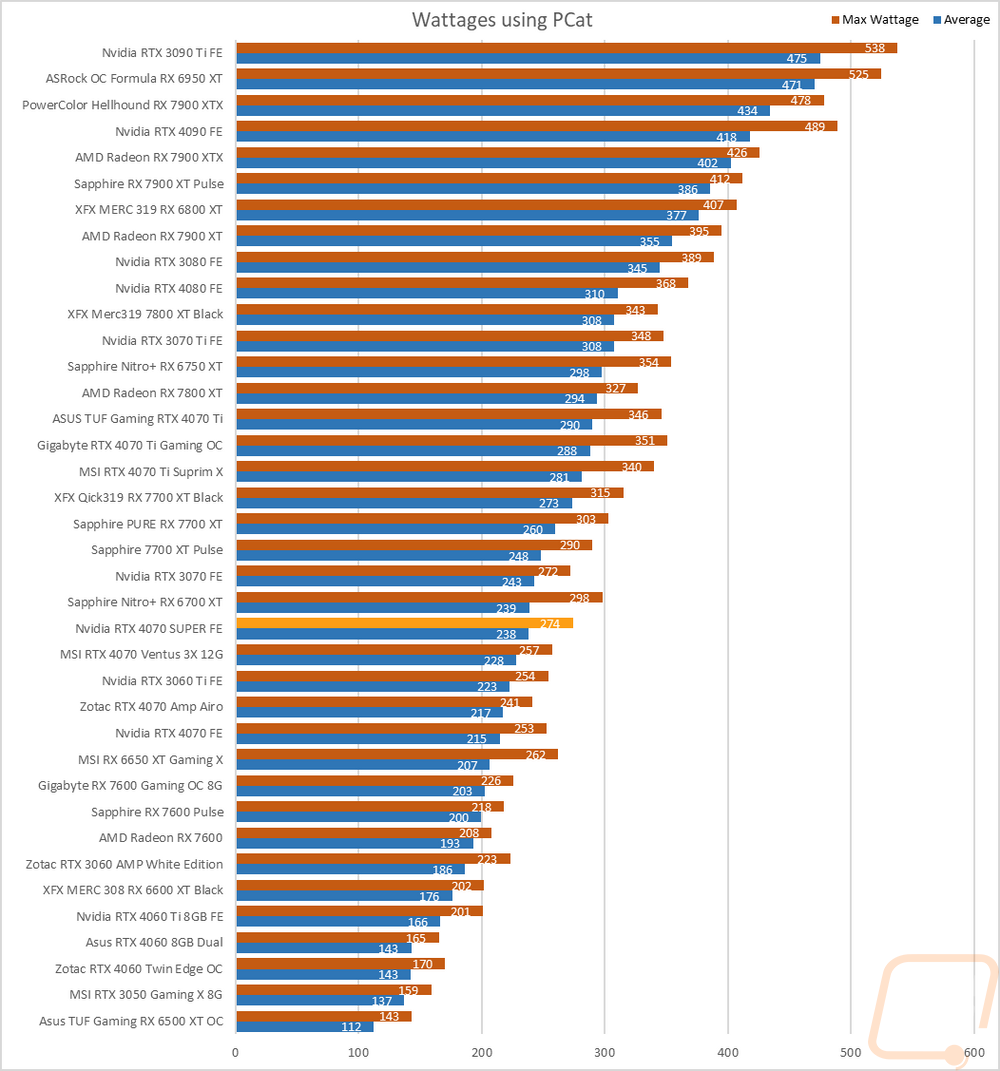
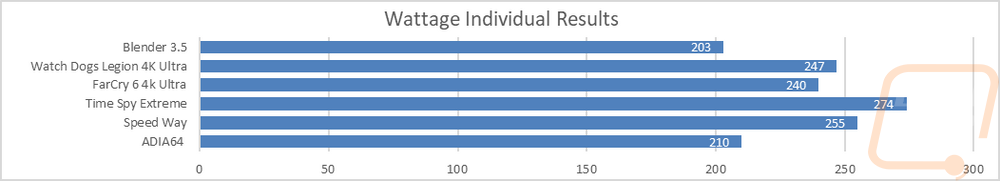
For this, our new test setup utilizes the Nvidia-designed PCat v2 along with cables to handle both traditional 6 or 8-pin connections as well as the new 12VHPWR. The PCat also utilizes a PCIe adapter to measure any power going to the card through the PCIe slot so we can measure the video card wattage exclusively, not the entire system as we have done in the past. I test with a mix of applications to get both in game, synthetic benchmarks, and other workloads like Blender and AIDA64. Then everything is averaged together for our result. I also have the individual results for this specific card and I document the peak wattage result as well which is almost always Time Spy Extreme. The RTX 4070 SUPER Founders Edition has a 20-watt higher TGP than the original RTX 4070 and our average wattage was just about spot on for that. It averaged across all of the tests 238 watts where the RTX 4070 did 215 so it's just 3 watts off from the 20 watts and the peak wattage was 274 for the RTX 4070 SUPER Founders Edition and 253 for the original RTX 4070. For comparison, because I have been comparing the RTX 4070 SUPER Founders Edition to the RX 7800 XT in our other tests, the 7800 XT averaged 294 watts and peaked at 327 watts, 56 watts higher on the average and 53 watts higher on the peak.
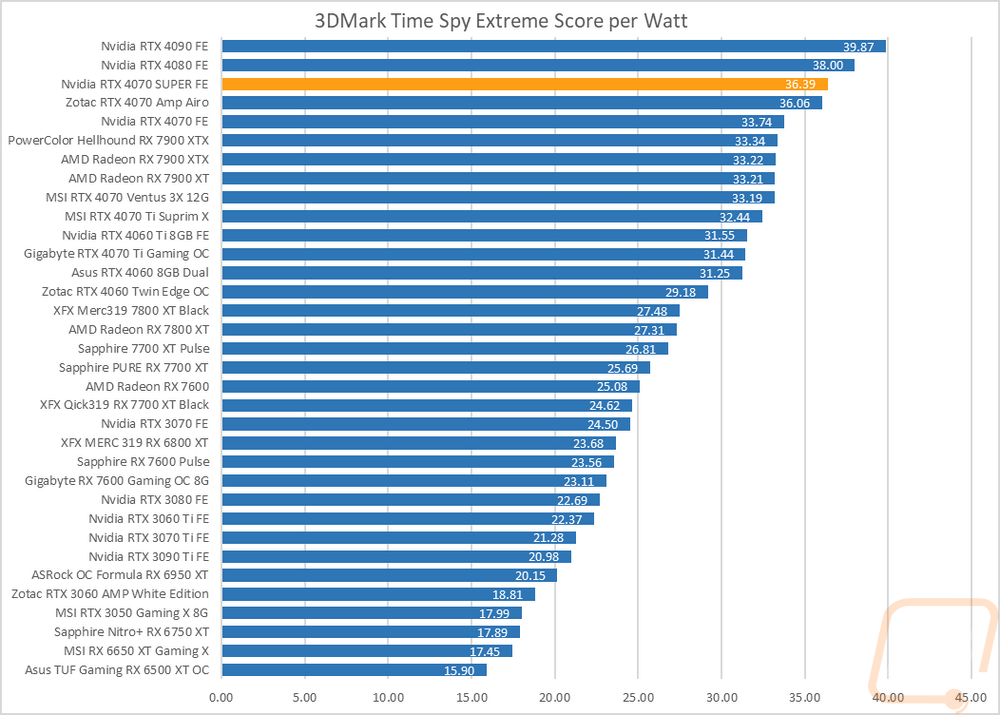
With having exact peak wattage numbers when running Time Spy Extreme I was also able to put together a graph showing the total score for each watt that a card draws which gives us an interesting look at overall power efficiency in the popular and demanding benchmark. The 4000 Series cards, especially when not overclocked have been at the top of our performance-to-watt chart but the first of the SUPER cards with a big bump in cores and not much of a wattage increase did really well here and is behind just the RTX 4080 and RTX 4090. More than anything though it makes me curious to see how the RTX 4080 SUPER and RTX 4070 Ti SUPER will do when both of those cards aren’t changing their wattages with the improved performance.
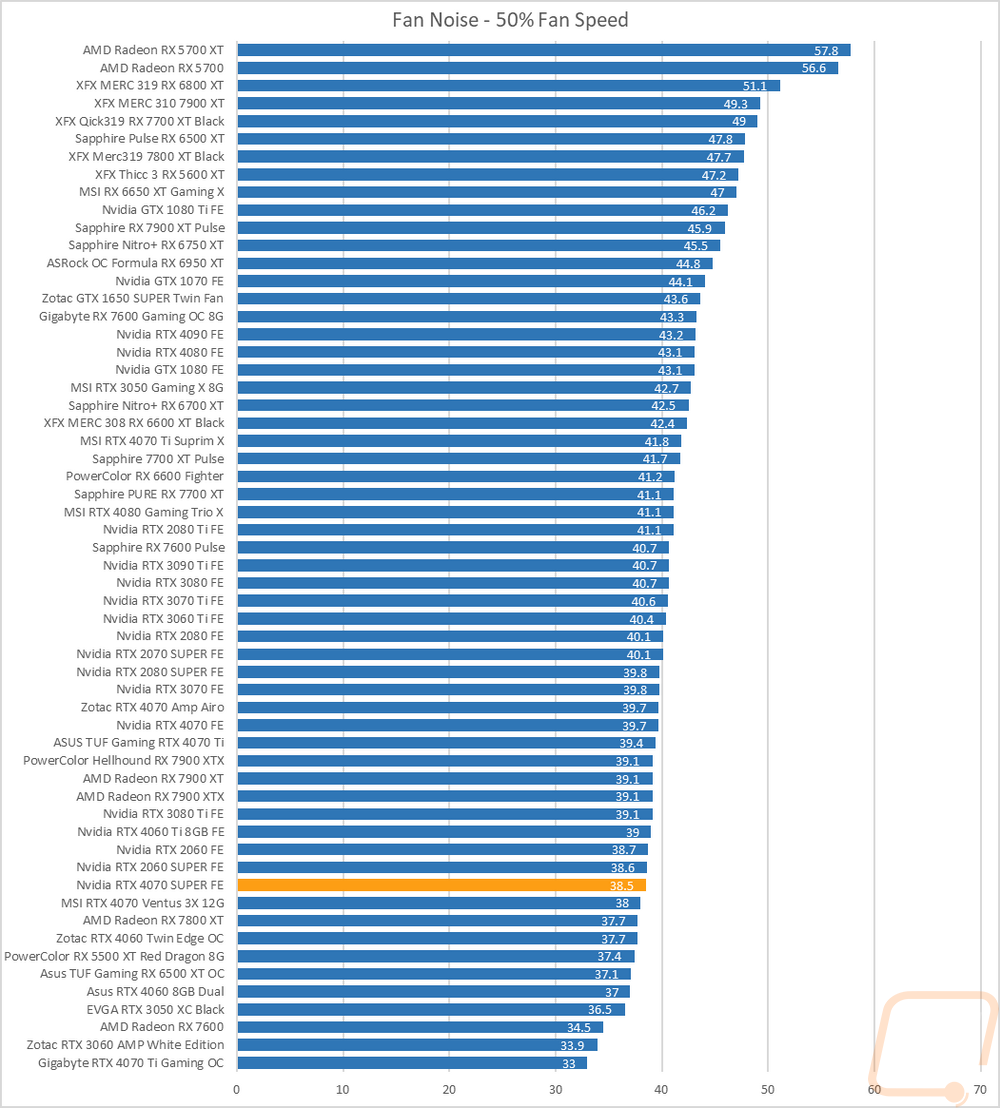
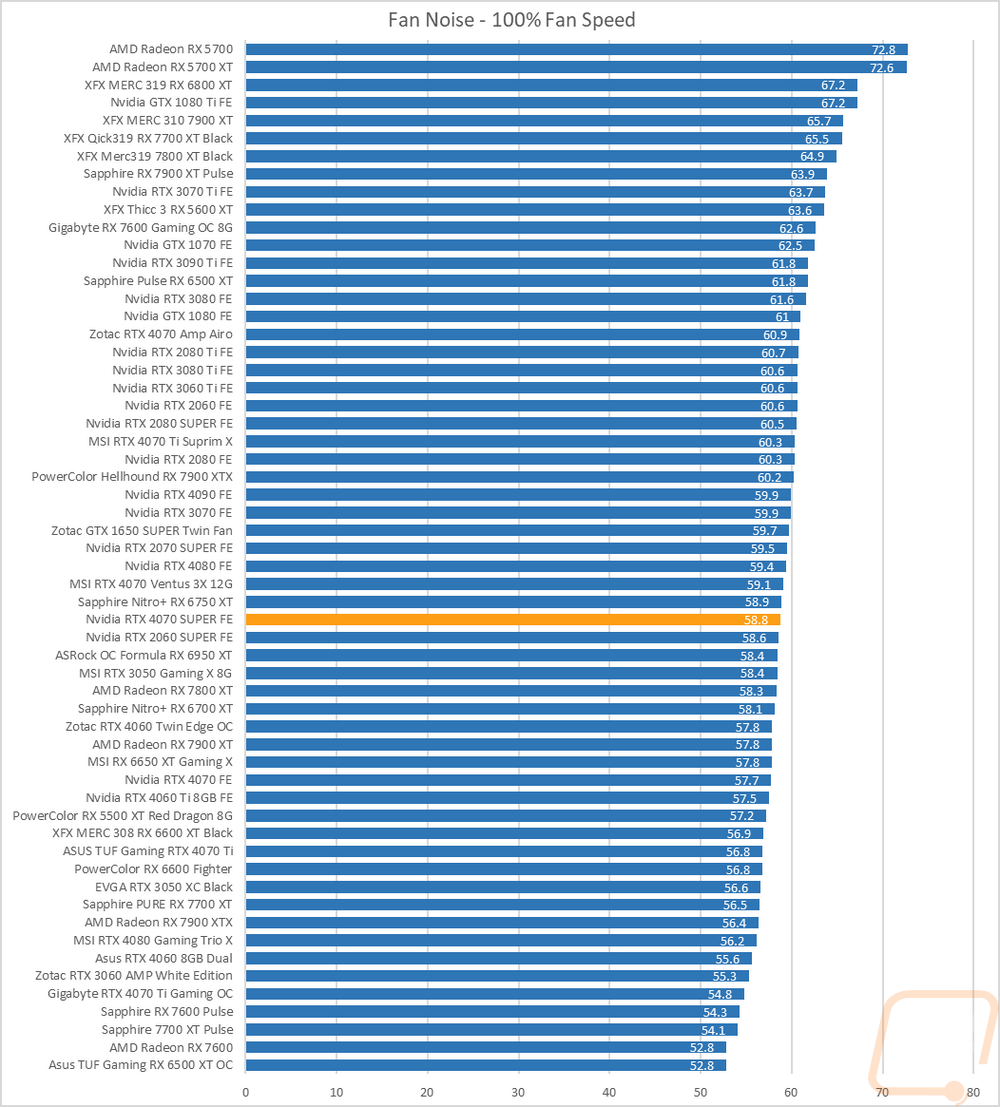
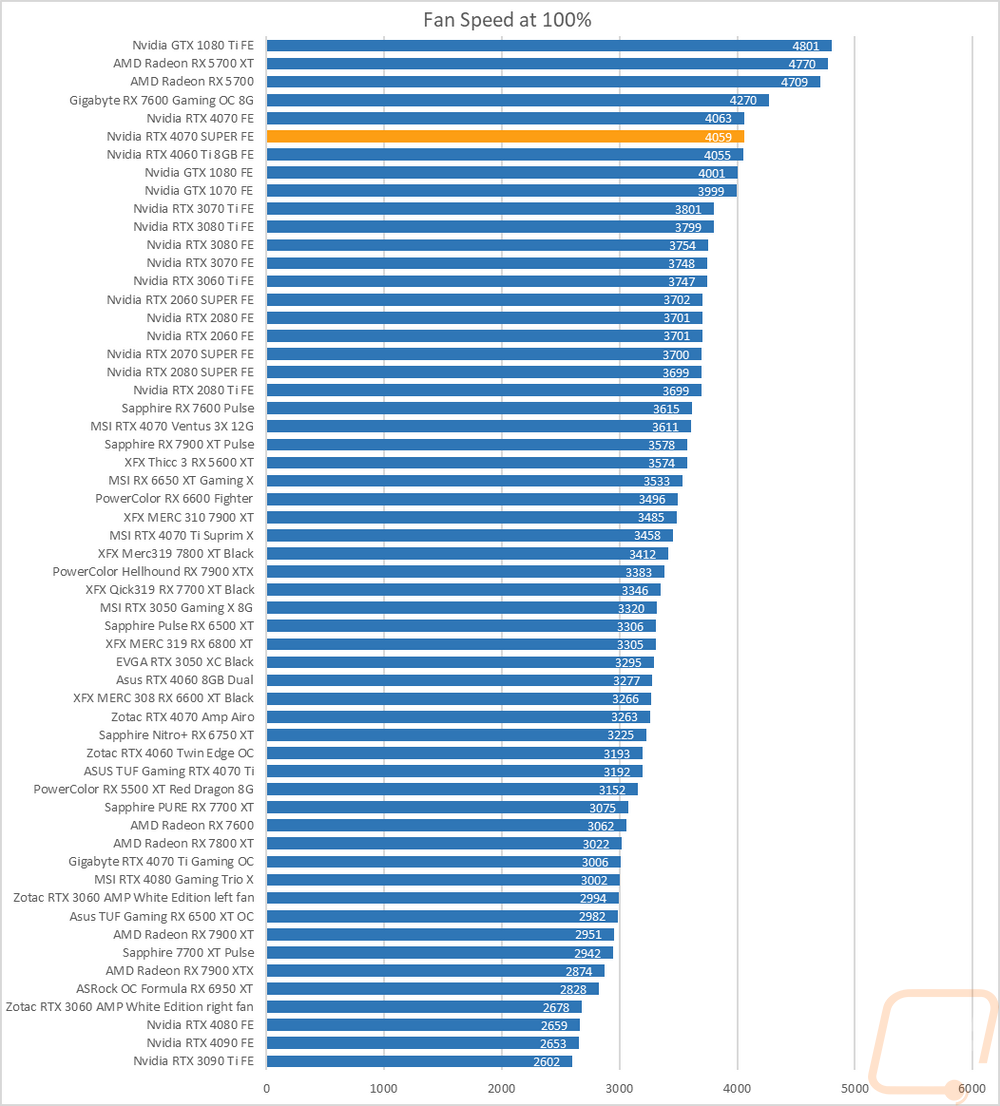
My next round of tests were looking at noise levels. These are especially important to me because I can’t stand to listen to my PC whirling. Especially when I’m not in game and other applications are using the GPU. For my testing, though I first tested with the fan cranked up to 100% to get an idea of how loud it can get, then again at 50% to get an idea of its range. The RTX 4070 SUPER Founders Edition runs at a blistering fast 4059 RPM when the fans are cranked up to 100% which puts it up near the top of the fan speed charts but surprisingly it is in the middle of the pack for 100% fan speed noise levels. It did even better when running at 50% fan speed with it down in the bottom 1/3 in that chart. The card also turns the fans off when under little to no load which helps keep things even quieter when out of game as well.
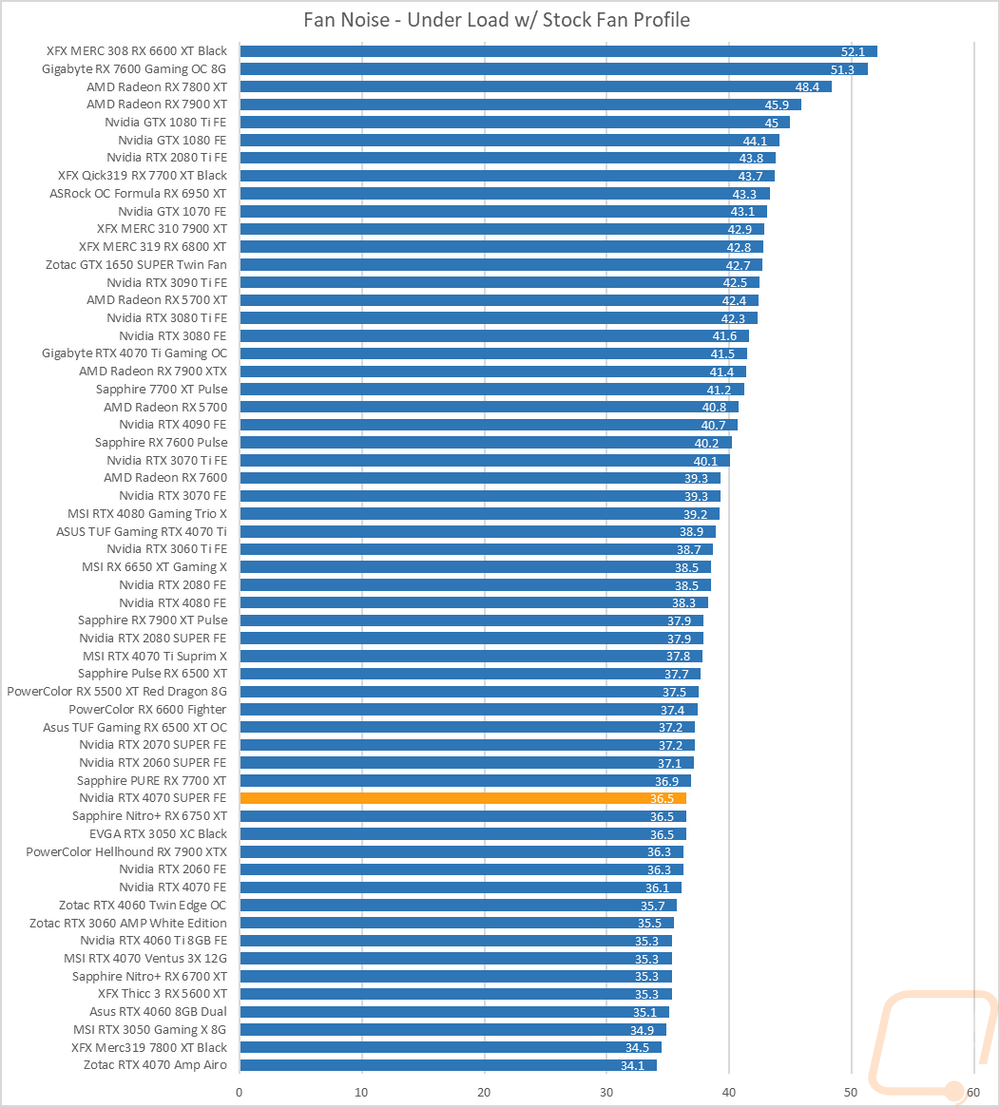
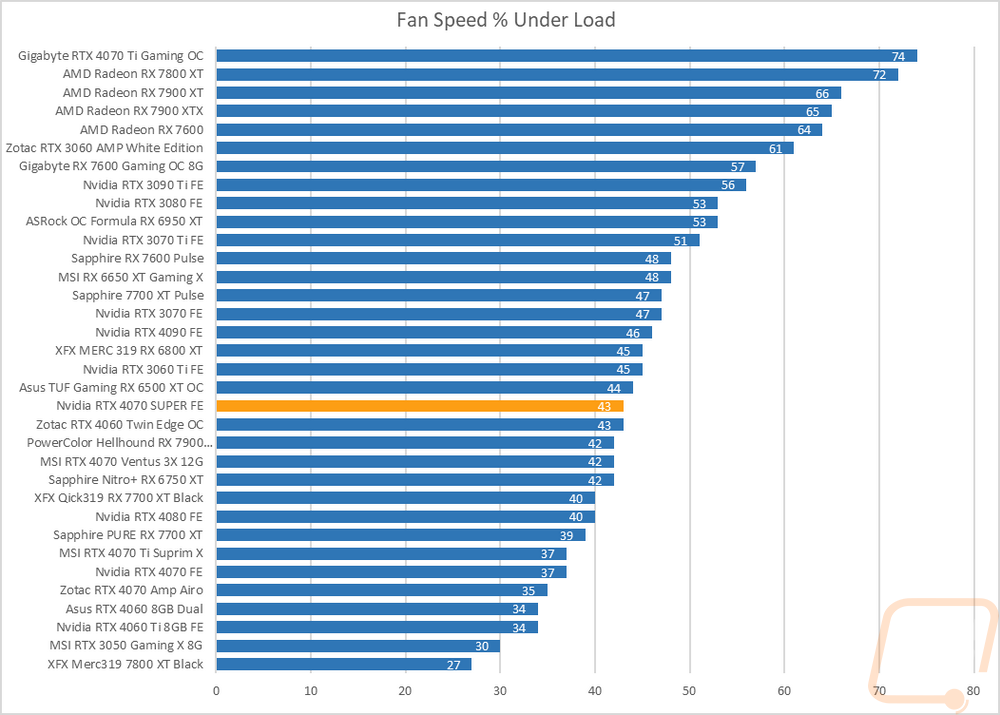
I also take a look at noise performance while under load. For that when running AIDA64’s stress test I wait until the temperature of the card has leveled off and then measure how loud things are when the card is at its worst-case scenario with the stock fan profile. Here the RTX 4070 SUPER Founders Edition came in at 36.5 db which put it in just barely in the bottom 1/3 of the chart but slightly louder than the original RTX 4070 which was at 36.1 db. Under load, the fans leveled out at 43% of their total speed which helps keep things running quiet.
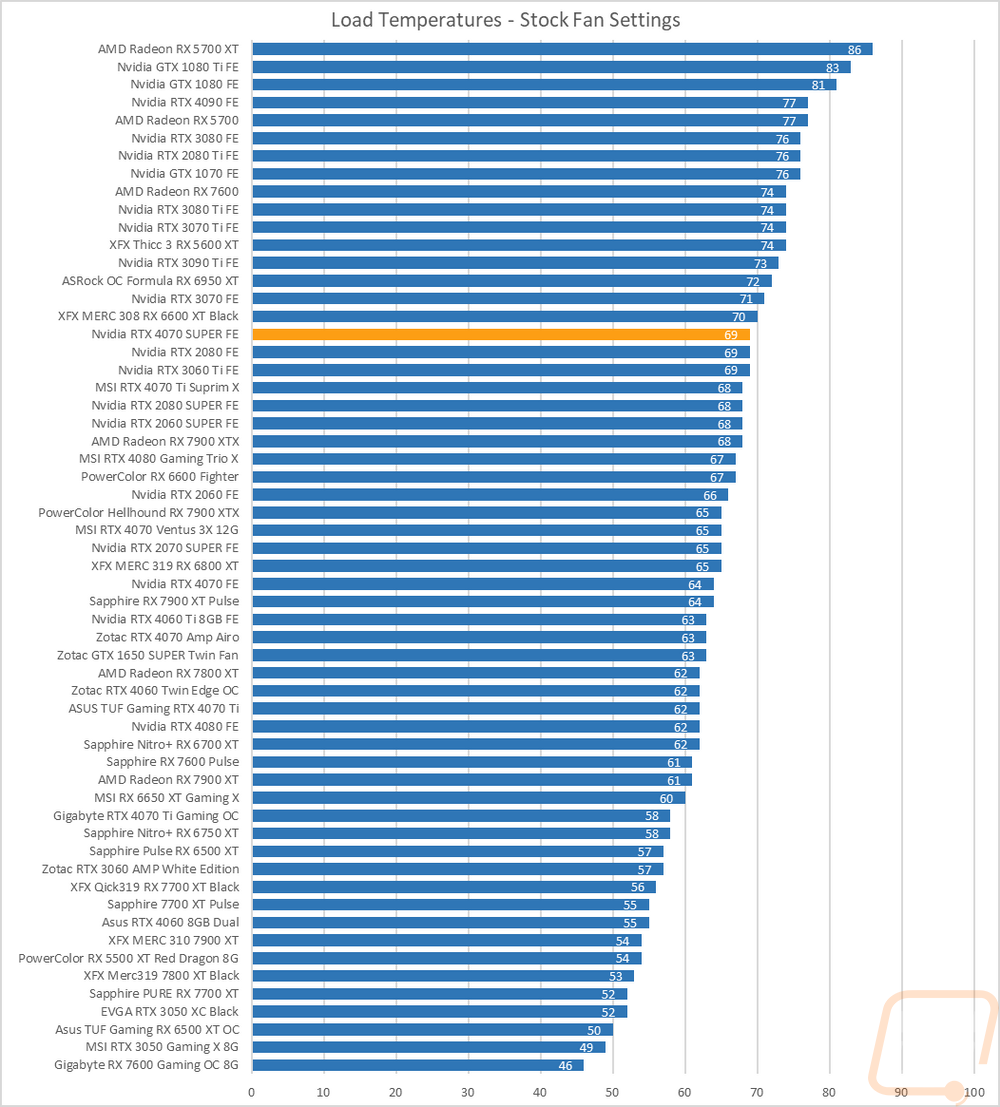
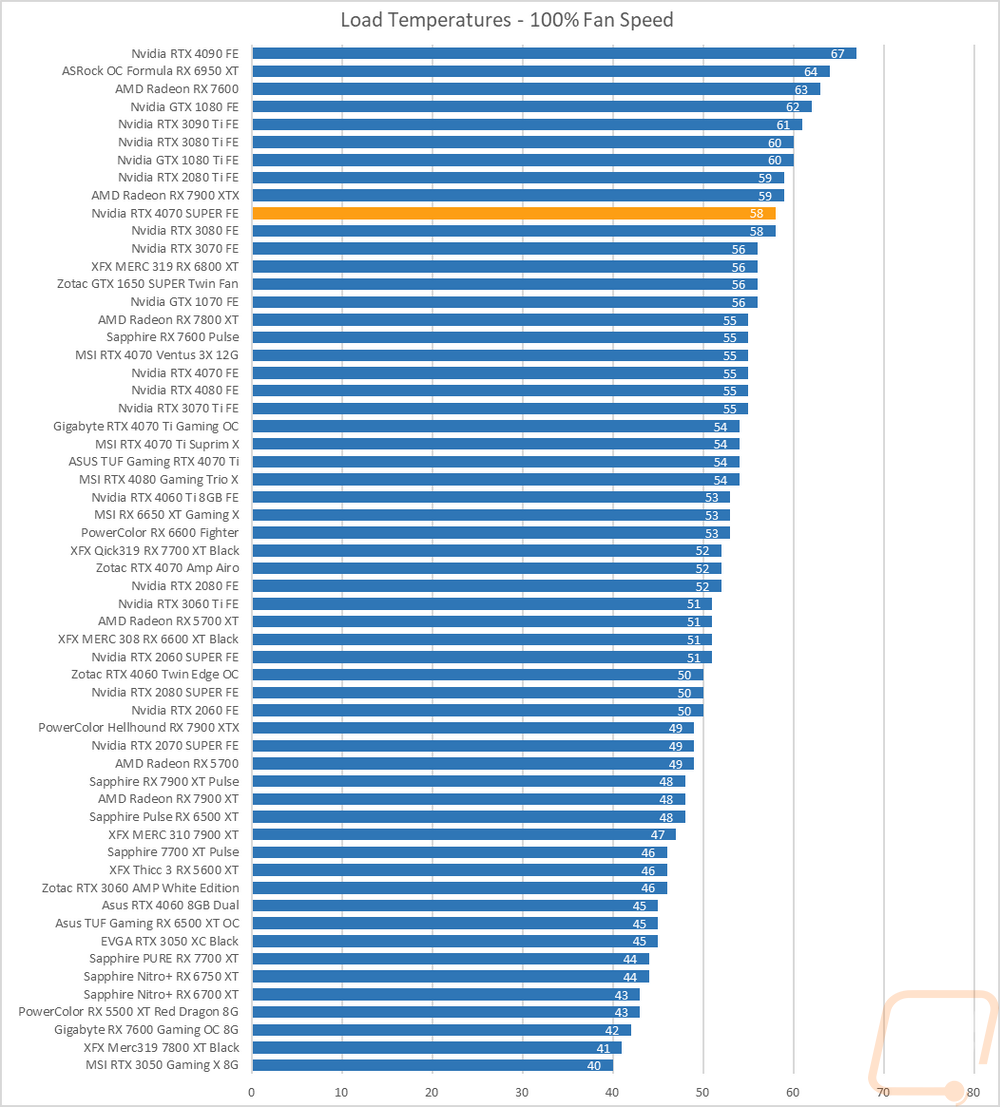
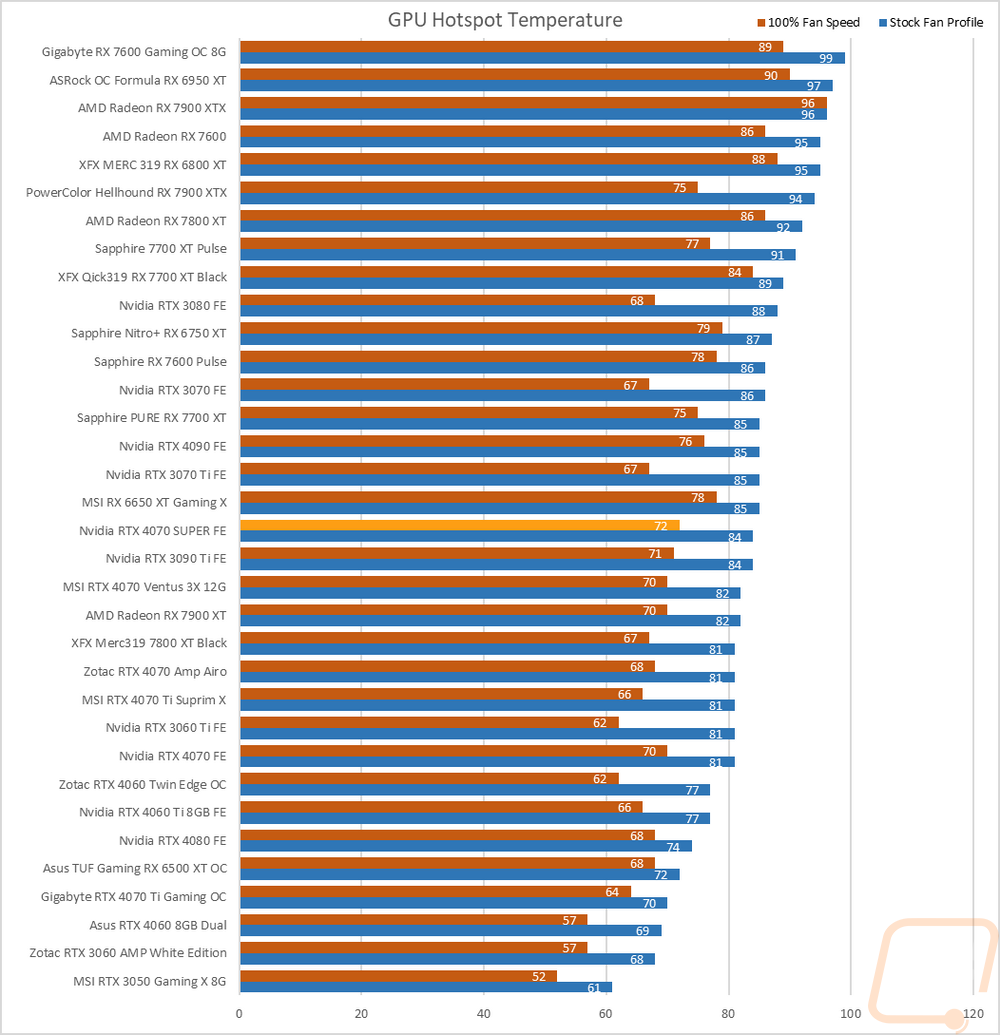
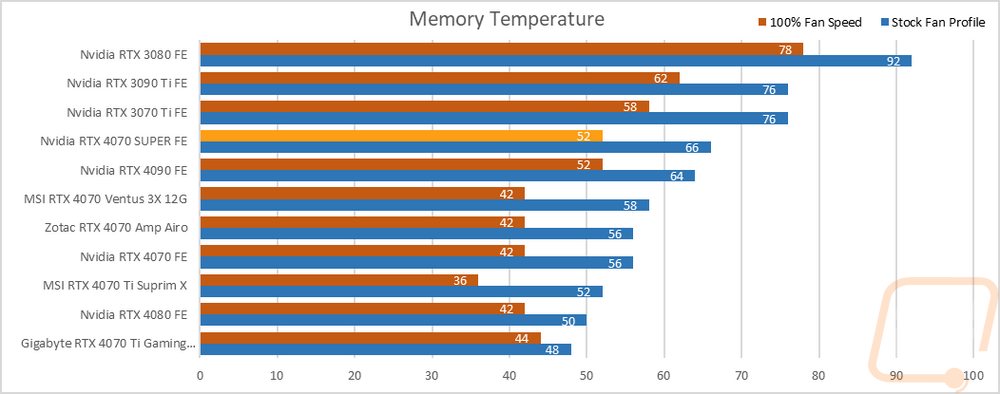
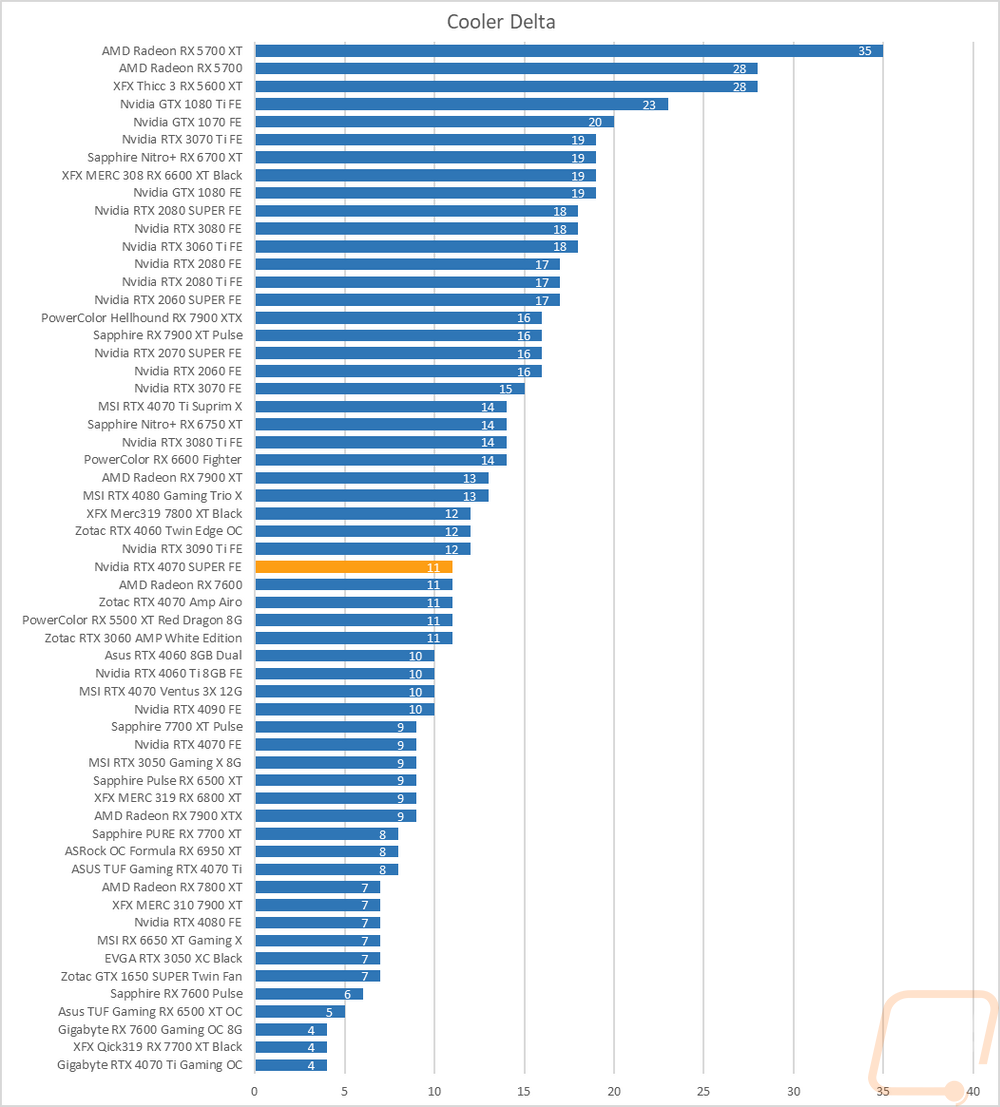
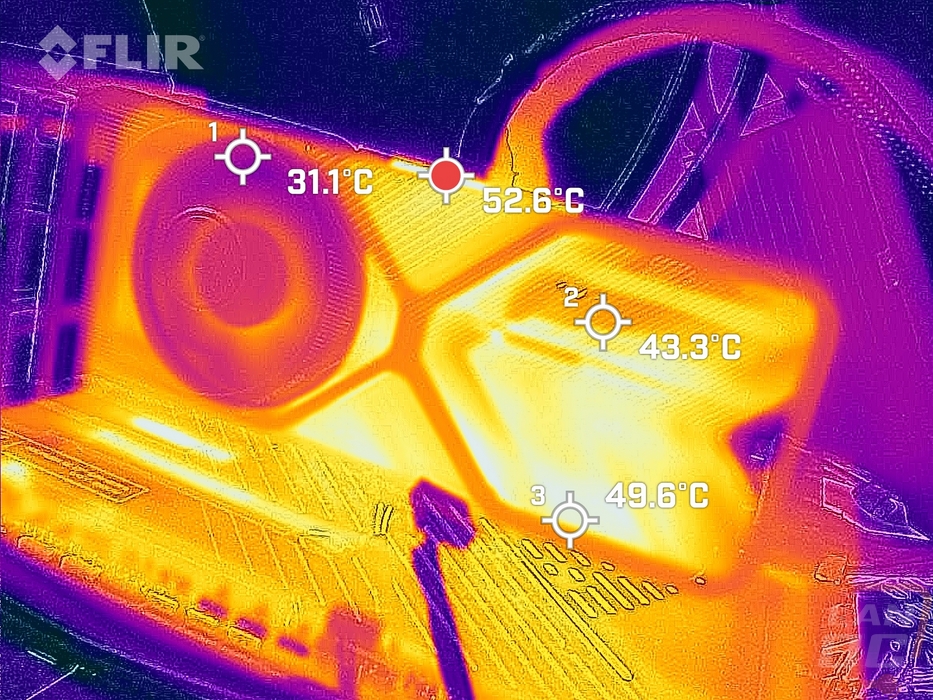
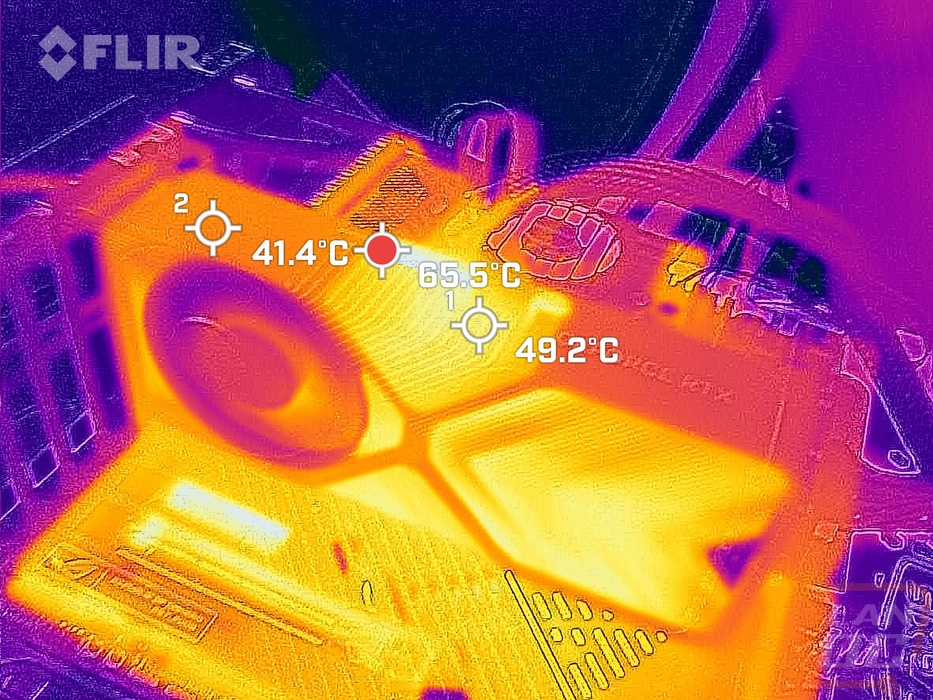
To finish up my testing I of course had to check out the cooling performance. To do this I ran two different tests. I used AIDA64’s Stress Test run for a half-hour each to warm things up. Then I documented what temperature the GPU leveled out at with the stock fan profile and then again with the fans cranked up to 100%. With the stock profile, the RTX 4070 SUPER Founders Edition got as hot as 69c which was 5c higher than the original RTX 4070 but still not too bad. The GPU hotspot was at 84c and memory temps were at 66c. Then with the fans cranked up, the RTX 4070 SUPER Founders Edition is a little higher up in the chart with its 58c result but that is 4c higher than the RTX 4070. The GPU hotspot was cooler at 72c and 52c for the memory temperatures. The delta between the two results was 11c which puts the card right in the middle of the pack and about what you would expect meaning there is still headroom left in the cooler if you plan on doing some small overclocking but Nvidia didn’t waste too much of the cooling even with the new card having the same cooler design as the original RTX 4070.
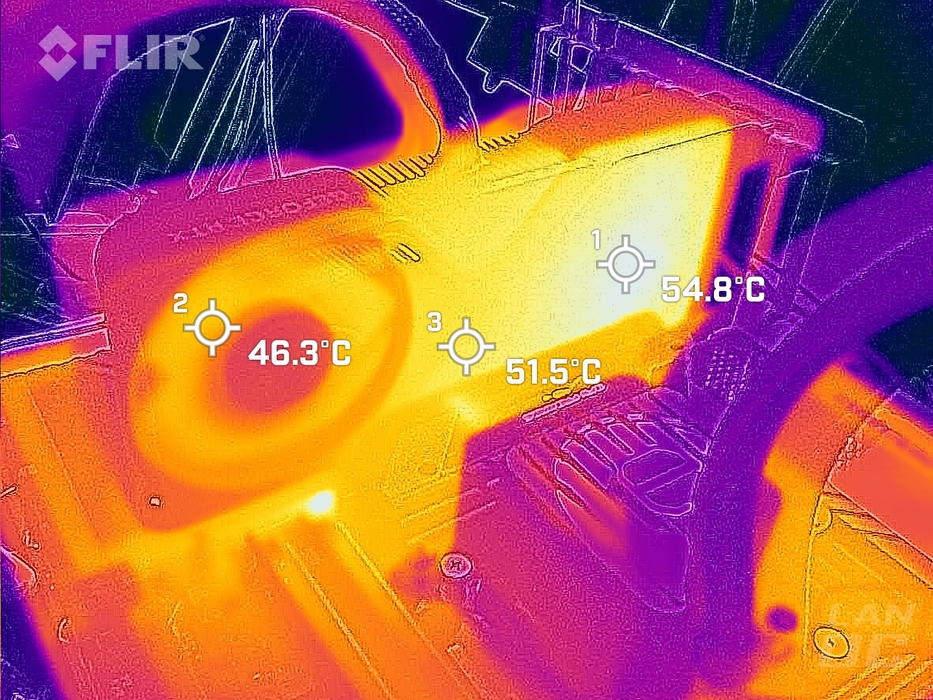
While running the stock fan profile testing I also took the time to get a few thermal images so we could see what is going on. On the left side of the card or the traditional fan side, you can see that the fan end on this side is running cool, there is a little bit of heat in the middle on the underside of the card but that is a normal hotspot that a lot of cards get. The blow-through area shows that it is doing work and with the thermal images, you can see the heatpipes running through there as well. The top edge of the card near the PCB is the hottest area of all of the sides, the small angled heatsink around that is warmer but then the wrap-around shroud doesn’t have any of that heat. Then on the backplate, the fan is warmer than the fan on the other side, this is because we are seeing the back side of the fan, the direction is it pulling air too. There is a warmer spot on the backplate but the temperature difference across the entire back plate is just 3c.
Overall and Final Verdict
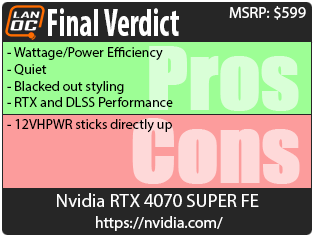
With our testing all out of the way, where does the Nvidia RTX 4070 SUPER Founders Edition fall? Aesthetically, Nvidia didn’t venture very far beyond what we saw with the rest of the 4000 Series. The RTX 4070 SUPER Founders Edition has the same quality construction with the all-metal cast aluminum design. The unique exposed heatsink design is still one of the best looking card designs as well. The only thing that changed for the Nvidia RTX 4070 SUPER Founders Edition is the new all blacked out design which looks great. Nvidia’s design also fits into a standard 2-slot configuration and doesn’t go up beyond normal PCI height as well. I wouldn’t consider it a compact card, but compared to just about any of the aftermarket cards in the last few generations it is small. The only complaint with the card design for me is having the power connection sticking straight up in the air in the middle of the card which looks out of place and also risks having the 12VHPWR connection strained.
As far as performance goes, the new RTX 4070 SUPER takes a nice step forward ahead of the original RTX 4070 by increasing the core count. This translated to a 10% improvement at 1440p in our testing and 15% at 4k with 1080p and 1440p running into some CPU limited situations. With just a 20-watt increase in power usage, this also moved the Nvidia RTX 4070 SUPER Founders Edition up higher in our performance to wattage charts as well. Gaming performance was especially effective once I got into RTX and DLSS testing which with DLSS and DLSS combined with Frame Generation you can see huge performance improvements even in situations where your game is CPU limited. The Nvidia RTX 4070 SUPER Founders Edition even did well in raster performance compared with AMD’s current generation RX 7800 XT but I will talk about that here in a second when we get into pricing. The Founders Edition cooler still kept things running relatively cool even with a little higher TGP and the under load noise performance had the card running surprisingly quiet.
So Nvidia has the Nvidia RTX 4070 SUPER Founders Edition starting at an MSRP of $599, this is the same price as the original RTX 4070 when it launched back in April of 2023. For an idea of where that puts it in the market, the RX 7800 XT from AMD can be found in the $500 to $580 range. The RTX 4070 is now $549, and the RTX 4070 Ti is in the $769 range. There are also a few RX 6800 XT options still available as well at $499. The RTX 4070 SUPER does outperform the RX 7800 XT and the RX 6800 XT, but you are going to pay more to get that performance. Adding ray tracing and DLSS performance into the mix helps add value as well which as long as the games that you plan on playing support it there is a lot of value to be had.

Live Pricing: HERE


