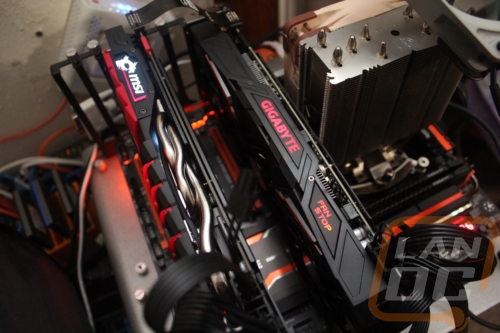
Well, I finally got my hands on two GTX 1070’s and you guys know what that means. As soon as I finished up writing about the second card, I jumped right into SLI testing. With the card availability being tough getting two matching cards might be tough, so before you do that I thought it would be good to see just how much you can benefit from running two cards. On top of that, I wanted to find out if you are better off getting a single GTX 1080 over the GTX 1070 pair. So I ran the cards through our normal benchmark suite. Unlike a card review, though, I jump right into the testing and for the most part I let the numbers speak for themselves. So hang on.
Product Names: MSI GTX 1070 Gaming X 8G and Gigabyte GTX 1070 G1 Gaming
Review Samples Provided by: MSI and Gigabyte
Written by: Wes
Testing by: Wes
Amazon Links: MSI GTX 1070 Gaming X 8G and Gigabyte GTX 1070 G1 Gaming
| MSI GTX 1070 Gaming X 8G Specifications | |
| Graphics Engine | NVIDIA GeForce® GTX 1070 |
| Bus Standard | PCI Express x16 3.0 |
| Memory Type | GDDR5 |
| Memory Size(MB) | 8192 |
| Memory Interface | 256-bit |
| Core Clock Speed(MHz) |
1797 MHz / 1607 MHz (OC Mode) 1771 MHz / 1582 MHz (Gaming Mode) 1683 MHz / 1506 MHz (Silent Mode) |
| Memory Clock Speed(MHz) | 8108 (OC Mode) |
| Maximum Displays | 4 |
| Power consumption (W) | 150 |
| Multi-GPU Technology | SLI, 2-Way |
| Recommended Power Supply (W) | 500 |
| HDCP Support | 2.2 |
| Output | DisplayPort x 3 (Version 1.4) / HDMI (Version 2.0) / DL-DVI-D |
| Virtual Reality Ready | Y |
| Digital Maximum Resolution | 7680 x 4320 |
| Power Connectors | 6-pin x 1, 8-pin x 1 |
| DirectX Version Support | 12 |
| OpenGL Version Support | 4.5 |
| Card Dimension(mm) | 279 x 140 x 42 mm |
| Gigabyte GTX 1070 G1 Gaming Specifications | |
| Graphics Processing | GeForce GTX 1070 |
| Core Clock |
Boost: 1822 MHz/ Base: 1620 MHz in OC Mode Boost: 1784 MHz/ Base: 1594 MHz in Gaming Mode |
| Memory Clock | 8008 MHz |
| Process Technology | 16 nm |
| Memory Size | 8 GB |
| Memory Bus | 256 bit |
| Card Bus | PCI-E 3.0 x 16 |
| Memory Type | GDDR5 |
| DirectX | 12 |
| OpenGL | 4.5 |
| PCB Form | ATX |
| Digital max resolution | 7680x4320 (requires 2*DP1.3 connectors) |
| Multi-view | 4 |
| Output |
Dual-link DVI-D *1 HDMI-2.0b*1 (Max Resolution: 4096x2160 @60 Hz) Display Port-1.4 *3 (Max Resolution: 7680x4320 @60 Hz) |
| Recommended PSU | 500W |
| Power Connectors | 8 pin*1 |
| Card size | H=41 L=280 W=114 mm |
Our Test Rig and Procedures
| Our Test Rig | ||
| CPU | Intel i7-5960X | Live Pricing |
| Memory | Kingston HyperX FURY Black 32GB Quad Channel Kit 2666 MHz | Live Pricing |
| Motherboard | Gigabyte X99-SOC Champion | Live Pricing |
| Cooling | Noctua NH-U12S Cooler | Live Pricing |
| Power Supply | Cooler Master V1000 Power Supply | Live Pricing |
| Storage | Kingston Hyper X Savage 960GB SSD | Live Pricing |
| Case | Dimastech Test Bench | Live Pricing |
| Our Testing Procedures | |
| 3DMark | The same goes for the most current version of 3DMark using the Fire Strike benchmark in normal, extreme, and ultra settings |
| Unigine Valley Benchmark 1.0 | Using the Extreme HD preset to get an average FPS |
| Catzilla 4k | Default tests for 1080p, 1440p, and 4k resolutions using the overall score for each as our result |
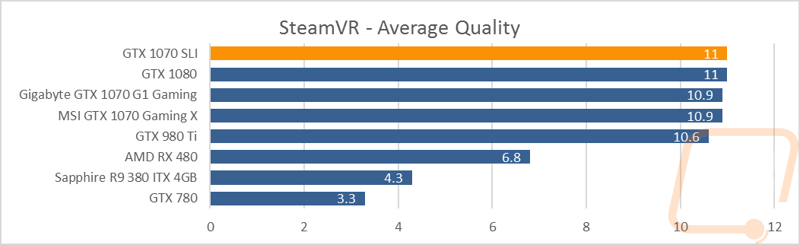
| SteamVR | Default SteamVR test using Average Quality score |
| HITMAN 2016 | Fullscreen with V-Sync turned off Detail, Texture Quality, Shadow Maps, and Shadow Resolution all set to their highest settings. We test using both DX11 and DX12 at both 1080p and 1440p resolutions. |
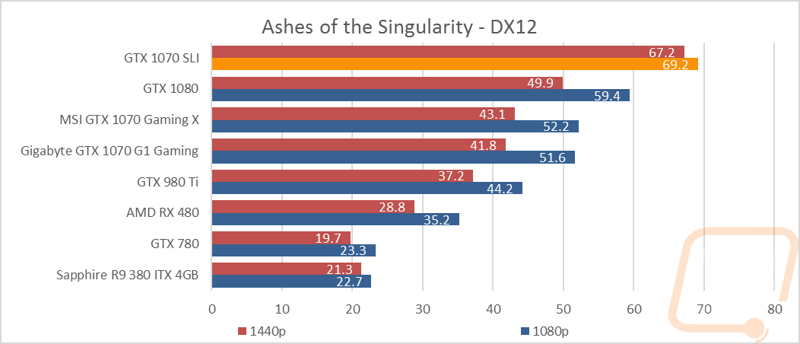
| Ashes of the Singularity | Built-in benchmark ran at 1080p and 1440p with graphics settings set to the “Crazy” setting with the exception of turning off V-Sync Mode. The benchmark scenario is set to GPU Focused and we use the Average Framerate for All Batches as the result. Tests are run both in DX11 and DX12 |
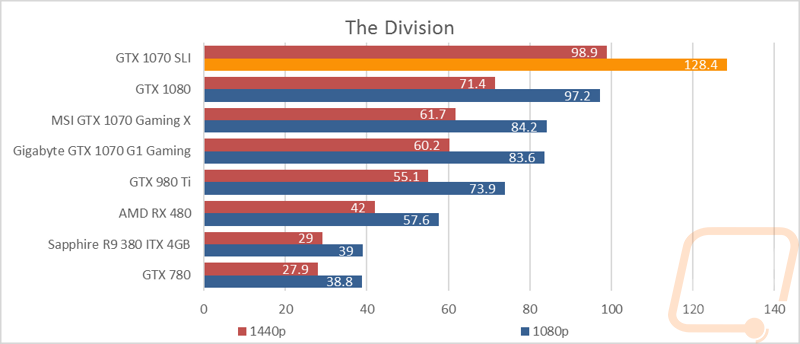
| The Division | Built-in benchmark ran at 1080p and 1440p with graphics settings set to the default “Ultra” setting with the exception of turning off V-Sync Mode |
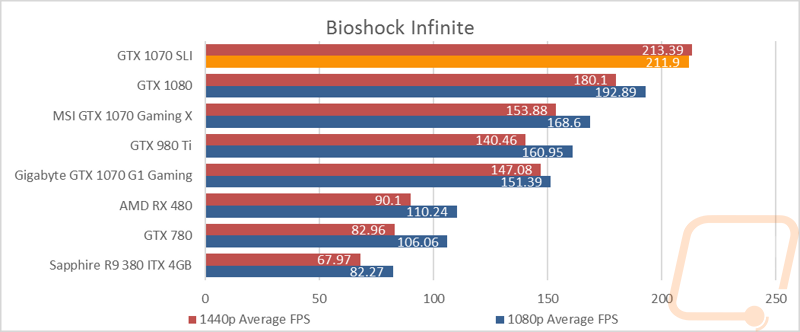
| Bioshock Infinite | Using the Adrenaline Action Benchmark Tool we run Bioshock Infinite on the “Xtreme” quality setting. This has a resolution of 1920x1080, FXAA turned on, Ultra Texture detail, 16x Aniso Texture Filtering, Ultra Dynamic Shadows, Normal Postprocessing, Light Shafts on, Ambient Occlusion set to ultra, and the Level of Detail set to Ultra as well. We also run this same test at 2560x1440 using the same settings as mentioned above. |
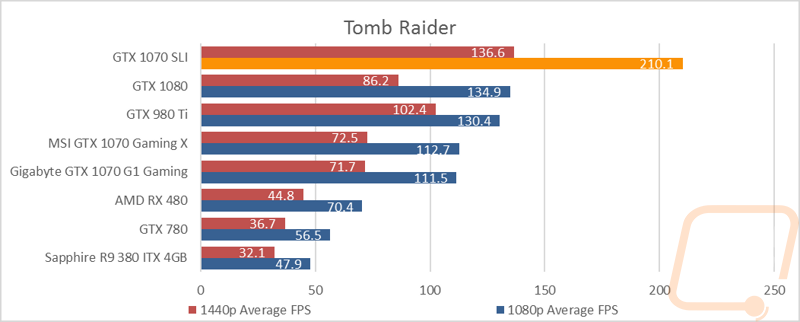
| Tomb Raider | Using the Adrenaline Action Benchmark Tool we run Tomb Raider on the “Xtreme” quality setting. This has a resolution of 1920x1080, Exclusive Fullscreen turned on, Anti-Aliasing set to 2xSSAA, Texture Quality set to Ultra, Texture Aniso set to 16x Aniso, Hair Quality set to TressFX, Shadow set to Normal, Shadow Resolution on High, Ultra SSAO, Ultra Depth of Field, High Reflection quality, Ultra LOD scale, Post-Processing On, High Precision RT turned on, and Tessellation is also turned on. We also run this same test at 2560x1440 using the same settings as mentioned above. |
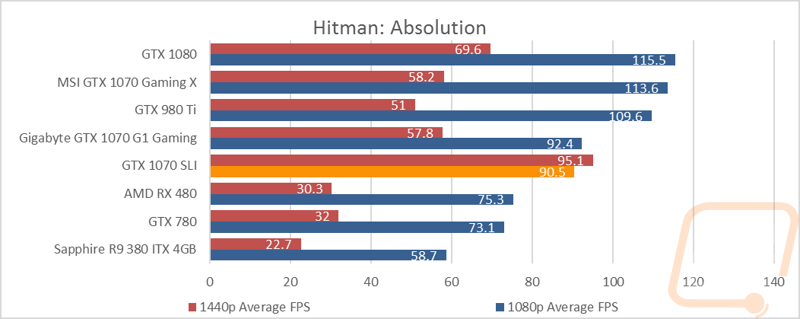
| Hitman: Absolution | Using the Adrenaline Action Benchmark Tool we run Hitman: Absolution on the “Xtreme” quality setting other than the MSAA setting is turned down from 8x to 2x. That setting puts the resolution at 1920x1080, MSAA is set to 2x, Texture Quality is set to High, Texture Aniso is set to 16x, Shadows are on Ultra, SSA is set to high, Global Illumination is turned on, Reflections are set to High, FXAA is on, Level of Detail is set to Ultra, Depth of Field is high, Tessellation is turned on, and Bloom is set to normal. We also run this same test at 2560x1440 using the same settings as mentioned above, except on the “high” setting. |
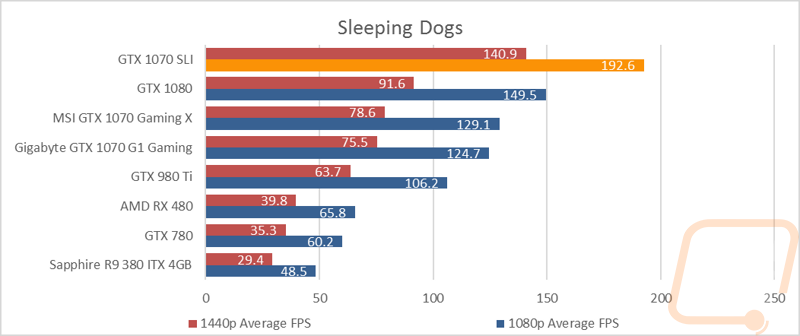
| Sleeping Dogs | Using the Adrenaline Action Benchmark Tool we run Sleeping Dogs on the “Xtreme” quality setting. That means our resolution is set to 1920x1080, Anti-Aliasing is set to Extreme, Texture Quality is set to High-Res, Shadow Quality is High, Shadow Filter is set to high, SSAO is set to High, Motion Blur Level is set to High, and World Density is set to Extreme. We also run this same test at 2560x1440 using the same settings as mentioned above. |
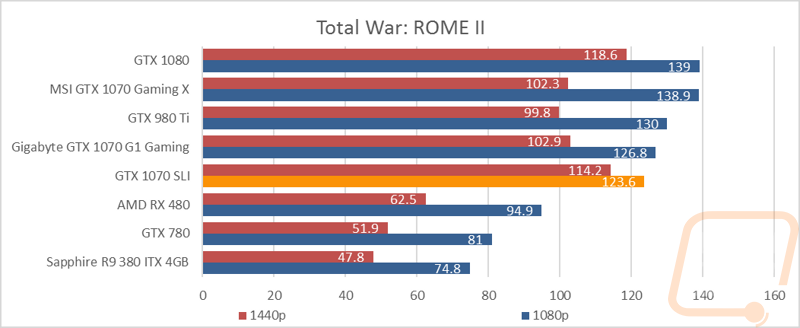
| Total War: ROME II | Ultra-setting tested at 1920x1080 and 2560x1440, built in forest benchmark |
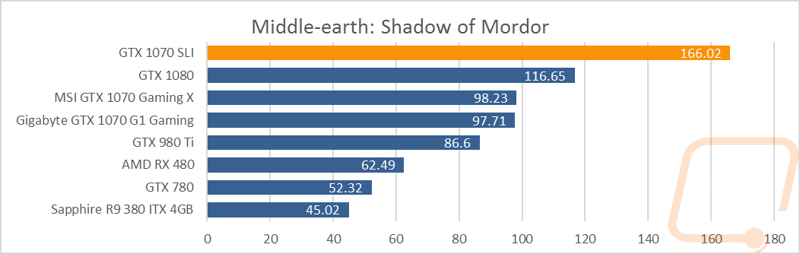
| Middle-earth: Shadow of Mordor | Using the built-in benchmark we test with ultra settings at 1440p |
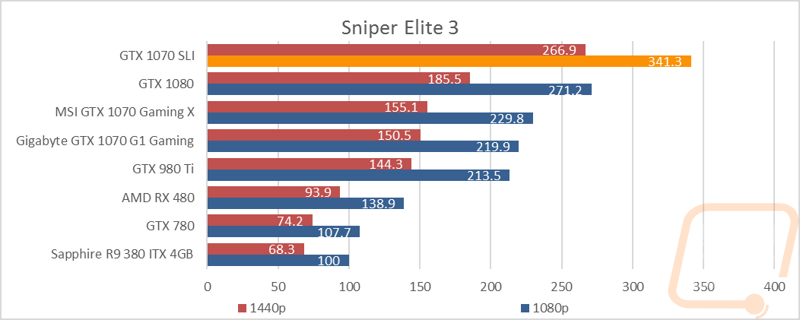
| Sniper Elite 3 | Ultra-setting tested at 1920x1080 and 2560x1440, built in benchmark |
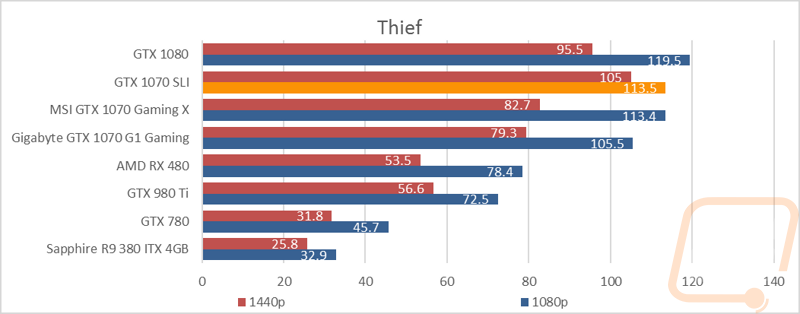
| Thief | Tested using the “Very High” setting at 1920x1080 and 2560x1440 |
| Folding at Home 2.2 | Using the Folding at Home benchmark 2.2.5 set to OpenCL, WU set to dhfr, and run length set to the default 60 seconds. We test at both double and single precision and use the score at the result |
| CompuBenchCL | Video Composition and Bitcoin tests |
| Unigine Valley Benchmark 1.0 heat testing | We run through Unigine Valley using the “Extreme” preset for 30 minutes to test in game cooling performance with the fan speed set to auto then again with the fan set to 100%. |
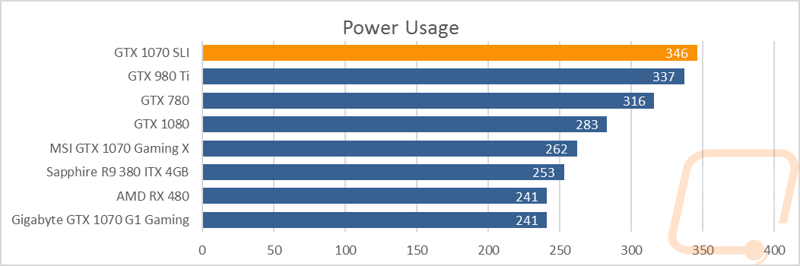
| Power Usage | Using Unreal Valley Benchmark 1.0, we get our “load” power usage number from the peak power usage during our test. We get our numbers from a Kill-A-Watt connected to the test benches power cord. |
| Noise Testing | Our Noise testing is done using a decibel meter 3 inches away from the video card on the bottom/fan side of the card. We test an idle noise level and then to get an idea of how loud the card will get if it warms all the way up we also turn the fan speed up to 50% and 100% and test both speeds as well. The 100% test isn’t a representation of typical in-game noise levels, but it will show you how loud a card can be if you run it at its highest setting or if it gets very hot. |
Benchmarks
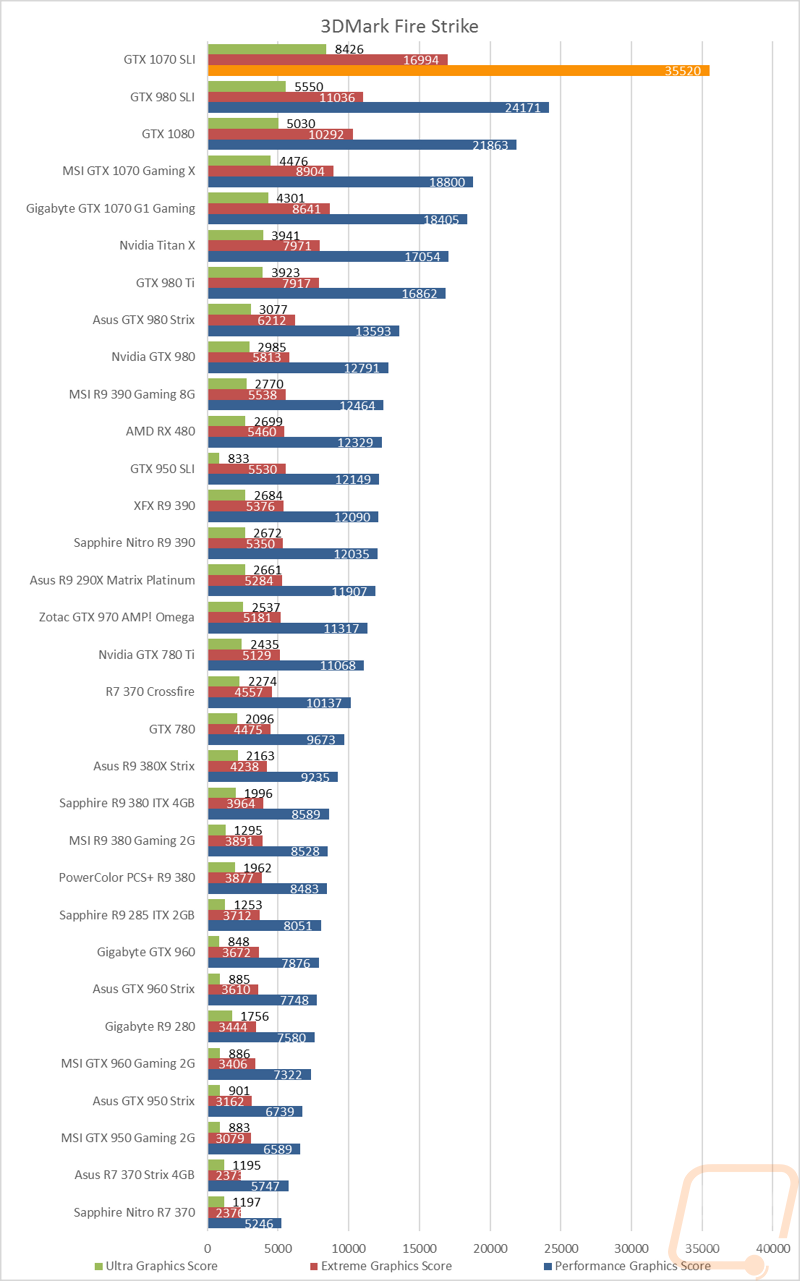
Like I said in the opening, with SLI testing I don’t really go into detail with most of the results. That said I did want to address a few things. Unlike in the past, I didn’t include any SLI results where it was obvious that SLI wasn’t supported. I may regret this one and read the results in the future but my concern was that when I compare those results in the near future to other cards I didn’t want it to be confusing (aka lower performing cards looking faster than they are when you see a broken SLI result below it). That said here are the games and programs that didn’t support SLI or in some cases, SLI gave slower results than a single card.
-Unigine’s Valley Benchmark 1.0 supported SLI in the past, but with the GTX 1070’s it actually performed slower than a single card
-Catzilla 4k wouldn’t even open up at all when I had SLI turned on. I’m unsure if this was an SLI issue or a Catzilla issue, but I tried reinstalling drivers and the program as well. One time I thought I got it to work but it turned out I forgot to turn SLI back on.
-Hitman 2016 was slower in SLI than a single card in both DX11 and DX12
-None of the cooling or Comupte tests applied in SLI as well
-The weirdest of all of my tests was Ashes of the Singularity. In DX11, SLI was exactly the same as a single card. When testing DX12 I did see a performance increase with SLI turned on when also running the DX12 Multiple GPU setting to 62.0 FPS in 1080p and 45.7 FPS in 1440p. But turning off SLI and running the same setting yielded much better results as you will see in the graphs below.
Power Usage and Final Thoughts
If you didn’t look at any of the benchmarks on the previous page, a quick look back at least at the 3DMark results of the GTX 1070’s in SLI should be a good indication of what you missed. The two overclocked GTX 1070’s stomped everything I have tested previously, especially in the 1080p and 1440p testing. So I was especially curious where it would fall in our power testing. The 1070’s only have a TDP of 150 watts, similar to the recently introduced RX 480. Paired up they did top our refreshed chart with a peak of 346 watts but if you look, the two cards actually come in very close to the GTX 980 Ti and not far from the older GTX 780 as well. I was a little concerned that the issues I had with Valley Benchmark in performance testing also caused problems here as well, but even though the results weren’t very good both cards were under load when I checked. Another good indication is that this result is about 100 watts more than a single GTX 1070. All in all the 1070’s aren’t going to need a monster power supply, but you are going to put down crazy numbers.
So is going SLI on a pair of GTX 1070’s a good decision? Well, there is no doubt that pairing two GTX 1070’s up is going to perform really well, well above the performance of a single GTX 1080, especially in 3DMark. Currently, the cheapest you can pick up a GTX 1070 for on Newegg is $430, so you would be looking at $860 plus taxes and shipping to double up. Most of our in-game performance numbers with the GTX 1070’s in SLI though aren’t really reaching that level of performance. A single GTX 1080 is going to get you very close in game and leave you open for the SLI upgrade in the future when card prices go down.
That said I do think that GTX 1070’s in SLI is a good option for people who are currently running 1440p but plan on going to an ultrawide, 4k, or multi-monitor configuration down the line. In that situation, you can save money now but you won’t have to sell off your card in the future. Plus, I’m sure the GTX 1070 will be cheaper at that point as well.
TLDR: If you are running 1440p or 1080p stick with a single GTX 1070, if you are running 4k or an ultrawide go with a single GTX 1080. If you pick up a single GTX 1070 now and move to the higher resolutions in the future you can pick up a second GTX 1070 at a cheaper price and play anything.


