Performance
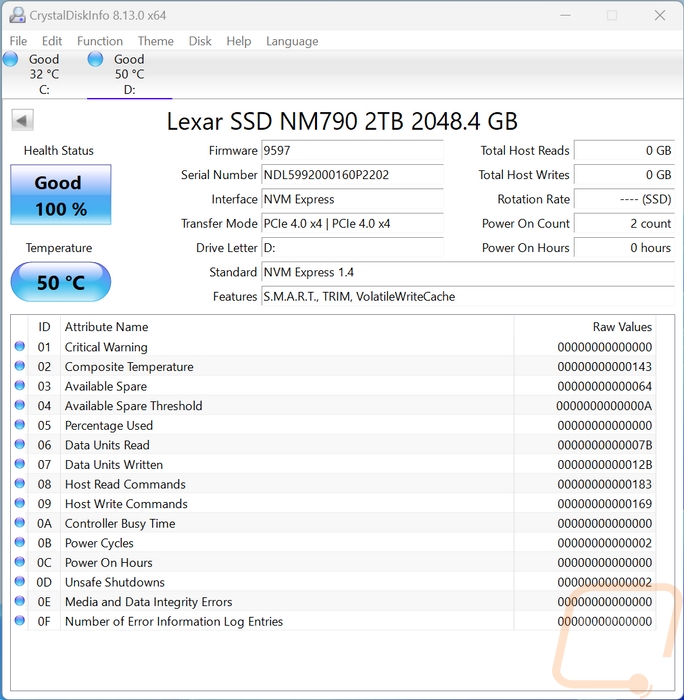
Before getting into testing the Lexar NM790 I did check the drive out using CrystalDiskInfo just to confirm that it was connected using the correct interface. It was connected at PCIe 4.0 x4 so we are good there. I also like to do this to document the firmware revision we are running on for testing because those do change from time to time as well.
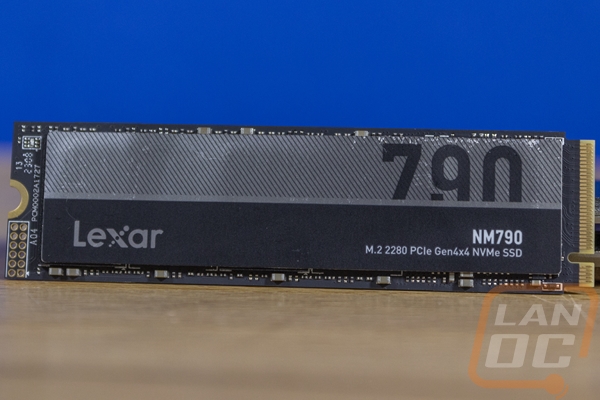
My first round of testing was to run the Lexar NM790 through Crystal Disk Mark 8. Sequential testing is usually a best-case scenario and is what companies use for their specifications and on the front of the box to advertise drive speeds which in the case of the Lexar NM790 the box has a general “up to 7400 MB/s read speed listed but the specifications break things down more with 7400 MBs read speed and 6500 MB/s write speed on the 1T, 2TB, and 4TB models but slower 7200 MB/s read speed and 4400 MB/s write speed for the 512GB model. The Lexar NM790 didn’t completely reach the 7400MB/s speeds in my read test but it wasn’t far off at 7188 MB/s read speed. Write speeds on the other hand surpassed the listed speed of 6500 MB/s with 6636 MB/s.
|
PCIe 3.0 |
PCIe 4.0 |
PCIe 5.0 |
||
|
Crystal Disk Mark 8 - Read |
SEQ1M Q8T1 |
SEQ128K Q32T1 |
RND4K Q32T16 |
RND4K Q1T1 |
|
WD Blue SN550 1TB |
2444.53 |
2077.36 |
1075.88 |
57.88 |
|
Sabrent Rocket Q4 2TB |
4939.59 |
2871.47 |
1034.52 |
74.53 |
|
Corsair MP400 1TB |
3432.77 |
1889.56 |
713.28 |
61.42 |
|
Corsair Force MP600 2TB |
4828 |
1543.31 |
901.83 |
41.49 |
|
Sabrent Rocket 4.0 Plus 1TB |
6468.33 |
2712.53 |
455.24 |
54.68 |
|
Crucial P5 Plus 1TB |
6697.19 |
4358.63 |
1113.7 |
69.76 |
|
Kingston FURY Renegade 2TB |
6592.75 |
3093.11 |
1085.23 |
55.14 |
|
Patriot P400 1TB |
5036.9 |
3518.47 |
1059.71 |
88.06 |
|
WD Blue SN570 1TB |
3569.34 |
2681.32 |
1046.46 |
65.75 |
|
WD Black SN770 1TB |
5223.32 |
4958.17 |
1034.35 |
82.24 |
|
MSI Spatium M480 Play 2TB |
6979.03 |
4267.59 |
1315.25 |
81.22 |
|
Viper Gaming VPR400 |
5163.46 |
3880.75 |
1030.81 |
85.35 |
|
Crucial P3 Plus 2TB |
5041.44 |
2799.96 |
1107.97 |
56.56 |
|
Crucial P3 2TB |
3511.18 |
2379.76 |
957.63 |
45.42 |
|
Fantom Drives Venom8 2TB |
6989.96 |
4216.08 |
1086.16 |
79.59 |
|
Lexar Professional NM800 Pro 2TB |
7155.05 |
3479.95 |
781.64 |
84.56 |
|
Crucial T700 2TB |
12399.57 |
9265.64 |
826.54 |
98.49 |
|
Lexar NM710 1TB |
5101.53 |
4683.79 |
839.35 |
72.24 |
|
Crucial P5 Plus 1TB W/Heatsink |
6699.11 |
4267.73 |
826.71 |
68.33 |
|
Lexar NM790 2TB |
7188.21 |
5214.37 |
820.62 |
81.36 |
|
PCIe 3.0 |
PCIe 4.0 |
PCIe 5.0 |
||
|
Crystal Disk Mark 8 - Write |
SEQ1M Q8T1 |
SEQ128K Q32T1 |
RND4K Q32T16 |
RND4K Q1T1 |
|
WD Blue SN550 1TB |
2007.63 |
2006.4 |
776.4 |
290.25 |
|
Sabrent Rocket Q4 2TB |
3633.71 |
2568.7 |
920.84 |
385.73 |
|
Corsair MP400 1TB |
2021.09 |
2017.63 |
1196.42 |
262.36 |
|
Corsair Force MP600 2TB |
992.38 |
982.78 |
996.22 |
276.26 |
|
Sabrent Rocket 4.0 Plus 1TB |
5241.89 |
5225.25 |
921.51 |
402.26 |
|
Crucial P5 Plus 1TB |
5025.83 |
4880.38 |
884.12 |
240.78 |
|
Kingston FURY Renegade 2TB |
6899.76 |
5831.06 |
1083.12 |
367.6 |
|
Patriot P400 1TB |
4830.94 |
4813.27 |
846.34 |
307.12 |
|
WD Blue SN570 1TB |
3147.13 |
2893.72 |
909.47 |
234.17 |
|
WD Black SN770 1TB |
4983.07 |
4980.59 |
1149.36 |
295.13 |
|
MSI Spatium M480 Play 2TB |
6870.73 |
5863.14 |
1062.32 |
357.02 |
|
Viper Gaming VPR400 |
4780.82 |
4775.74 |
838 |
285.02 |
|
Crucial P3 Plus 2TB |
4388.26 |
4387.54 |
989.42 |
2967.35 |
|
Crucial P3 2TB |
3244.52 |
2712.72 |
630.77 |
261.09 |
|
Fantom Drives Venom8 2TB |
4132.6 |
5850.19 |
844.52 |
315.7 |
|
Lexar Professional NM800 Pro 2TB |
6629.2 |
5645.52 |
589.6 |
274.14 |
|
Crucial T700 2TB |
11692.96 |
9500.07 |
710.93 |
363.19 |
|
Lexar NM710 1TB |
4447.81 |
2640.5 |
686.8 |
283.91 |
|
Crucial P5 Plus 1TB W/Heatsink |
5041.15 |
4906.1 |
747.39 |
204.11 |
|
Lexar NM790 2TB |
6636.51 |
5415.95 |
685.5 |
291.28 |
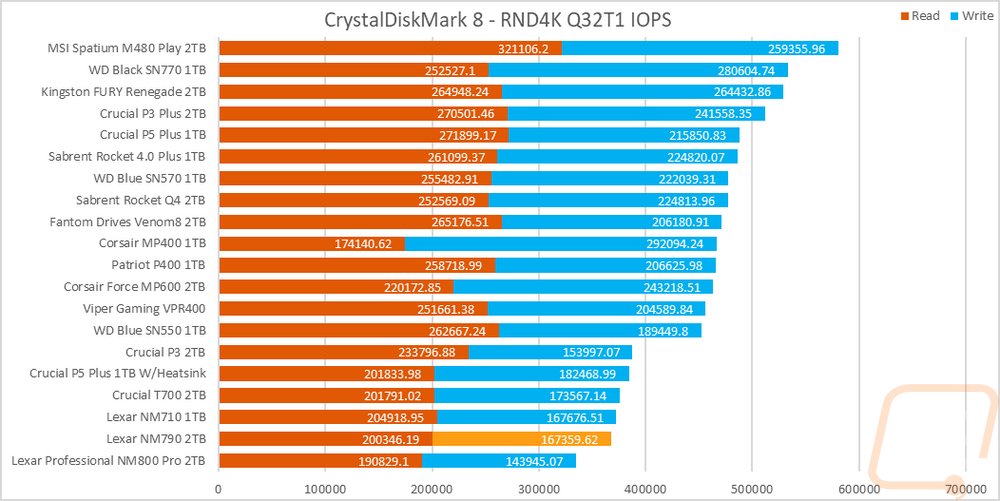
While testing in CrystalDiskMark 8 I did also check out the drive’s IOPS performance with the random 4k queue depth of 32 and 1 thread results. I stacked the read and write performance together here because I do believe that the overall drive performance is important, not just one result or the other. The Lexar NM790 came in down near the bottom of our chart here with the rear IOPS being in the middle of the pack but the write IOPS being lower than most.
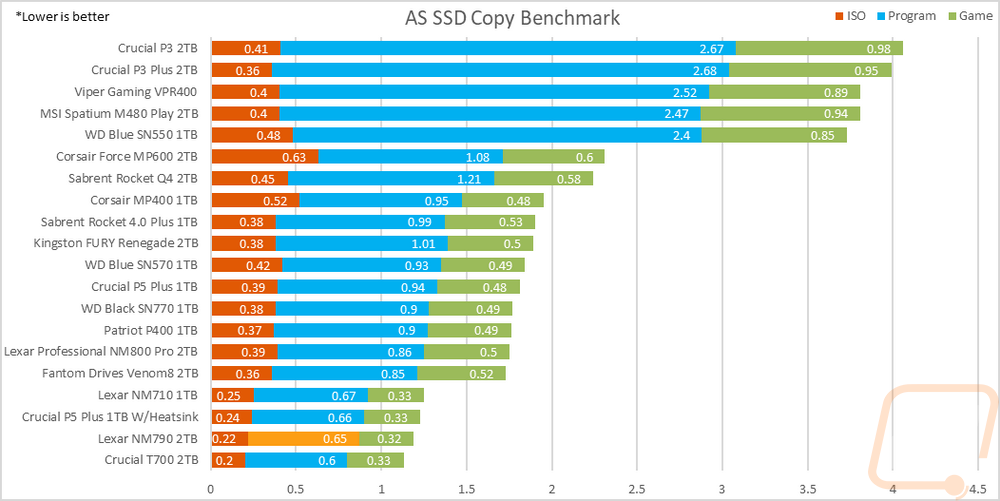
In AS SSD, I skipped over the standard test because it is very similar to the CrystalDiskMark tests I prefer to check out one of its sub-tests, the copy benchmark. This moves three files, one that is an ISO, one that is a program, and then a game, and times how long each takes. With these being timed, lower is better here. I have all three results stacked to see which drives are best overall. The Lexar NM790 did extremely well here with just the PCIe 5.0 drive being faster. It was faster than any of the other PCIe 4.0 drives tested in all three results.
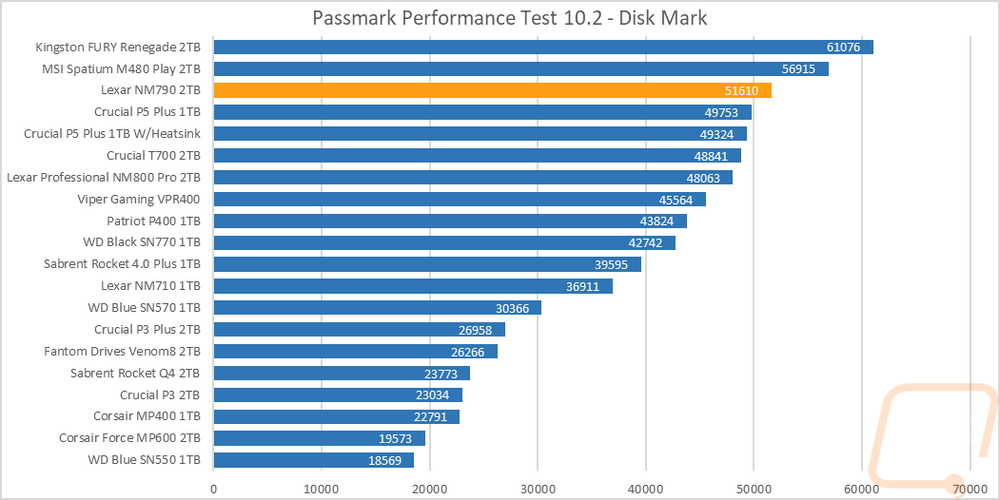
Next up with PassMark Performance Test 10, I ran their combined synthetic benchmark to get a look at their DiskMark rating. The Lexar NM790 is up at the top of this chart as well with just the FURY Renegade and the M480 Play scoring better.
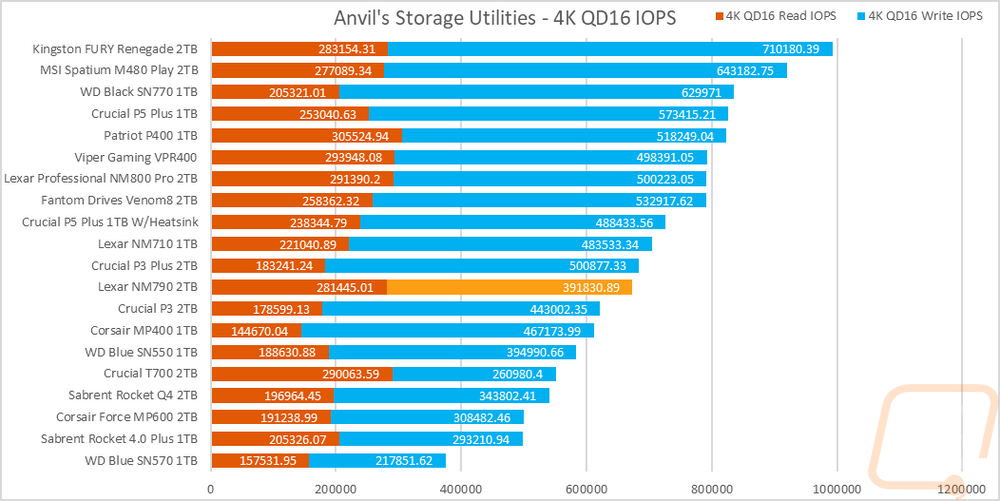
I then changed my focus back over to IOPS performance and ran the NM710 in Anvil’s Storage Benchmark focusing on the 4k queue depth of 16 results from the main test. The Lexar NM790 did well with the read IOPS in Anvil’s but once again the write IOPS was holding it back. But this time around it is closer to the middle of the pack when the two results are combined.
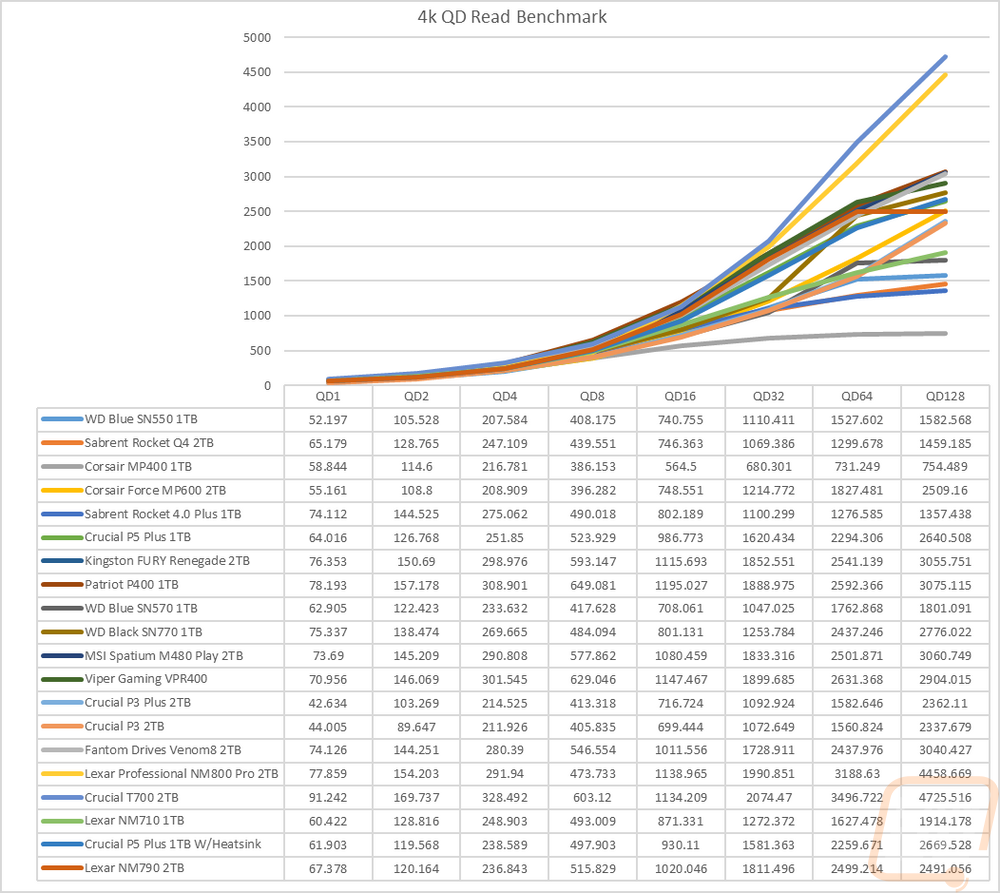
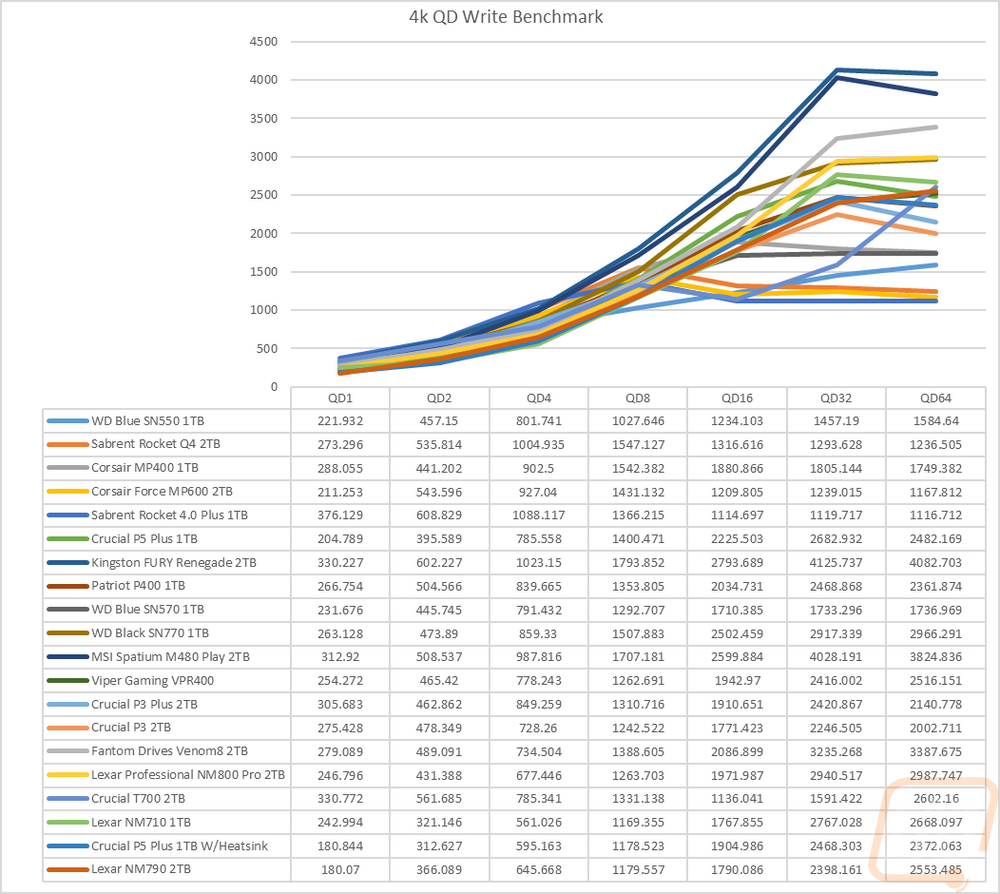
Sticking with Anvil’s Storage Utilities I did a few more tests. Here I wanted to check out how the drive would react to different queue depths so with the file size set to 4K I ran tests ramping up double each time starting at 1 and up to 128 for reads and 64 for writes. This lets us see if the controller gets overloaded. For the read, queue depth tests the Lexar NM790 is in the middle of the pack up through a queue depth of 8. From there it does ramp up staying right in the middle with a few of the faster drives but when it hit a queue depth of 64 it dropped off and went down in performance for the final 128 queue depth test. The write queue depth test on the other hand the Lexar NM790 starts off performing lower than nearly everything else and stays there until a queue depth of 8. It ramps up from there some but the performance gain drops off for the final test and it finishes in the idle of the pack.
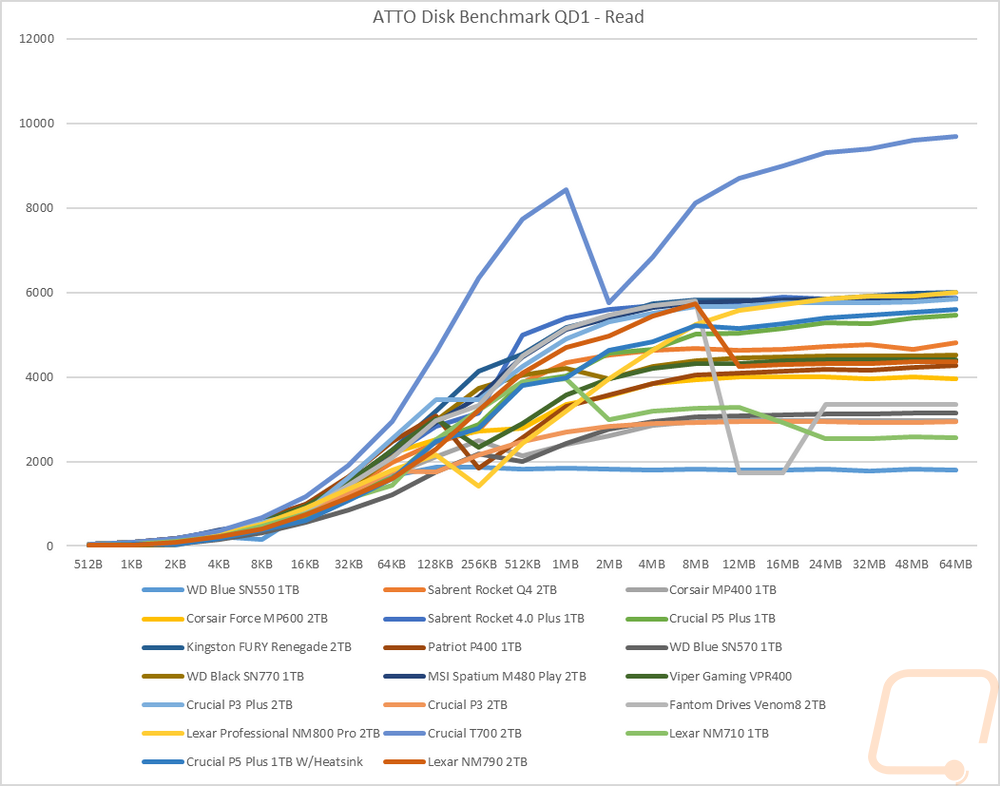
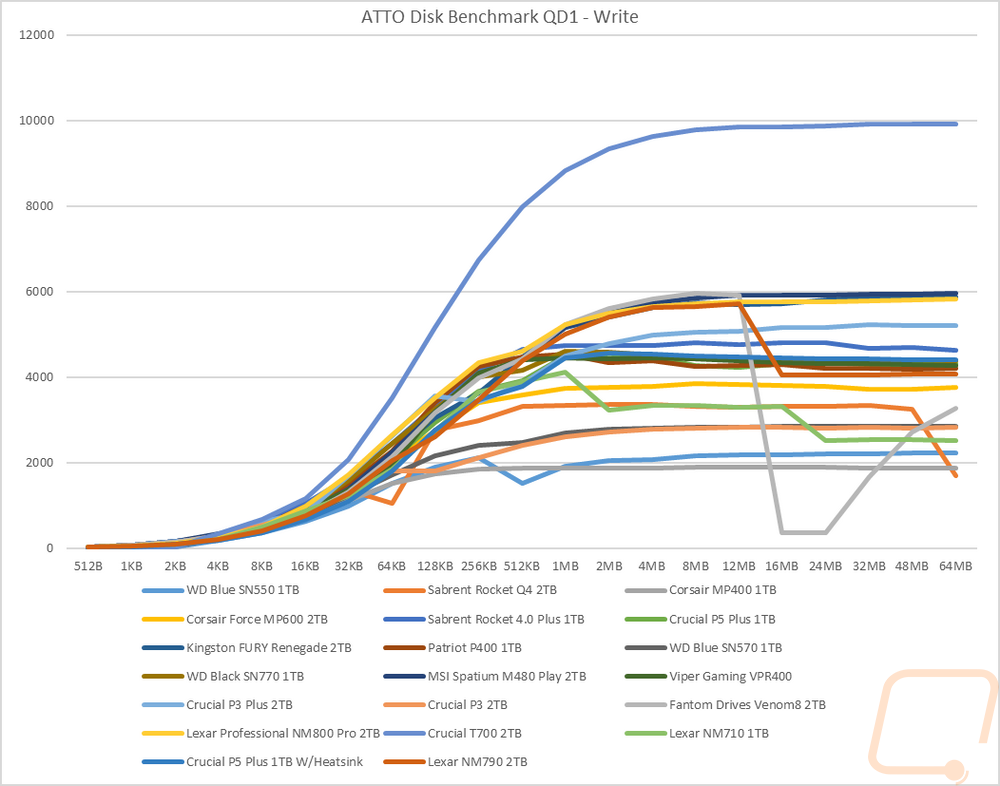
For ATTO Benchmark I set it to a queue depth of just 1 but ramped up the file size slowly to see how it would affect performance. For the read test in ATTO, the Lexar NM790 performs similarly to what we saw in the Anvil test with it running in the middle of the pack and then ramping up at 65KB and larger file sizes. It was doing really well but at the 8MB test, it drops from the being right with the fast PCIe 4.0 drives down into the middle of the chart from there on. This is where the DRAMless design falls behind, you can see a few other drives perform similarly in that same area. The write performance was nearly the same, middle of the pack until it started to ramp up at 32KB and above. The Lexar NM790 runs with the fast drives until the 12MB test where it drops from almost 6000 MB/s down to 4000 MB/s and stays there the rest of the way.
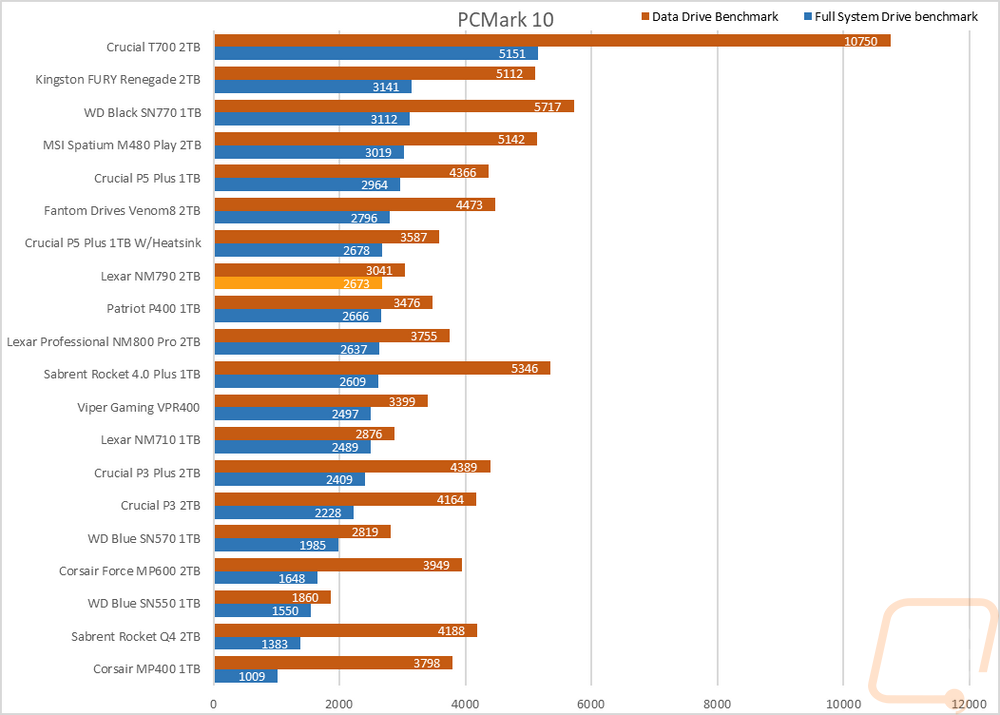
Next up I wanted to look at more real-world performance and for this, I started with PCMark 10 which has an overall full system benchmark for storage, and then one focused on data storage drives. In the full system drive benchmark, the Lexar NM790 was above the median performance in the full system results but came in lower in the data drive benchmark. For the full system drive test, the Lexar NM790 was right with the Crucial P5 Plus and the Patriot P400 drives as well as Lexar’s own NM800 Pro as well.
For more real-world resting, I did our file transfer tests. You don’t get any more real-world than this. For each drive, I copied the folder filled with files to the drive tested documenting what its transfer rate is near the end of the transfer. I used three file types, movies which are large single files, a folder filled with RAW and JPG photos, and then a folder filled with Word documents. Starting with the movie files the Lexar NM790 did 2560 MB/s, 1570 MB/s for pictures, and 17.5 MB/s for documents. This up the Lexar NM790 was up near the top in all of those tests with just Lexar’s NM710 performing a little better.
|
Windows 11 File Transfers |
Movies |
Pictures |
Documents |
|
WD Blue SN550 1TB |
852 |
937 |
2.42 |
|
Sabrent Rocket Q4 2TB |
2720 |
1140 |
5.75 |
|
Corsair MP400 1TB |
2140 |
996 |
2.57 |
|
Corsair Force MP600 2TB |
1250 |
816 |
2.83 |
|
Sabrent Rocket 4.0 Plus 1TB |
2120 |
254 |
1.63 |
|
Crucial P5 Plus 1TB |
2060 |
1030 |
5.2 |
|
Kingston FURY Renegade 2TB |
2330 |
857 |
2.58 |
|
Patriot P400 1TB |
2070 |
981 |
2.86 |
|
WD Blue SN570 1TB |
602 |
992 |
5.14 |
|
WD Black SN770 1TB |
2260 |
605 |
2.52 |
|
MSI Spatium M480 Play 2TB |
1930 |
905 |
5.62 |
|
Viper Gaming VPR400 |
2360 |
1300 |
2.61 |
|
Crucial P3 Plus 2TB |
2240 |
1080 |
6.92 |
|
Crucial P3 2TB |
1990 |
1100 |
6.46 |
|
Fantom Drives Venom8 2TB |
1750 |
1190 |
4.45 |
|
Lexar Professional NM800 Pro 2TB |
2230 |
879 |
4.39 |
|
Crucial T700 2TB |
2540 |
1520 |
4.57 |
|
Lexar NM710 1TB |
2610 |
1630 |
18.4 |
|
Crucial P5 Plus 1TB W/Heatsink |
2580 |
1570 |
17.4 |
|
Lexar NM790 2TB |
2560 |
1570 |
17.5 |
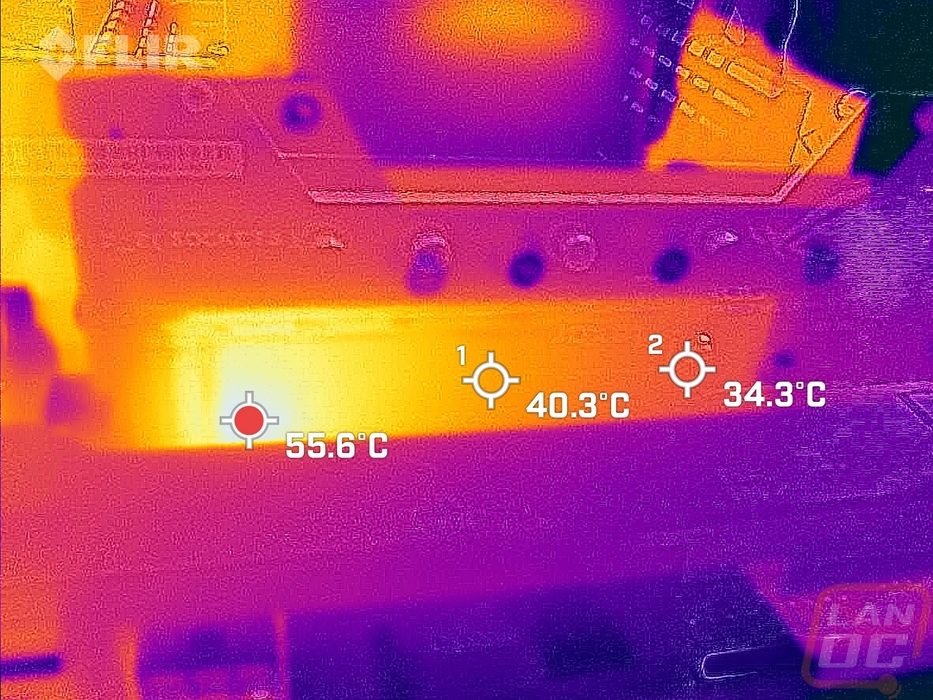
Before finishing up my testing I did run AIDA64’s drive benchmark with the linear read test for a half hour to heat things up and got a look at the Lexar NM790 through the thermal camera. The temperatures have a wide range across the drive which isn’t too big of a surprise with it not having a heatsink at all. The 55.6c hotspot is where the controller is at. That is where all of the heat is generated and we can see that then radiate the rest of the way across the drive as it cools down towards the middle and end.