Synthetic Benchmarks
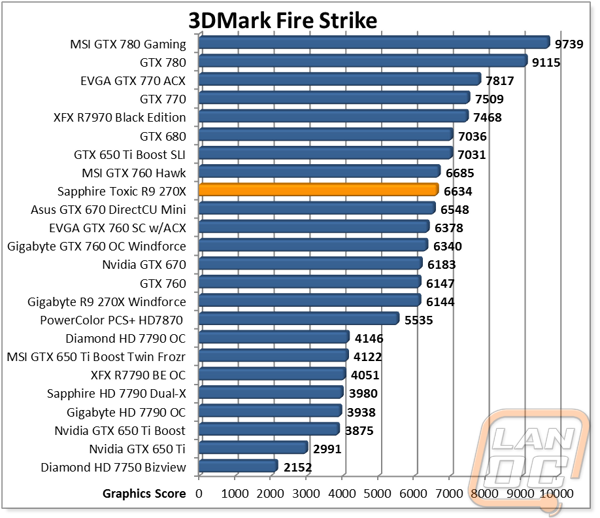
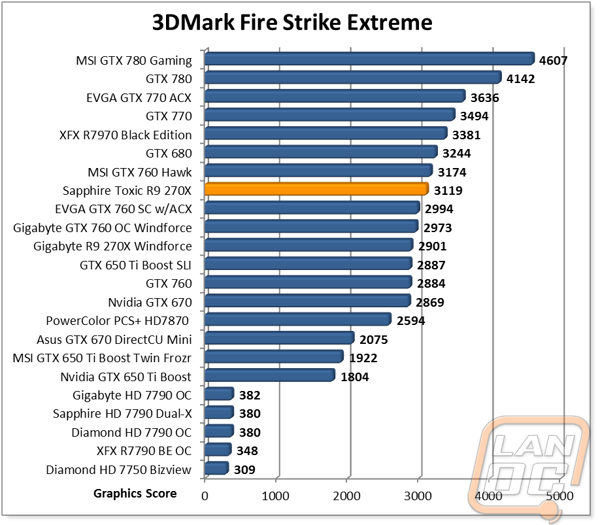
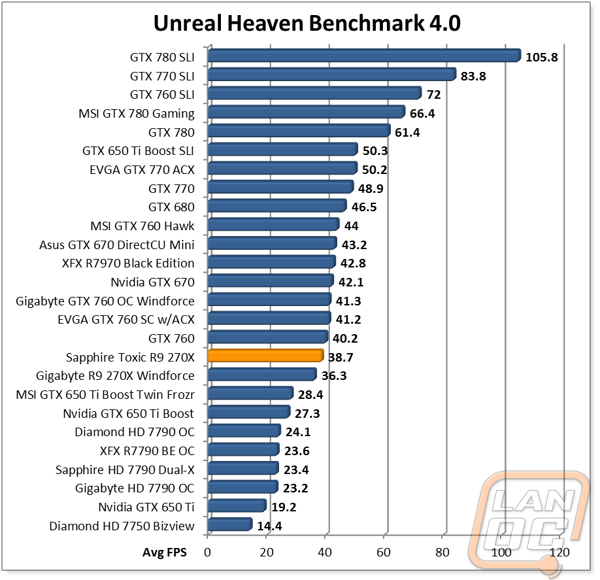
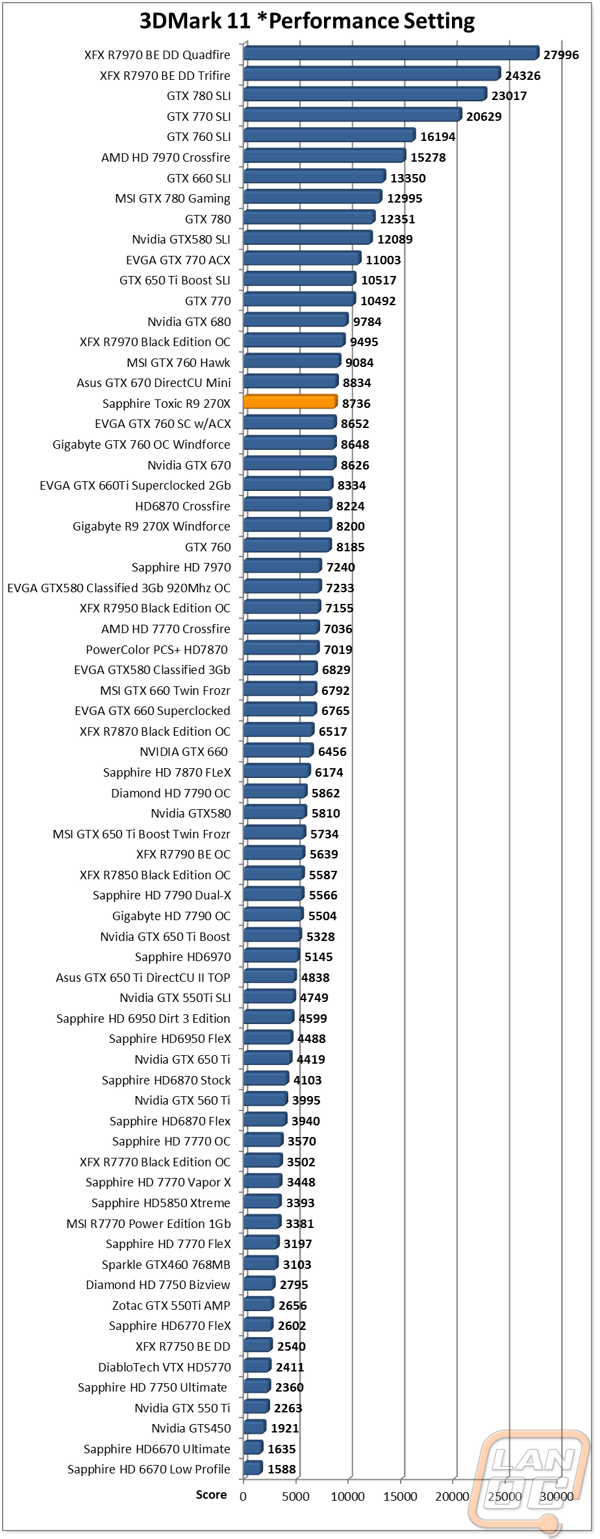
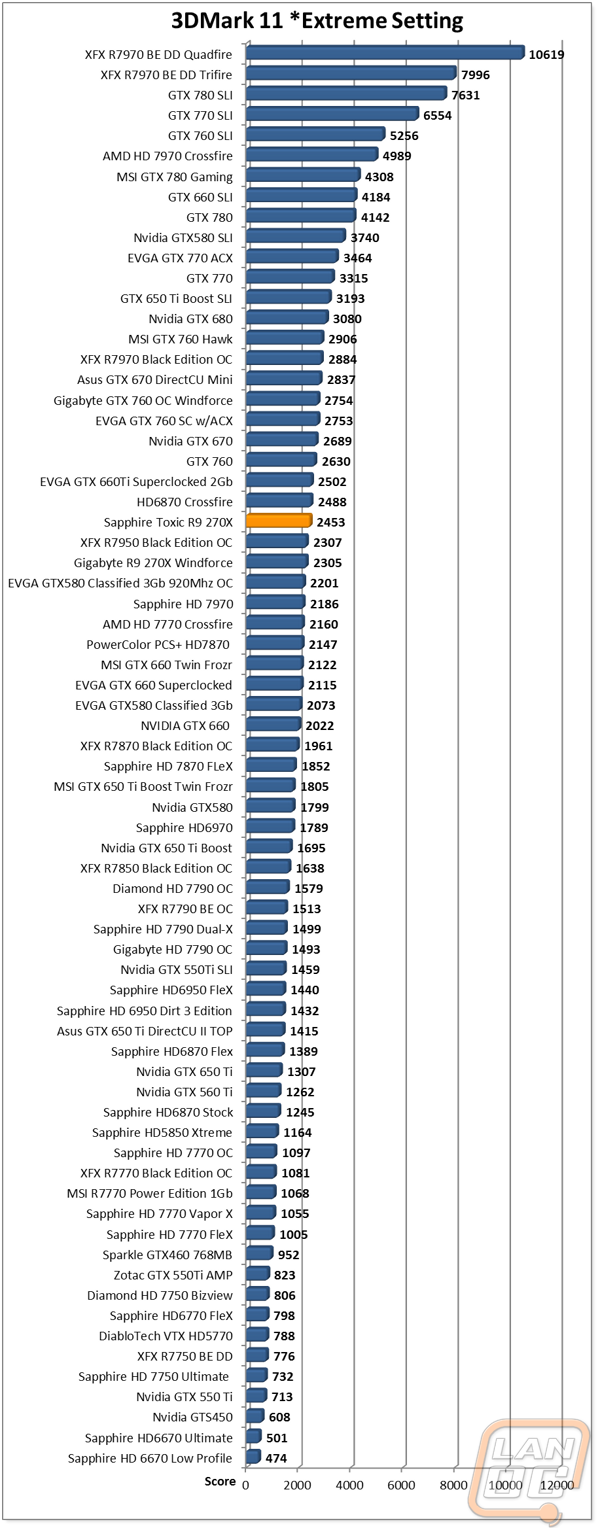
I’ve talked about this before but synthetic benchmarks don’t really give you any idea of how your card is going to perform in games, but they are a good way to compare from card to card to see the performance difference between them. Because of that I was excited to see where the Sapphire Toxic R9 270X was going to land, I saw it was pulling more power than the Gigabyte R9 270X, but how much of that translated into performance? Well going off of the 3DMark Fire Strike results alone it looks like it translated into a nice bump. The overclocked Toxic card actually pulled ahead of the GTX 760’s short of the extremely fast Hawk model. This is well above the R9 270X Windforce especially. The same happened in 3DMark 11 with the performance setting but just like the Gigabyte card the extreme setting did show the Toxic’s weakness with its lower memory bus size. Heaven Benchmark 4.0 was similar, but there was a nice 2+ FPS bump up over the Windforce still.