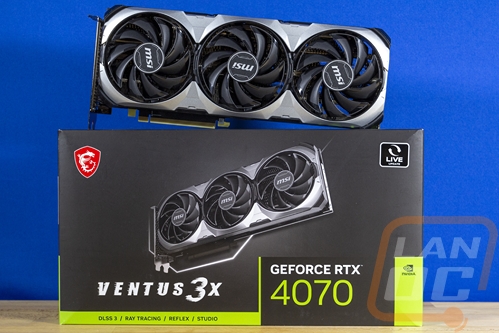
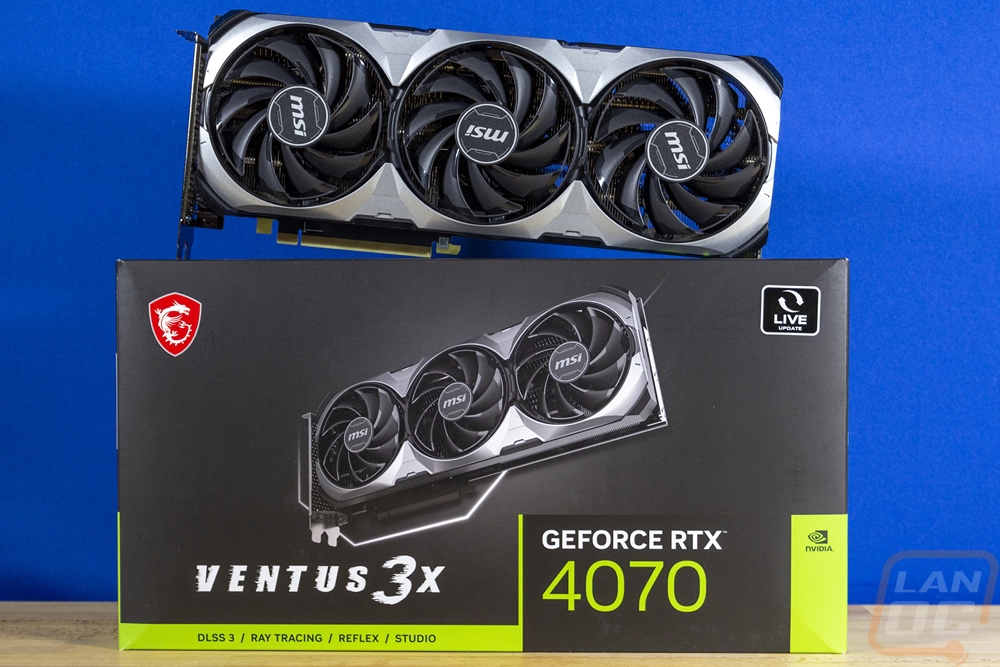
The Nvidia Founders Edition isn’t the only base MSRP option out on the market. In fact, it is only available in a few places to buy and is often harder to come by than the MSRP options from everyone else. A good example is the MSI RTX 4070 Ventus 3X 12G which is also a $599 option. MSI has gone a different direction from Nvidia’s card, the Ventus has the same clock speed but it is larger and has three fans, not two. Today I’m going to check out the MSI RTX 4070 Ventus 3X 12G and see how the different direction changes the card performance and to see if the Ventus is a good option for those looking for an RTX 4070 at the entry price.
Product Name: MSI RTX 4070 Ventus 3X 12G
Review Sample Provided by: MSI
Written by: Wes Compton
Amazon Affiliate Link: HERE
RTX 4070 Details
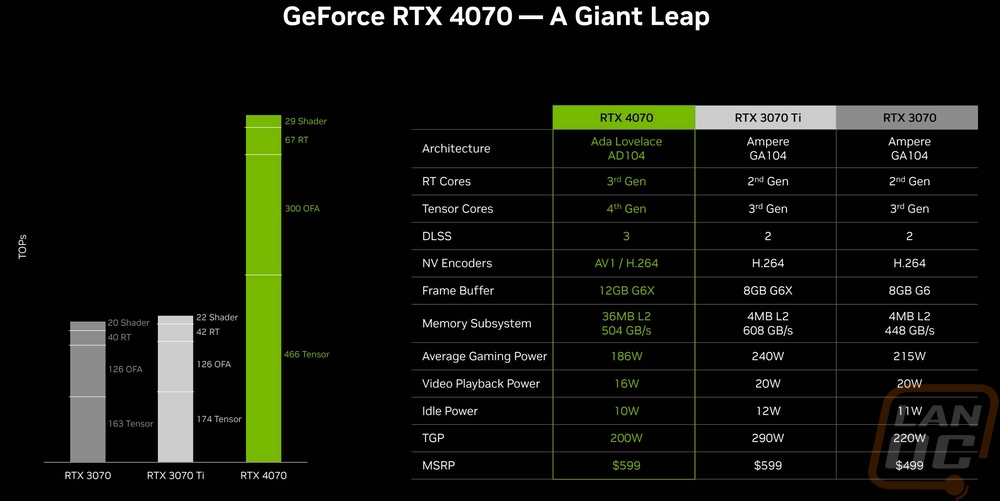
The Nvidia RTX 4070 is the next addition to their 4000 Series of cards and like the others, it is based on the same Ada Lovelace architecture. This means that it does have the same full support for DLSS 3 and the other changes that the other cards have like the new fourth-generation tensor AI-focused cores, third-generation ray tracing cores, and the AV1 encoders which will be huge for streamers and also a way to lower streaming bandwidth while improving quality. The 4070 sits below the 4070 Ti in the lineup but is based on the same AD104 GPU as the 4070 Ti and 4080 which is built on the 4N custom process by TSMC. The RTX 4070 may use the same AD104 GPU but Nvidia has cut it down slightly with 4 GPCs or graphics processing clusters to the 4070 Ti’s 5. Translates to 23 TPCs or texture processing clusters and 46 streaming multiprocessors. For CUDA cores the RTX 4070 has 5888 down from the 7680 of the 4070 Ti which is a 23% drop. The tensor core count is 184, the ray tracing core count is 46, and the texture units are 184 as well which are all a 30% drop from the 240/60/240 on the RTX 4070 Ti. The RTX 4070 also has a lower boost clock with it running at 2475 MHz to 2610 MHz but the memory is clocked the same and has the same 21 Gbps data rate. They also have the same 12 GB of GDDR6X which is notably an improvement over the last generations RTX 3070 which has 8GB but the memory interface for the 4070 is 192-bit which is a downgrade but does match the 4070 Ti. The cut down GPU and lower clock speeds did help with the overall TDP though which is now 200 watts compared to the 285 watts on the RTX 4070 Ti.
|
|
RTX 3070 |
RTX 4070 |
RTX 4070 Ti |
|
Graphics Processing Clusters |
6 |
4 |
5 |
|
Texture Processing Clusters |
23 |
23 |
30 |
|
Streaming Multiprocessors |
46 |
46 |
60 |
|
CUDA Cores |
5888 |
5888 |
7680 |
|
Tensor Cores |
184 (3rd Gen) |
184 (4th Gen) |
240 (4th Gen) |
|
RT Cores |
46 (2nd Gen) |
46 (3rd Gen) |
60 (3rd Gen) |
|
Texture Units |
184 |
184 |
240 |
|
ROPs |
96 |
64 |
80 |
|
Boost Clock |
1725 MHz |
2475 MHz |
2610 MHz |
|
Memory Clock |
1750 MHz |
1313 MHz |
1313 MHz |
|
Memory Data Rate |
14 Gbps |
21 Gbps |
21 Gbps |
|
L2 Cache Size |
4MB |
36 MB |
49 MB |
|
Total Video Memory |
8 GB GDDR6X |
12 GB GDDR6X |
12 GB GDDR6X |
|
Memory Interface |
256-bit |
192-bit |
192-bit |
|
Total Memory Bandwidth |
448.0 GB/sec |
504 GB/sec |
504 GB/sec |
|
Texture Rate (Bilinear) |
317.4 Gigatexels/sec |
455.4 Gigatexels/sec |
626 Gigatexels/sec |
|
Fabrication Process |
Samsung 8 nm 8N NVIDIA Custom Process |
TSMC 4N NVIDIA Custom Process |
TSMC 4N NVIDIA Custom Process |
|
Transistor Count |
17.4 Billion |
35.8 billion |
35.8 billion |
|
Connectors |
3 x DisplayPort 1 x HDMI |
3 x DisplayPort 1 x HDMI |
3 x DisplayPort 1 x HDMI |
|
Power Connectors |
1x12 pin (Dongle to 1x 8-Pin) |
2x PCIe 8-pin cables OR 300w or greater PCIe Gen 5 cable |
2x PCIe 8-pin cables OR 300w or greater PCIe Gen 5 cable |
|
Minimum Power Supply |
650 Watts |
650 Watts |
700 Watts |
|
Total Graphics Power (TGP) |
220 Watts |
200 Watts |
285 Watts |
|
Maximum GPU Temperature |
93° C |
90° C |
90° C |
|
PCI Express Interface |
Gen 4 |
Gen 4 |
Gen 4 |
|
Launch MSRP |
$499 |
$599 |
$799 |
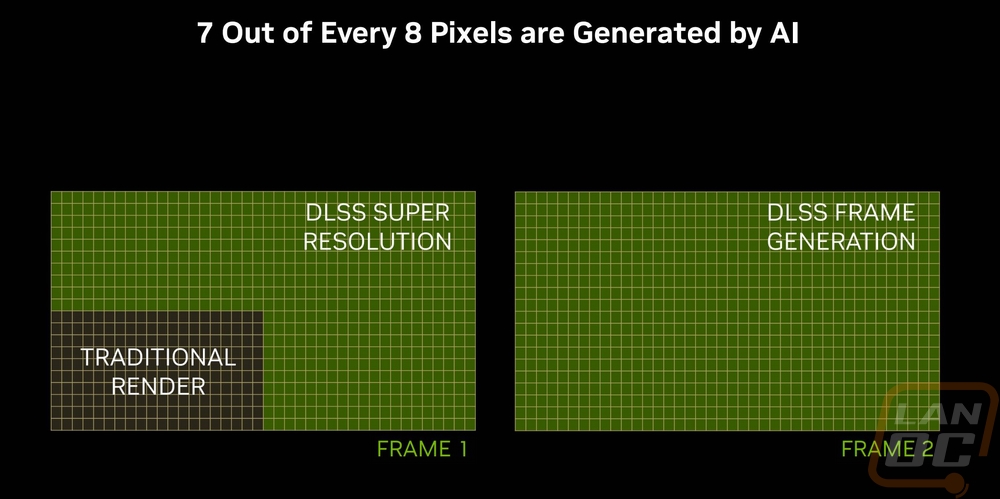
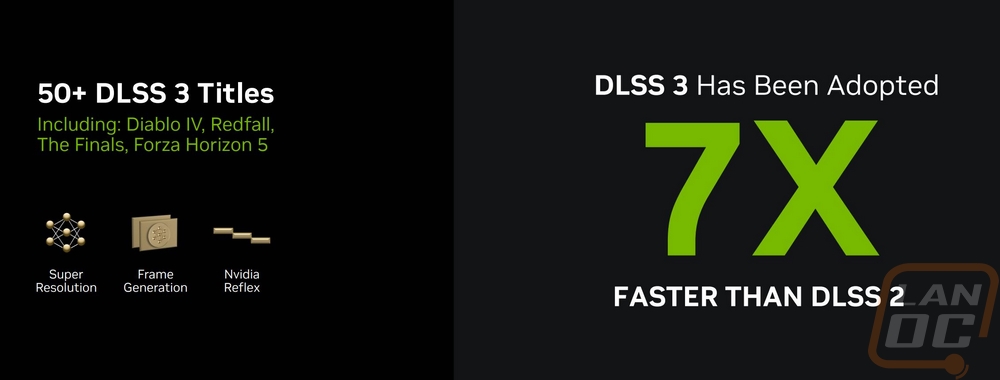
With the RTX 4070 having support for DLSS 3 it supports DLSS Frame Generation which I’ve tested in the past and has been a huge performance improvement, especially in games that are CPU limited. The combination of DLSS Super Resolution and frame generation mean that when both are on the card renders 1 out of 8 pixels with traditional rendering. Super Resolution scales that up and then frame generation can use AI to render an entire frame in between the traditional frames. This is also why they can improve performance even when CPU-limited. DLSS 3 is being adopted quicker than DLSS 2 at a rate of 7 times faster according to Nvidia. They do have a good list of titles going and they finally have one website put together that shows you all of the games that support ray tracing, DLSS 3, DLSS 2, and AI processing which makes it easier to see if the games you want to play are included, here is a link.
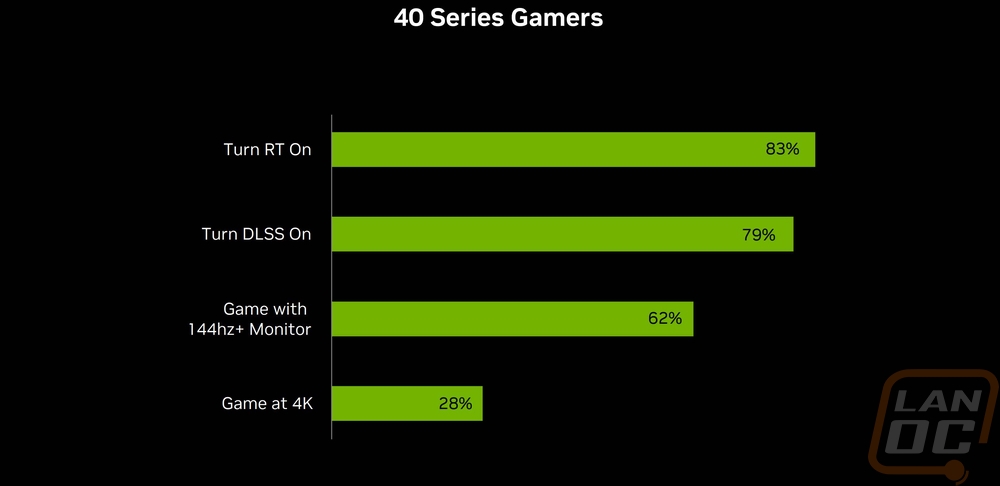
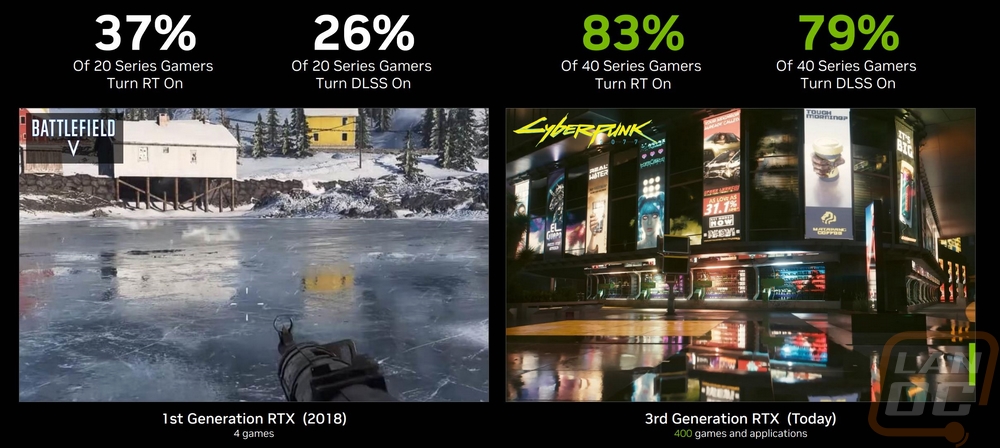
On the call about the 4070 Nvidia also showed some of the numbers that they are seeing as far as ray tracing and DLSS use for 4000 series card owners as well as percentages of people who have 144hz or higher monitors and people who are gaming at 4k. At 83% that is a big portion of the people who are buying 4000 series cards who are using it and DLSS was a little lower but not far at 79%. They also compared the same numbers with 2000 Series owners which was the first generation with RTX support and those numbers are significantly lower. It makes sense though, with the original 2000 Series only the highest ends cards were able to handle RTX and DLSS has improved a lot. Having DLSS 3 on the new cards helps open up ray tracing performance in situations where you might otherwise skip it for the performance.
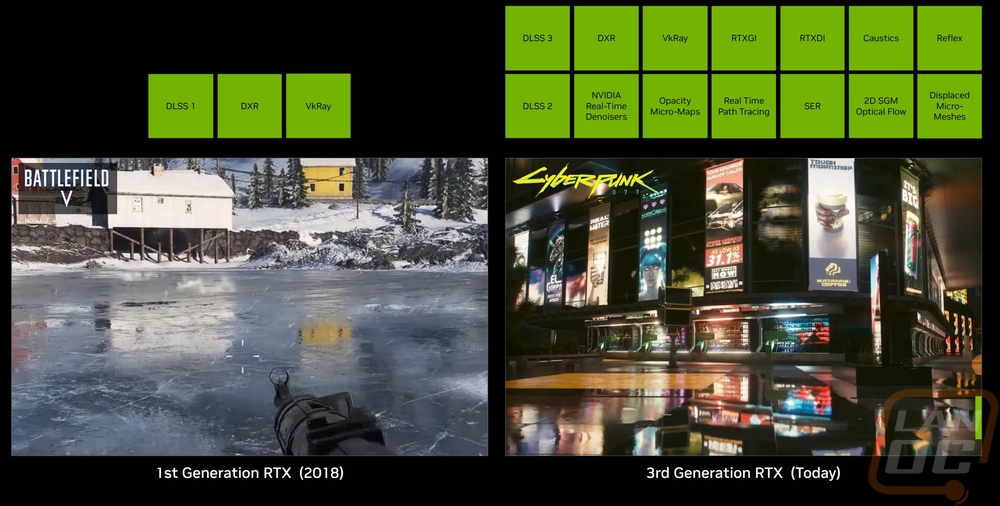
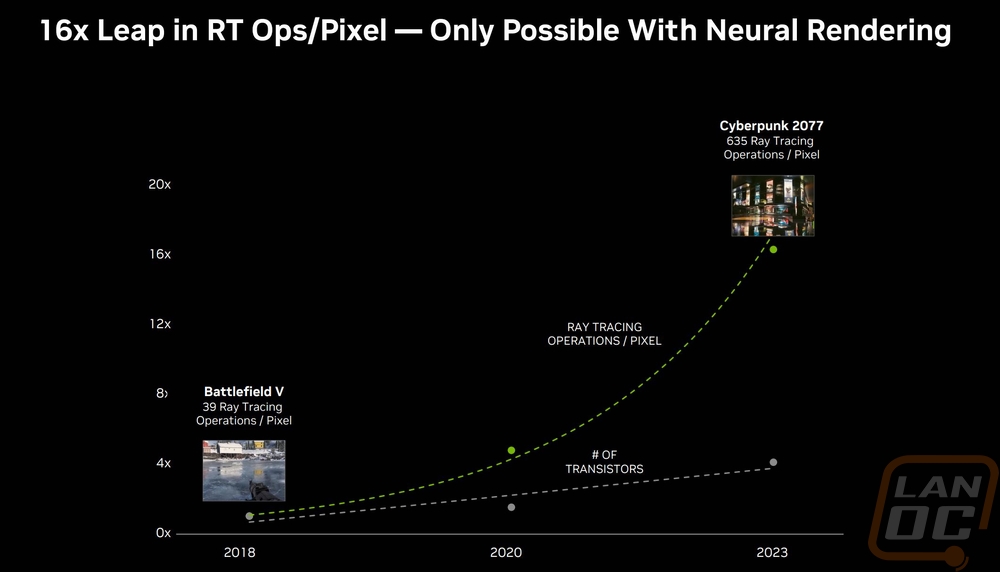
On that same note, they also showed just how much more RTX offers with today's offers whereas back in 2018 the cards were limited and games had to pick and choose which effects they wanted to utilize. This can really be seen when you see the change in ray tracing operations per pixel between Battlefield V and Cyberpunk 2077 with it going from 39 to 635. Nvidia also mapped out the number of transistors on their cards between then and now as well on the same graph. This does a great job of showing that while the cards have grown in processing power, the about of ray tracing operations per pixel has out scaled that by a huge amount.
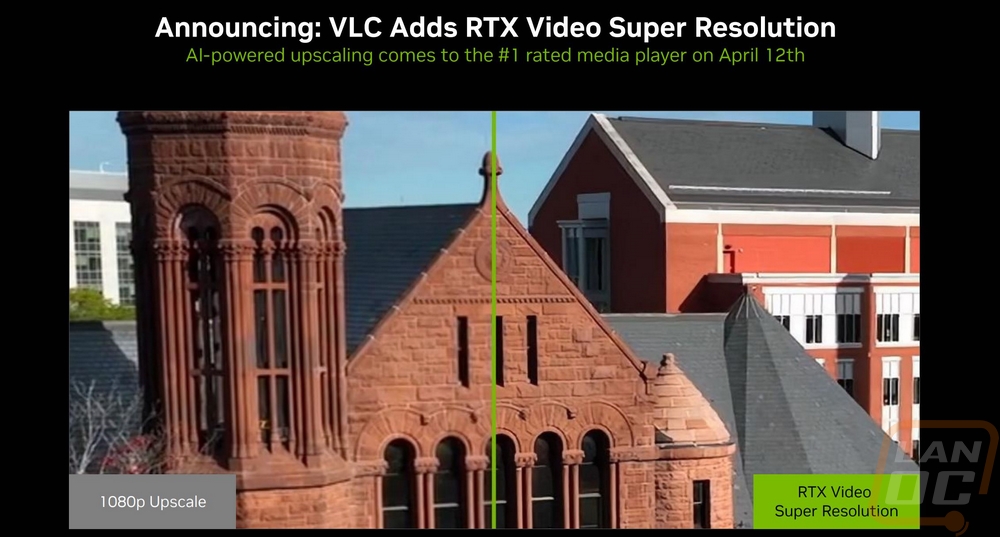
Another big announcement, at least for me was that VLC is adding RTX Video Super Resolution. This one hits home because I watch a lot of TV both in the living room and on my PC. In the living room I have an Nvidia TV which has had AI upscaling for a while now and I recently noticed that some of the video files that I have on the network were a lot lower in resolution than I thought when I want to watch them on VLC on my PC. I hadn’t noticed it on the TV. Video Super Resolution could do the same on VLC, improving the resolution of all of your movies/videos as you watch them.
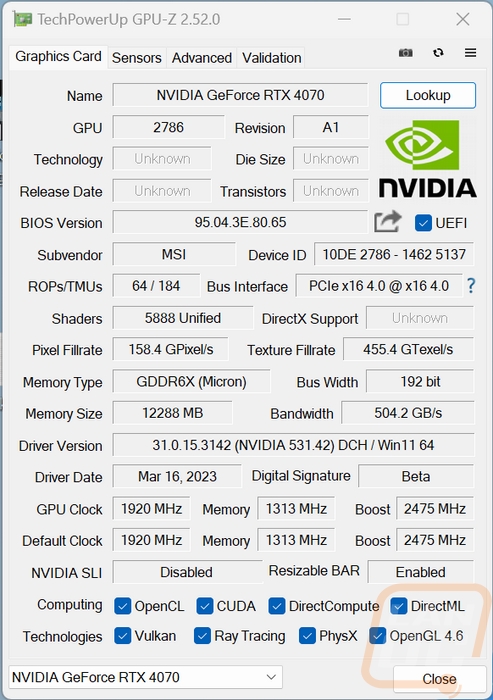
Before getting into testing I did also run GPUz to double-check that our clock speeds match up with the specifications. The MSI RTX 4070 Ventus came in at 2475 MHz for the boost clock which matches the specifications and also the Founders Editions clock speed. For the driver, I used the 531.42 driver that Nvidia provided ahead of the launch. The board BIOS is also noted for future reference if needed.
Packaging
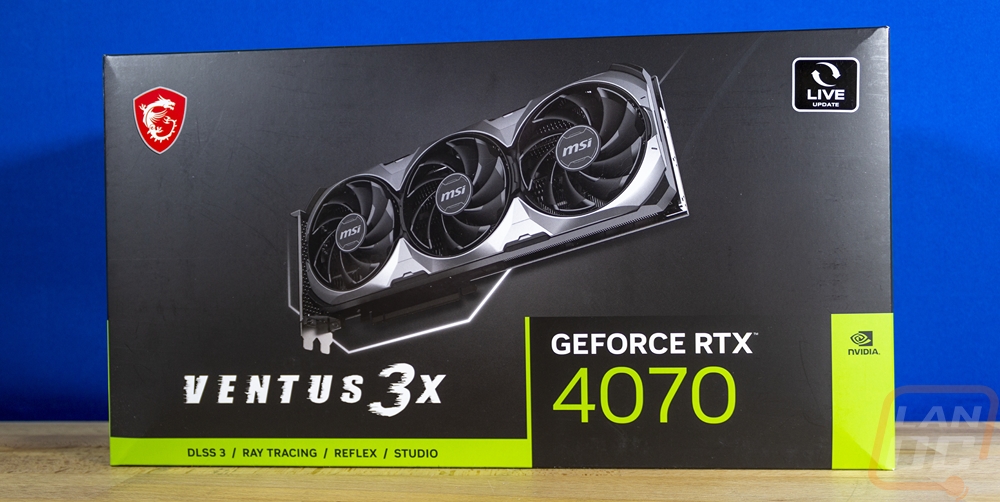
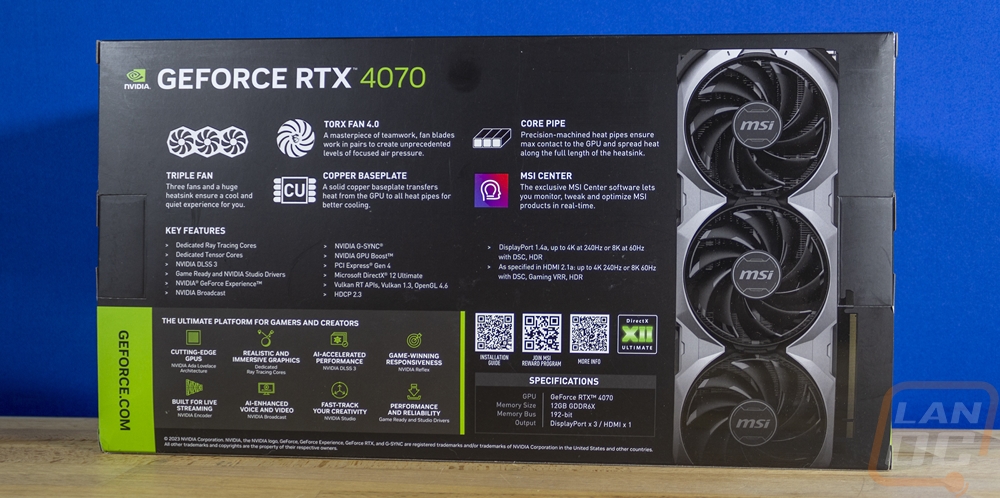
The box for the MSI RTX 4070 Ventus 3X is a departure from what we saw on the Nvidia Founders Editon 4070 but it is in line with a traditional case box in size and shape. MSis design has a black background with a large picture of the card itself in the center on the front which I love. The Ventus 3X branding is below that and right next to the green wrap-around that Nvidia has on all of their cards which also has the model name itself in it. Beyond that MSI has their red gaming badge but the only MSI brand visible is in the picture of the card with each fan having the logo perfectly lined up. Around on the back of the box it has another picture of the card, this time zoomed in more and sitting vertically like a tower over on the right. MSI has an extremely small specification listing which doesn’t include things you would want to know like the clock speed or card dimensions but does at least let you know what display connections the card has. Beyond that, they dive into a few of their key features with short descriptions and then have Nvidias features under key features and again on the wrap-around as well.
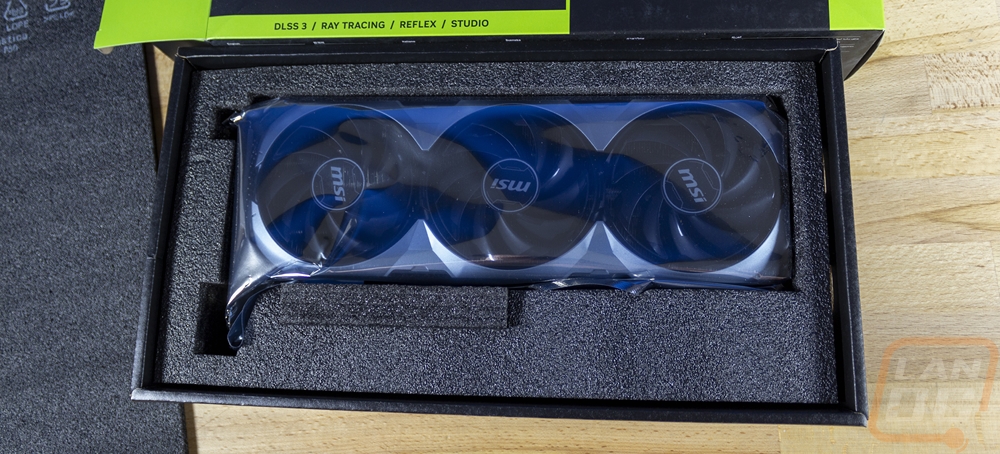
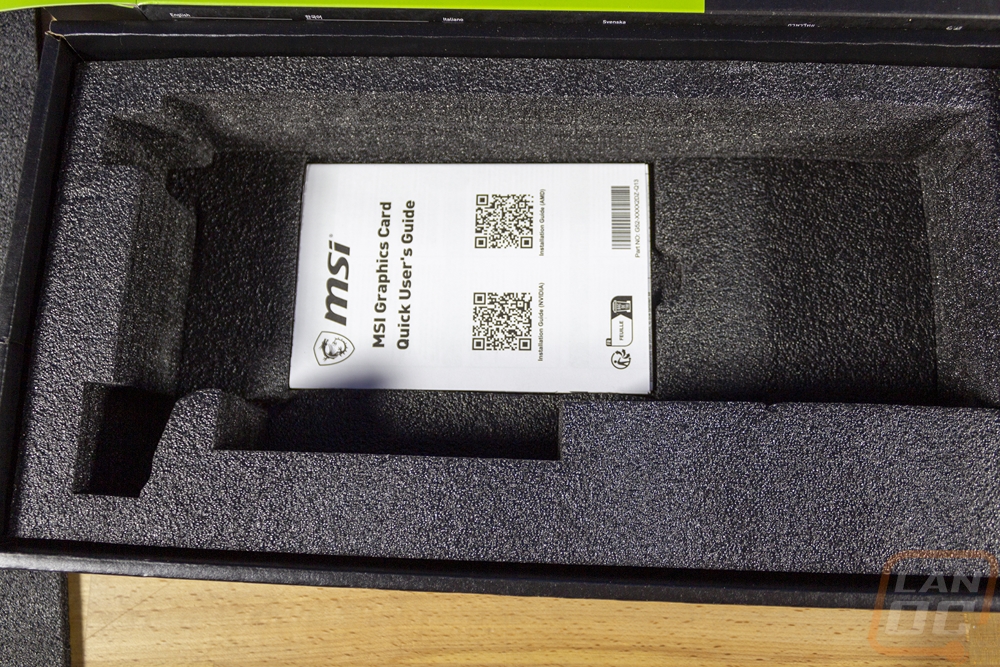
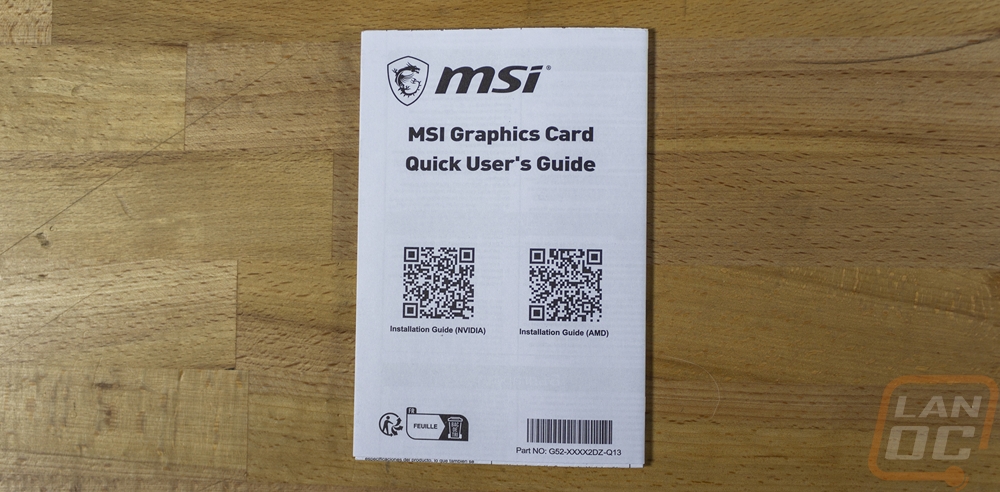
Inside the main box is a topless box that holds everything. This is mostly filled with foam except for the cutout shaped to the 4070 Ventus 3X which comes also wrapped in a static protective bag. Under that, there aren’t any accessories which was a surprise. Most 4000 Series cards have had the new 12VHPWR connection and with that needed an adapter but the 4070 Ventus 3X doesn’t have that. You do get one document which is a universal user guide with QR codes on the front, one for Nvidia cards and another for AMD cards.
Card Layout and Photos
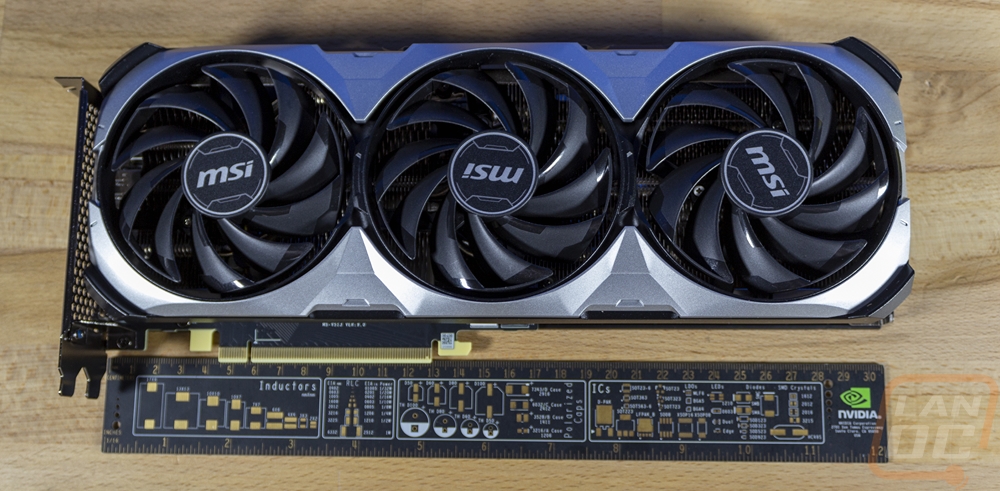
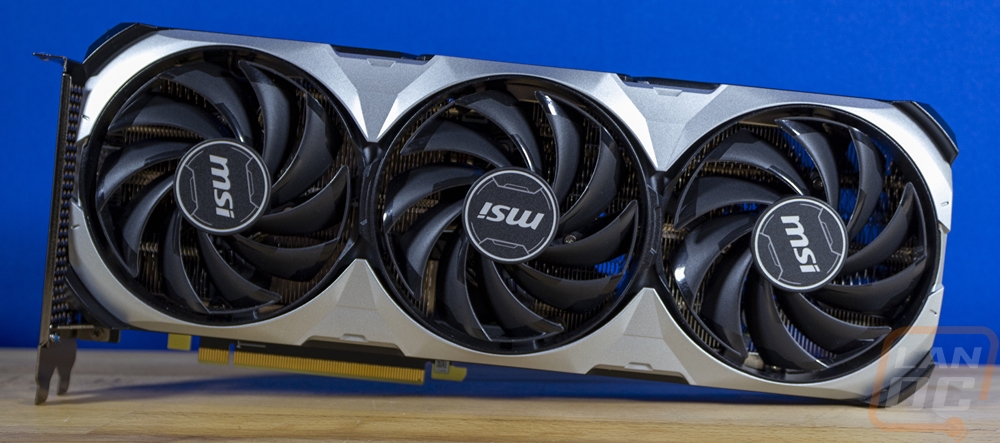
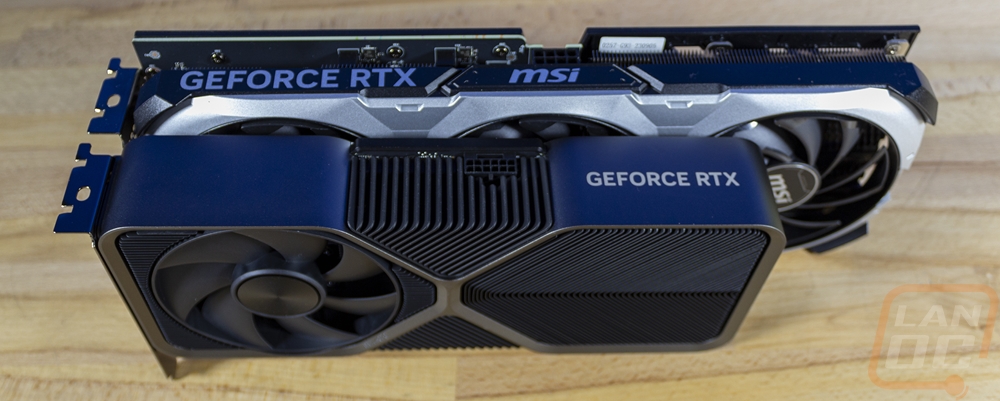
Coming from the RTX 4070 Founders Edition before checking out the MSI RTX 4070 Ventus 3X is a little jarring. Nvidia is going a completely different direction with their cards and it is really obvious, especially with the Founder Edition having an all-metal heatsink design including the integrated backplate whereas the 4070 Ventus 3X has a plastic fan shroud and backplate. The 4070 Ventus 3X is also significantly longer, sitting just past 12 inches long. The card is slightly taller as well with 13 mm above the top of the PCI bracket but for thickness, this isn’t a thick card, it fits in the standard 2-slot design which is good to see. The plastic fan shroud allows for the shroud design to have more styling to it but MSI has kept things relatively simple with it bulging out around each of the three fans but none of the crazy styling some of their high-end cards end up with. The black fans along with the silver shroud with black on the top edge give a nice color contrast while still sticking with neutral colors that will work in most builds.
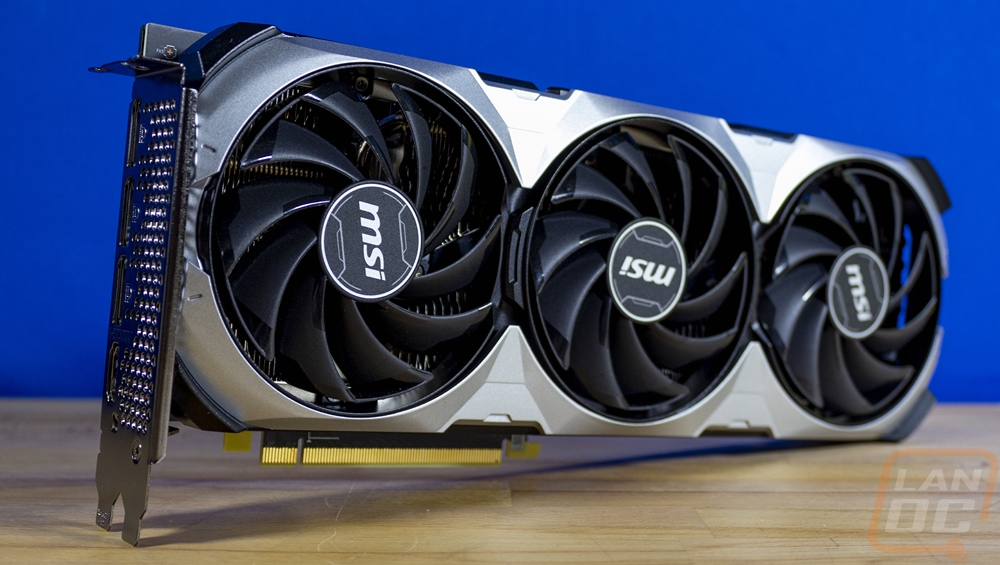
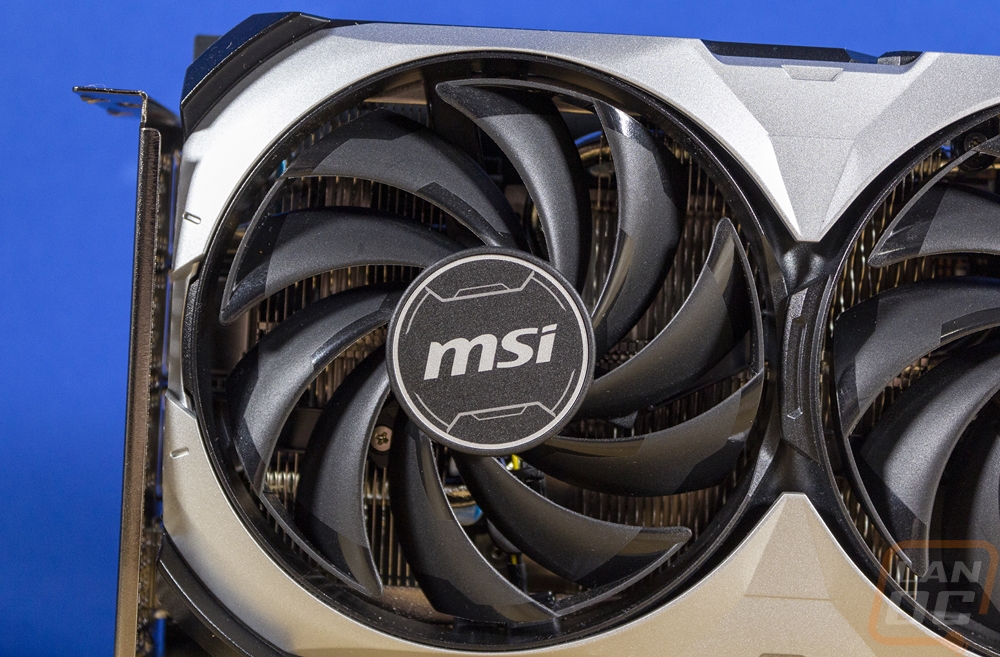
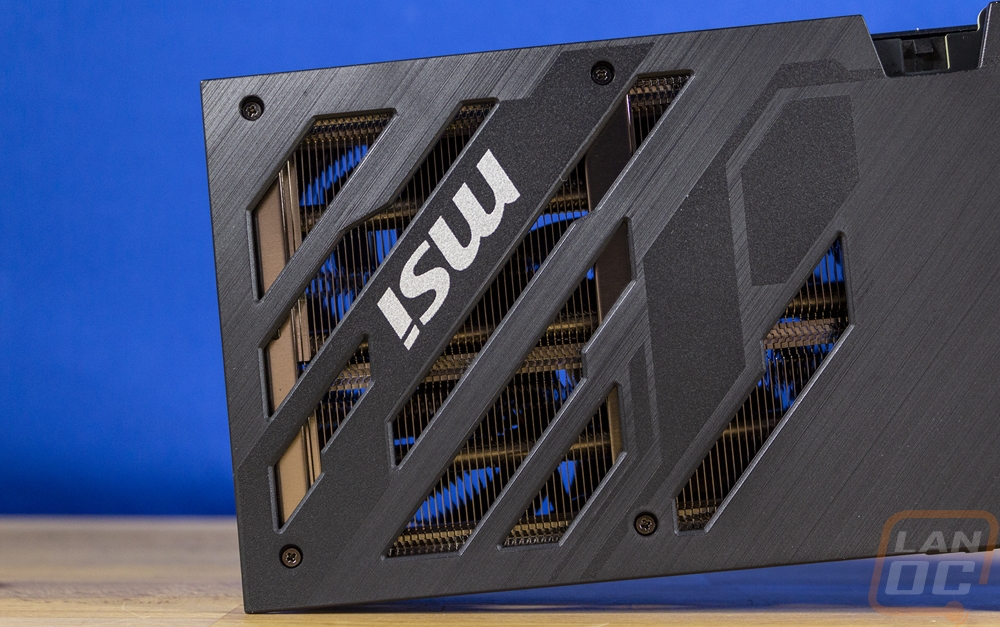
The fan side of the 4070 Ventus 3X has three matching fans packed in nearly touching each other. Each fan has the MSI logo in the middle with a black and silver sticker that matches the shroud design. Each fan is around 86 mm wide and each fan has 10 blades. This is MSIs Torx Fan 4.0 design which has the blades connected in pairs to give them additional strength without going for the full ring that adds even more weight to the fan. Each fan spins counterclockwise and is designed to blow air down into the heatsink below it. The zoomed-in view of the fan also gives us a peak at the ribbed design on the top of the heatsink inside. This helps spread out the fan airflow across the cooler and keeps the noise down as well. The heatsink is a standard aluminum fin design with uses heatpipes to run the length of the card to pull heat out across the long cooler. They have squared-off heatpipes when over top of the GPU to get the most contact and a copper baseplate over the GPU and surrounding area. The fans also have their Zero Frozr mode which means they turn off when temperatures are low for silent operation.
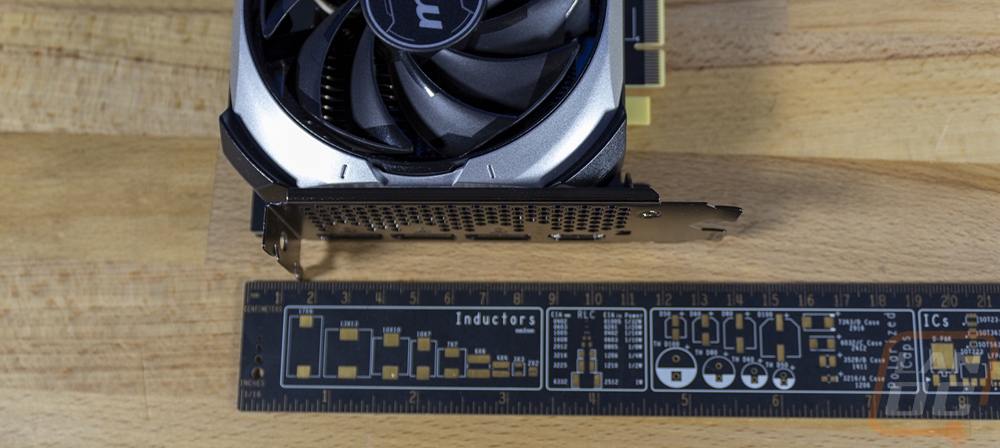
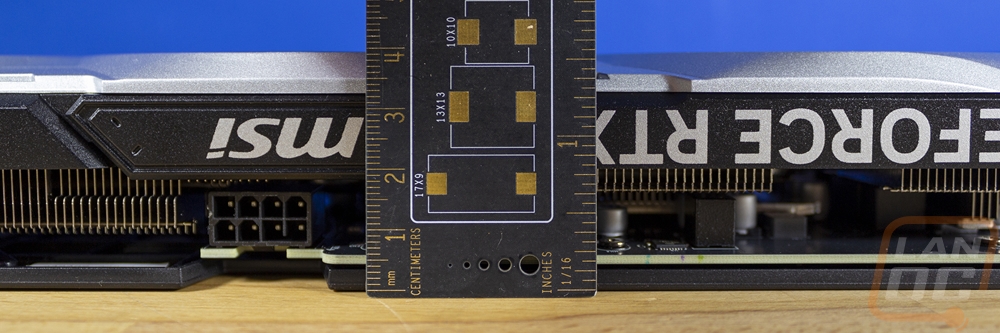
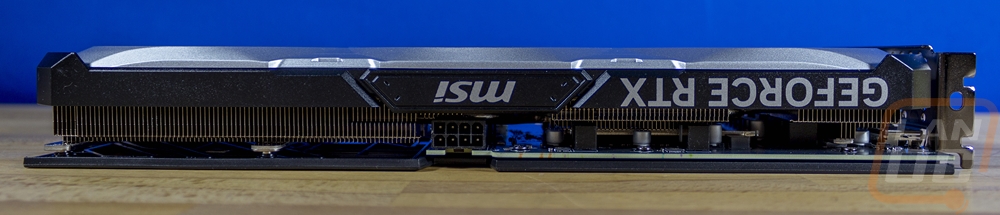
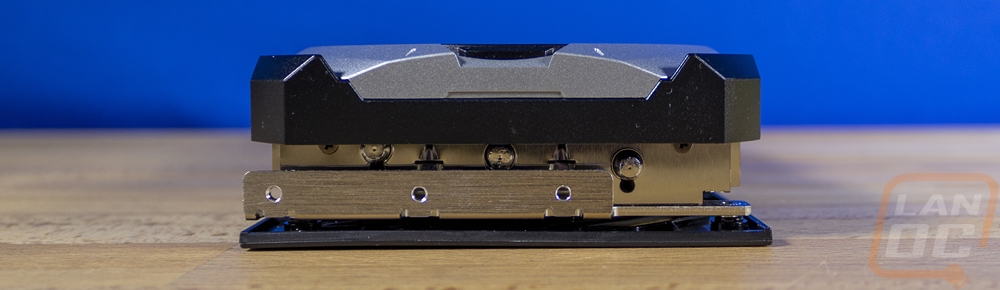
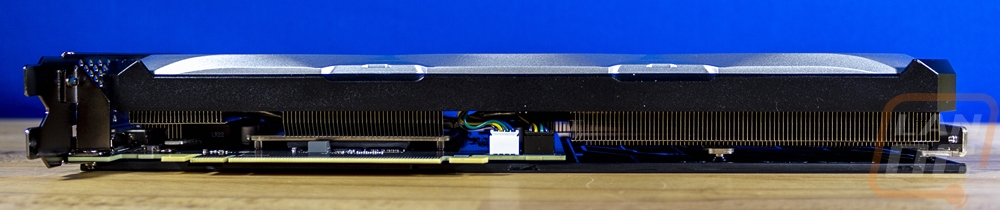
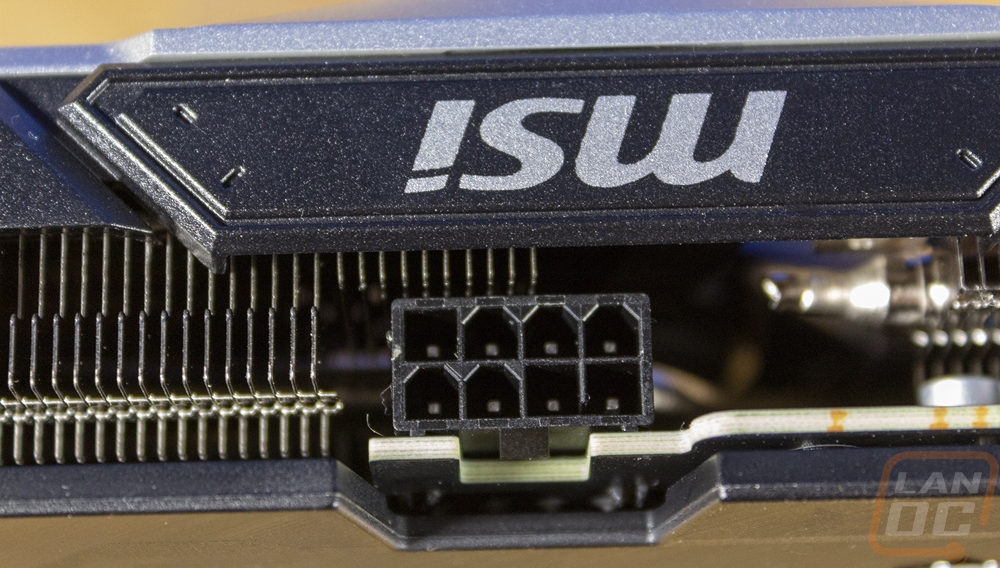
The top and bottom views of the 4070 Ventus 3X give us another view of the heatsink design which you relatively thin on the GPU side of the card with a few areas where it is thinner to avoid components but they didn’t fill in the gaps where space was available. Instead, the design is focused on getting the heatsink thicker down past the end of the PCB. The fan shroud does wrap around on the edges but only about halfway, leaving room for the horizontal heatsink layout to vent air out the top and bottom of the card. The top edge doesn’t have any fancy backlit accents or logos but they have printed the MSI logo and GeForce RTX branding on the top edge. On the end, MSI did include a support bracket if your case supports it. The end also gives us a peak at the heatpipes that run the length of the card. The top edge of the card also has the power connection which is right at the end of the PCB. This was a big surprise for me, I expected a 12VHPWR just like the Founders Edition but MSI went with a single 8-pin connection for the 4070 Ventus 3X. This is flipped around with the clip on the PCB side which the PCB is notched to allow for as is the backplate.
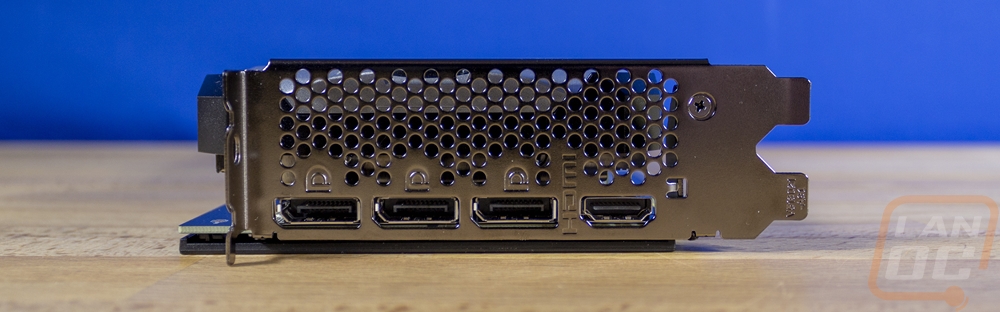
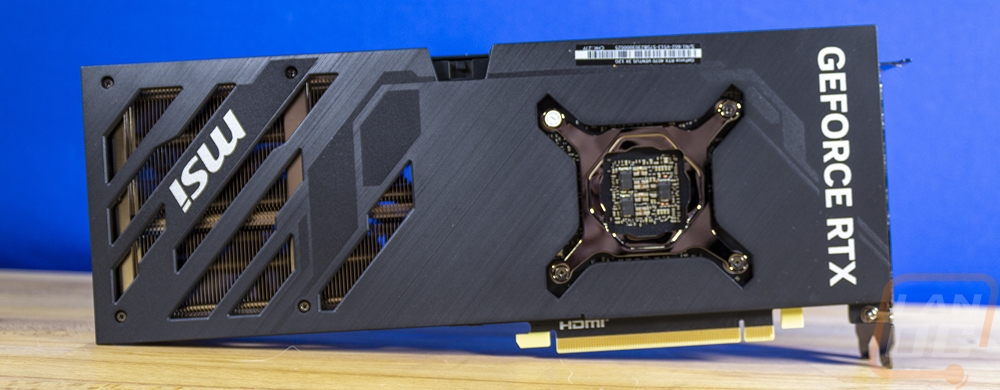
The PCI bracket end of the 4070 Ventus 3X has all of the display connections down the one side. You get three DisplayPort connections and one HDMI which is down at the bottom. All four also have labels stamped into the metal bracket as well. Then above that the rest of the space is filled with small round holes for ventilation, not that the cooler design is focusing any air in this direction.
The back of the 4070 Ventus 3X does have a backplate that runs the length of the card. It is plastic, so heat transfer isn’t going to be very useful. MSI did leave a cutout for the back of the GPU to let air get to that. The backplate is black which is a big contrast to the silver finish on most of the fan side. It has a brushed finish across most of the back but there are a few accents in a different texture that can be seen as well as MSI and GeForce RTX branding printed in white on it. The serial number sticker for the card is attached to the back and up at the top where it will be easy to see when installed in most cases which will make finding that easier but also takes a little away from the styling so I’m torn on if that is a good thing or a bad thing. You can see that the PCB ends just past the power connection and almost half of the 4070 Ventus 3X sticks out past the PCB for a larger heatsink to work with the triple fan design. The backplate has stylized slots cut in it for that area to allow at least some airflow to blow through.
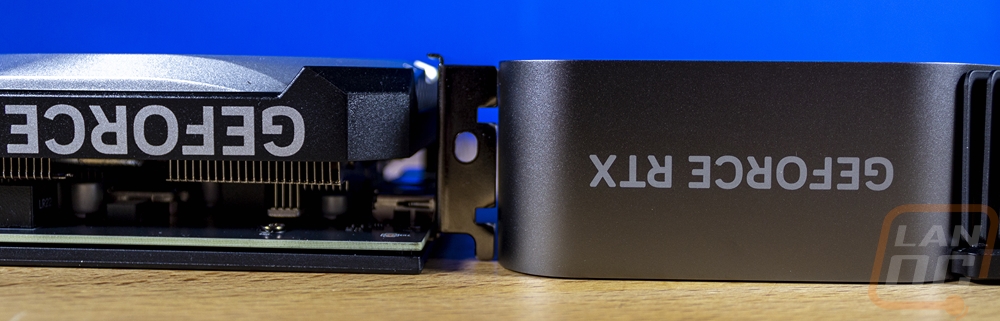
For comparison, I did get pictures of the 4070 Ventus 3X next to the Nvidia RTX 4070 Founders Edition. The difference in styling is night and day, as is the card size differences with the 4070 Ventus 3X running well beyond the end of the Founders Edition. Interestingly though the Founders Edition is just slightly thicker which is exaggerated even more with its card design not venting out the top where the fan shroud on the Ventus is much shorter for the airflow.
Test Rig and Procedures
CPU: Intel Core-i9 13900K – Live Pricing
Motherboard: Asus Z790 Extreme – Live Pricing
Cooling: Corsair H100i Elite LCD Display - Live Pricing
Noctua NT-H1 Thermal Paste - Live Pricing
Memory: Crucial 32GB Kit (2 x 16GB) DDR5-5600 UDIMM– Live Pricing
Storage: Sabrent Rocket Q4 2TB – Live Pricing
Power Supply: Thermaltake Toughpower GF3 1000W- Live Pricing
Case: Primochill Wetbench - Live Pricing
OS: Windows 11 Pro 64-bit - Live Pricing
|
Our Testing Procedures |
|
|
3DMark |
All 3DMark-based tests are done using the most recent version. We test using all three versions of Fire Strike, Both Time Spy and Time Spy Extreme, and Speed Way. Tests to look at ray tracing performance are done with Port Royal when supported and for Nvidia cards that support DLSS, the DLSS subtest is also done at 1440p with the performance setting and DLSS 2.0 as well as a look at DLSS 1, 2, and 3 at 4K. |
|
Unigine Superposition |
1080p Extreme and 4k Optimized benchmarks along with the VR Future test are done. The VR test is done at the Oculus resolution |
|
VRMark |
Only the Blue room test is run |
|
CS:GO |
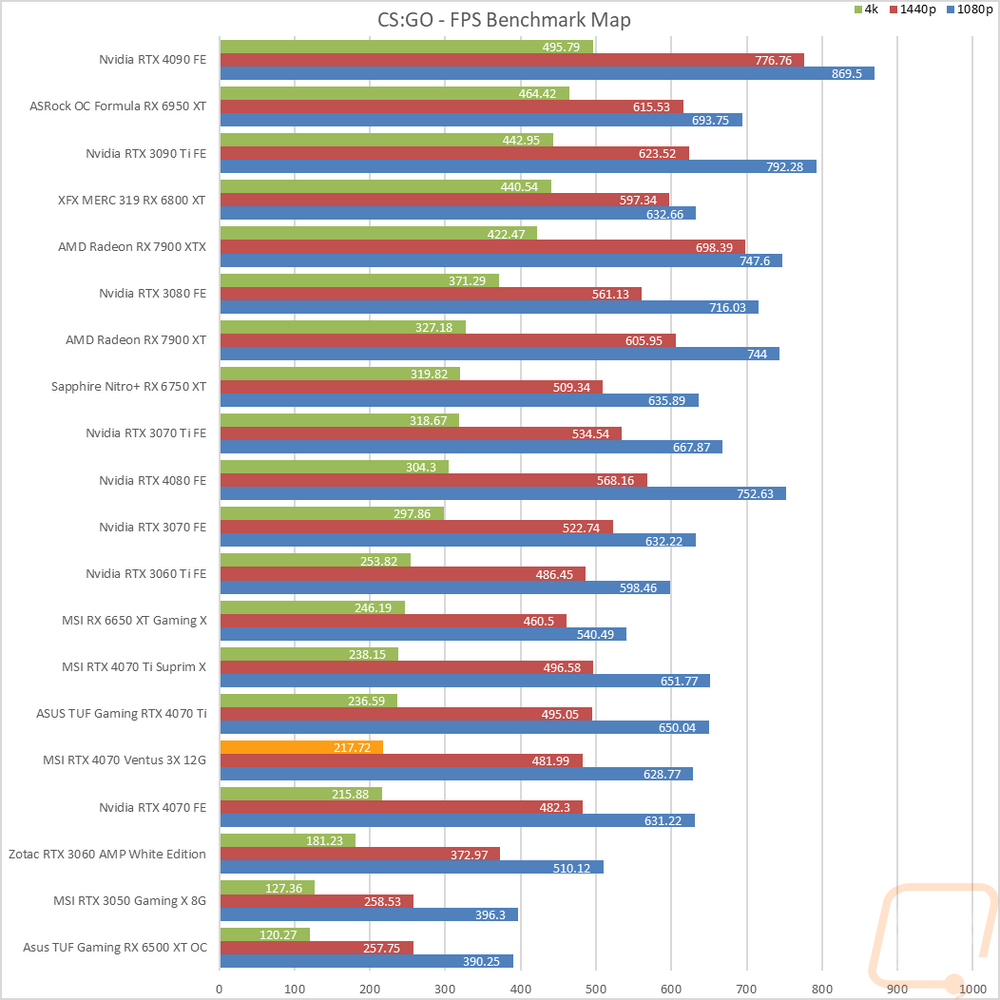
This test is done using the workshop map called CS:GO Benchmark. You can find more information at this link. https://www.gamingpcbuilder.com/how-to-install-csgo-fps-benchmark-map/ I test at 1080p, 1440p, and 4K resolutions. All auto settings are turned off and detail is set to their highest settings. shadow quality high, model texture detail high, shader detail very high, AA set to 16x, uber shaders enabled |
|
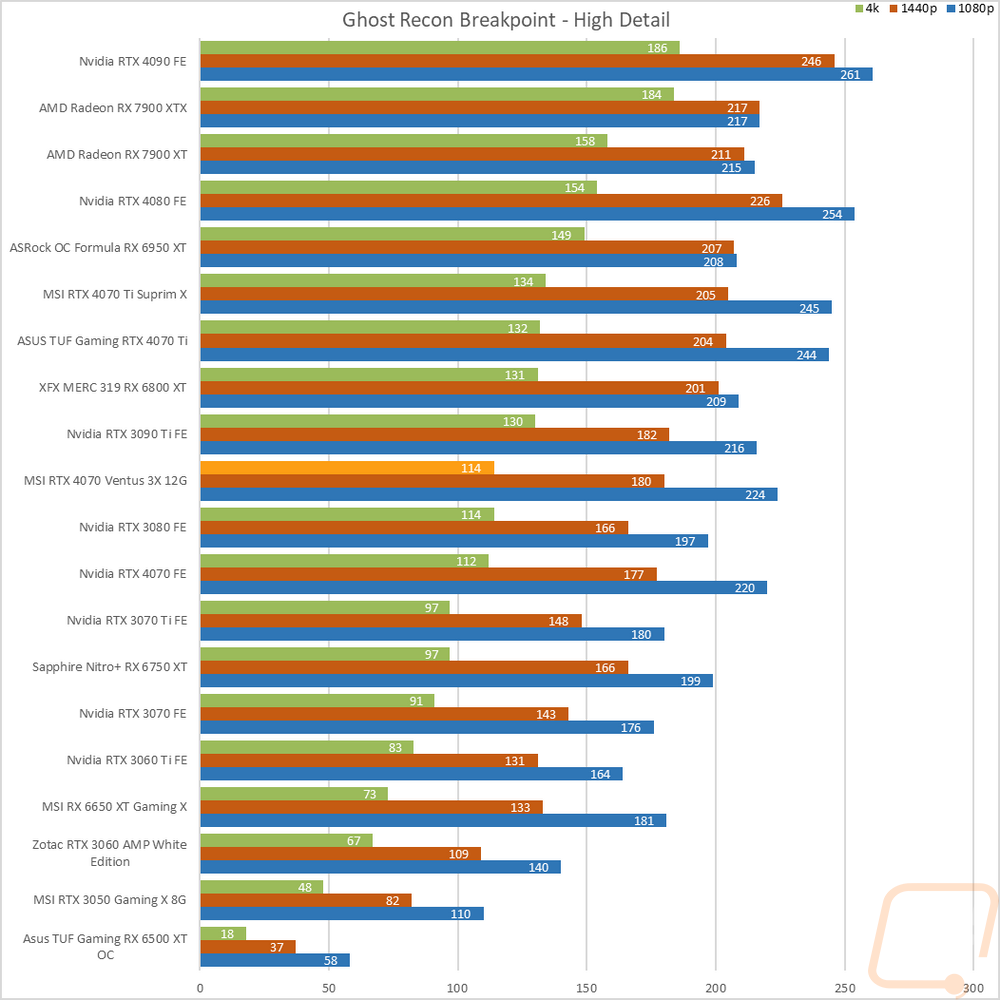
Ghost Recon Breakpoint |
Built-in benchmark tested at 1080p, 1440p, and 4k with the Ultra and Medium detail settings |
|
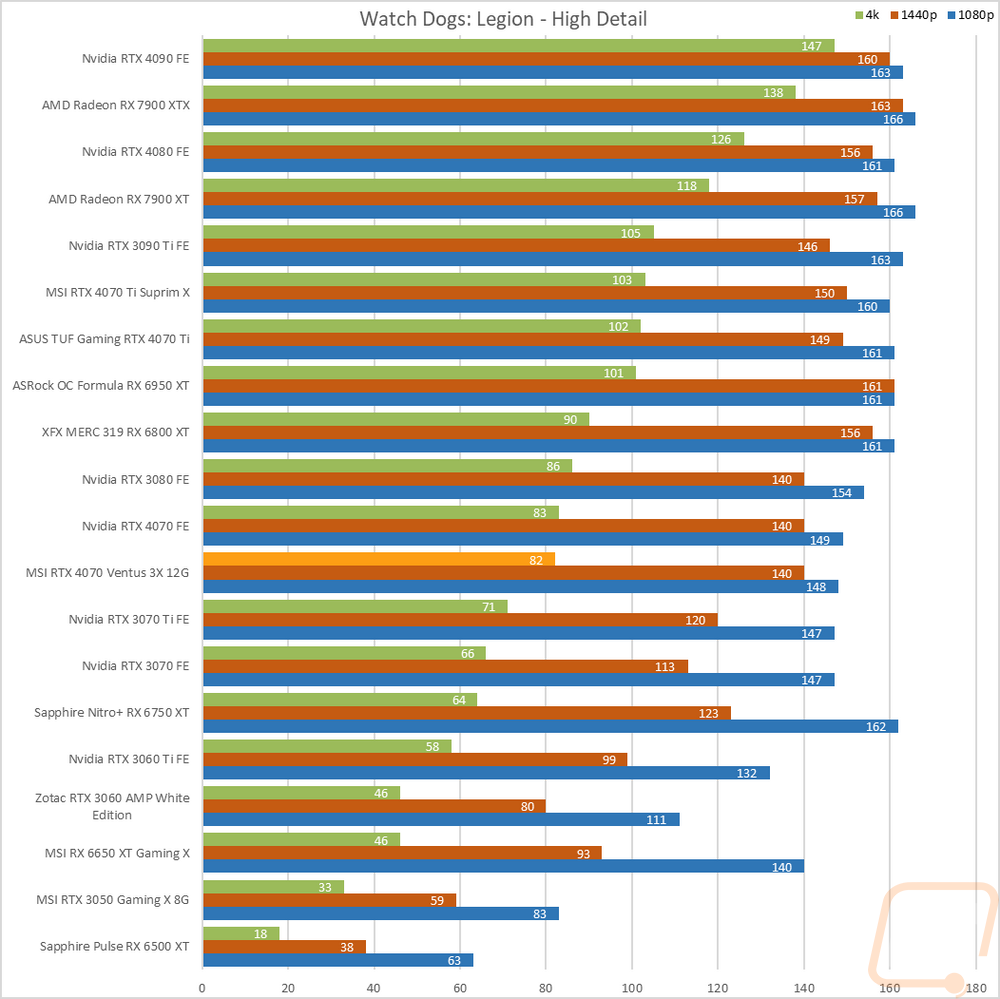
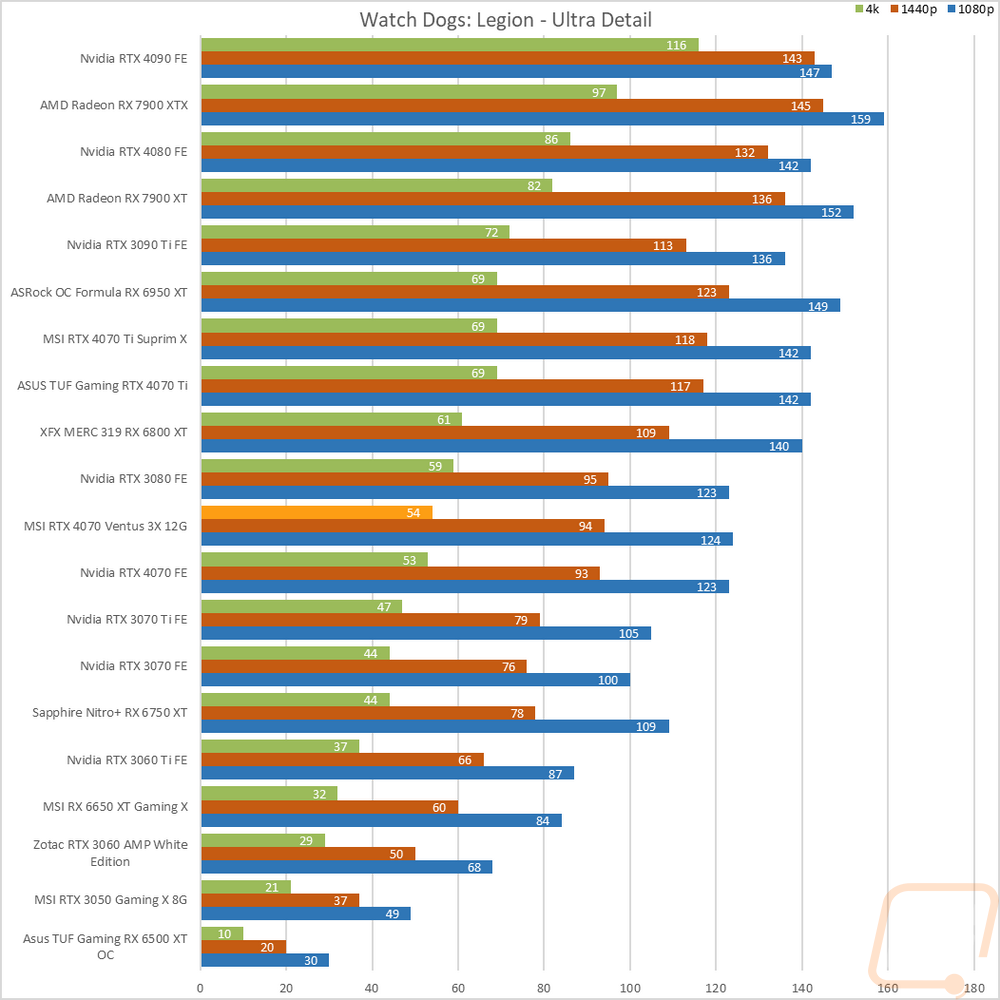
Watch Dogs: Legion |
Built-in benchmark testing at ultra and high details. Tested at 1080p, 1440p, and 4k. I also do RTX and DLSS testing on Nvidia cards at 4K using the Ultra detail settings as a base as well. |
|
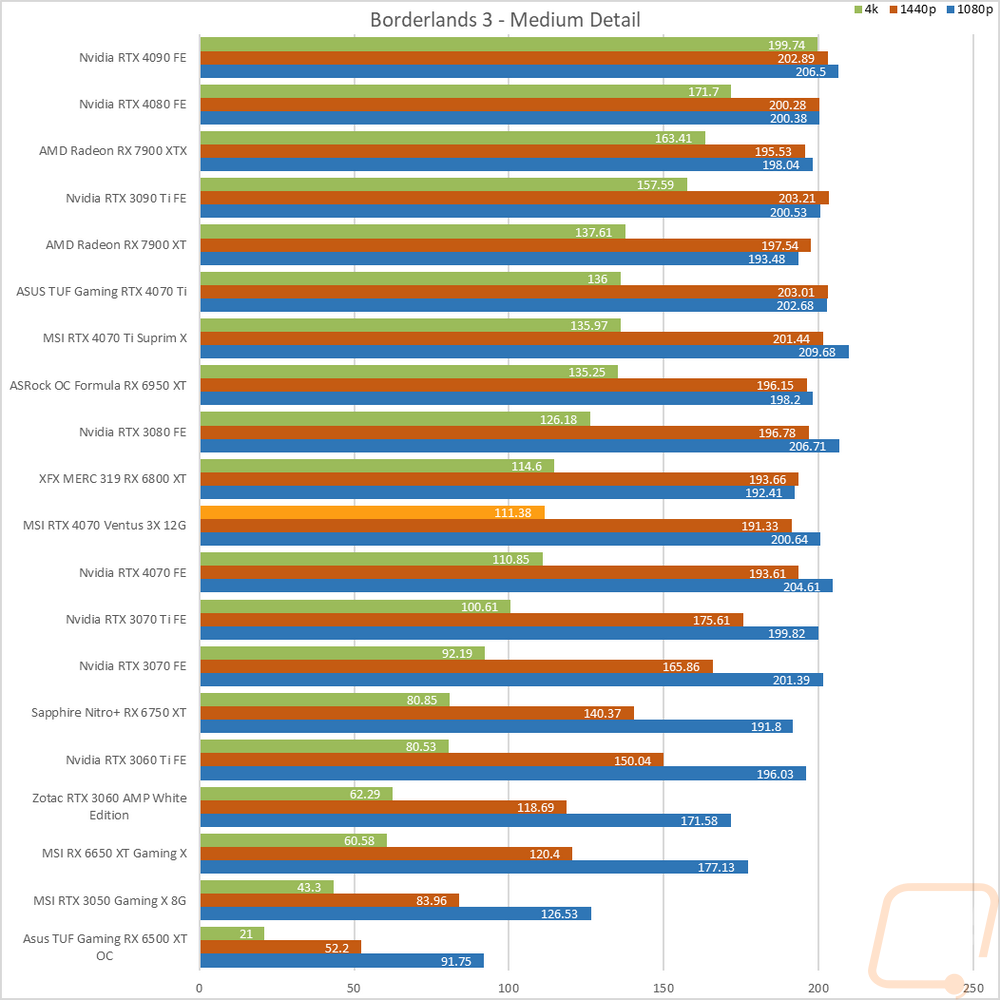
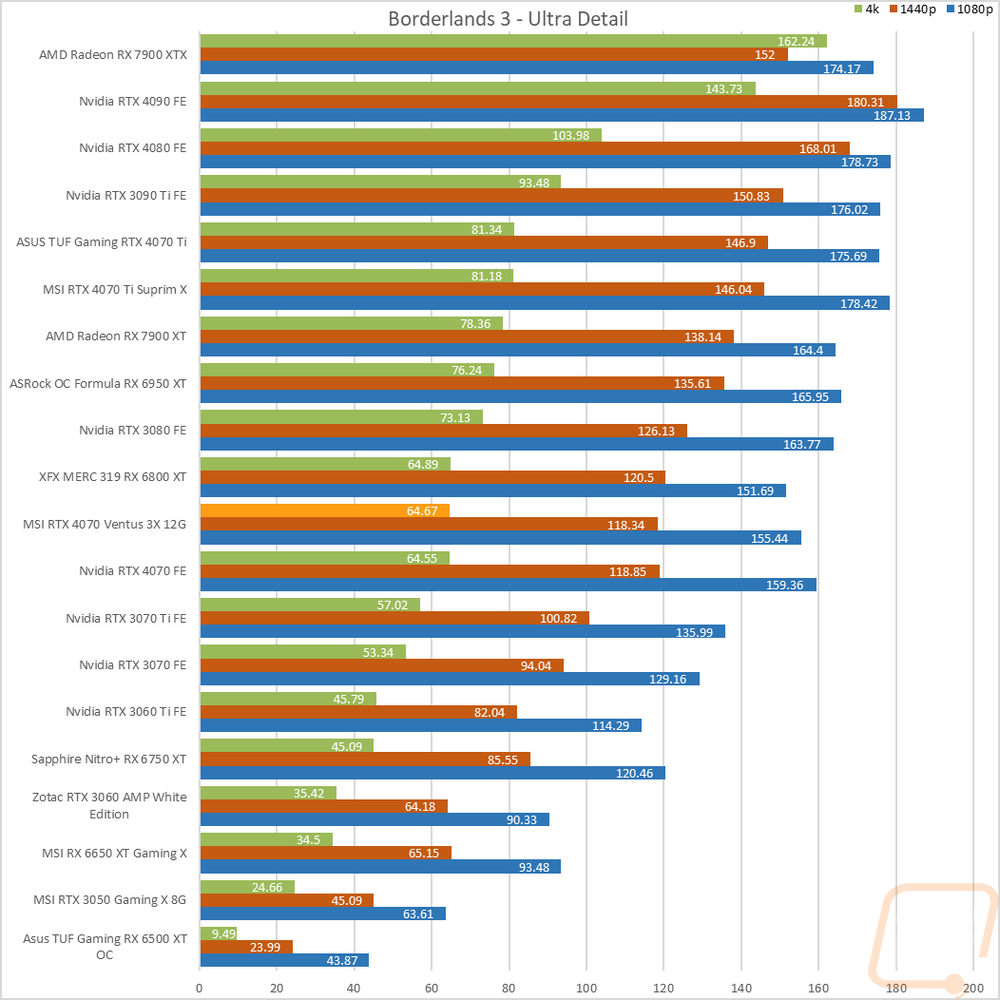
Borderlands 3 |
Built-in benchmark testing with the ultra detail setting and medium detail setting, done at full screen with default settings at 1080p, 1440p, and 4k on DX11 |
|
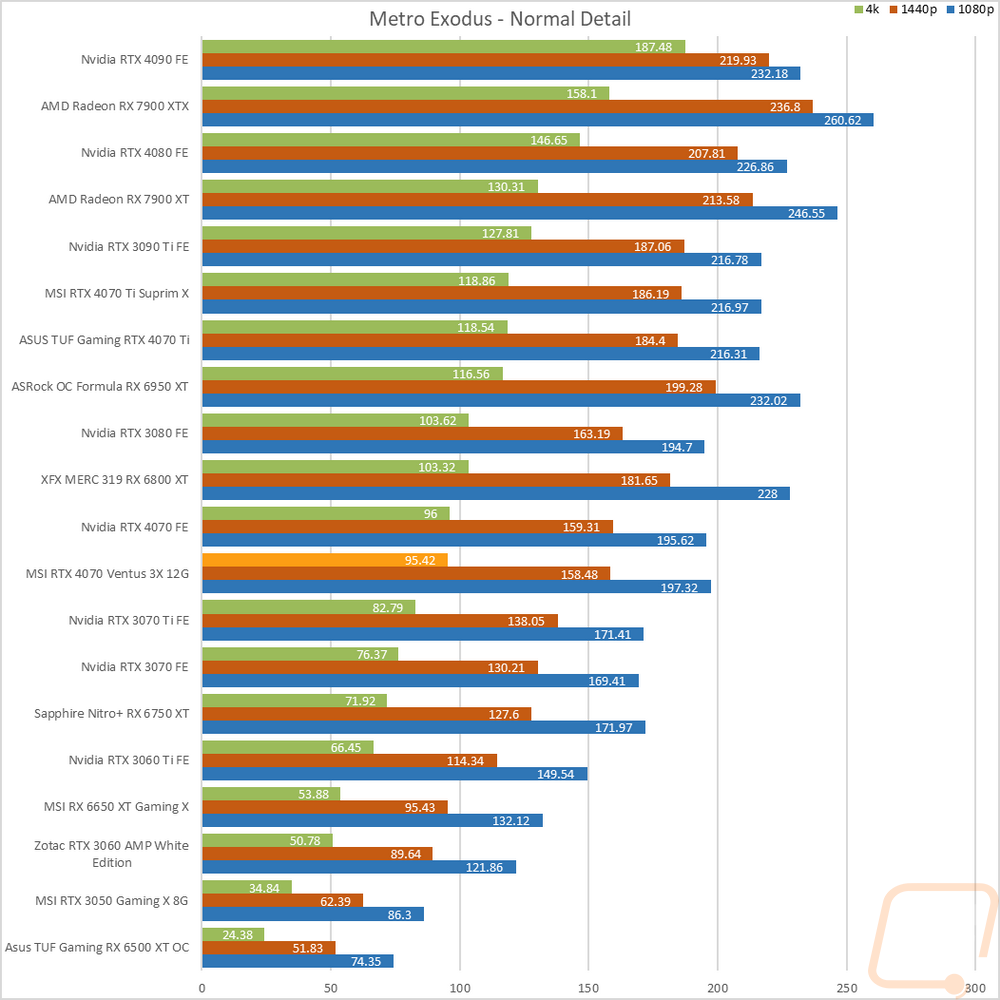
Metro Exodus |
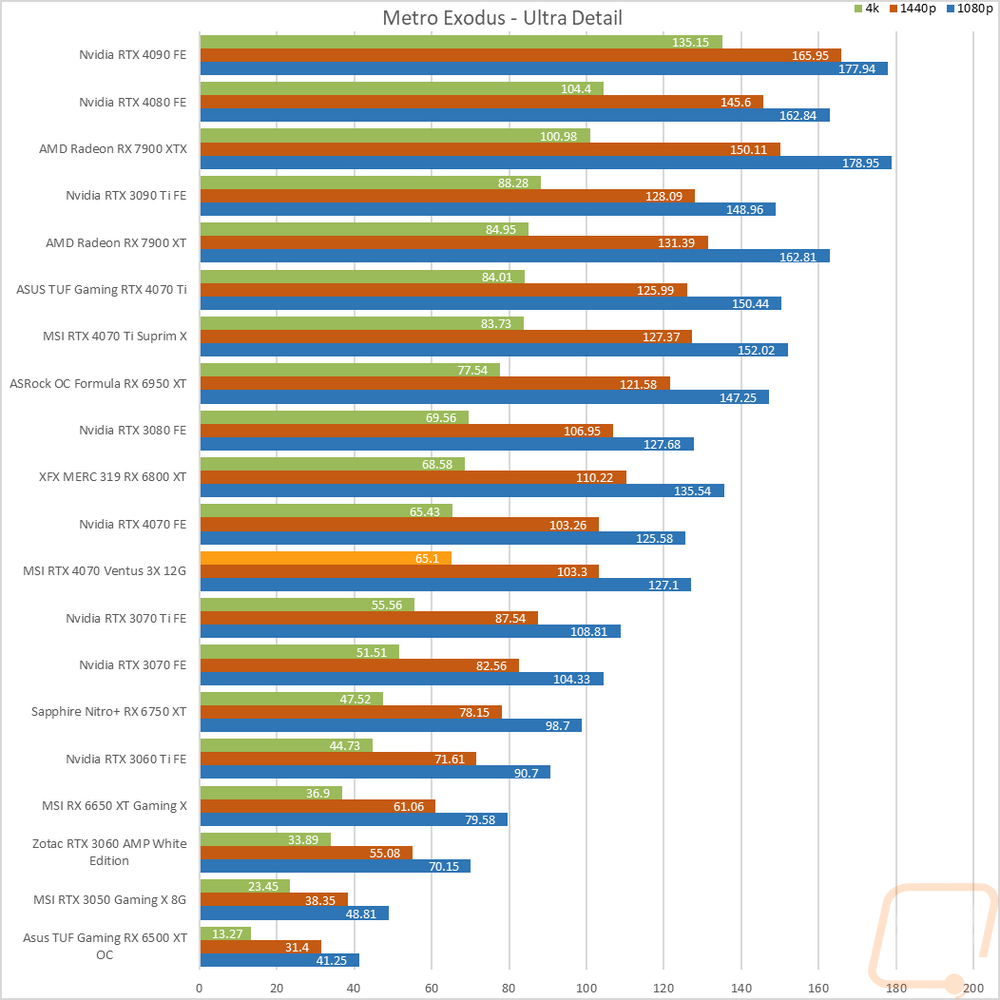
Using built-in benchmark, testing at ultra and normal details at 1080p, 1440p, and 4k. I also do RTX and DLSS testing at 4K with the ultra-detail base settings for Nvidia cards as well. |
|
World War Z Aftermath |
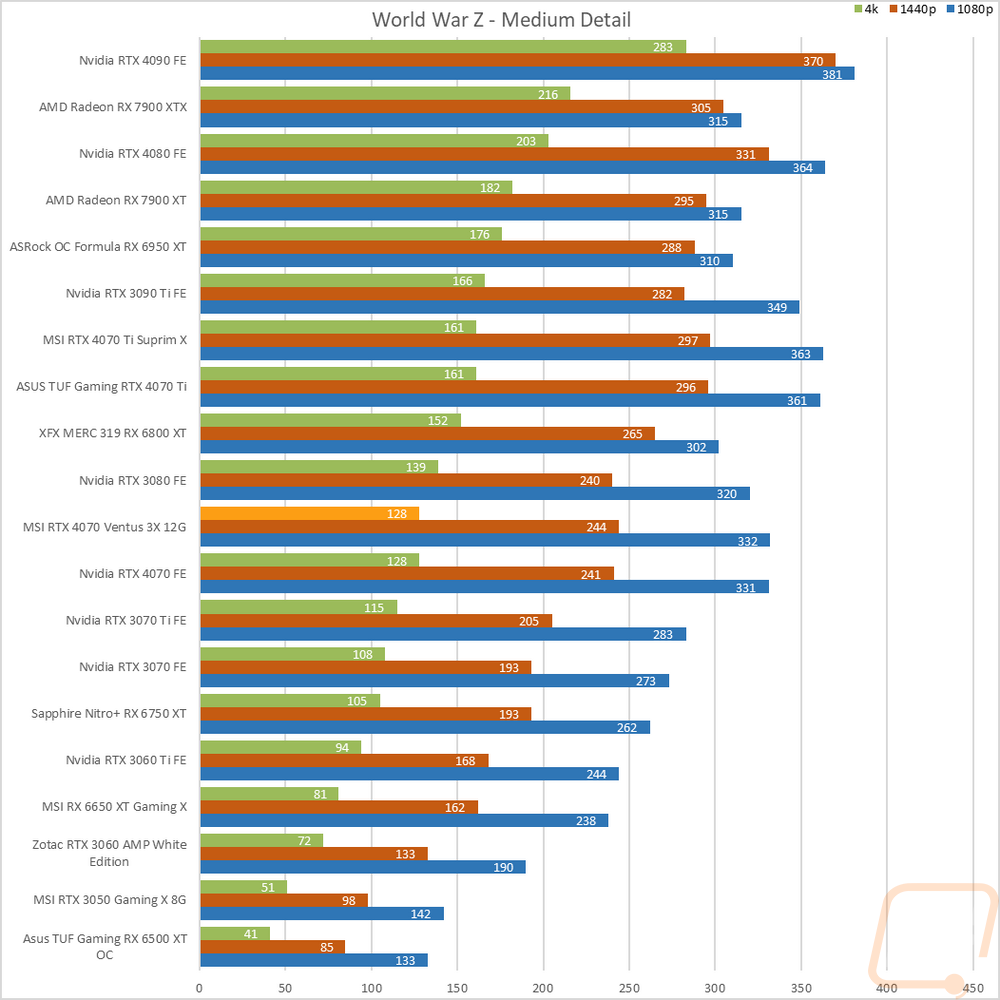
Built-in benchmark in DX11 testing both the Ultra detail and Medium detail levels at 1080p, 1440p, and 4K resolutions |
|
The Division 2 |
Built-in benchmark at Ultra detail with V-Sync turned off at 1080p, 1440p, and 4k resolutions. |
|
Total War: Three Kingdoms |
Built-in benchmark using the Battle Benchmark setting. Tested at 1080p, 1440p, and 4k at both high and ultra detail settings |
|
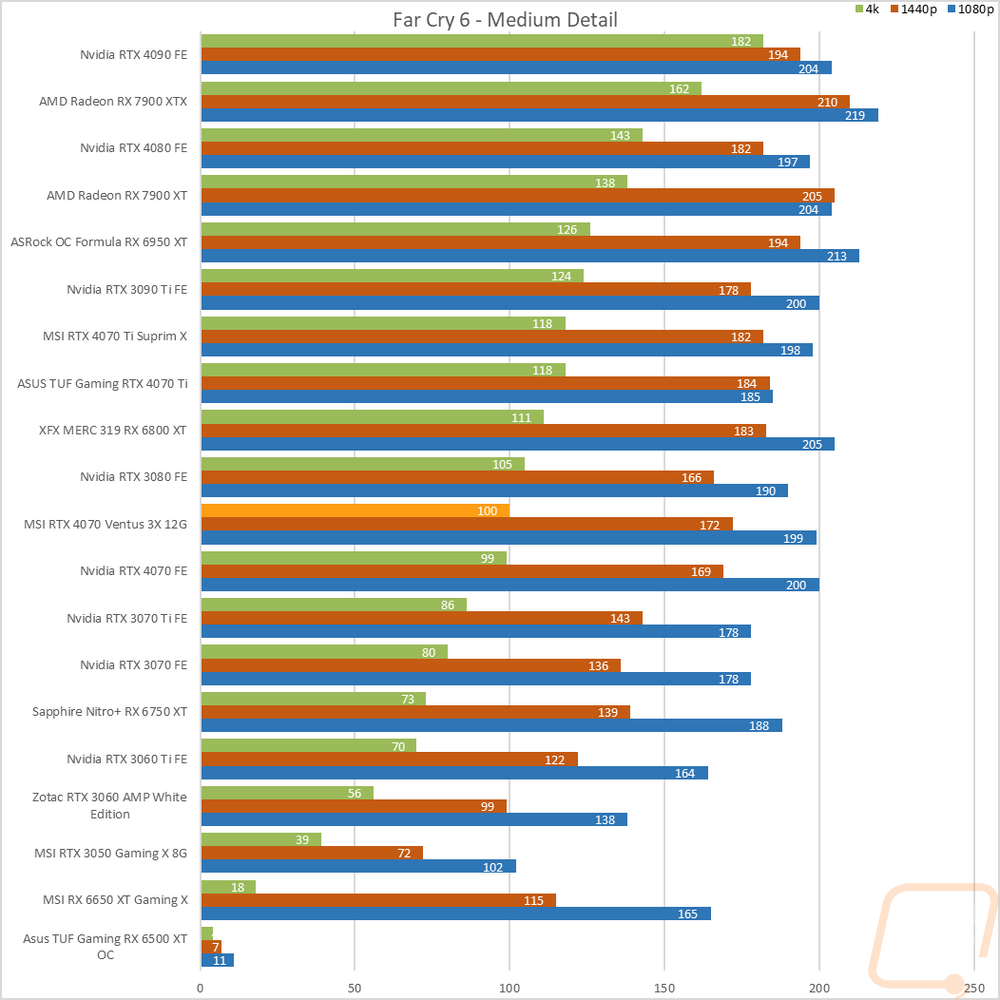
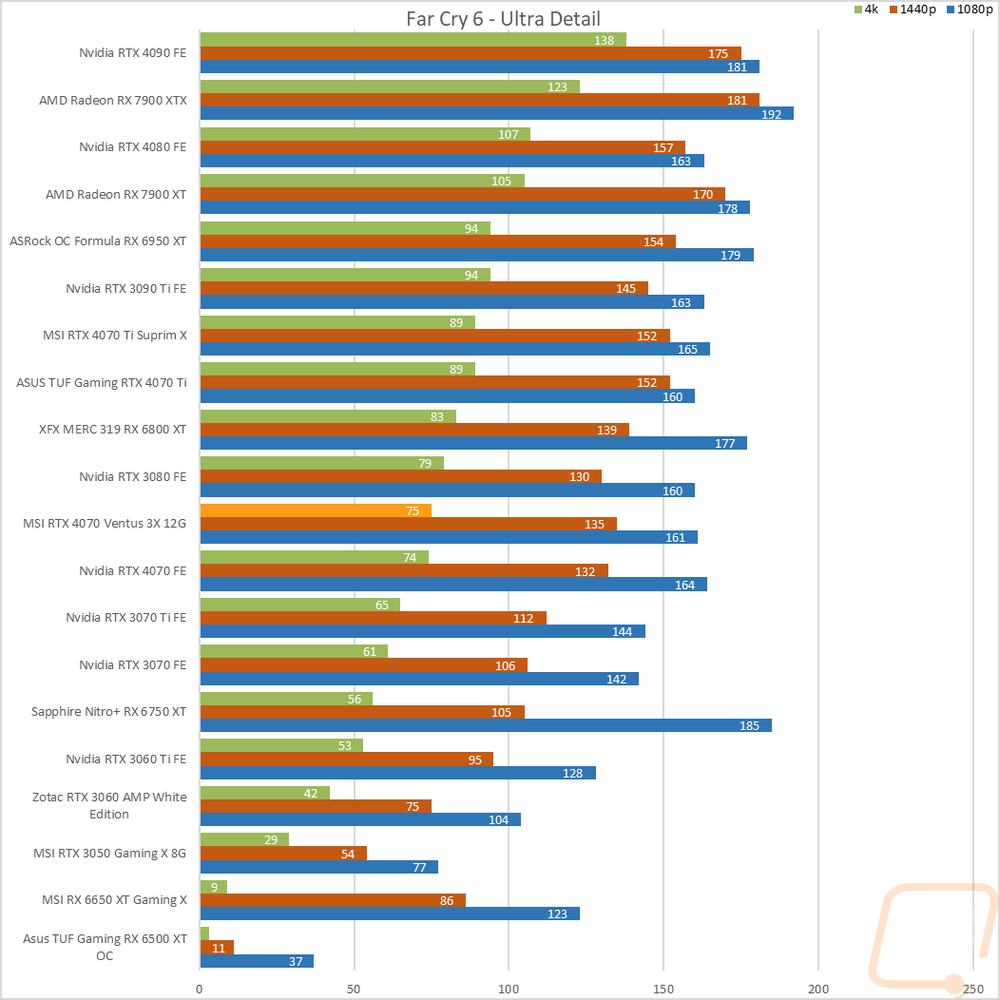
Far Cry 6 |
Built-in benchmark tested at 1080p, 1440p, and 4k with the Ultra and Medium detail settings |
|
V-Ray 5 |
V-Ray 5 benchmark us run with CUDA and RTX settings on cards that support it |
|
Boundary Benchmark |
Testing different DLSS detail levels on cards that support it. All testing is done at 4k with RTX on |
|
Bright Memory Infinite RTX Benchmark |
Benchmark all of the different RTX detail levels. Resolution at 4k and DLSS on balanced for each test |
|
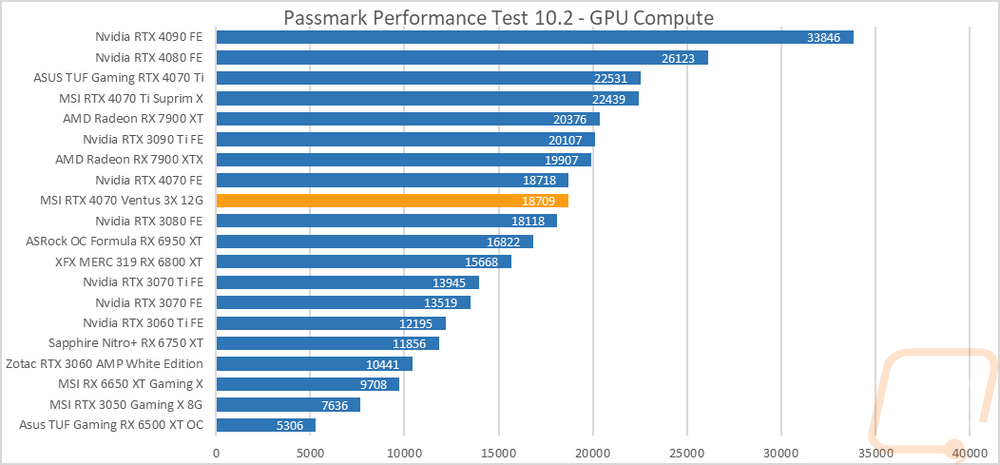
Passmark Performance Test 10.2 |
Test using the GPU Compute Score inside of PassMark's Performance Test 10.2 |
|
Blender |
Using the standard Blender Benchmark I run the test using the Blender 3.4 setting which tests using the Monster, Junkshop, and Classroom tests. |
|
OctaneBench 2020.1 |
OctaneBench is designed to test rendering in OctaneRender. RTX and non-RTX are both ran. This is a CUDA-only test so only Nvidia cards are tested |
|
Power Testing |
Using a PCat v2 to monitor power between the PCIe slot and the card as well as power through the power cables I test the peak power when running ADIA64, 3DMark Speed Way, 3DMark Time Spy Extreme, FarCry 6 at 4k and Ultra Detail, Watch Dogs Legion at 4K and Ultra detail, and Blender 3.4.0. The results are then averaged as well as the highest result. |
|
Noise Testing |
Our Noise testing is done using a decibel meter 18 inches away from the video card on the bottom/fan side of the card. We test at 50% and 100% fan speeds as well as a third test while under load using AIDA64's stress test. This is done using a Protmex PT02 Sound Meter that is rated IEC651 type 2 and ANSI S1.4 type 2. Tests are done set weighted to A and set to a slow response using the max function. The ambient noise level in the testing area is 33.3 decibels. |
|
Temperature Testing |
Using AIDA64, the GPU stress test is run for 30 minutes or until the result has leveled off. The test is run twice, once with the stock fan profile and a second time with 100% fan speed. During this, I also document the 100% fan speed RPM and document the delta between the fan profile and 100% fan speed as well as get thermal images. |
Synthetic Benchmarks
As always I like to start my testing with a few synthetic benchmarks. 3DMark especially is one of my favorites because it is very optimized in both Nvidia and AMD drivers. It's nice to not have to worry about it being favored too much either way and the repeatability of the results makes it a nice chance to compare from card to card, especially when comparing with the same GPU. In the case of the MSI RTX 4070 Ventus 3X, I have already taken a look at the RTX 4070 Founders Edition and they both have the same clock speeds. So I’m curious to see how the Ventus and the Founders Edition end up comparing.
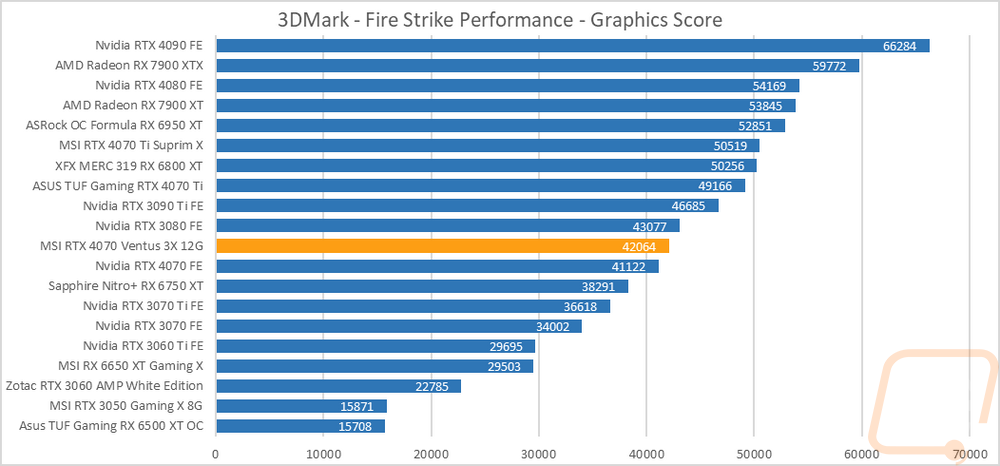
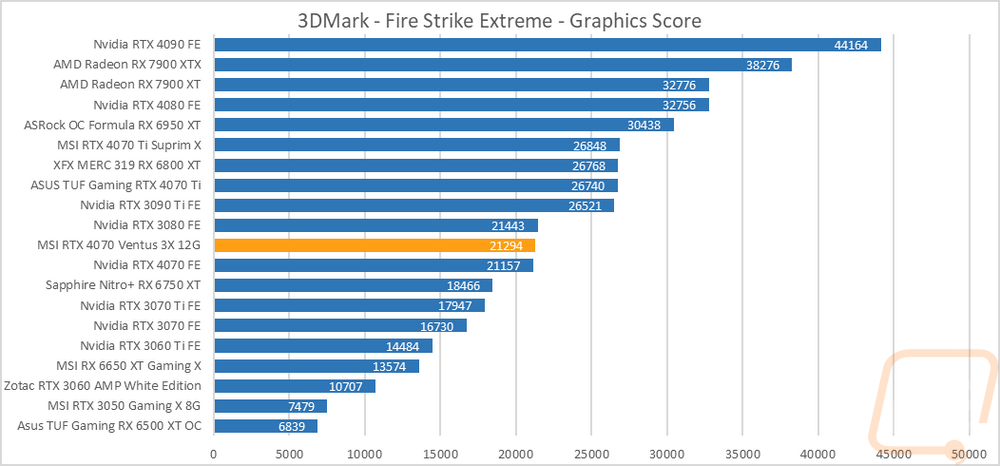
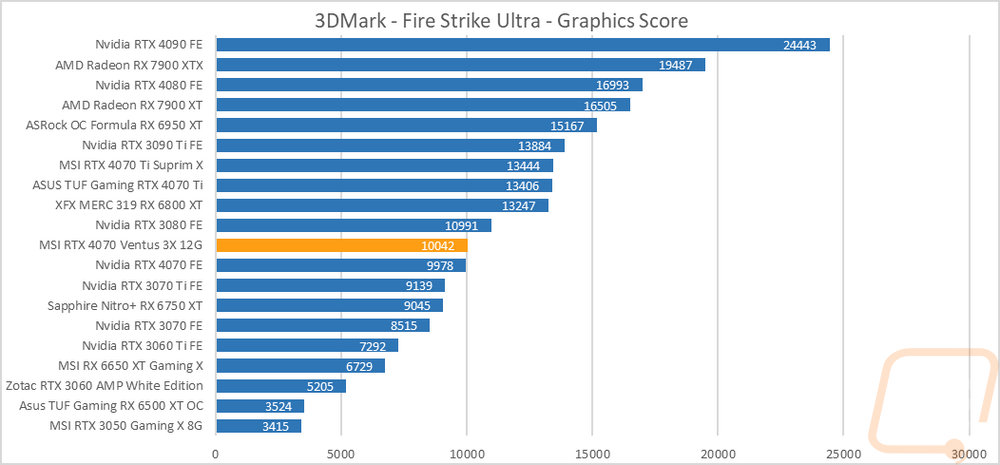
The first round of tests were done in the older Fire Strike benchmark which is a DX11 test. There are three detail levels, performance, extreme, and ultra. The RTX 4070 Ventus sits above the Founders Edition 4070 in all three tests with a larger gap in the base Fire Strike test than I would have expected. This puts it behind the RTX 3080 still of course in all three tests.
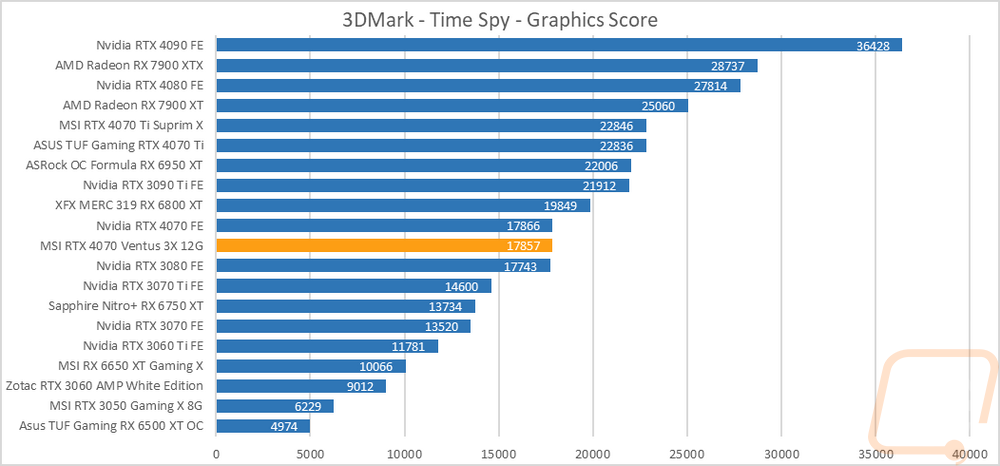
The next two were both based on the Time Spy benchmark. One is the standard test and then there is the extreme detail level. The RTX 4070 Ventus came in behind the Founders Edition in both tests by a few points sitting right between the 4070 FE and the RTX 3080 in the base Time Spy test
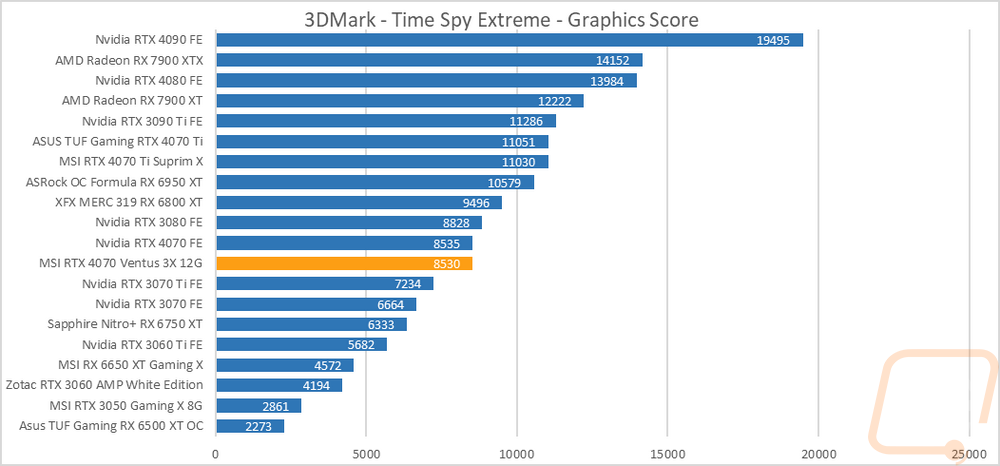
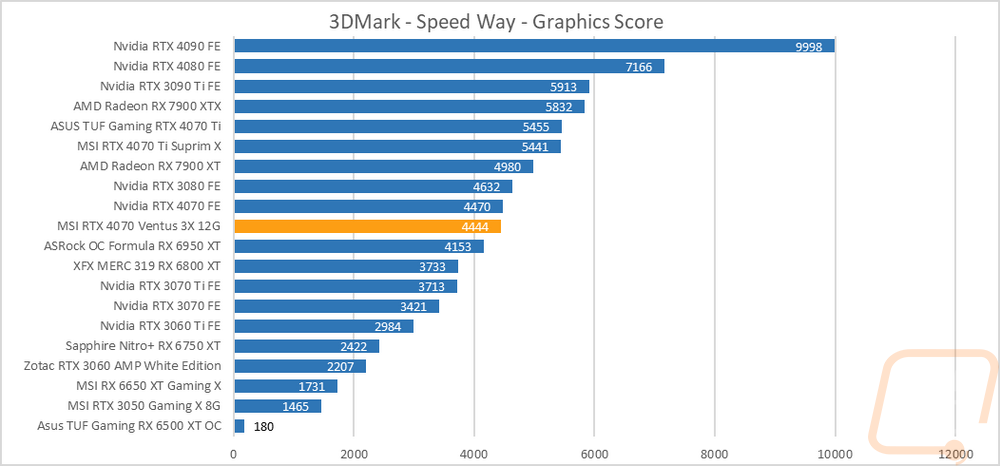
I did also test using the new 3DMark Speed Way which is their latest benchmark. Speed Way is DX12 as well but combines in more future-focused tech like Ray Tracing which up until now 3DMark has only used in feature tests. Like with Time Spy the RTX 4070 Ventus is just a hair behind the Founders Edition card but not enough to make any difference at all. This puts both cards under the RTX 3080 and above the 6950 XT.
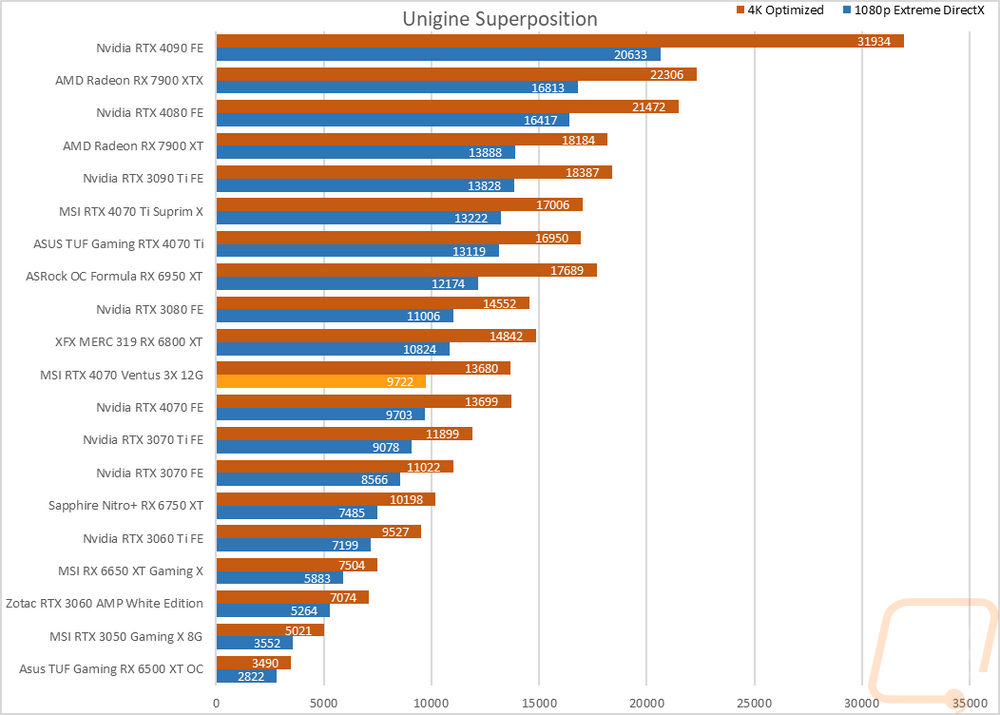
The last test was using the Unigine-based Superposition benchmark and I tested at 1080p with the extreme detail setting as well as the 4K optimized setting. In the extreme detail setting the RTX 4070 Ventus edged out the 4070 Founders Edition for the 1080p Extreme test and is 19 points behind it in the 4k Optimized test. This was behind the 6800 XT for both cards and ahead of the 3070 Ti.
VR Benchmarks
As for Virtual Reality, I love it but it is more demanding than traditional gaming. This is partially because of the resolutions needed to render for two eyes and because they render more than what is immediately visible. But also because of post effects to get the proper “fisheye” effect for it to look proper in your eyes with the HMD. You also have to have much higher expectations for frame rates in VR, skipping frames or lower FPS can cause motion sickness in VR. Because of that, I ran a few tests.
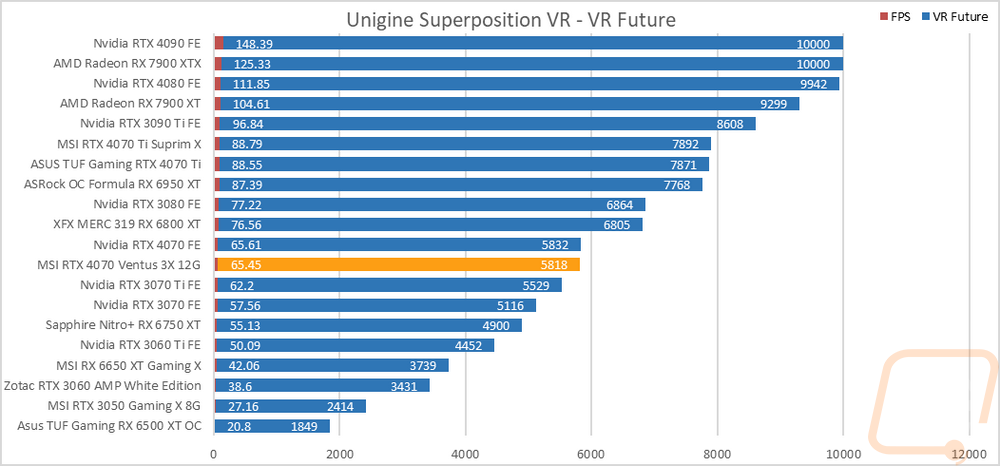
My first test was again in Superposition. This time I tested the VR Future test using the Oculus resolution. I have also included the average frame rate as well which is important for the cards at the top of the chart because for some reason Superposition is capped at 10,000 for its scores and that doesn’t show the performance gap in those cards at the top. The RTX 4070 Ventus is 14 points below the 4070 Founders Edition which was a difference of .16 of an FPS. This is below the 6800 XT and 380 which performed similarly and above the 3070 Ti.
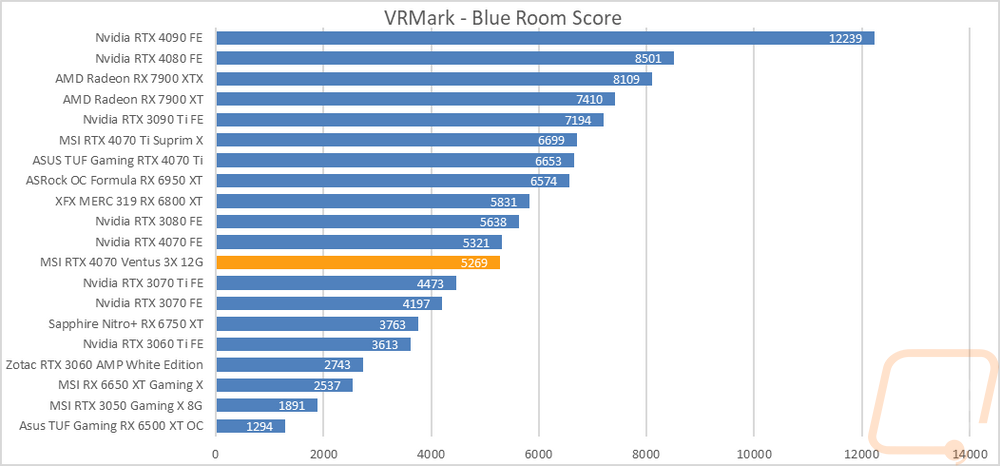
My second round of VR testing was in VRMark which has three tests that are similar to the VR tests in Superposition. I only focused on just the most demanding test called Blue Room which is looking more at future VR performance. The RTX 4070 Ventus was once again a little below the Founders Edition and is sitting under the 3080 and above the 3070 Ti just like in Superposition.
In-Game Benchmarks
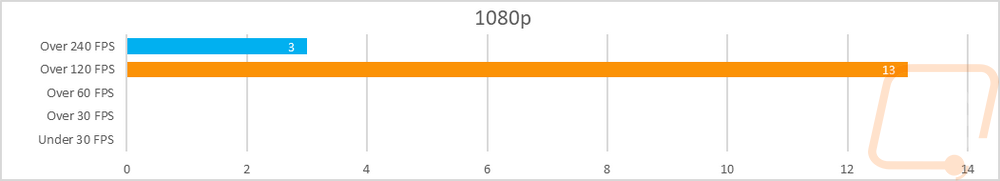
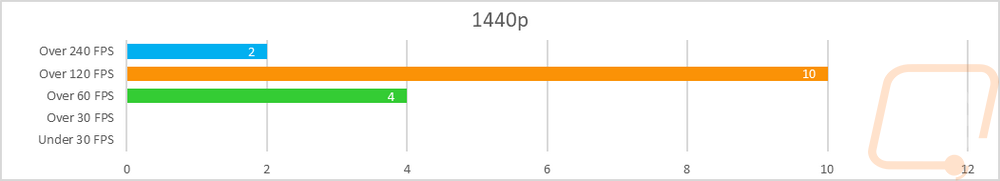
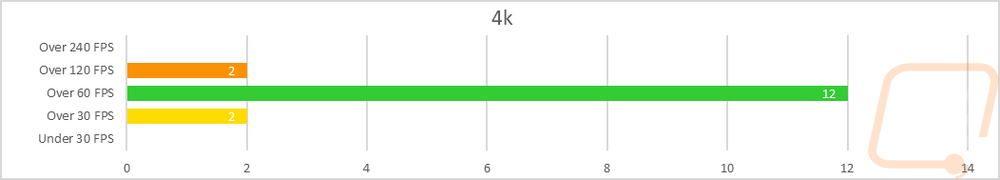
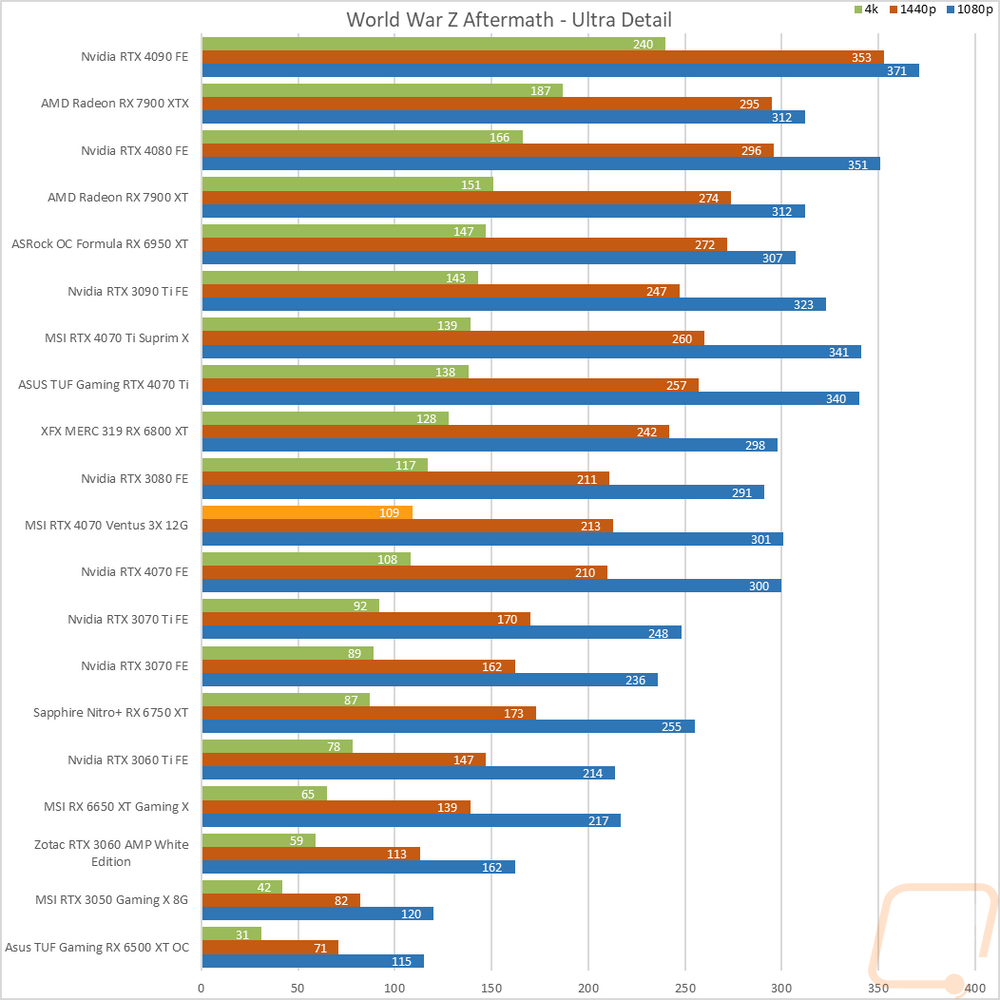
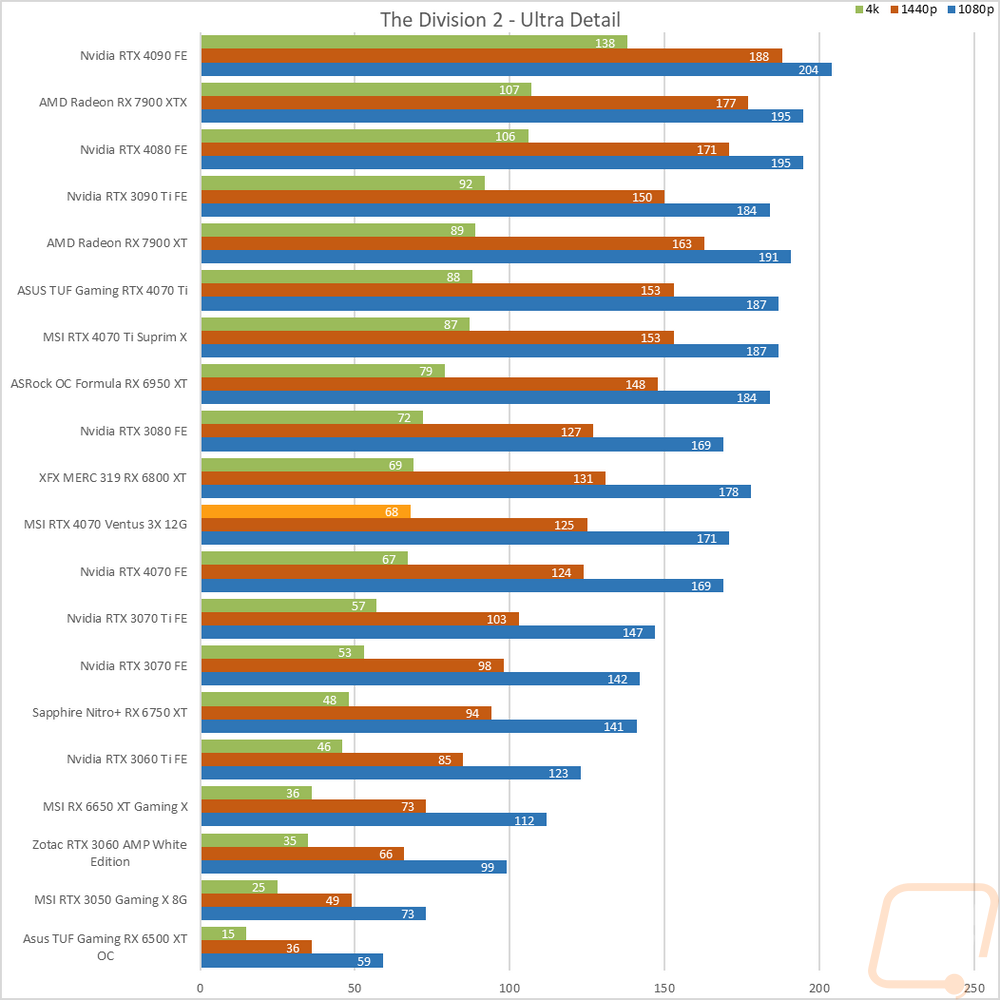
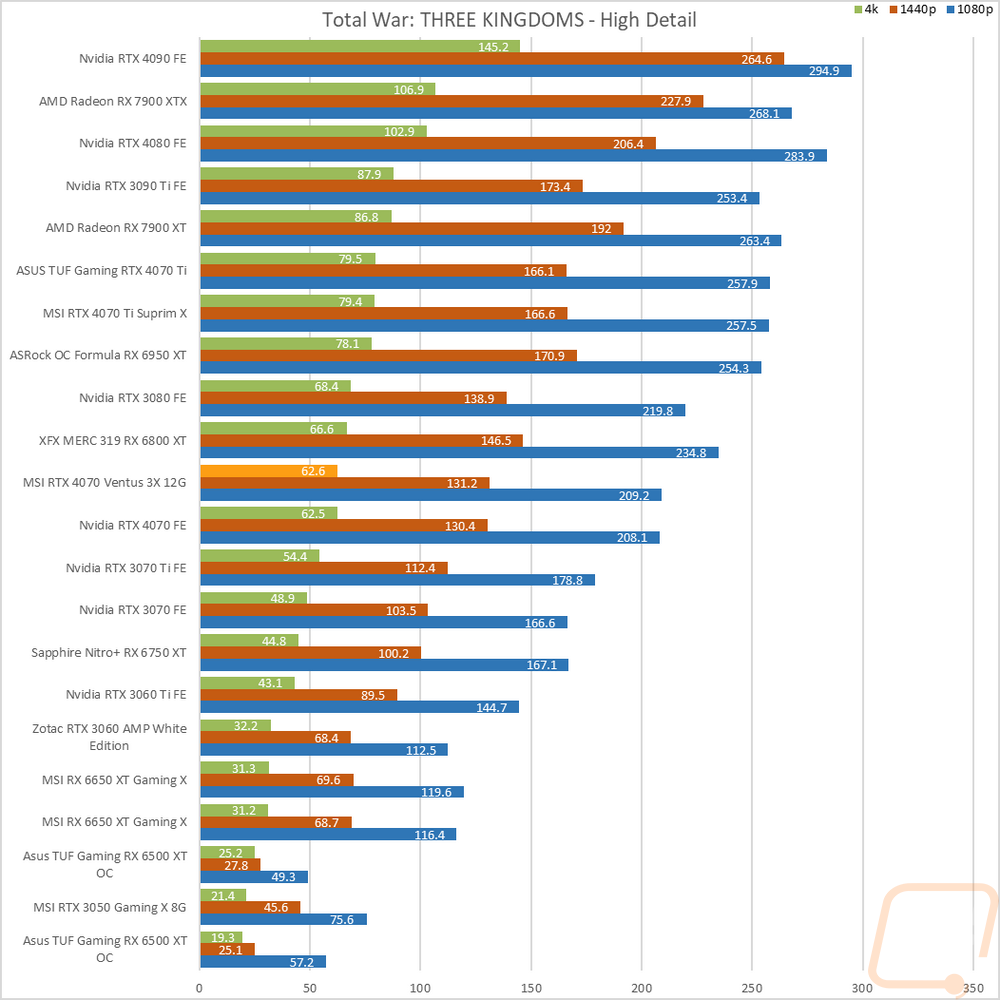
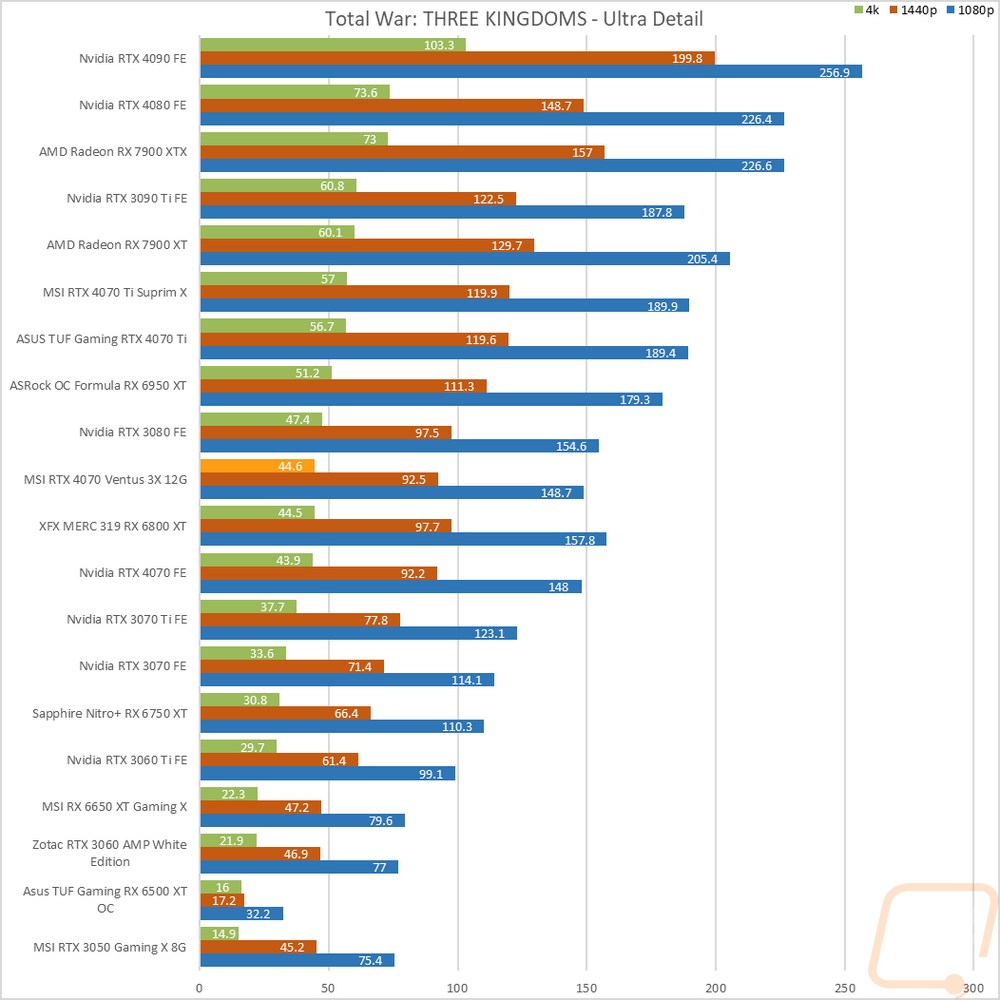
Now we finally get into the in game performance and that is the main reason people pick up a new video card. To test things out I ran through our new benchmark suite that tests 10 games at three different resolutions (1080p, 1440p, and 4k). Most of the games tested have been run at the highest detail setting and a mid-range detail setting to get a look at how turning things up hurts performance and to give an idea of if turning detail down from max will be beneficial for frame rates. In total, each video card is tested 54 times and that makes for a huge mess of results when you put them all together. To help with that I like to start with these overall playability graphs that take all of the results and give an easier-to-read result. I have one for each of the three resolutions and each is broken up into four FPS ranges. Under 30 FPS is considered unplayable, over 30 is playable but not ideal, over 60 is the sweet spot, and then over 120 FPS is for high refresh rate monitors.
So how did the MSI RTX 4070 Ventus 3X do when we check out the performance by resolution? Well at 1080p there wasn’t a result that came in below 120 FPS and three were even up over 240 FPS. Then at 1440p, the resolution that Nvidia is targeting with the RTX 4070 it had 4 out of the 16 results sitting over 60 FPS but under 120 FPS. 10 results were in the 120-239 FPS range and then two were still up over 240 FPS. In other words, everything was playable and most are well beyond that with high refresh rates possible. Then last up at 4K only two results were over 120 FPS and there were two results under 60 FPS, but even though the card isn’t designed for 4K use most of the results still fell in the 60-119 range. As for the RTX 4070 Ventus specifically, none of these results were different from the RTX 4070 Founders Edition.
I did also average out all of the results with the exception of CS:GO which I didn’t include because its crazy high numbers mess up the overall average and wouldn’t give the best idea of performance. I have also included the Nvidia and AMD cards in the same price range and around the 4070 in performance as well as the RTX 4070 Founders Edition so we can see how the MSI RTX 4070 Ventus 3X compares. For the two 4070s which have the same clock speeds both cards are right with each other at all three resolutions no surprises there with the Ventus just slightly ahead in all three results. Both 4070s are ahead of the RTX 3080 at 1080p and the Ventus is also ahead at 1440p with the RTX 3080 gaining on them in the 4K results. As for the AMD cards, at 1080p both aren’t that far ahead but the gap widens at 1440p and 4K. As for the individual results, we can see that even with the 4070 being lower performance than the rest of the 4000 Series cards it is still seeing CPU-limited results across all of the 1080p results and some of the 1440p results as well especially Borderlands 3 on the medium detail setting. Beyond that, none of the results stand out really and line up with what we are seeing in the averages.
|
Average FPS (w/o CS:GO) |
1080p |
1440p |
4K |
|
RTX 3070 TI |
165.78 |
126.73 |
74.2 |
|
RTX 3080 |
188.35 |
148.9 |
89.9 |
|
RTX 4070 |
190.62 |
148.64 |
83.48 |
|
MSI RTX 4070 Ventus 3X |
190.89 |
148.96 |
83.98 |
|
6800 XT |
197.08 |
162.35 |
92.37 |
|
6950 XT |
205.27 |
177.19 |
105.8 |
|
4070 Ti |
212.87 |
174.42 |
103.72 |

Compute Benchmarks
Now some people don’t need a video card for gaming, they need the processing power for rendering or 2D/3D production, or in some cases people who game also do work on the side. So it is also important to check out the compute performance on all of the video cards that come in. That includes doing a few different tests. My first test was a simple GPU Compute benchmark using PassMark's Performance Test 10 and the RTX 4070 Ventus is below the Founders Edition Here by 9 points. More importantly, both cards are out in front of the RTX 3080 and sitting behind the 7900 XTX.
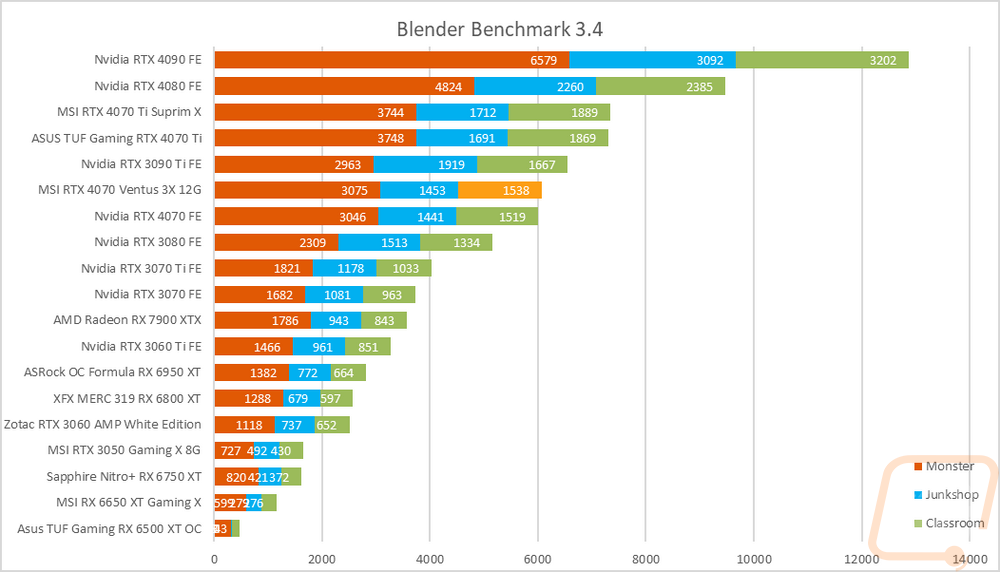
Blender is always my favorite compute benchmark because the open-source 3D rendering software is very popular and it isn’t a synthetic benchmark. With the latest version of Blender, they redid the benchmark so we now have a new test that runs three different renderings and gives each a score. I have all three stacked together so we can see the overall performance. The RTX 4070 Ventus was back in front of the Founders Edition 4070 here in all three tests which added up to a bigger margin than you would expect everything considered. Both cards sit below the 3090 Ti and above the RTX 3080 with a larger gap between them and the 3080 than the 3090 Ti on this one.
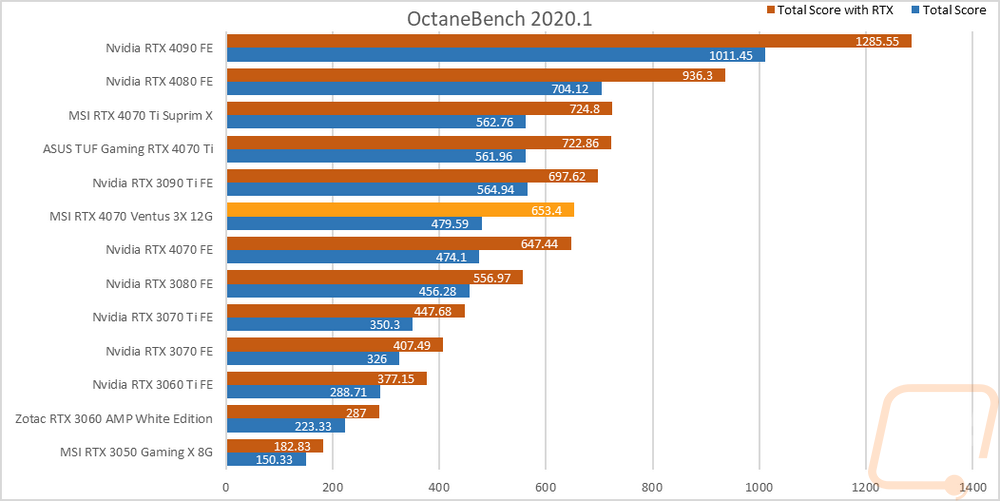
For CUDA-based cards, I also check out OctaneRender performance using their OctaneBench 2060.1 benchmark which allows me to check out both RTX and non-RTX rendering performance. The RTX 4070 Ventus scored 479.59 without RTX which was 5 points ahead of the Founders Edition 4070 and 653.4 for the RTX test which was 6 points ahead of the 4070 FE. Both cards are behind the 3090 Ti here and ahead of the RTX 3080. The gap in performance between the RTX 4070 and the RTX 3080 is small on the non-RTX test but with RTX they are much farther ahead.
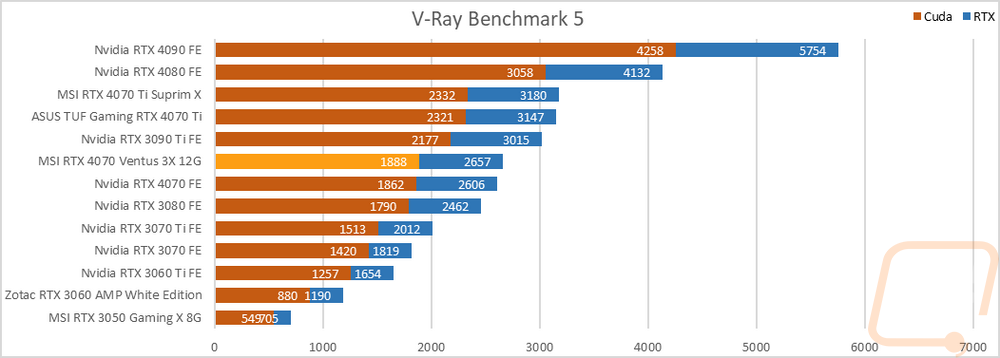
An additional CUDA-based test I also ran V-Ray Benchmark 5 to check out CUDA and RTX performance in the 3D rendering and simulation software. The RTX 4070 Ventus 3X outperformed the Founders Edition in both the CUDA and RTX tests here by a small amount. Both cards are out in front of the RTX 3080 as well.
RTX and DLSS
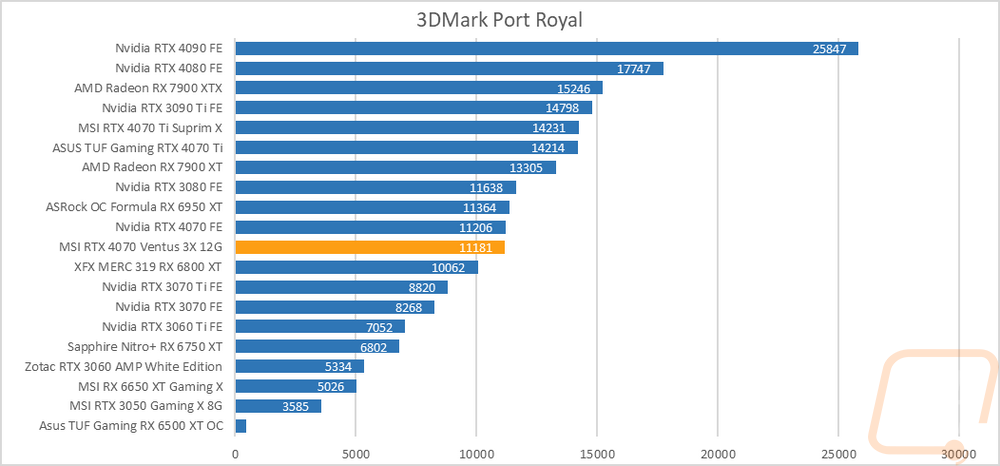
Being an RTX card I also like checking out the performance of some of Nvidia’s features. Namely the ray tracing performance and the performance improvements you can see by using DLSS combined with the tensor cores. My first test goes back to our synthetic benchmarks with 3DMark where I check out their Port Royal benchmark. This is the one test that does also have AMD Ray Tracing support which is great to get a look at how different cards including older non-RTX cards perform. The RTX 4070 Ventus scored 11181 which was 25 points below the RTX 4070 Founders Edition. The two 4070’s, the 6950 XT, and the 3080 are all close together here in performance.
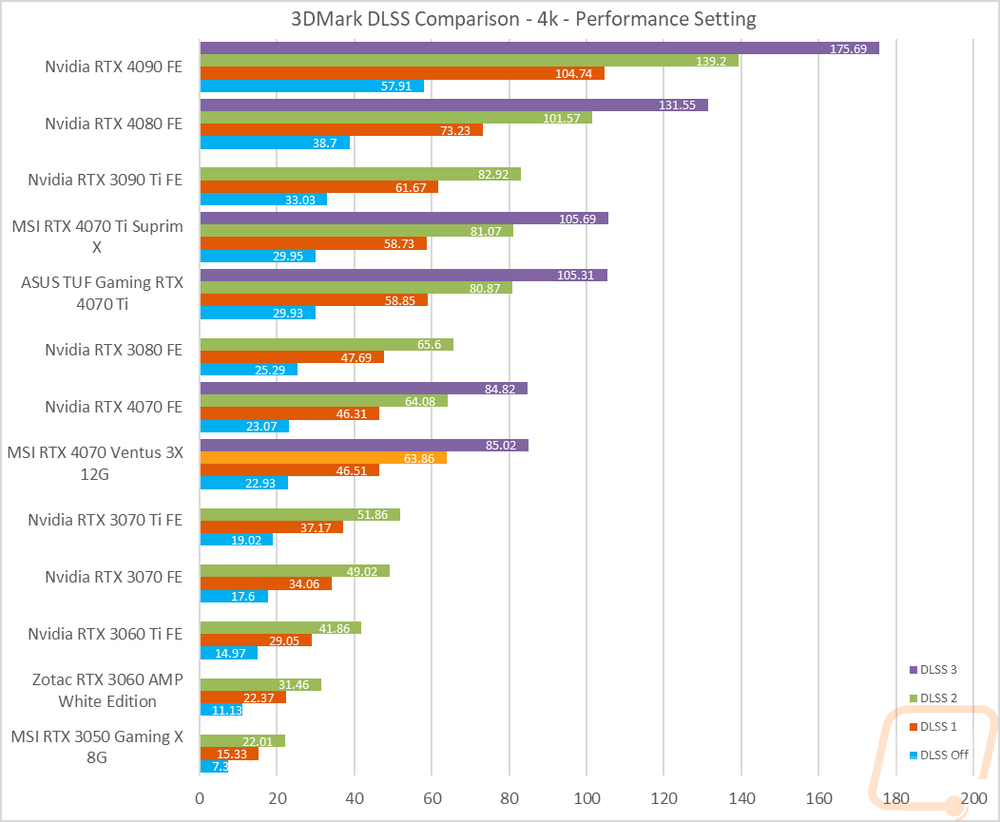
3DMark also has added in a few feature tests, one being a look at DLSS performance. For this one, I have the resolution set to 4K and I test with all three versions of DLSS as well as with it off completely. All DLSS are set to their performance setting as well to keep the results comparable. This gives us a great look at the performance improvements that DLSS has given with DLSS 3 also including frame generation. The RTX 4070 Ventus’s numbers are right on with the Founders Edition, no surprises there with both having the same clock speed. With DLSS 2 both cards are just 1 FPS lower than the RTX 3080. More importantly, this shows you how much more performance DLSS 3 can get you and how much each generation has improved things going from 22.93 FPS with no DLSS and with DLSS 3 at 85.02 FPS nearly four times the performance.
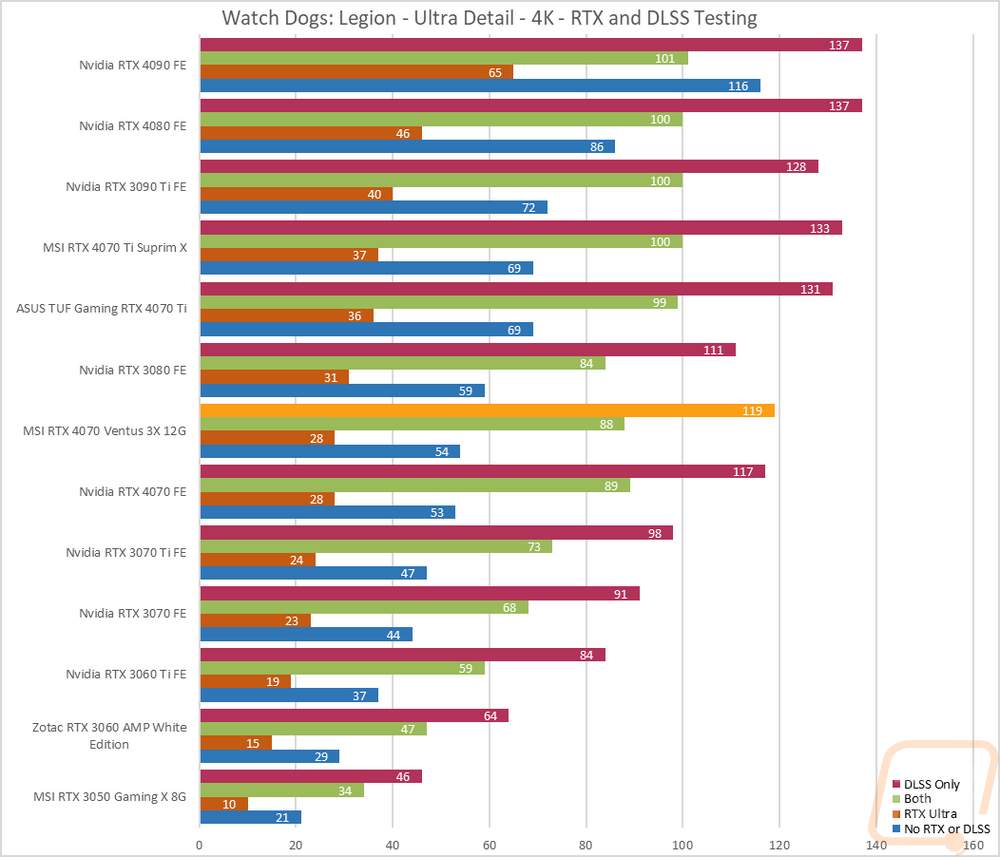
I then jumped into game tests, this time with Watch Dogs: Legion. For this one, I wanted to get an idea of the performance you will see when taking advantage of Nvidia’s RTX and DLSS features. I tested at 4k with the ultra detail setting and with ultra being the setting for DLSS and RTX when they are on as well. I then test with no RTX or DLSS on and then with RTX DLSS on and off and on together. Here the RTX 4070 Ventus matched the 40 Founders Edition in two of the four results, then was faster in the DLSS Only test by 2 FPS and 1 FPS lower in the combined result. While this graph is sorted by the all-off result both 4070s outperformed the RTX 3080 in both of the tests that had DLSS on but were behind it in the RTX-only test.
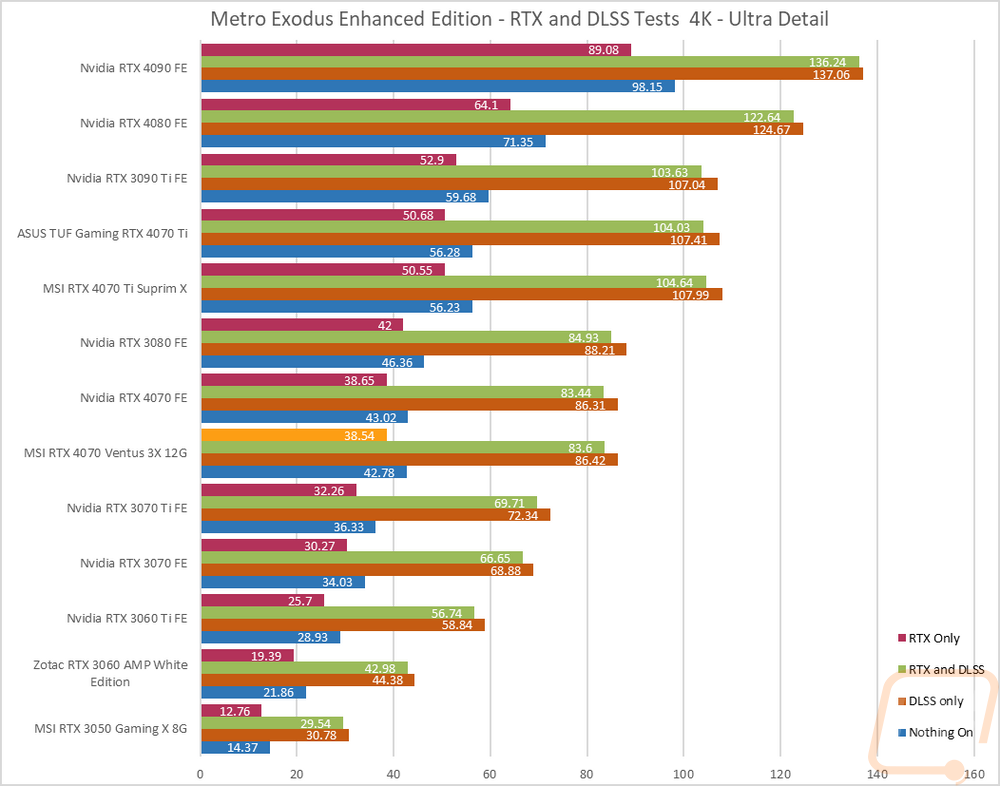
Next, I wanted to check out the performance in Metro Exodus which we have used for testing for a long time now. This test is similar as well with it set to 4K and Ultra detail, I use the included benchmark to test DLSS and RTX individually and then with them both on and both off to give us a look at overall frame rates depending on which direction you go. I should point out that this is using the Enhanced Edition where our normal benchmark uses the standard version for testing with AMD but that version DLSS no longer works. That said the RTX 4070 Ventus is ahead of the 4070 Founders Editon in the RTX-only result but sorted below it because of the nothing-on result which has it .24 of an FPS below it. Both cards are close to the RTX 3080 and well out in front of the RTX 3070 Ti which is the next lowest card on the chart.
Cooling Noise and Power
For my last few tests, rather than focusing on in game performance, I like to check out other aspects of video card performance. These are also the most important ways to differentiate the performance between cards that have the same GPU. To start things off I took a look at power usage.
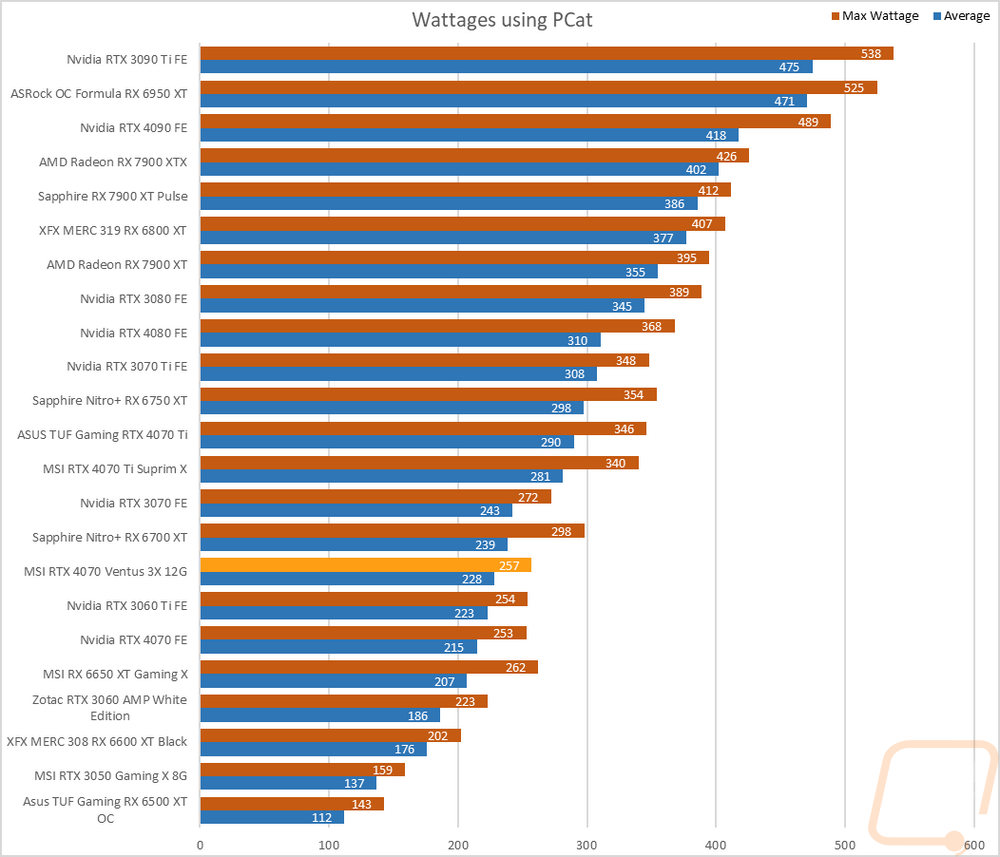
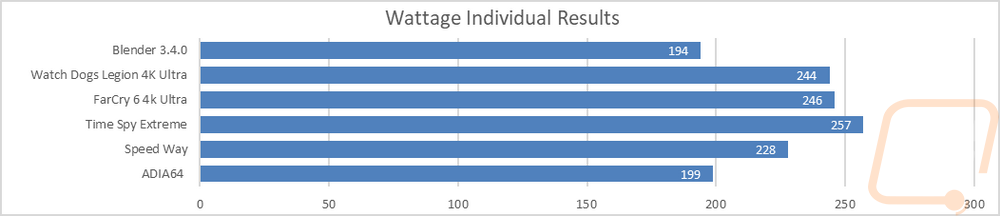
For this, our new test setup utilizes the Nvidia-designed PCat v2 along with cables to handle both traditional 6 or 8-pin connections as well as the new 12VHPWR. The PCat also utilizes a PCIe adapter to measure any power going to the card through the PCIe slot so we can measure the video card wattage exclusively, not the entire system as we have done in the past. I test with a mix of applications to get both in game, synthetic benchmarks, and other workloads like Blender and AIDA64. Then everything is averaged together for our result. I also have the individual results for this specific card and I document the peak wattage result as well which is almost always Time Spy Extreme. The MSI RTX 4070 Ventus 3X averaged 228 watts across all of the tests and peaked at 257. The peak wattage was just 4 watts higher than the Founders Edition 4070 but the average was higher at 13 watts more than the Founders Edition even with them both having the same clock speed. It looks like MSI adjusted the power profile slightly.
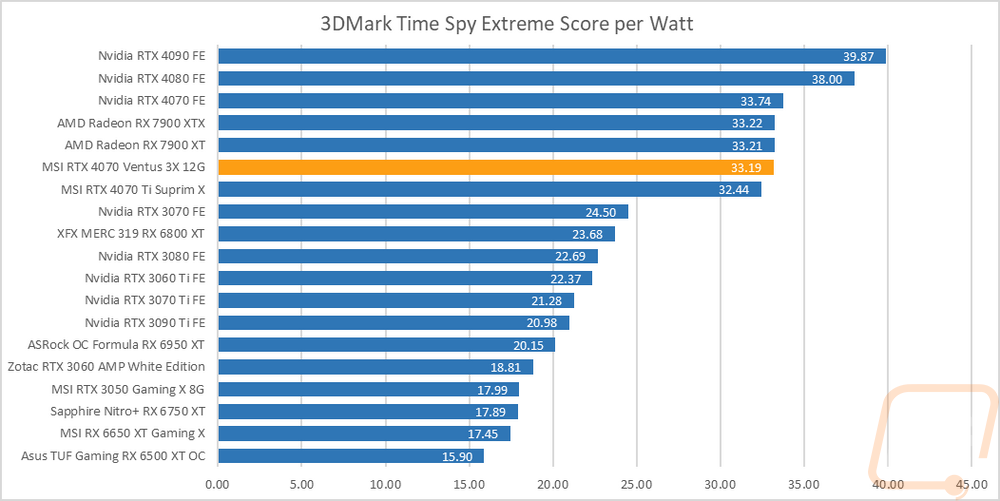
Having exact peak wattage numbers when running Time Spy Extreme I was also able to put together a graph showing the total score for each watt that a card draws which gives us an interesting look at overall power efficiency in the popular and demanding benchmark. The change in power usage as well as the Time Spy result for the MSI RTX 4070 Ventus 3X being slightly behind the Founders Edition also affects the score per watt chart putting it behind the 4070 FE by .55 which is enough to drop it down below the 7900 XT and 7900 XTX reference cards.
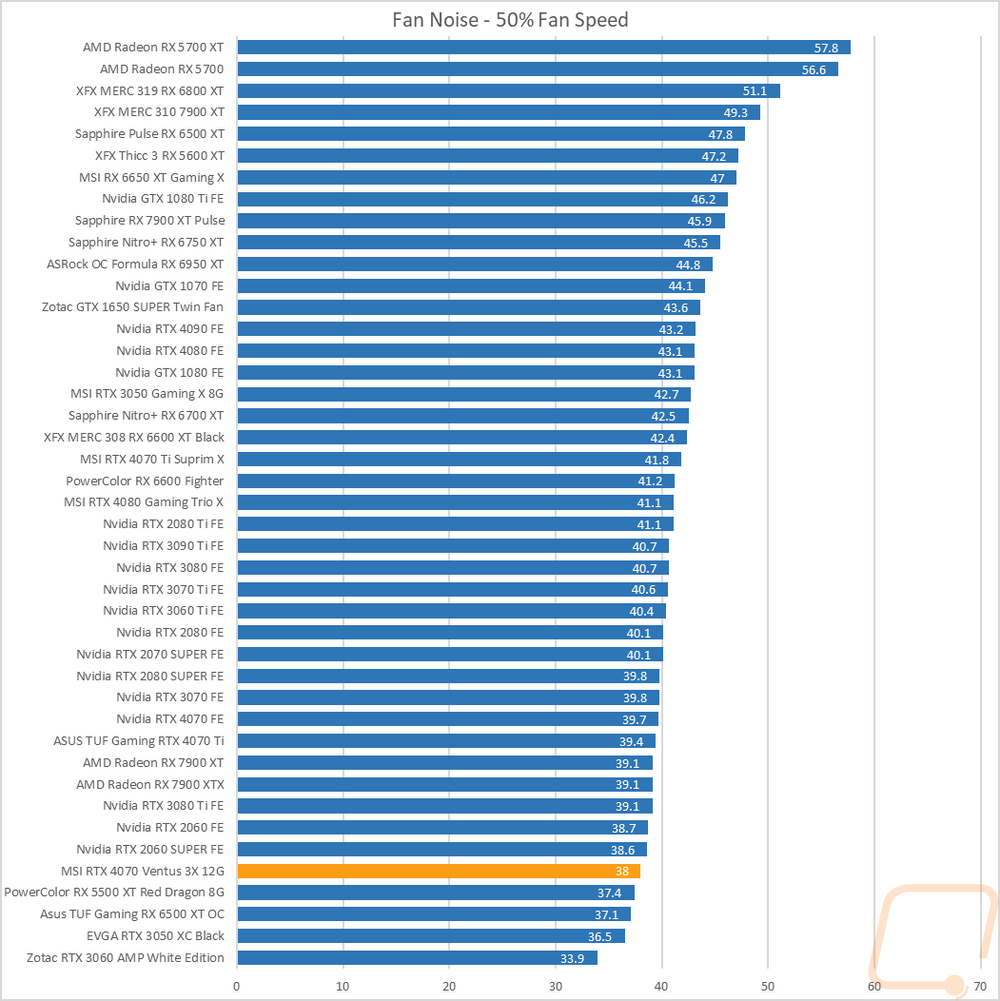
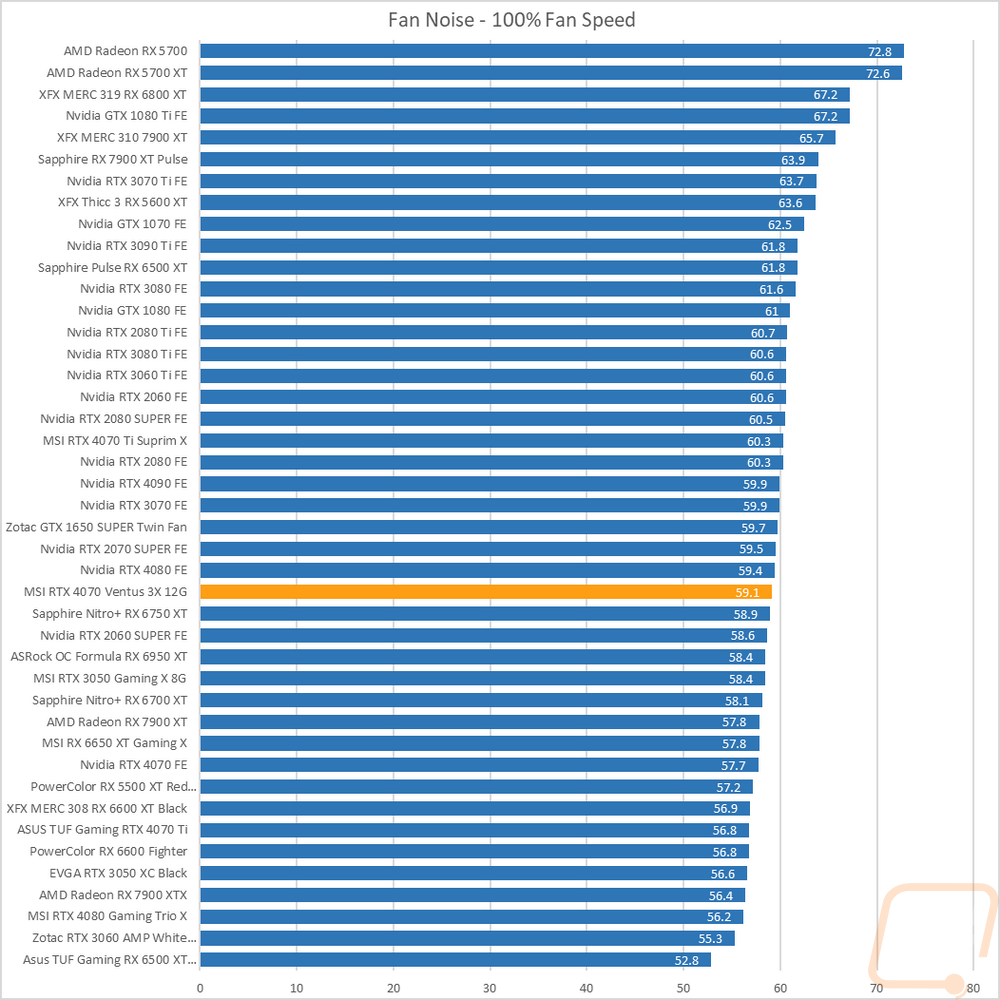
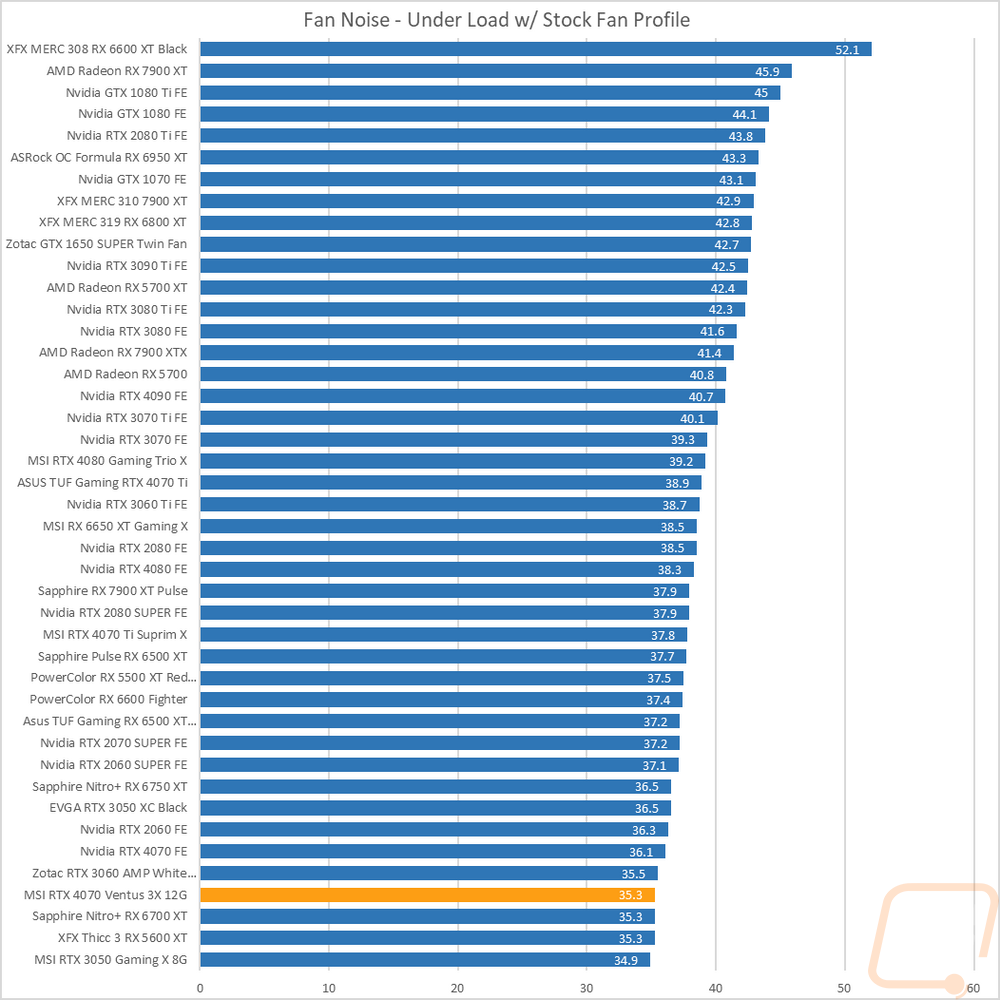
My next round of tests were looking at noise levels. These are especially important to me because I can’t stand to listen to my PC whirling. Especially when I’m not in game and other applications are using the GPU. For my testing, though I first tested with the fan cranked up to 100% to get an idea of how loud it can get, then again at 50% to get an idea of its range. The MSI RTX 4070 Ventus 3X is down near the bottom of the chart for the 50% fan speed chart and was 1.7 db lower than the Founders Edition but did move up in the 100% fan speed chart with 59.1 db. This was louder than the 4070 Founders Edition and isn’t too big of a surprise given the Ventus has a third fan and the Founders Edition is unusually quiet for its fan speeds. I also take a look at noise performance while under load. For that when running AIDA64’s stress test I wait until the temperature of the card has leveled off and then measure how loud things are when the card is at its worst-case scenario with the stock fan profile. Here the MSI RTX 4070 Ventus 3X is again back down at the bottom of the chart and almost a decibel lower than the 4070 Founders Edition.
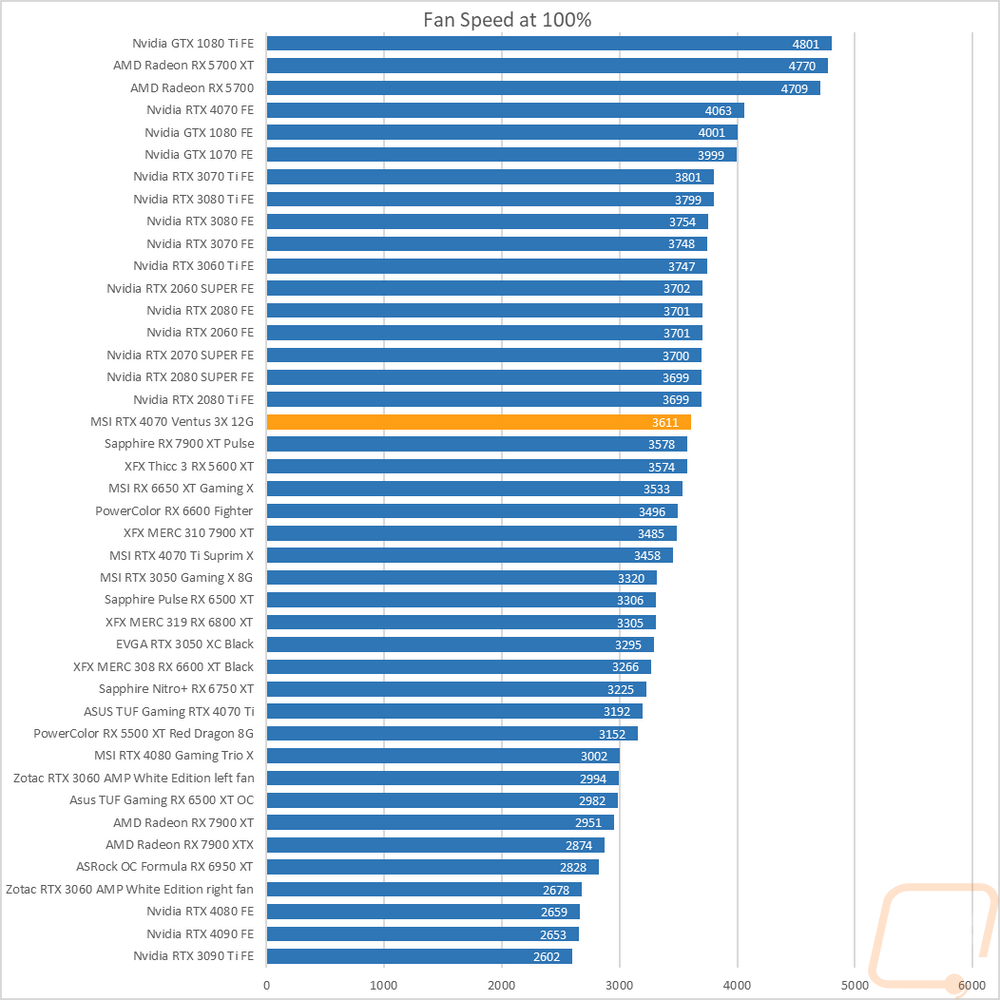
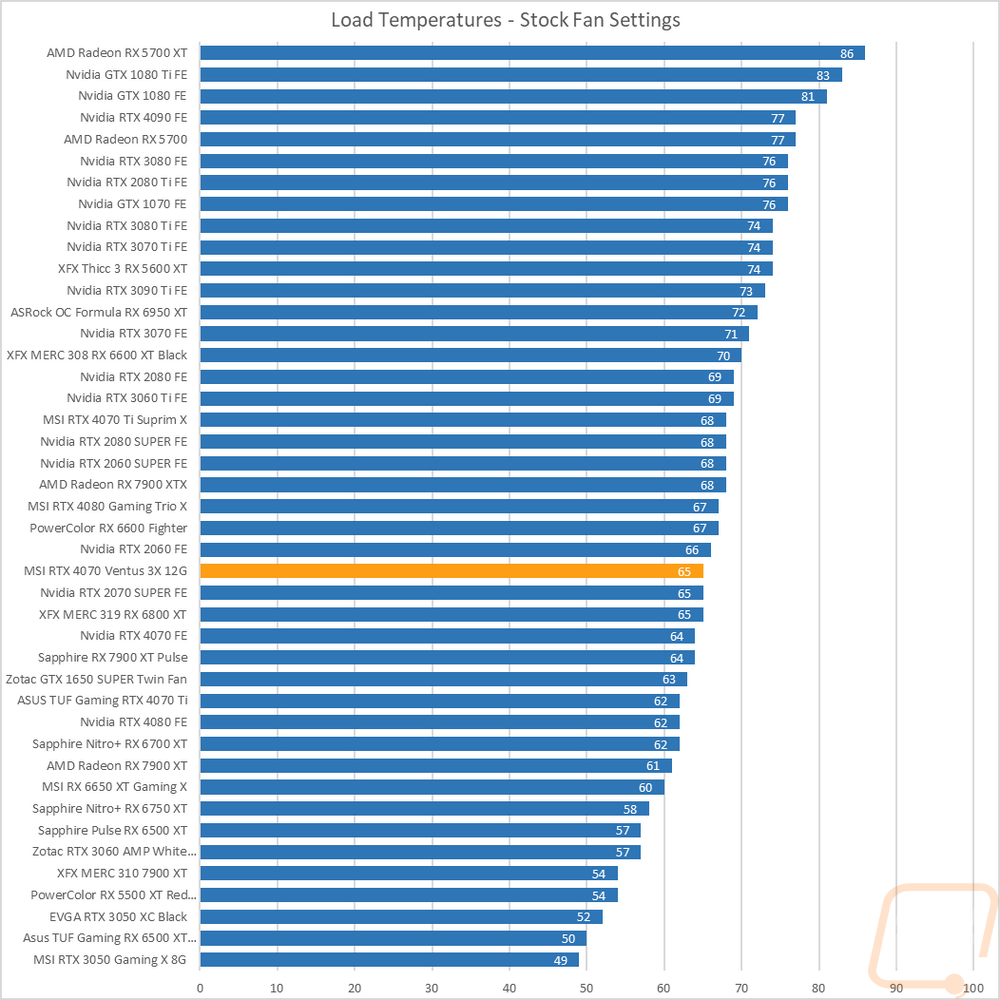
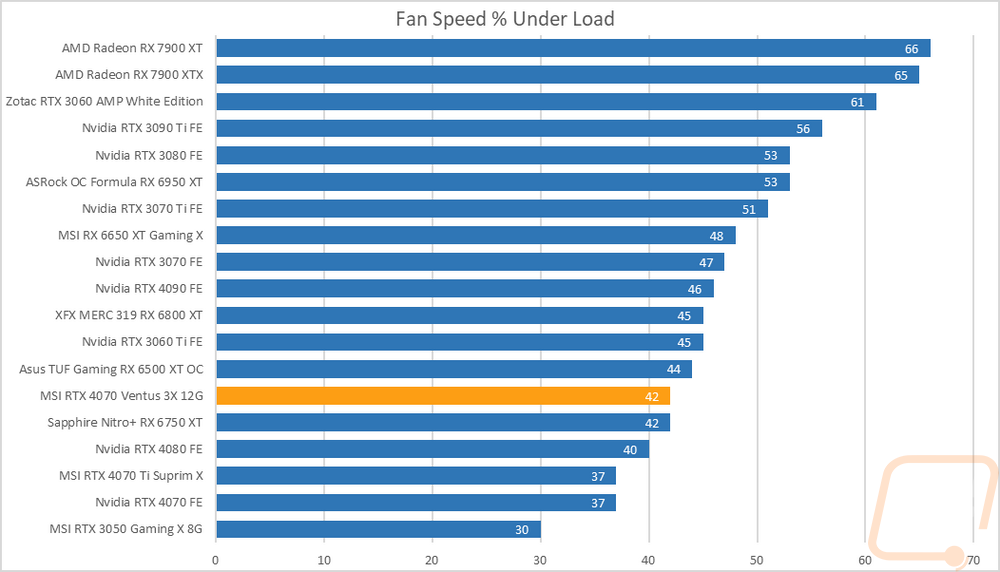
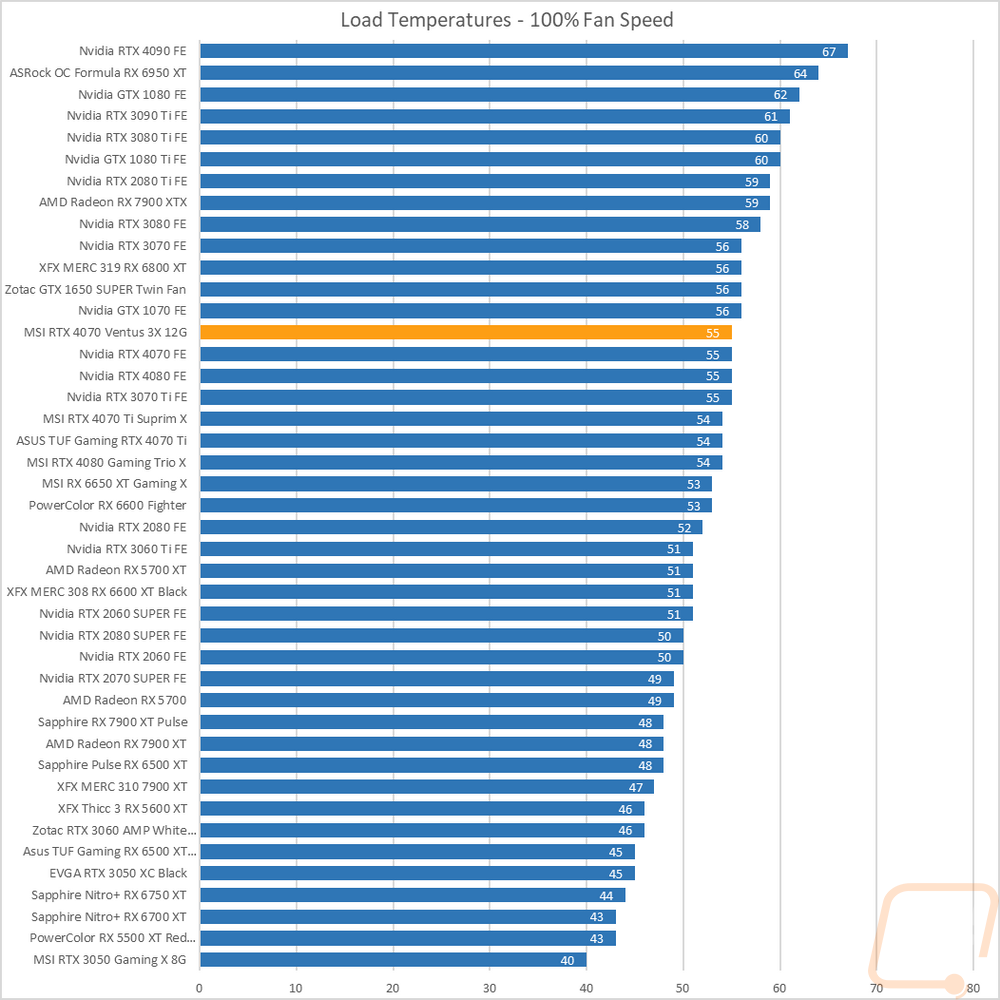
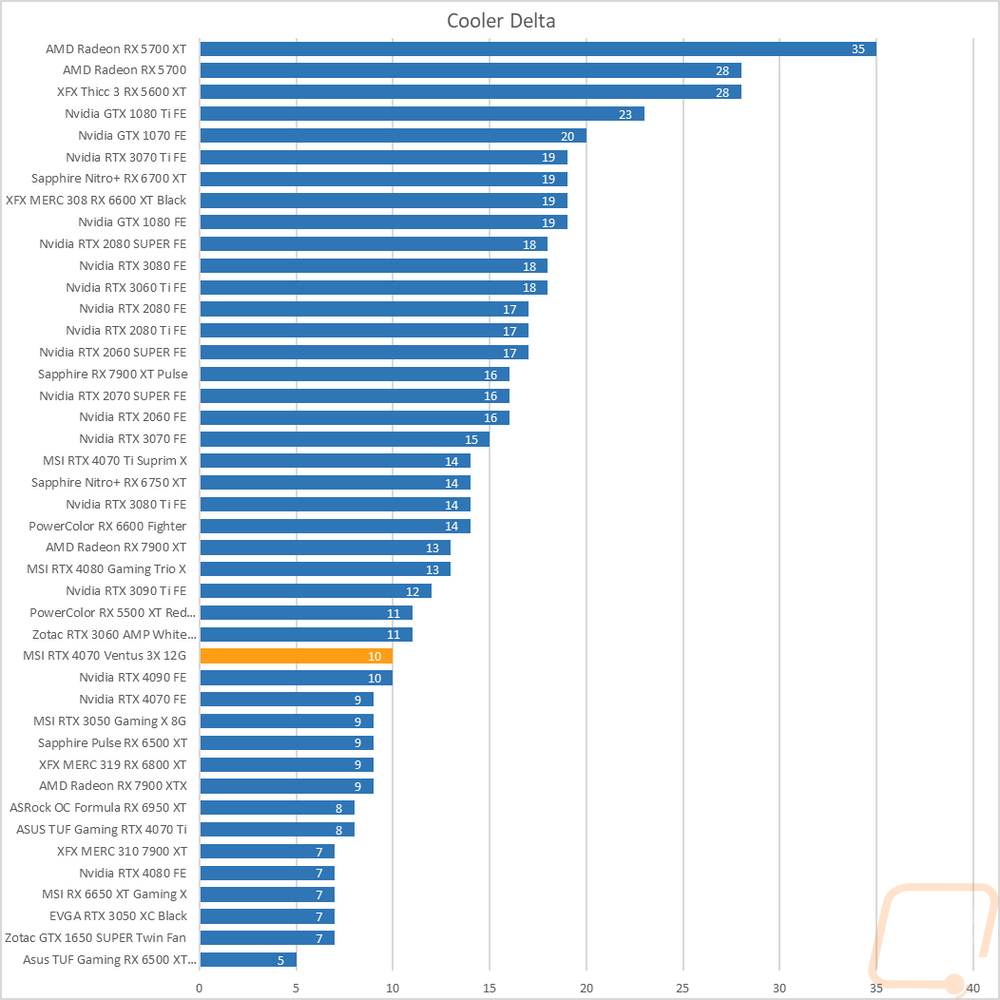
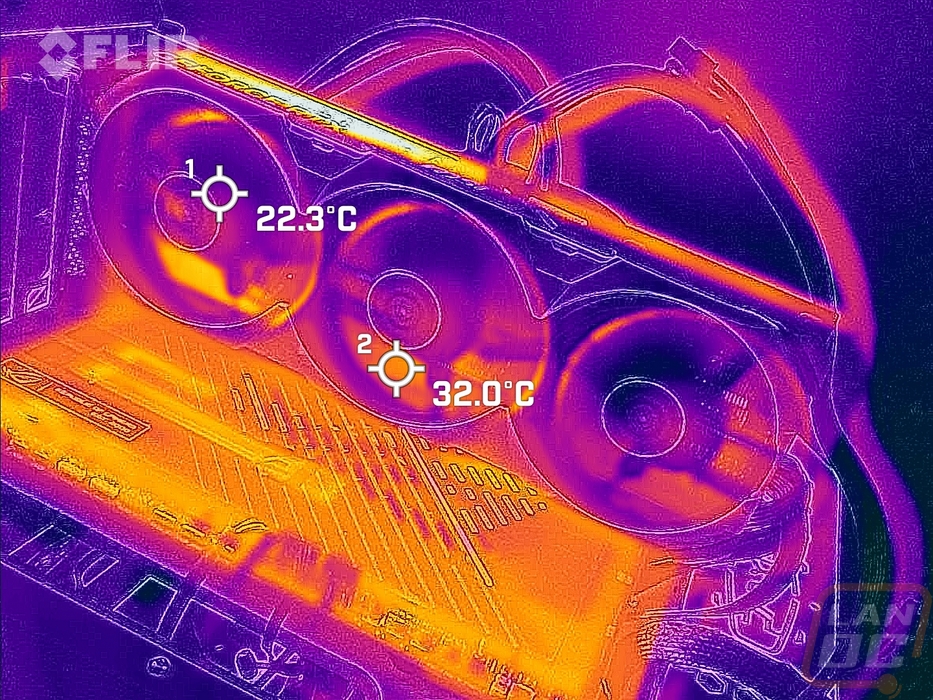
To finish up my testing I of course had to check out the cooling performance. To do this I ran two different tests. I used AIDA64’s Stress Test run for a half-hour each to warm things up. Then I documented what temperature the GPU leveled out at with the stock fan profile and then again with the fans cranked up to 100%. With the stock profile, the MSI RTX 4070 Ventus 3X leveled off at 65 degrees. This was 1 degree above the Founders Edition. More interestingly I also noted what the fan percentage was at to maintain that and the MSI RTX 4070 Ventus 3X was at 42%. This is 5% higher than the Founders Edition but still near the bottom of the chart. Then with the fans cranked up, the MSI RTX 4070 Ventus 3X is up higher in the chart at 55c, the same as the 4070 Founders Edition making the delta between the stock and 100% results 10c.
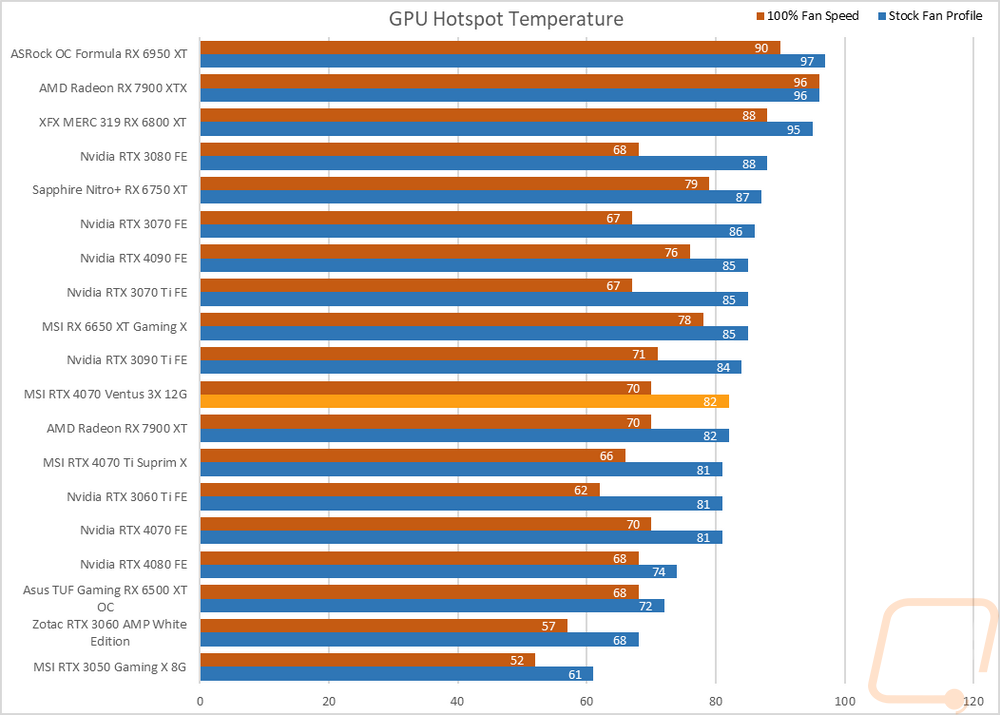
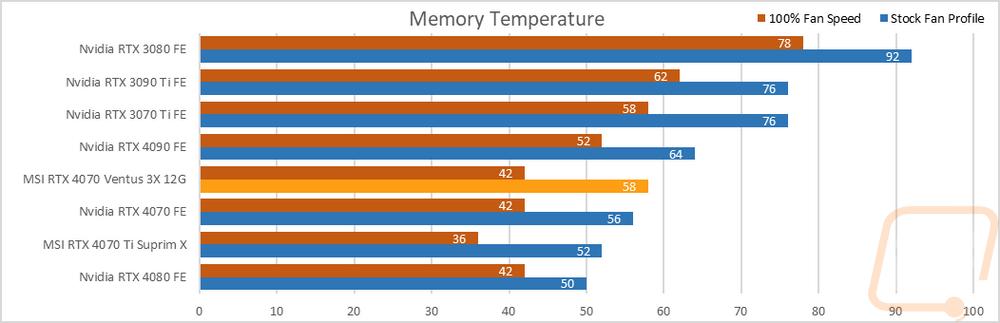
With the MSI RTX 4070 Ventus 3X still under load on both the stock fan profile and the 100% fan speed tests I also took a look at the GPU Hotspot temps. The Ventus had a hotspot temp of 82c with the stock fan profile which was just 1c higher than the Founders Edition. With the fan cranked up to 100% this dropped down to 70c, 2c higher than the 4070 FE. I also noted the memory temperatures on all of the cards that support it. This is the high-end Nvidia 3000 Series cards and all of the 4000 Series cards to date as well but none of the AMD models. The MSI RTX 4070 Ventus 3X had its memory at 58c with the stock fan profile, 2c higher than the FE. Then at 100% fan speed, both cards were at 42c.
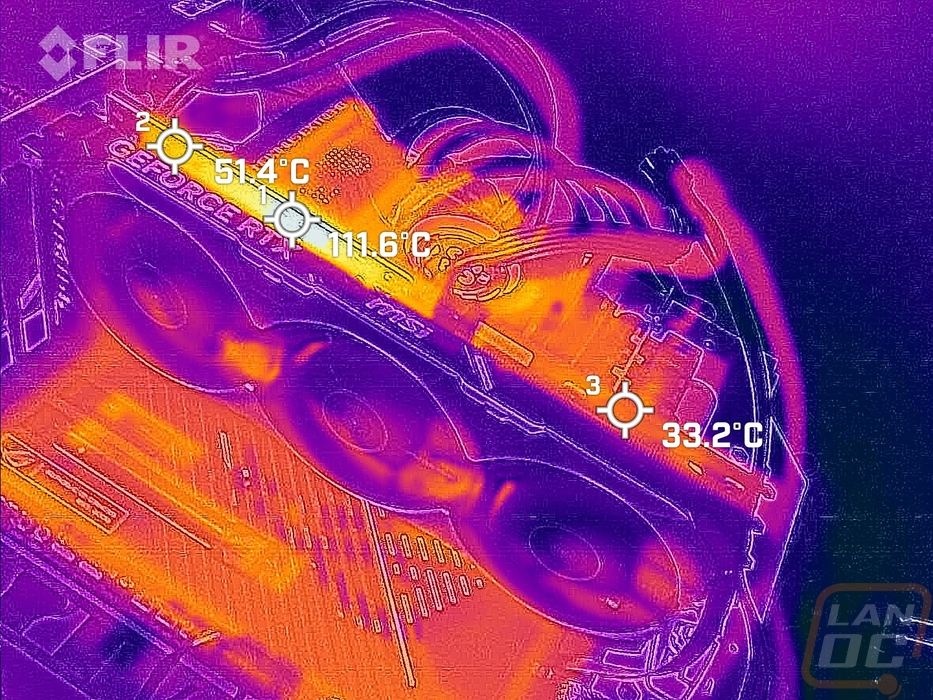
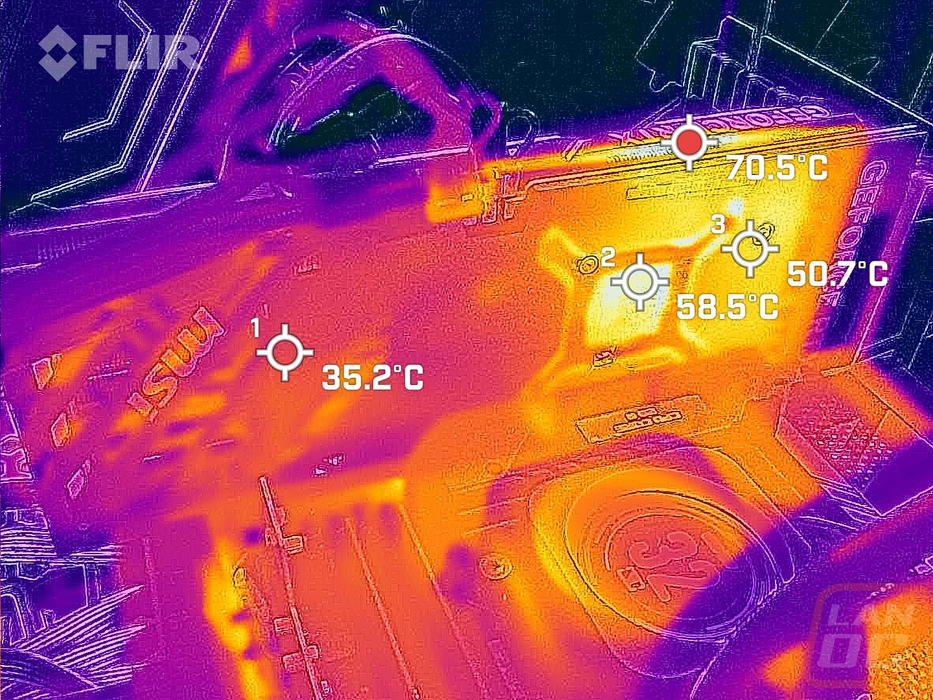
While running the stock fan profile testing I also took the time to get a few thermal images so we could see what is going on. For the thermal images of the MSI RTX 4070 Ventus 3X, the fan side of the card is mostly running extremely cool with just some heat on the bottom side of the heatsink behind the far left fan. The top edge of the card on the other hand was extremely hot on the PCB just above the PCB running at 111.6c in that area. It was cooler towards the PCI bracket and towards the power cable but something isn’t in line for that one specific area to be that hot. The back of the card with its plastic backplate doesn’t show most of the heat as the plastic is more of an insulator. You can see the blow-through vents on the left with some heat and the exposed back of the GPU is warm at 58.5c but the top edge here was again where the heat was concentrated.
Overall and Final Verdict
With the MSI RTX 4070 Ventus 3X being a stocked clocked card it not only matches the RTX 4070 Founders Edition in clock speed but also in its price. Its design however takes a completely different direction. Where the Founders Edition is more compact and has its all-metal housing the MSI RTX 4070 Ventus 3X is a long card with three fans and has a plastic fan shroud and plastic backplate as well. I don’t mind the plastic fan shroud because it opens up different styling options but I’m still not a big fan of the plastic backplate. It is better than having nothing as it does protect the back of the card some, but it doesn’t help prevent card sag and it doesn’t transfer heat out away from the PCB. The black design does look good and goes well with the silver and black design of the rest of the card.
The MSI RTX 4070 Ventus 3X didn’t stop with being different with its card size and length. It also has dropped the 12VHPWR connection for a standard 8-pin plug and while I wouldn’t prefer this on a higher-end card because the new connection does keep your wiring cleaner as long as you are using a new ATX 3.0 power supply, but with just one 8-pin connection it is easier and you don’t have to worry about making sure it is connected perfectly. I am curious how they got away with the one connection when Nvidia is using a dual 8-pin adapter for the Founders Edition. Especially with the MSI RTX 4070 Ventus 3X pulling slightly more power. Even with the different power profile the MSI RTX 4070 Ventus 3X, like the 4070 FE, is still a surprisingly efficient card when it comes to the wattage for performance in Time Spy Extreme. This translated to good card temperatures and quiet performance when under load as well. But I did run into a significant temperature issue with a major hotspot up at the top of the card on the PCB above the GPU. So hot in fact that I’m concerned that it will damage itself in the future.
As far as traditional performance the MSI RTX 4070 Ventus 3X and the 4070 FE performed nearly the same across the board trading places over and over again in our tests. This put it close to the RTX 3080 in performance as well with it outperforming the 3080 at 1080p, matching at 1440p, and falling behind at 4K. Like with our RTX 4070 Founders Edition review, the big variable for the overall performance depends on how you plan on using the card. For just raster performance currently, AMD is a better value with the 6800 XT and especially the 6950 XT for as long as those are marked down. It is only when you also figure in ray tracing and DLSS performance, which we will see more in future games, does its price better match up with the performance you get. In those situations, it outperforms the 69050 XT while at a cheaper price. The MSI RTX 4070 Ventus 3X has an MSRP of $599 which is the base MSRP of the RTX 4070. As it sits with the heat issue that I am experiencing with our card it is hard to recommend the Ventus 3X. But once that issue gets worked out, assuming it is just a defect that is, the MSI RTX 4070 Ventus 3X has the potential to be a decent buy for a budget 4070 with a solid cooler to keep things cool.
Live Pricing: HERE


