Cooling Noise and Power
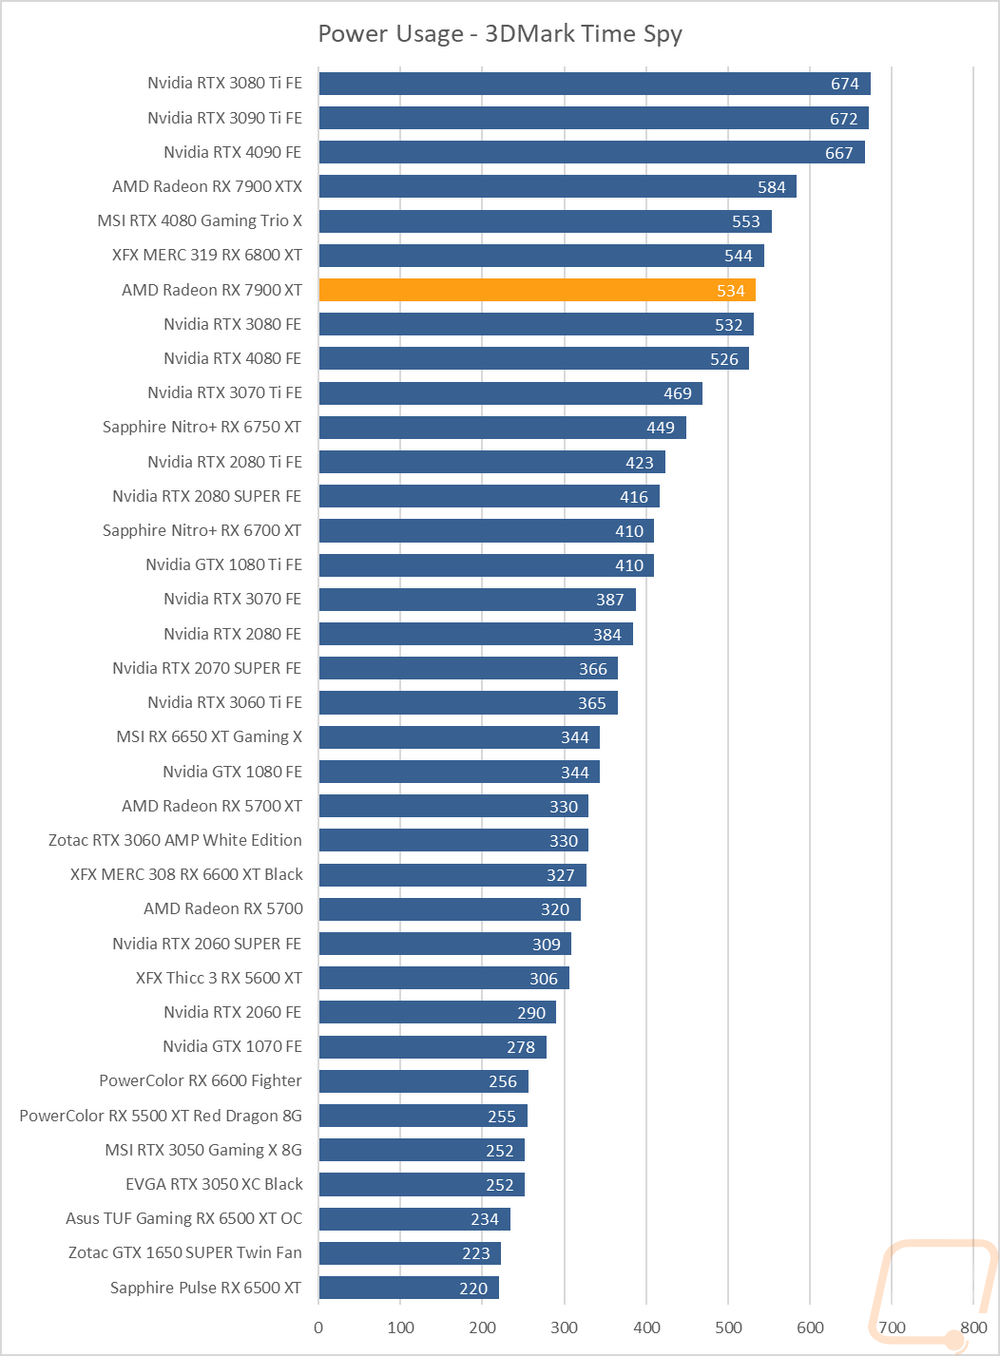
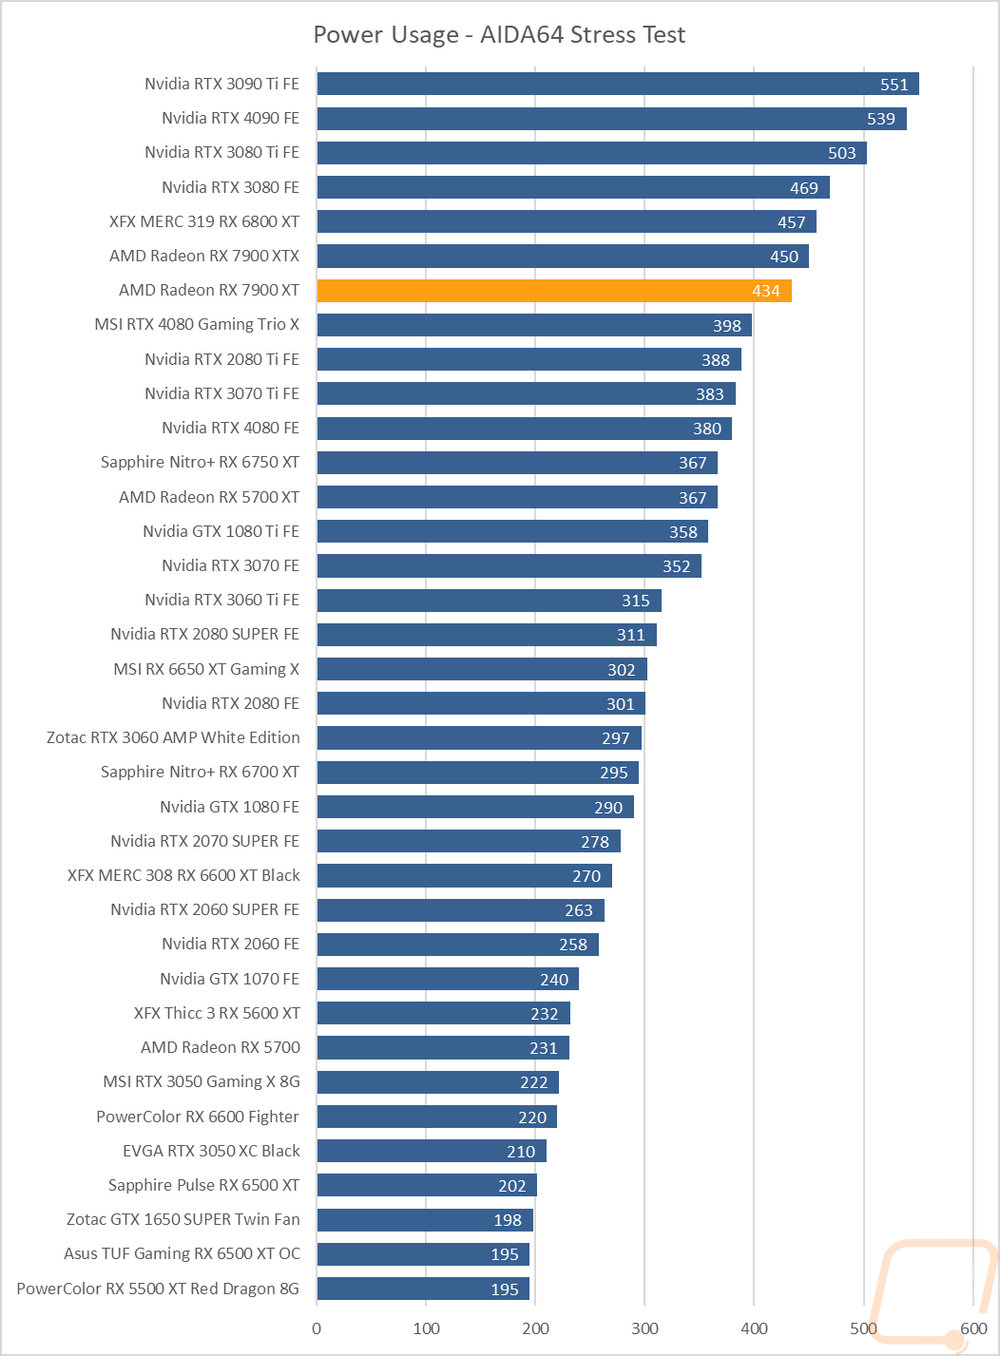
For my last few tests, rather than focusing on in game performance, I like to check out other aspects of video card performance. These are also the most important ways to differentiate the performance between cards that have the same GPU. To start things off I took a look at power usage. For this, I use our Kill-A-Watt hooked up to the test bench to record the total wattage of the system. I ran two tests with the first using 3DMark Time Spy to put the system under a load similar to normal in game performance. Here our test system with the 7900 XT pulled 534 watts total which put the 7900 XT just behind last generation's 6800 XT and above the 4080 FE. I also ran AIDA64’s stress test on the video card to load up only the GPU and using the Kill-A-Watt the test bench with the 7900 pulled 434 which was just behind the 7900 XTX and 36 watts more than the overclocked RTX 4080 and 54 watts over the 4080 FE.
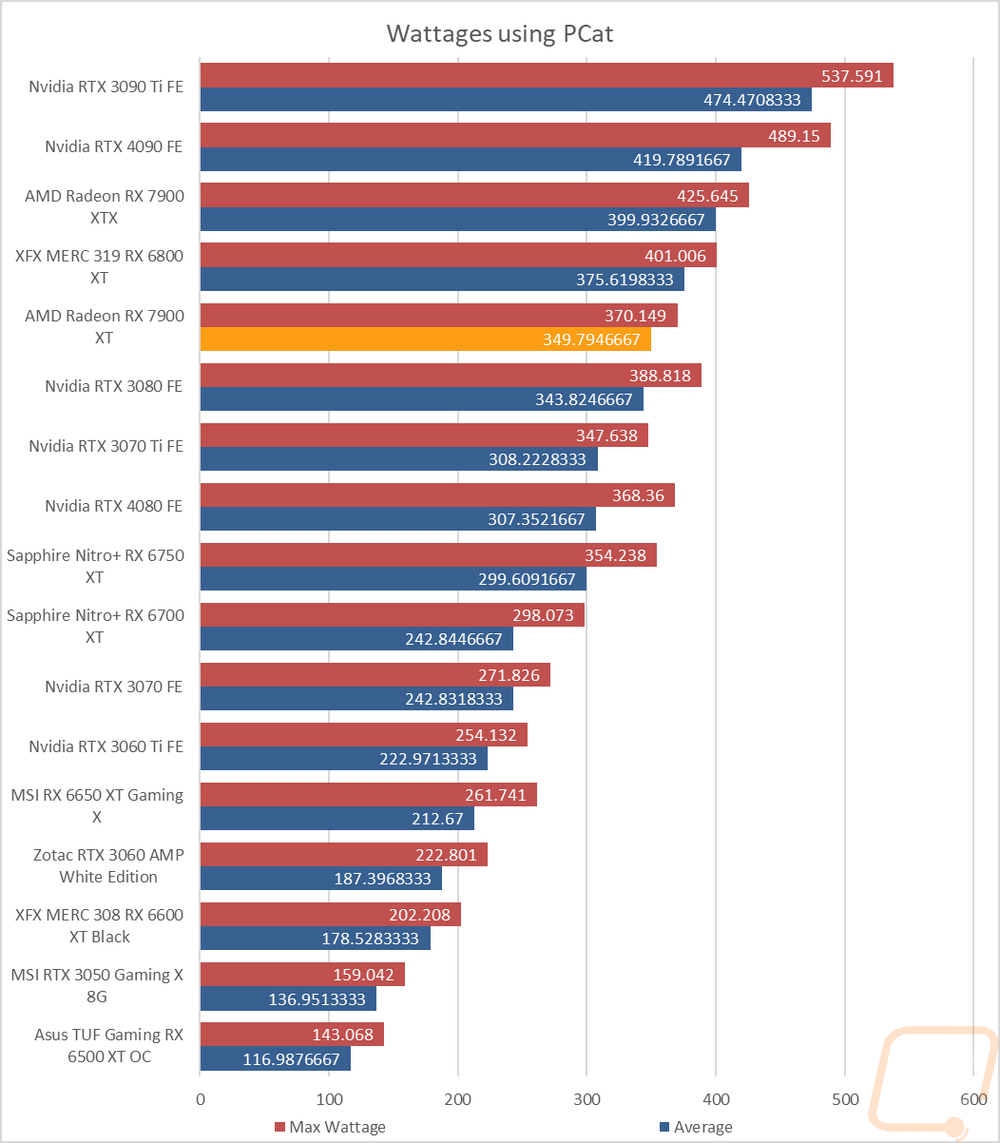
While the overall system numbers are nice, with the addition of a PCat into our testing hardware I have finally been able to look at the total power draw of just the GPU by monitoring the power over the PCIe slot and the power cables. For this test I have also expanded the number of tests I run by testing power usage in two games (Fay Cry 6 and Watch Dog Legion both at 4k and ultra detail) testing with Time Spy and Time Spy Extreme, AIDA64’s GPU workload, and Blender 3.4. I take those numbers and average them out for our average number and also look at the max wattage which is with just one exception always the Time Spy Extreme result. This gives us a much better look at the power usage across multiple situations and also the max power draw. The 7900 XT averaged 349 watts and its peak wattage was 370 watts. The average was just slightly above what the RTX 3080 did and the peak was closer to the peak from the RTX 4080. The 4080 was 42 watts lower on average though.
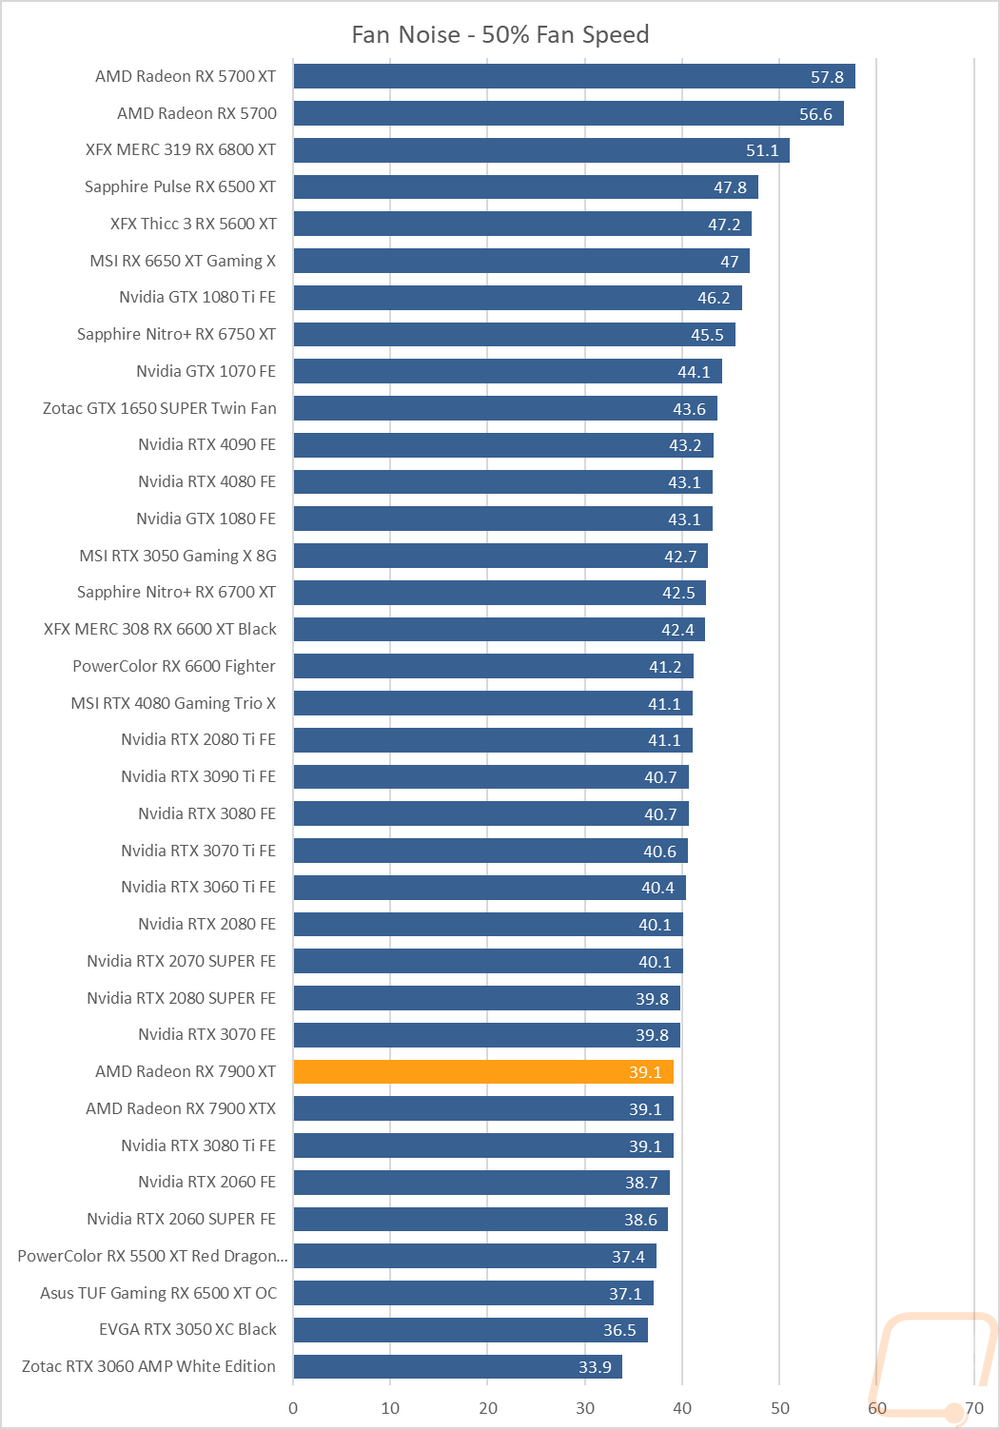
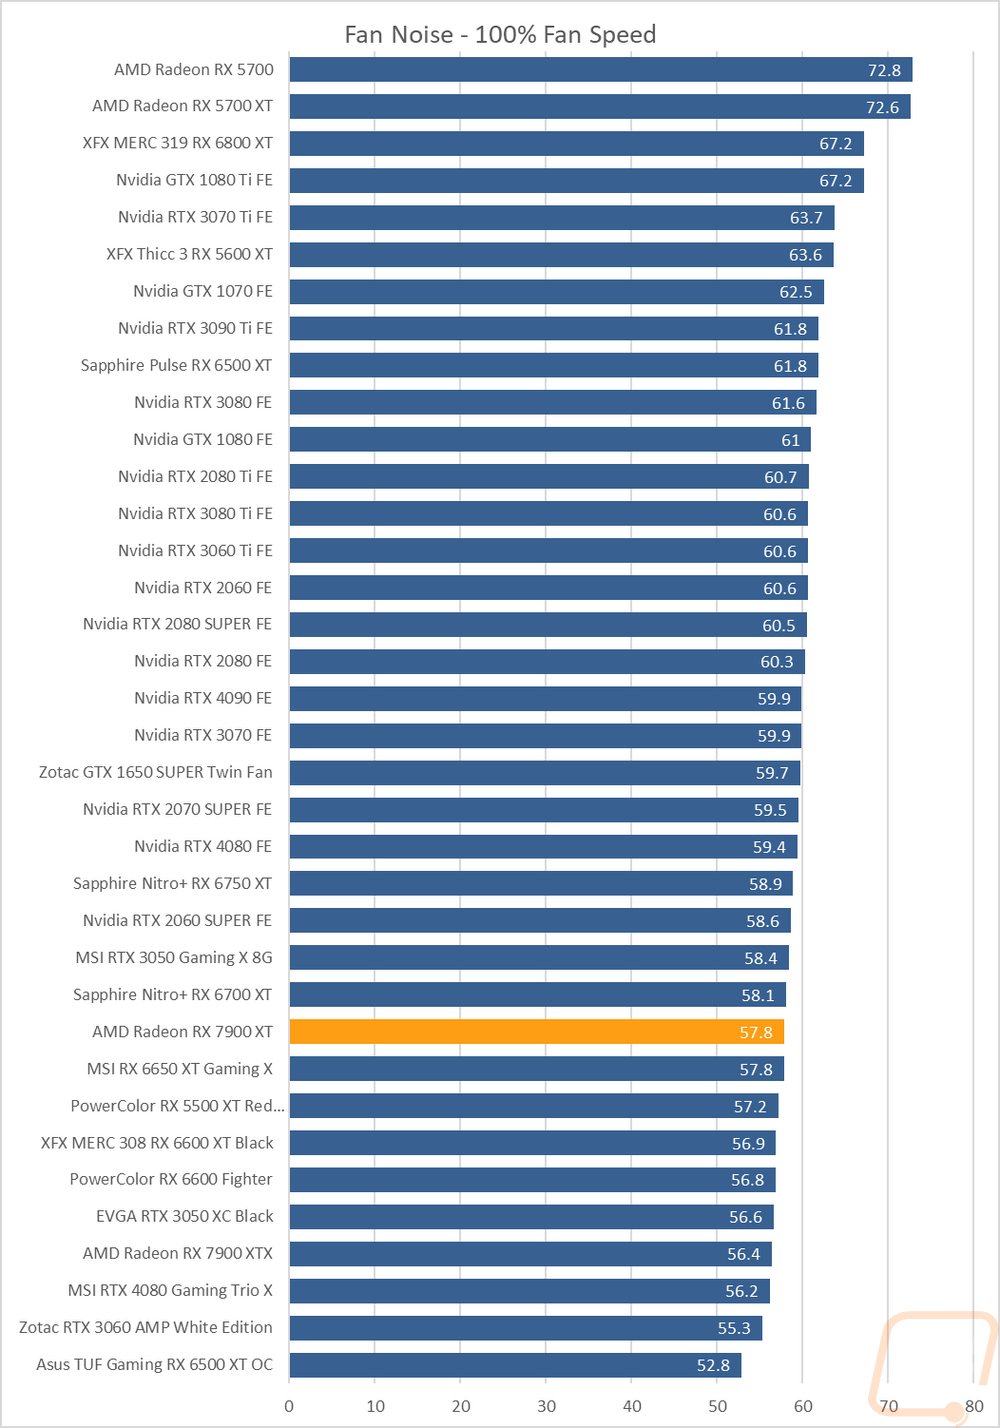
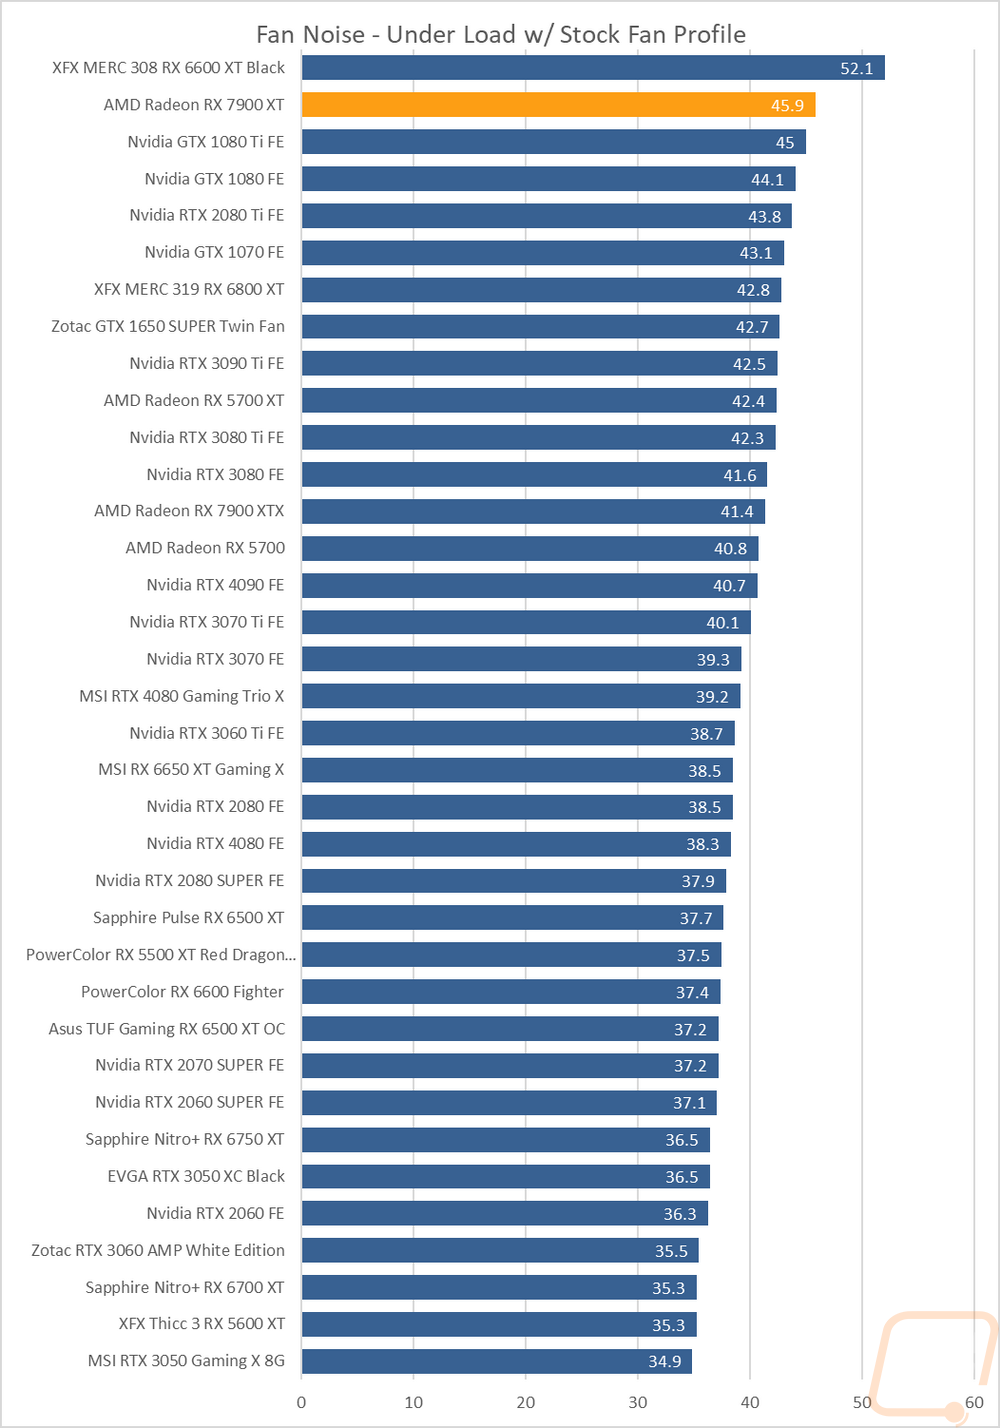
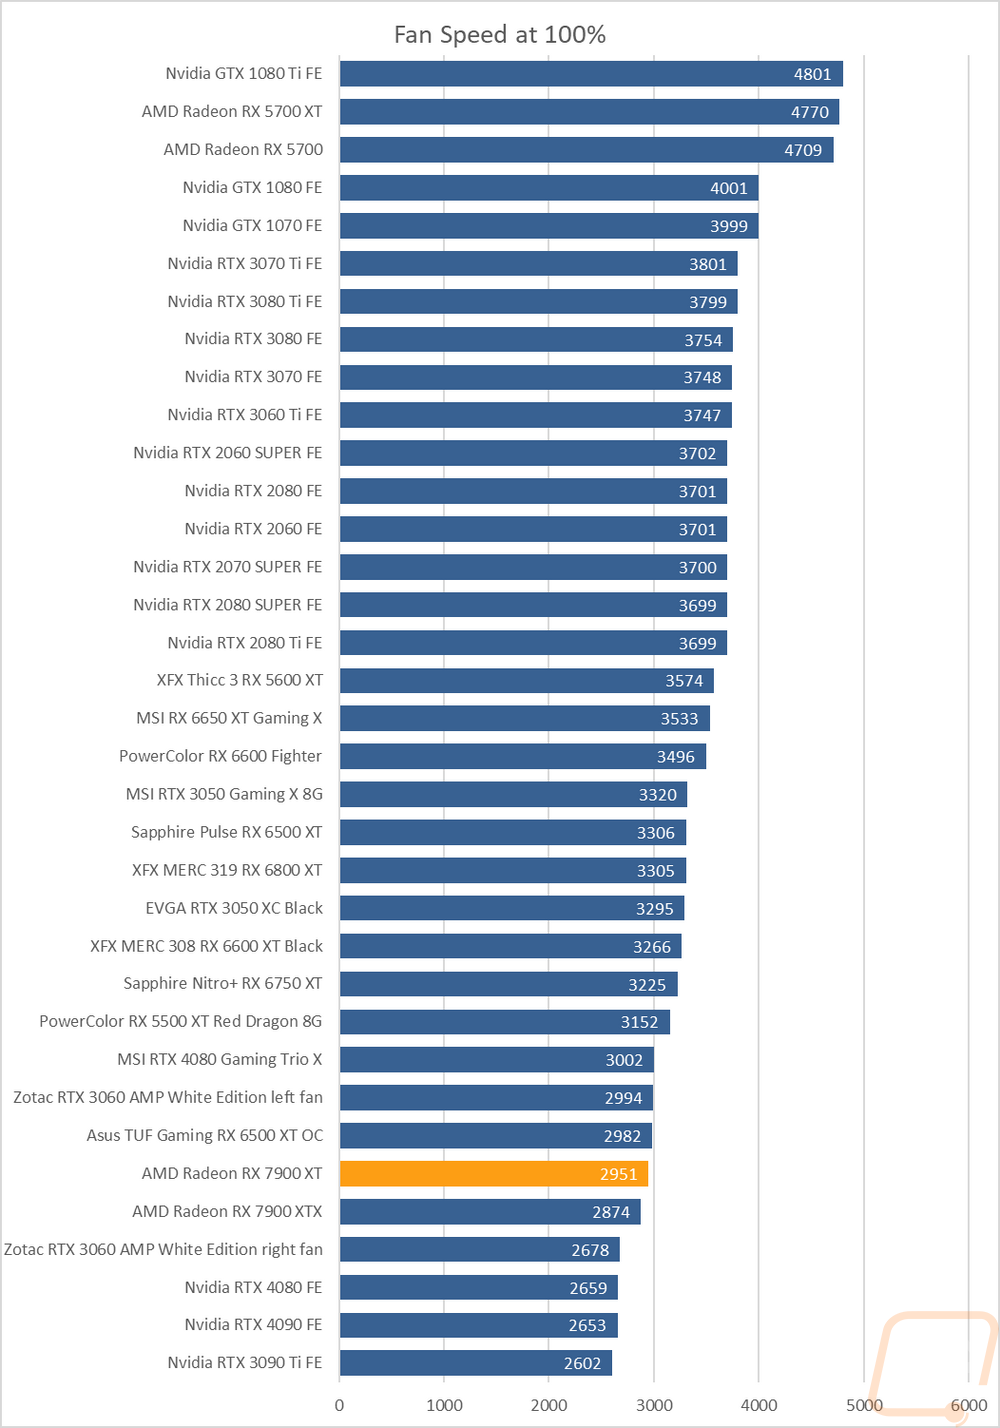
My next round of tests were looking at noise levels. These are especially important to me because I can’t stand to listen to my PC whirling. Especially when I’m not in game and other applications are using the GPU. For my testing, though I first tested with the fan cranked up to 100% to get an idea of how loud it can get, then again at 50% to get an idea of its range. I test using both A and C weighting, A is the standard way and C has a little more of the low end to check for low-level hums. The 7900 XT did well in the 50% with 39.1 decibels putting in right with the 7900 XT and 100% was similar at 57.8. Louder than the XTX but still in the bottom 1/3 of the chart which matches up with the fan speeds. I also take a look at noise performance while under load. For that when running AIDA64’s stress test I wait until the temperature of the card has leveled off and then measure how loud things are when the card is at its worst-case scenario with the stock fan profile. Here I was surprised that the 7900 XT was louder than the 7900 XT and putting it near the top of our chart.
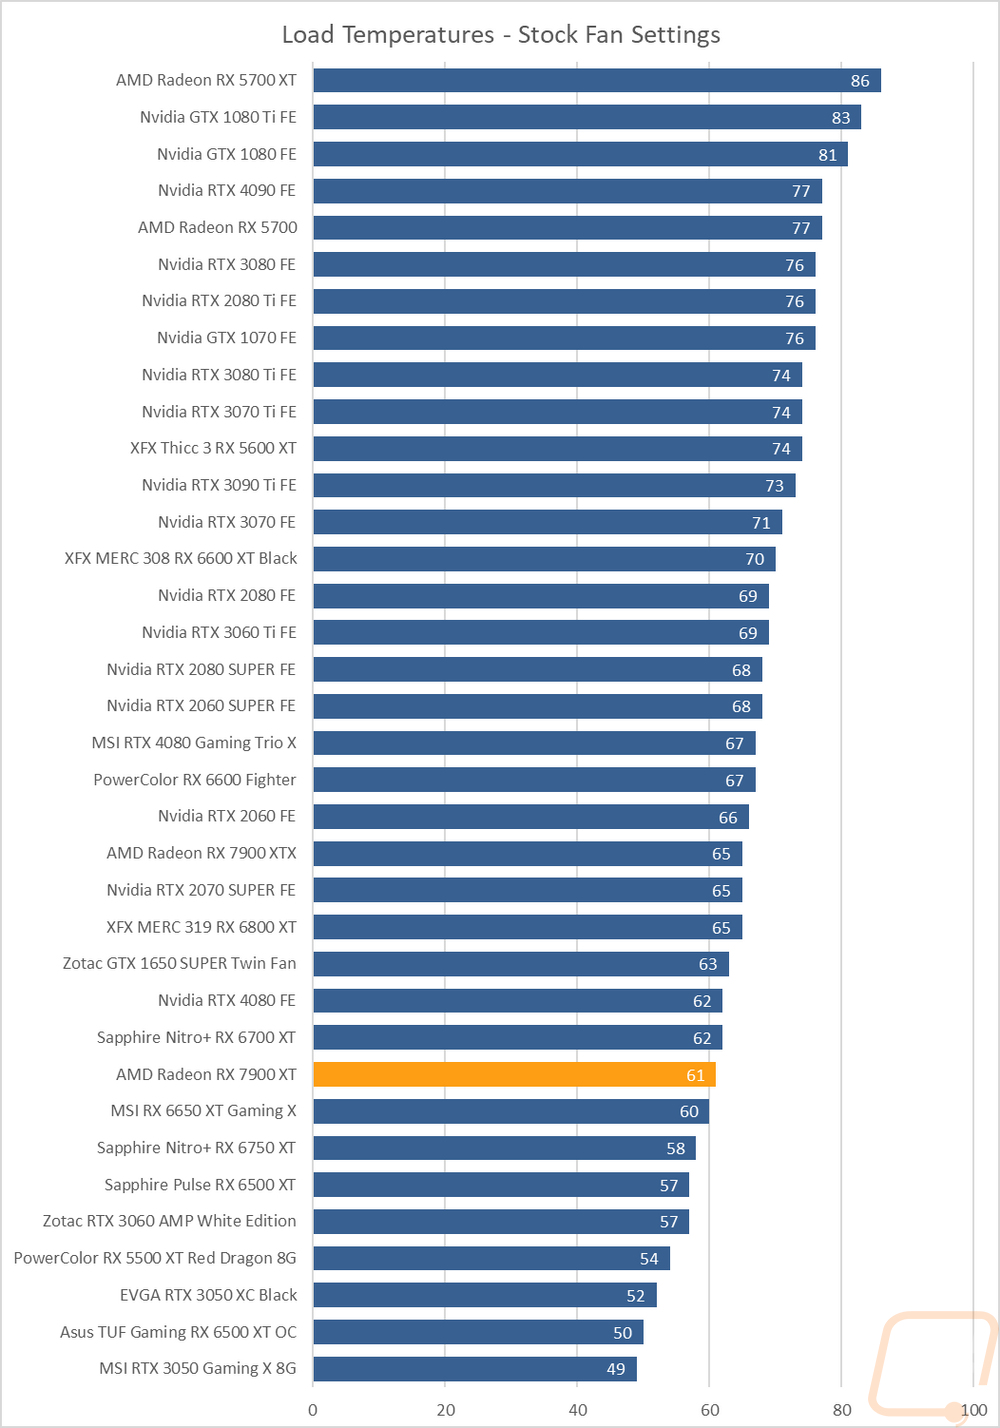
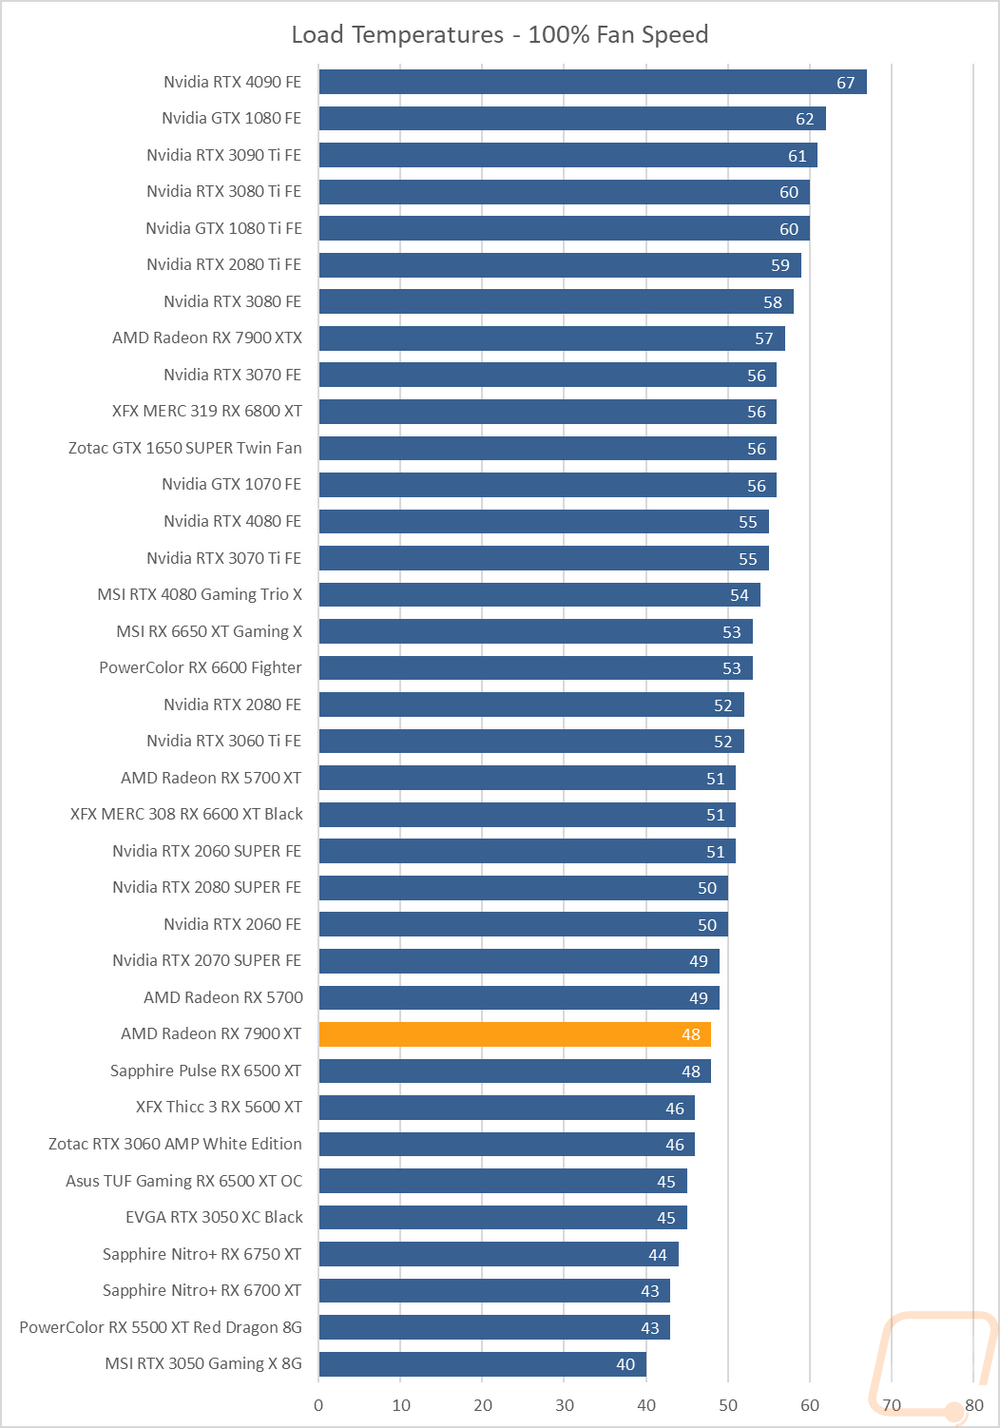
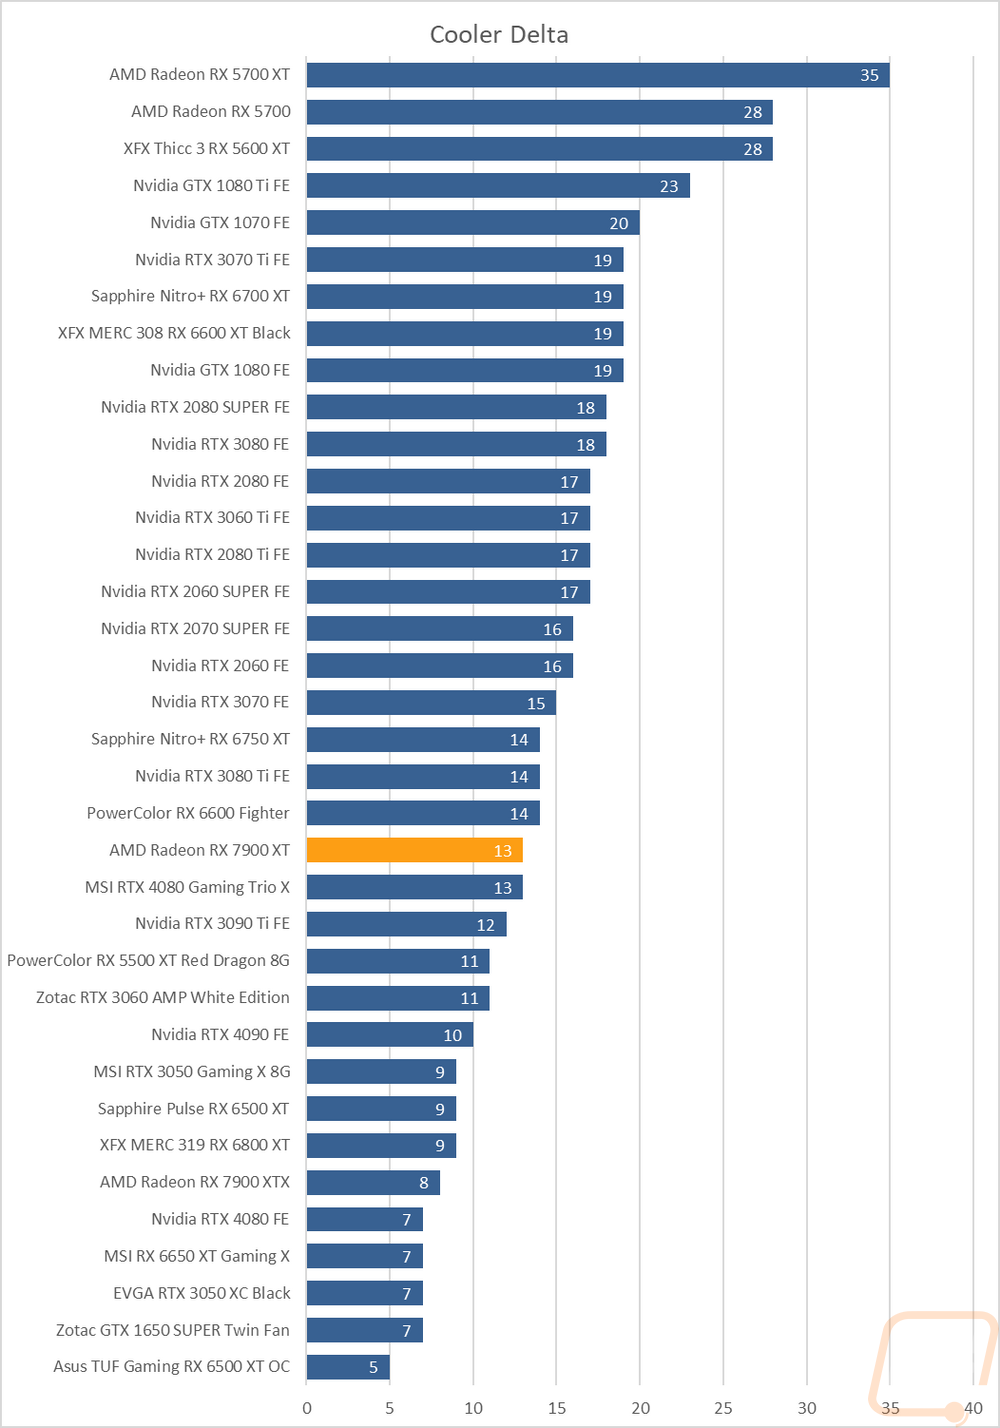
To finish up my testing I of course had to check out the cooling performance. To do this I ran two different tests. I used AIDA64’s Stress Test run for a half-hour each to warm things up. Then I documented what temperature the GPU leveled out at with the stock fan profile and then again with the fans cranked up to 100%. With the stock profile, the 7900 XT ran cool at 61c which tells us when combined with how noisy it was under load that the fan profile was aggressive. Then with the fans cranked up, the 7900 XT came in at 48c which is good as well. The delta between the two results was 13 degrees and much better than the headroom on the 7900 XTX even with that card having a slightly larger cooler. The GPU hotspot results were a lot better on the 7900 XT than the 7900 XTX with it being 89c with the stock fan profile and 87c at 100% fan speed.
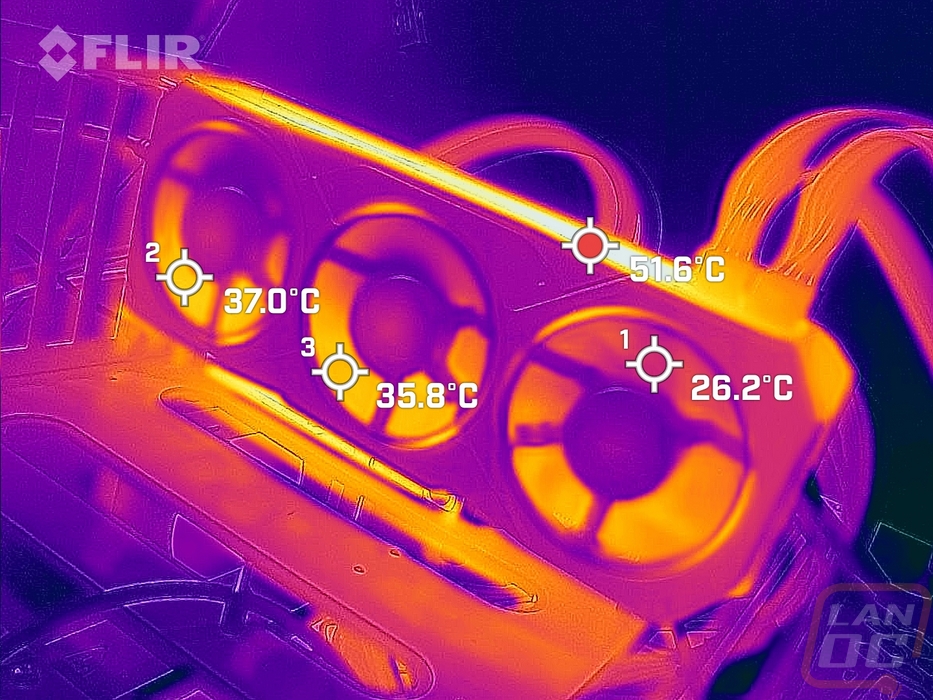
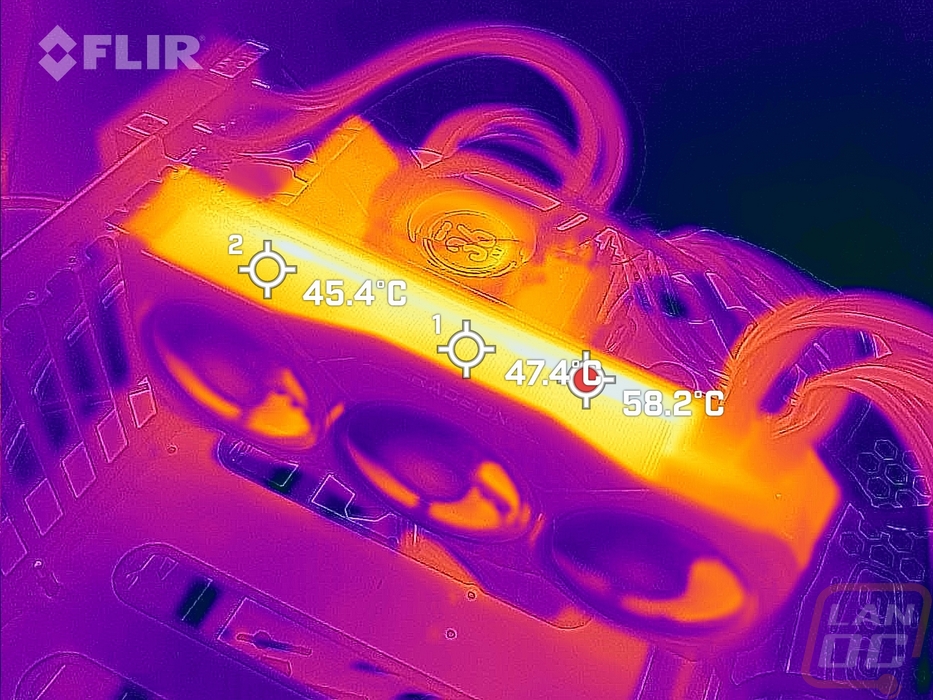
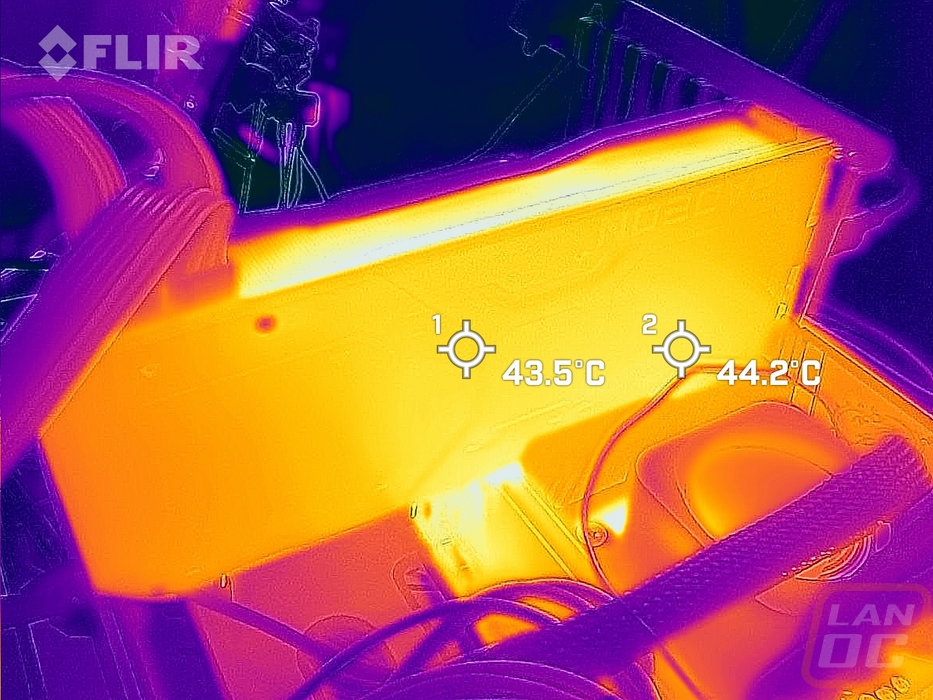
While running the stock fan profile testing I also took the time to get a few thermal images so we could see what is going on. The fan side view shows us that the Radeon 7900 XT is hottest up on the top edge of the card where it is venting air and you can see the heat down on the bottom as well. Behind the fans are all running much cooler than that. The top-down view has the hotspot on the PCB edge where it isn’t able to dissipate as much heat. The heatsink is 10+ degrees cooler even in this area but what impressed me the most was the power connection area being noticeably cooler with that being sectioned off away from the heatsink. Then on the back, the metal backplate is dissipating the heat but is running cooler than the heatsink with more heat showing down below at the motherboard with the air blowing down that direction.