Cooling Noise and Power
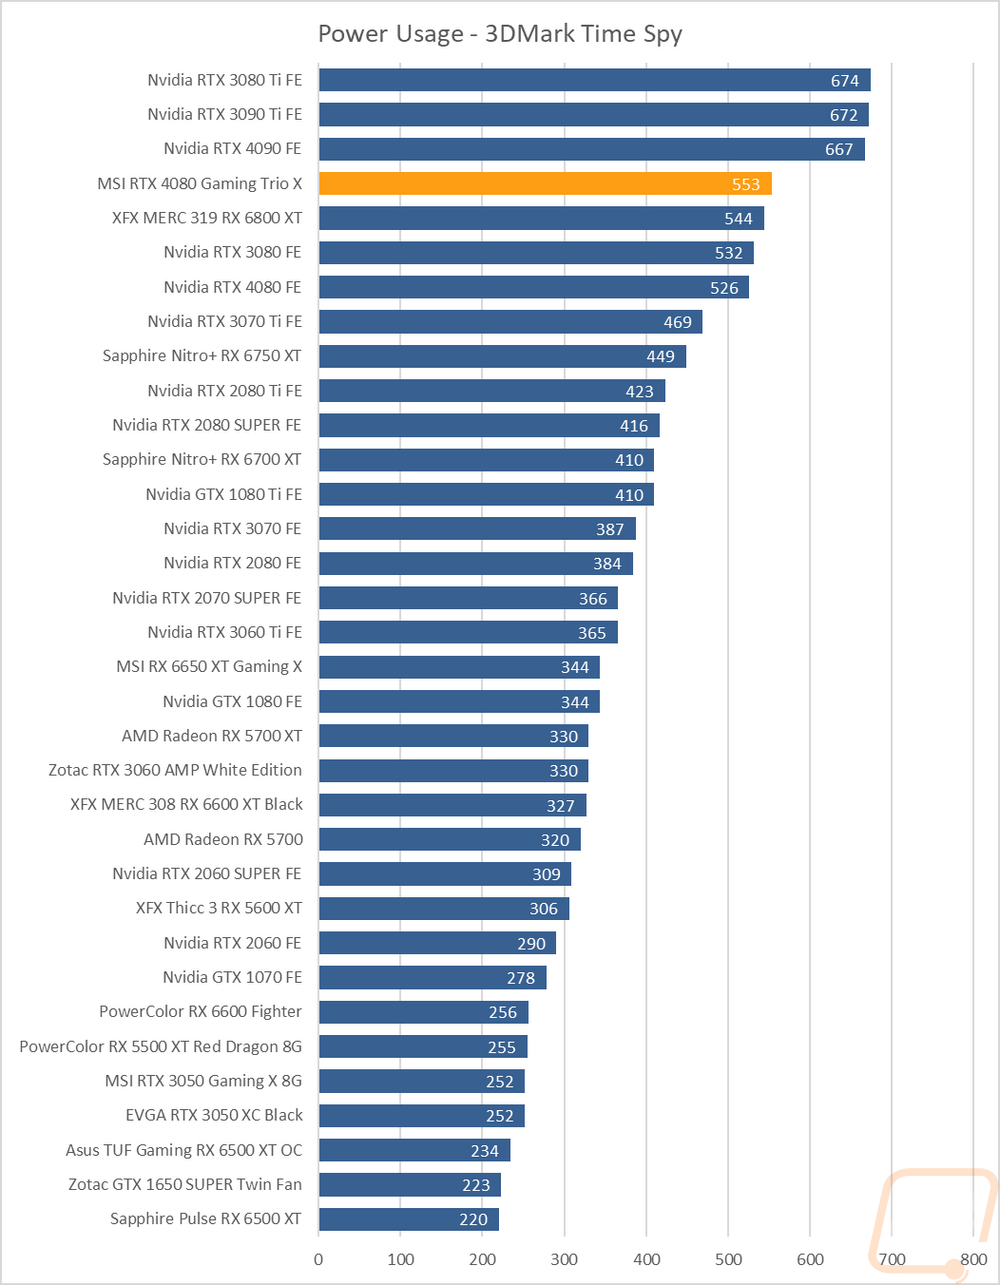
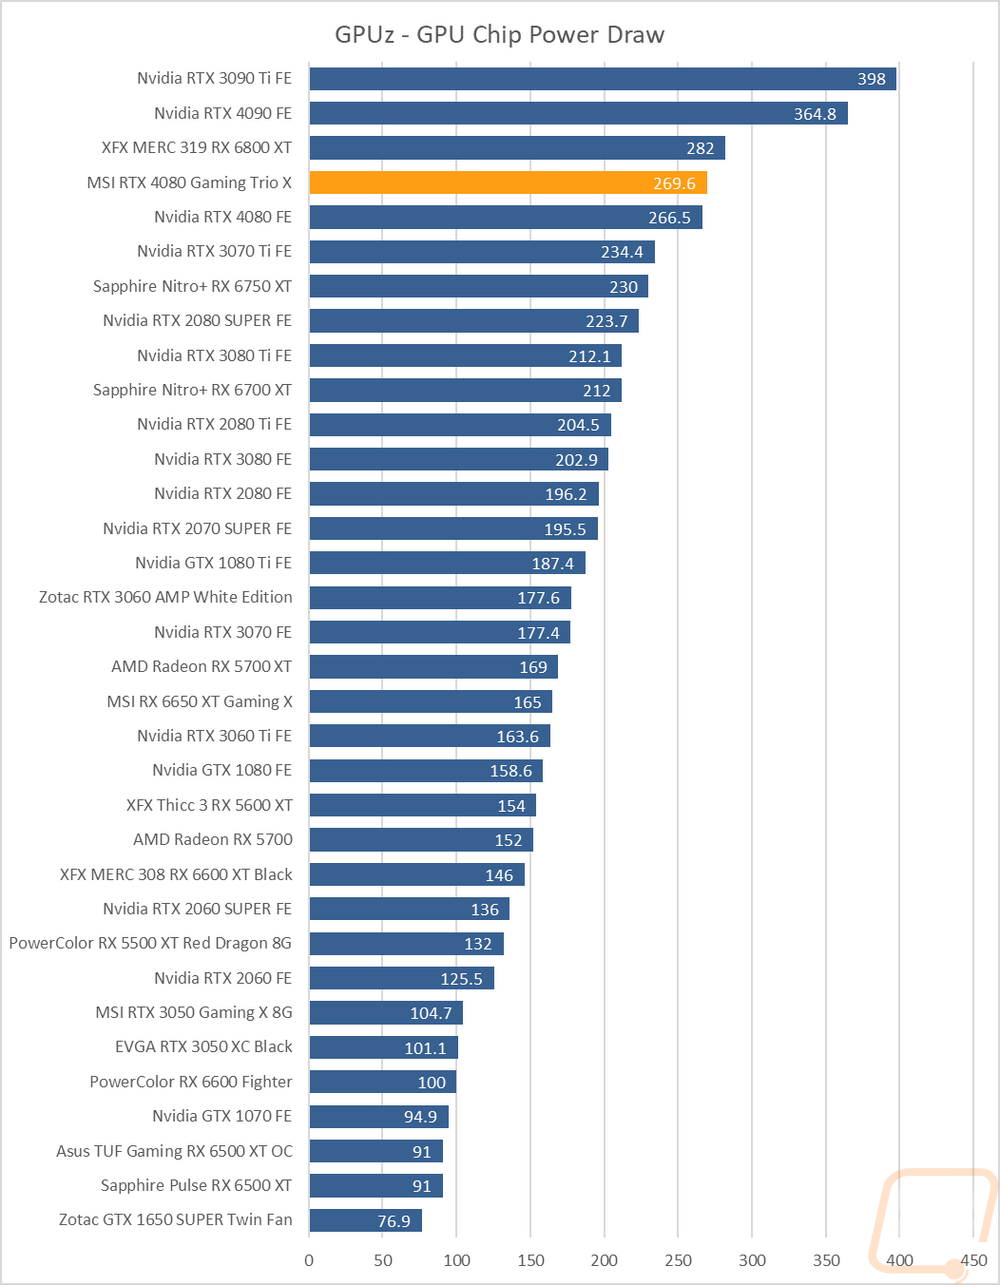
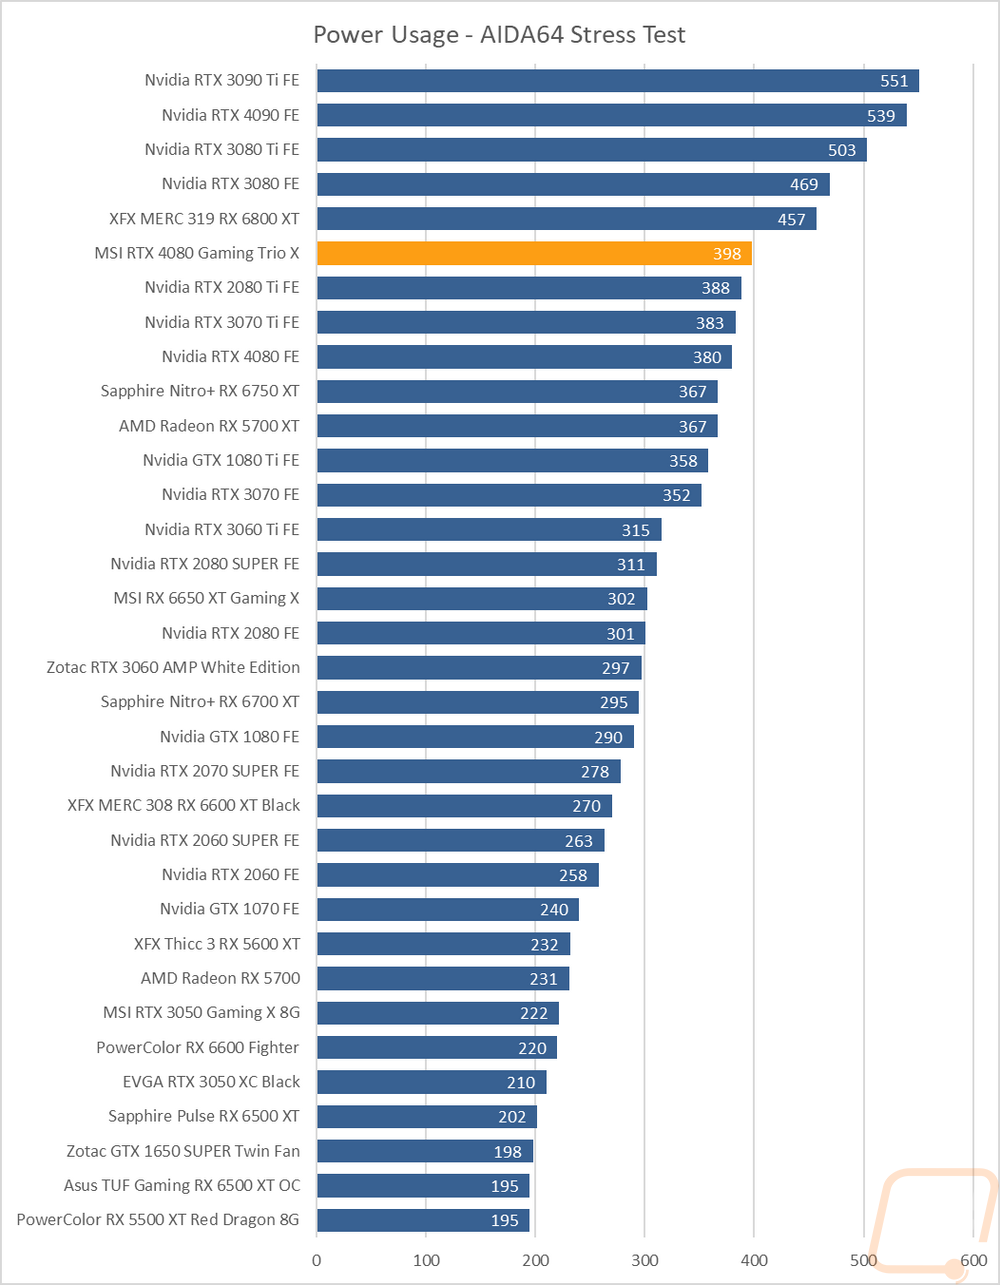
For my last few tests, rather than focusing on in game performance, I like to check out other aspects of video card performance. These are also the most important ways to differentiate the performance between cards that have the same GPU. To start things off I took a look at power usage. For this, I use our Kill-A-Watt hooked up to the test bench to record the total wattage of the system. I ran two tests with the first using 3DMark Time Spy to put the system under a load similar to normal in game performance. Here our test system with the 4080 Gaming X Trio and test bench came in at 553 watts in the Time Spy test which was 114 watts lower than the RTX 4090 but was 27 watts more than the Founders Edition. At the same time with Time Spy I also use GPUz to check out the onboard reading for GPU power draw at the chip. The 4080 Gaming X Trio showed 269.6 on that test which was 3 watts more than the Founders Edition card. Lastly, I run AIDA64’s stress test on the video card to load up only the GPU, and using the Kill-A-Watt the test bench with the 4080 Gaming X Trio and test bench pulled 398 watts at the peak which was 18 watts over the Founders edition and enough to push it over older results like the RTX 2080 Ti as well.
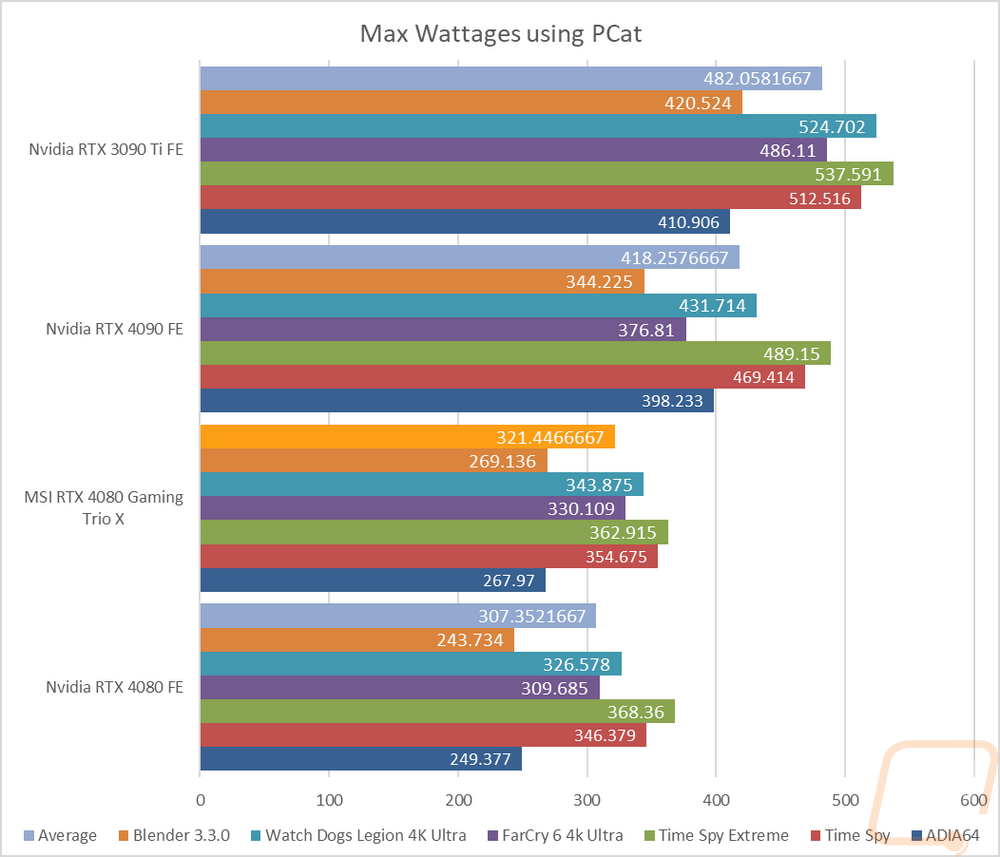
I did also get the chance to test the 4080 Gaming X Trio using the Nvidia PCat V2 as well but sadly until I get the correct adapters I wasn’t able to add in some of the older cards or anything from AMD. That said with the PCat I was able to get a much more accurate look at the power draw of the card itself because the PCat reads the PCIe slot power as well as the 12VHPWR connection. With this, I tested a variety of workloads to get a good mix then averaged them all together for our overall numbers. The individual results do get interesting however with Time Spy and Time Spy Extreme both pulling beyond the TGP on all of the cards. We can also see that AIDA64 isn’t working the cards as hard as the in-game results but was close to Blender. Overall the 4080 Gaming X Trio pulled 321 watts on average which was 14 watts more than the stock clocked 4080 FE.
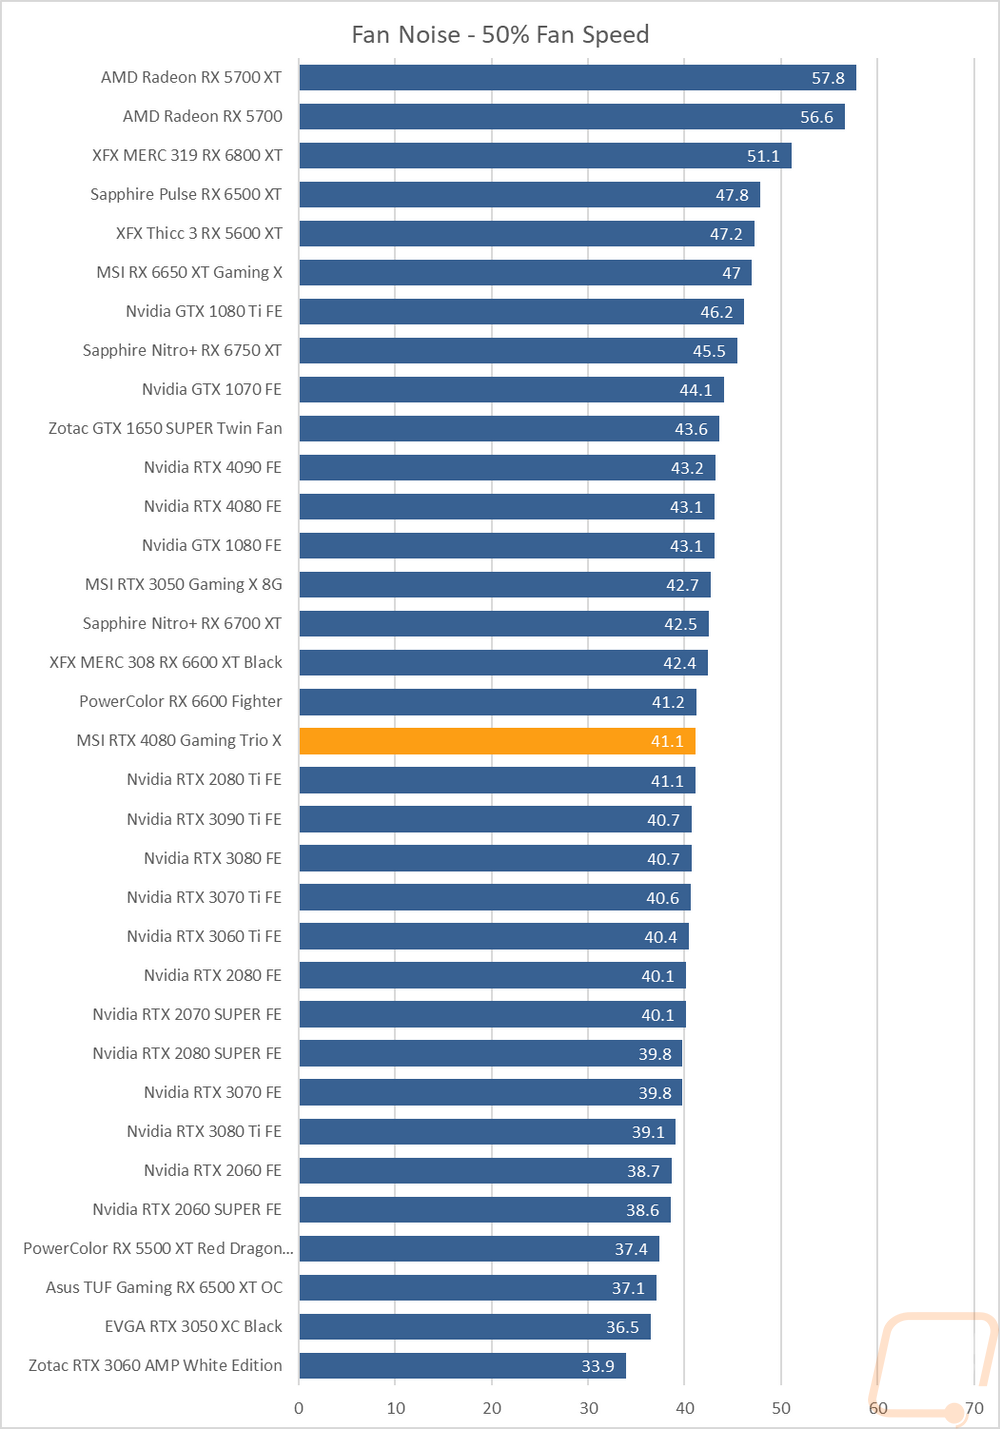
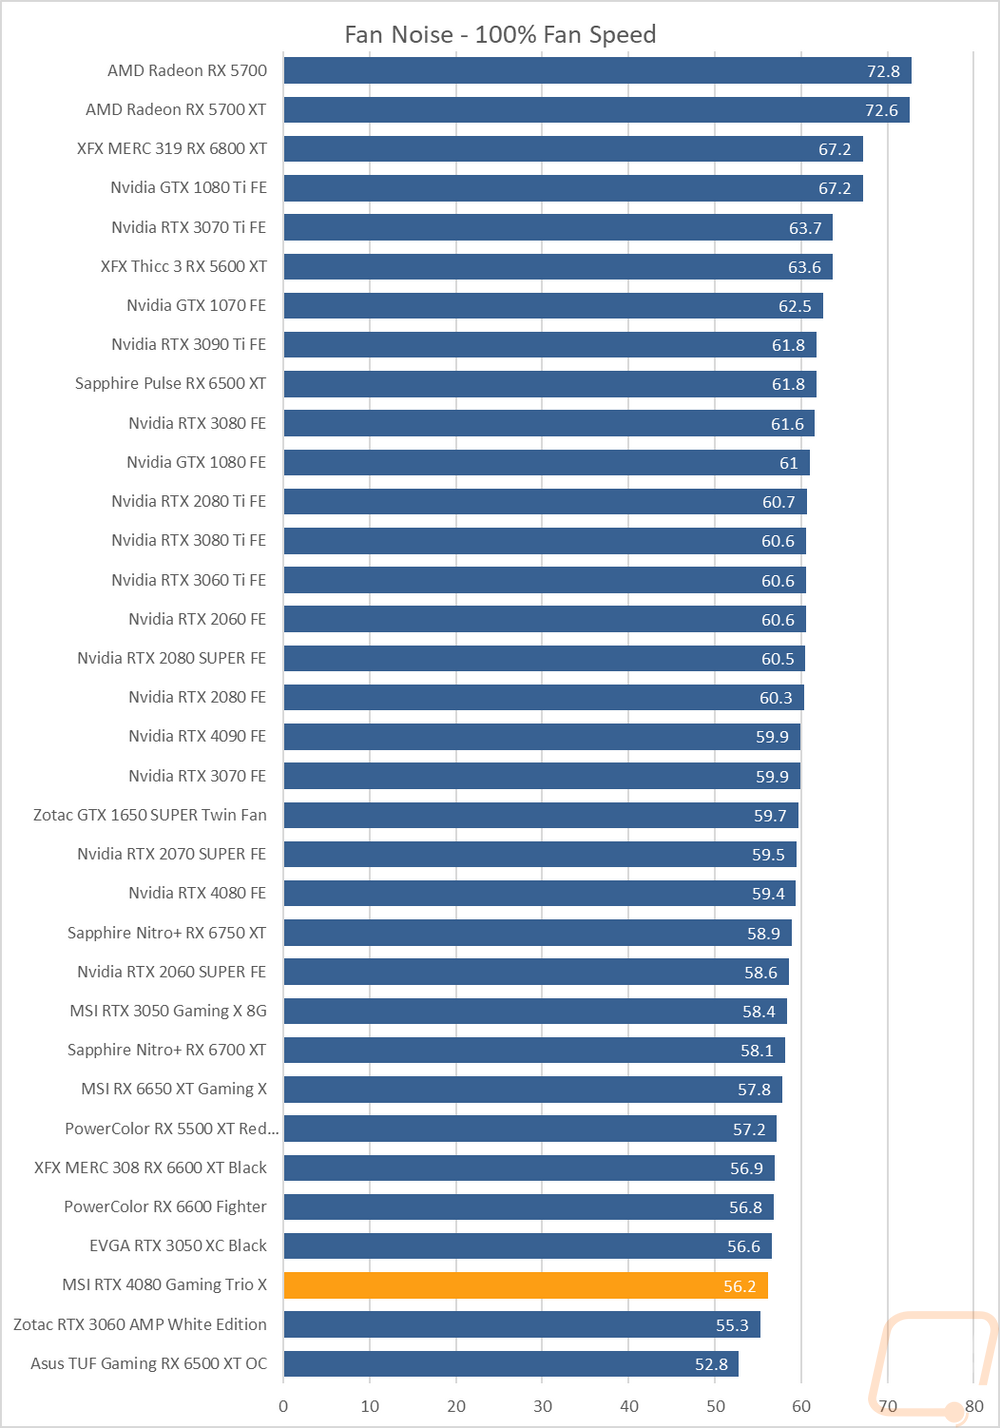
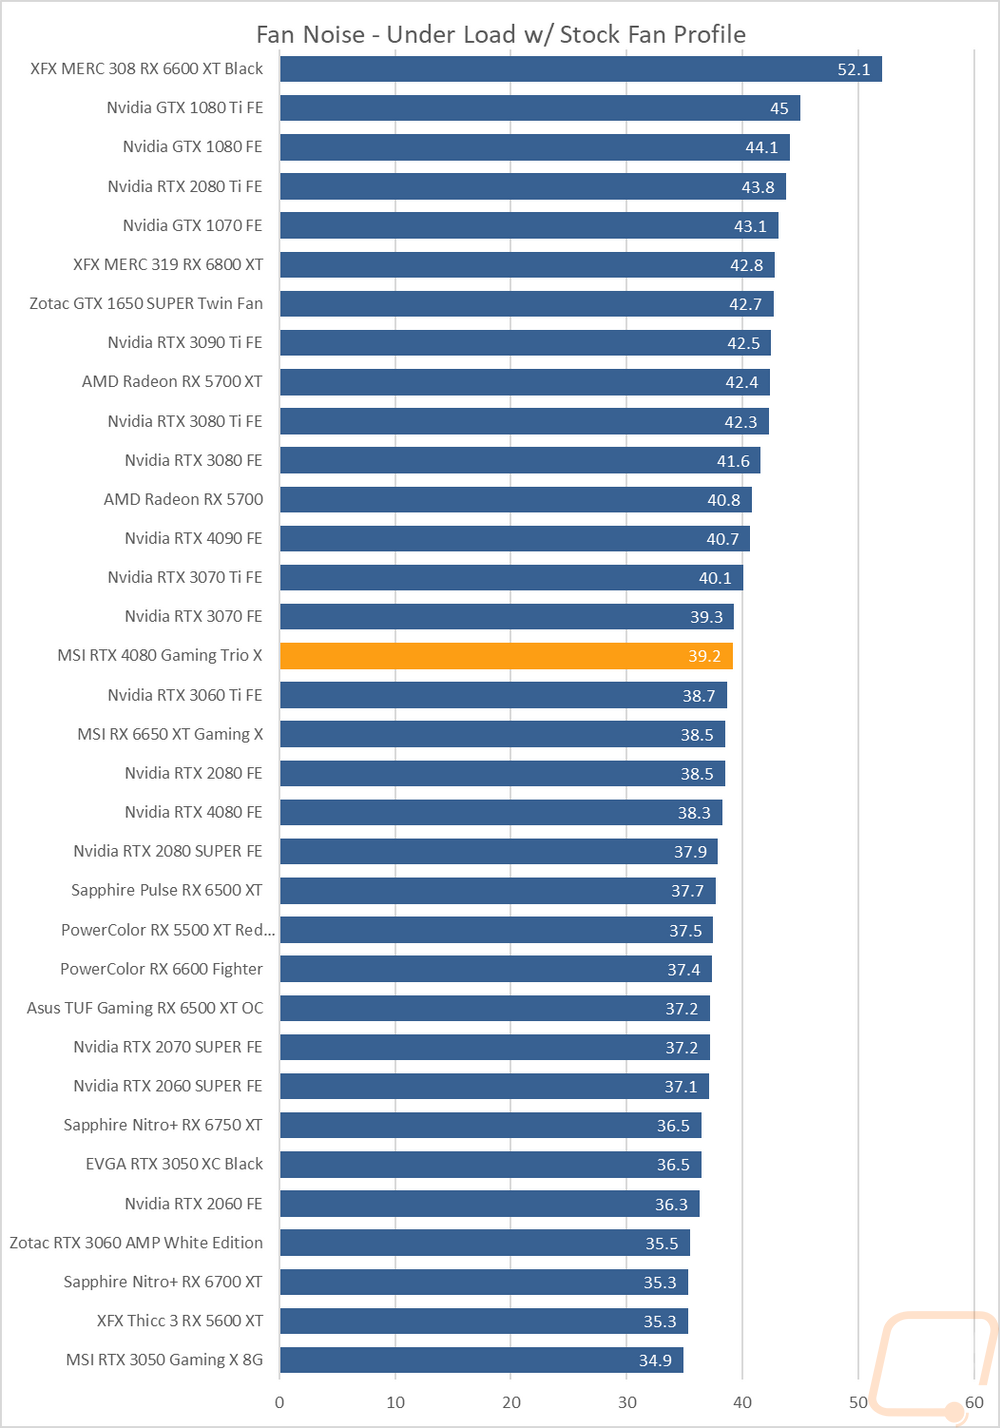
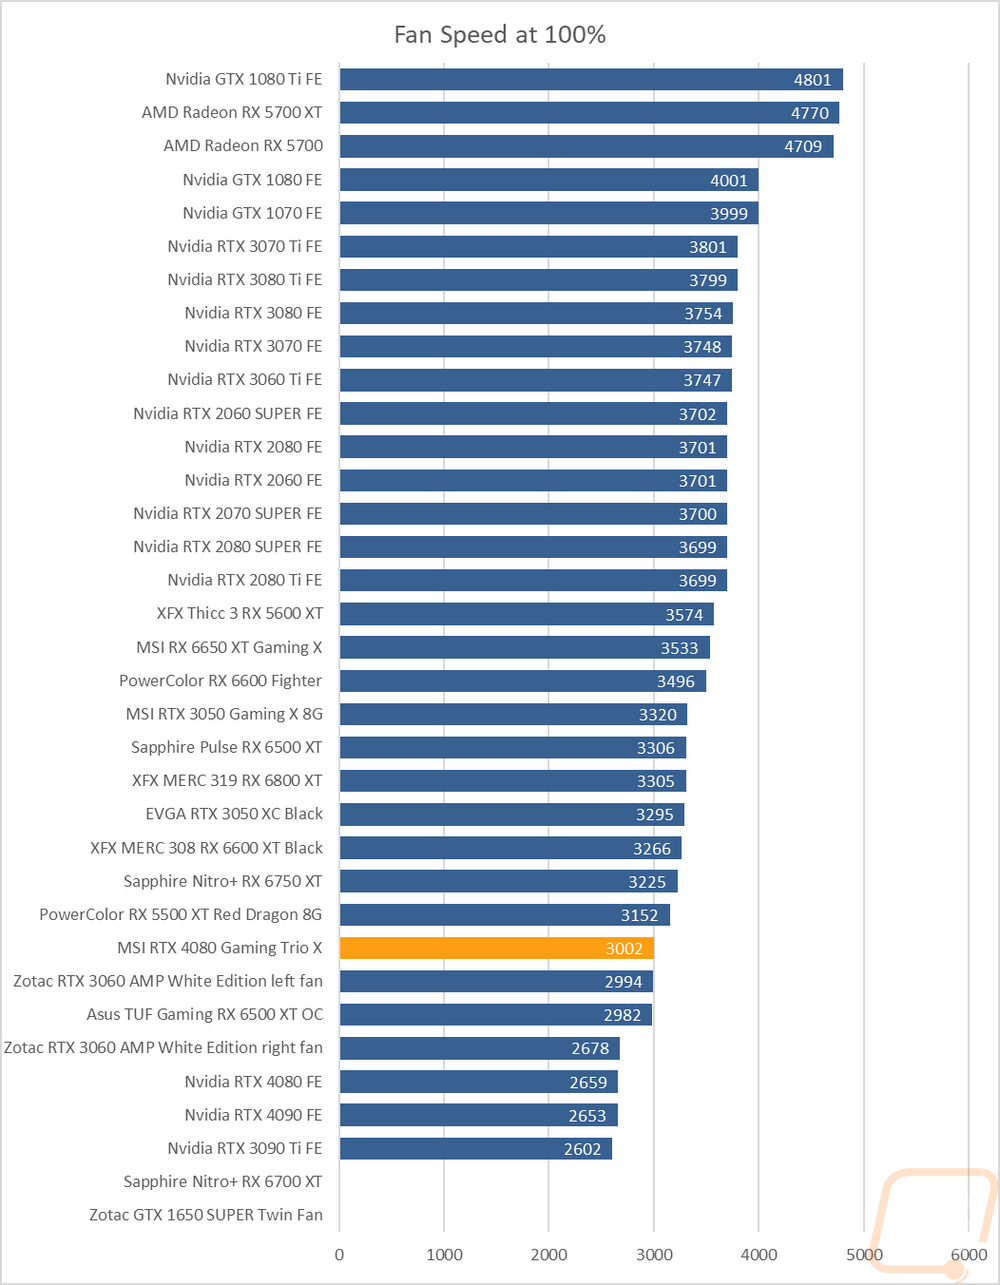
My next round of tests were looking at noise levels. These are especially important to me because I can’t stand to listen to my PC whirling. Especially when I’m not in game and other applications are using the GPU. For my testing, though I first tested with the fan cranked up to 100% to get an idea of how loud it can get, then again at 50% to get an idea of its range. The 4080 Gaming X Trio came in at 41.1 decibels in the 50% fan speed test which was 2 dB lower than the Founders Edition in the same test. Then for the 100% fan speed test the 4080 Gaming X Trio really impressed being nearly at the bottom of our chart while also having three fans. Its 56.2 dB result was 3.2dB lower than the Founders Edition. This becomes even more impressive when we see the fan RPM chart and know that MSI did it with their fans spinning faster than the Founders Edition not to mention having three fans, not two. I also take a look at noise performance while under load. For that when running AIDA64’s stress test I wait until the temperature of the card has leveled off and then measure how loud things are when the card is at its worst-case scenario with the stock fan profile. Here the 4080 Gaming X Trio was farther up in our chart sitting at 39.2 dB which was almost 1 dB higher than the Founders Edition. This is an overclocked card, but we are also running it with the Silent Mode BIOS so I was surprised it didn’t outperform the Founders Edition card, but overall this still put it in the middle of the chart which still isn’t bad.
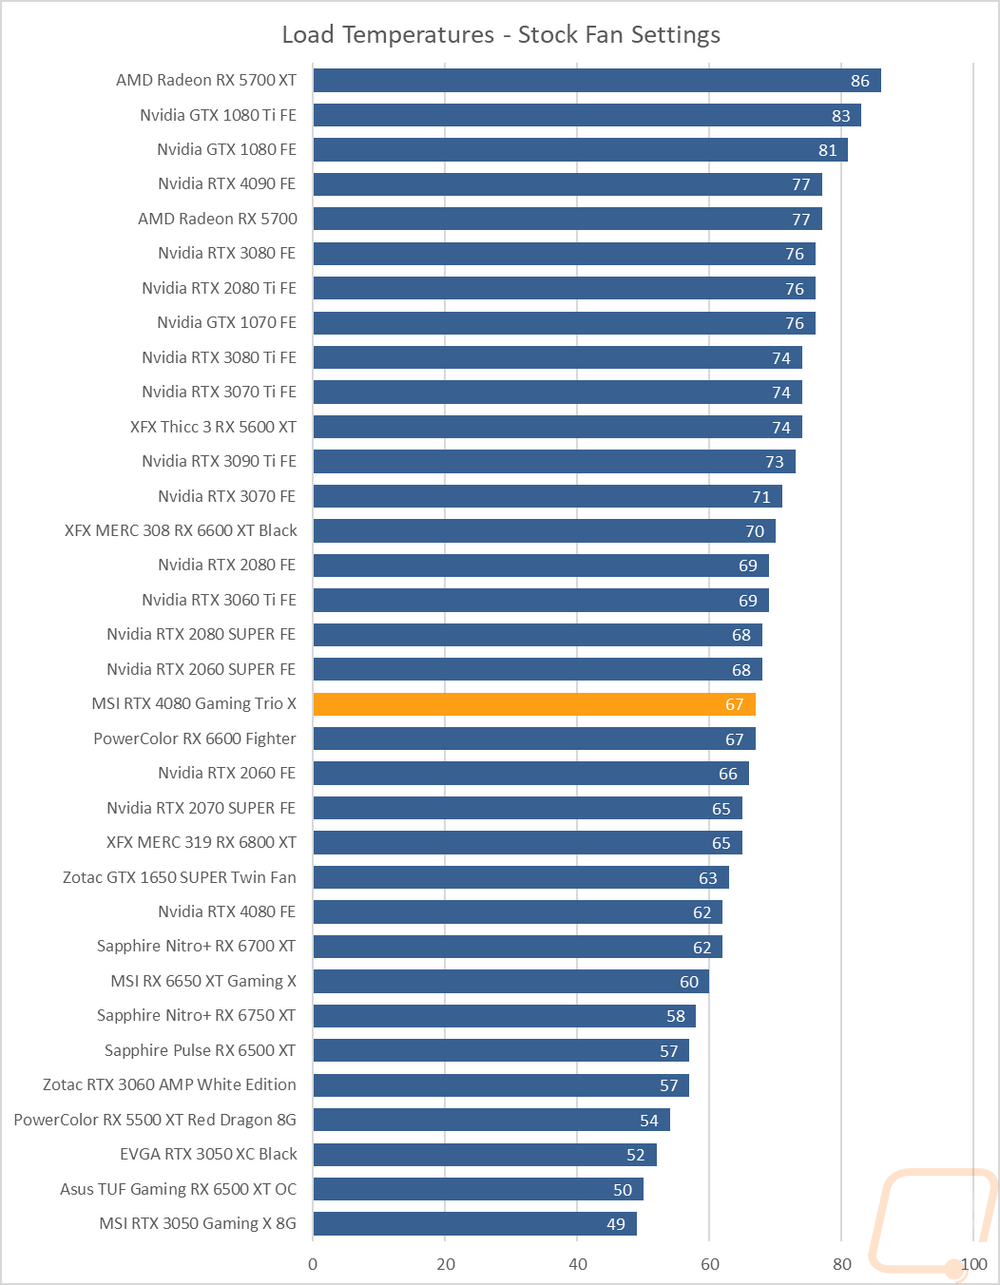
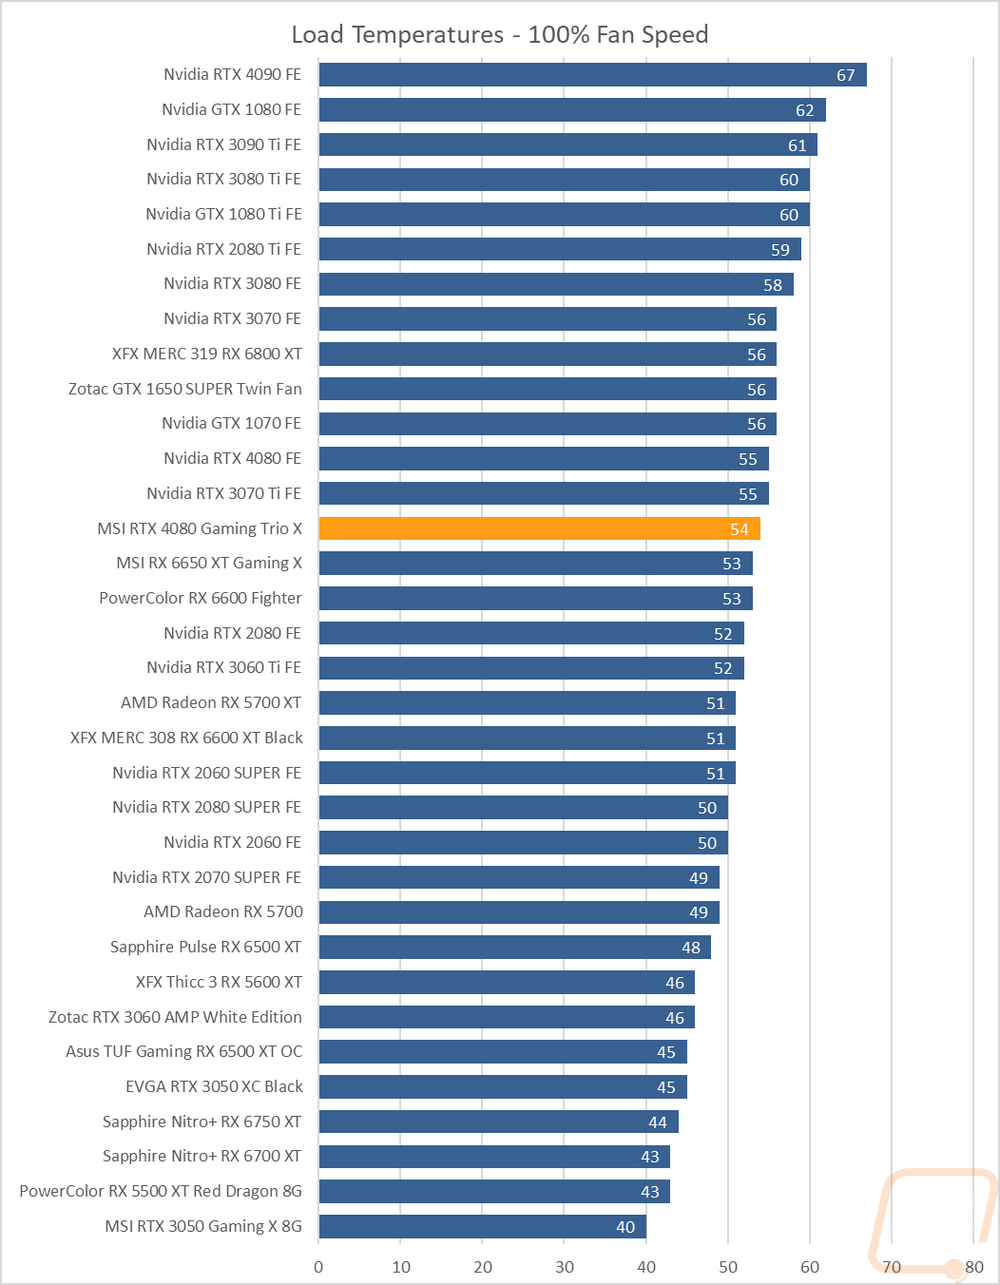
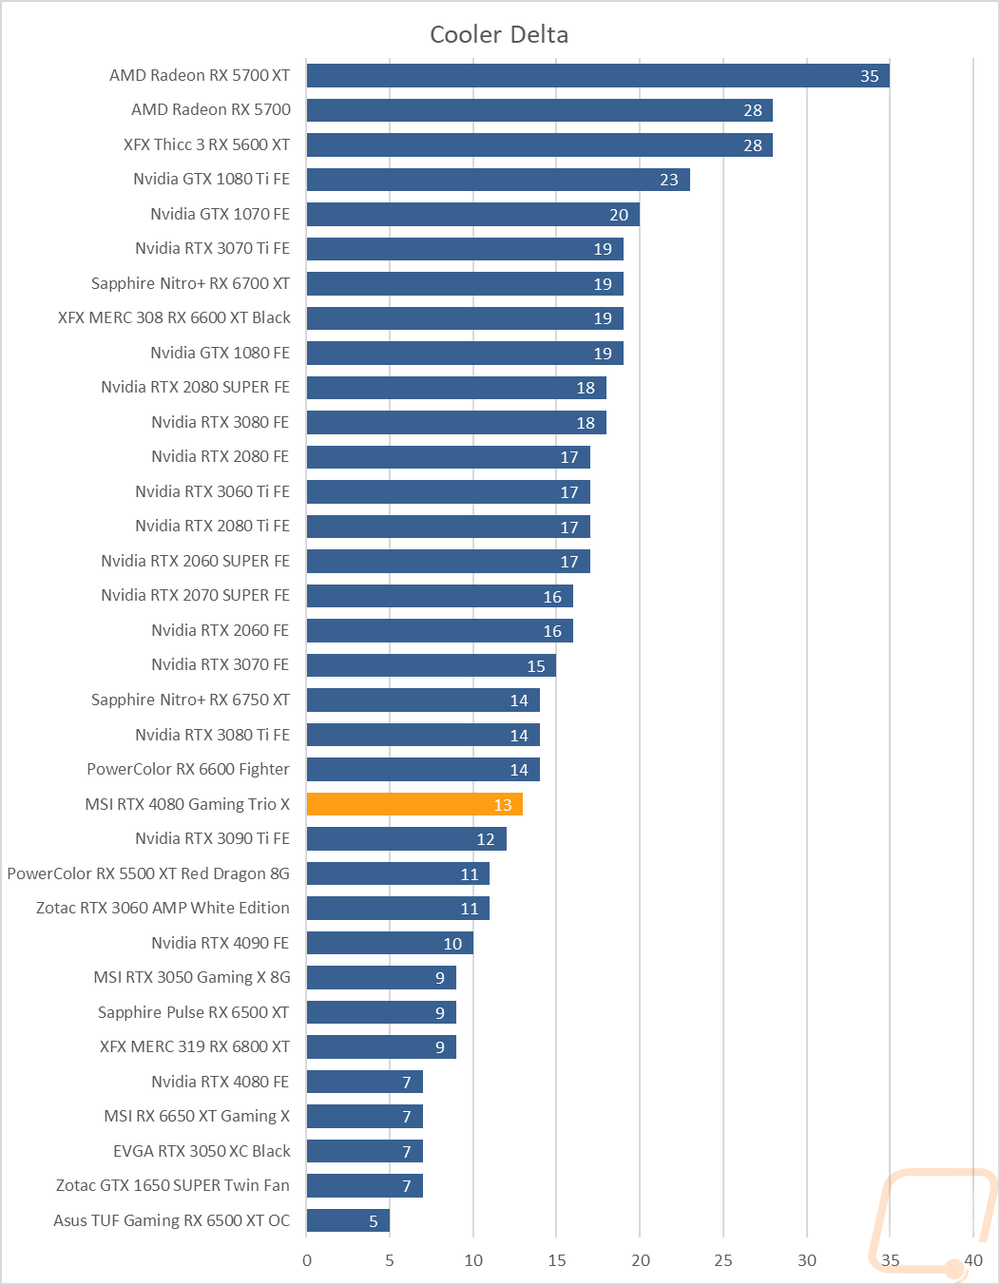
To finish up my testing I of course had to check out the cooling performance. To do this I ran two different tests. I used AIDA64’s Stress Test run for a half-hour each to warm things up. Then I documented what temperature the GPU leveled out at with the stock fan profile and then again with the fans cranked up to 100%. With the stock profile, the MSI RTX 4080 Gaming X Trio came in at 67c which was a little warmer than the RTX 4080 Founders Edition, but we do have to remember that it does have an overclock and pulled more power in AIDA64 as well. Turning the three fans up to 100% fan speed in the same test did lower the temps down to 54c which is 1c lower than the Founders Edition in the same test and makes for a delta of 13c. This shows us that the 4080 Gaming X Trio does have headroom left in it.
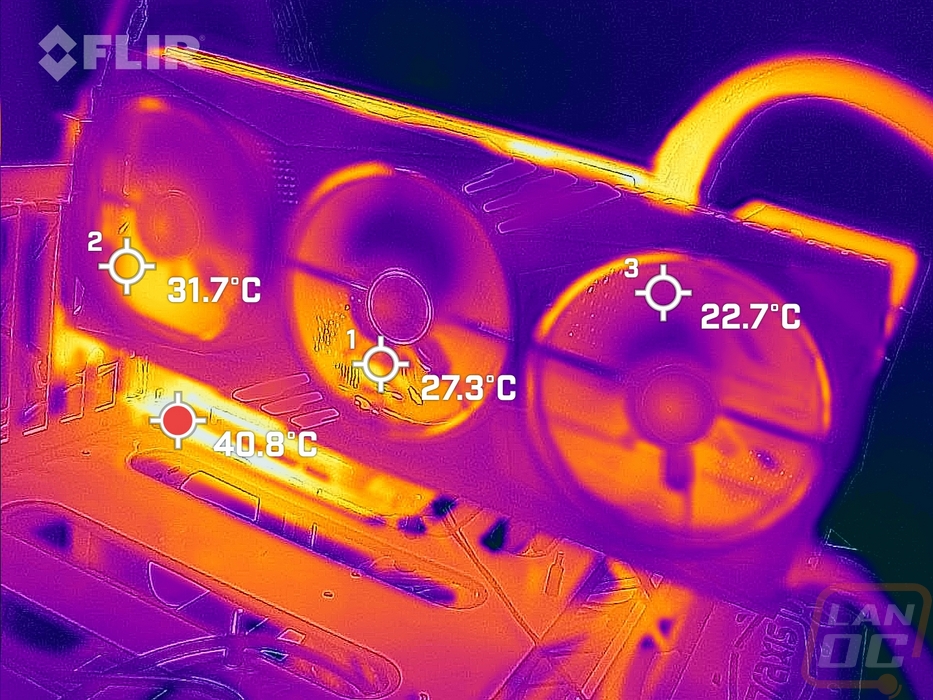
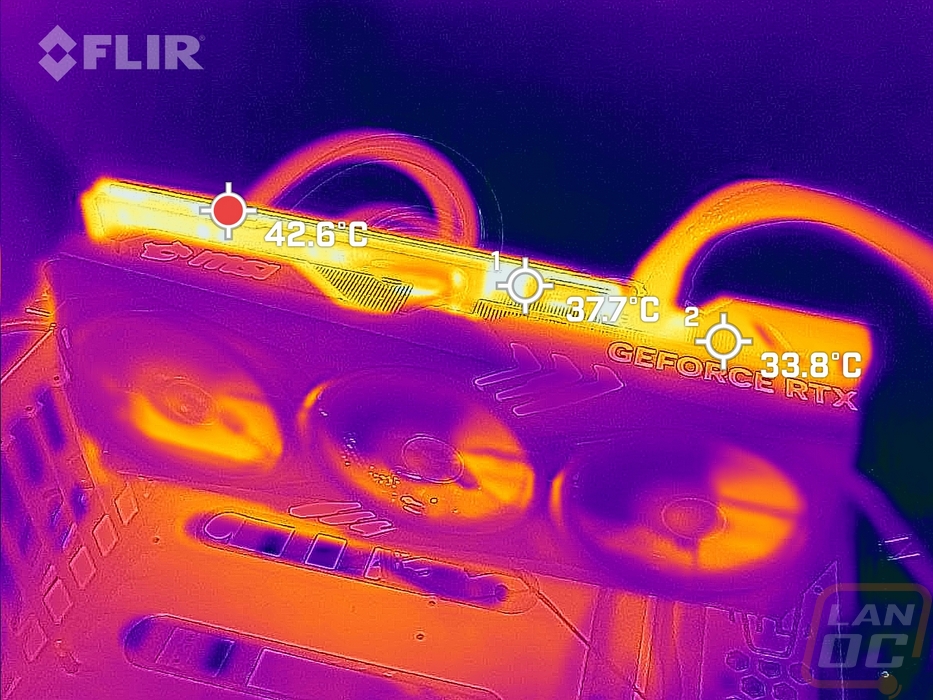
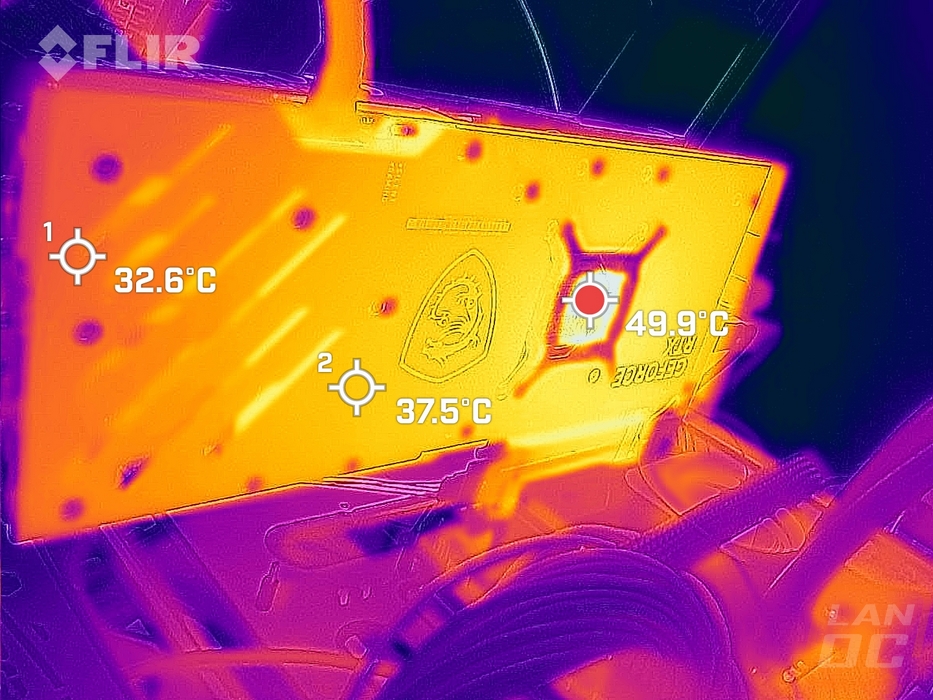
While running the stock fan profile testing I also took the time to get a few thermal images so we could see what is going on. The 4080 Gaming X Trio looks way different than the Founders Edition on the thermals. The hotspot on the fan side isn’t even on the card, it is up under the card where it is blowing its warmed air out the top and bottom, this supports what I mentioned before about being careful about putting your main M.2 under the card. Beyond that, the fans get cooler as you go to the right and the top half of the cooler seems to run cooler than the bottom. When looking down on the top edge it is hottest over on the far left directly above the GPU. Then on the back, the hotspot is of course in the opening behind the GPU with the PCB being directly exposed there.