Compute Benchmarks
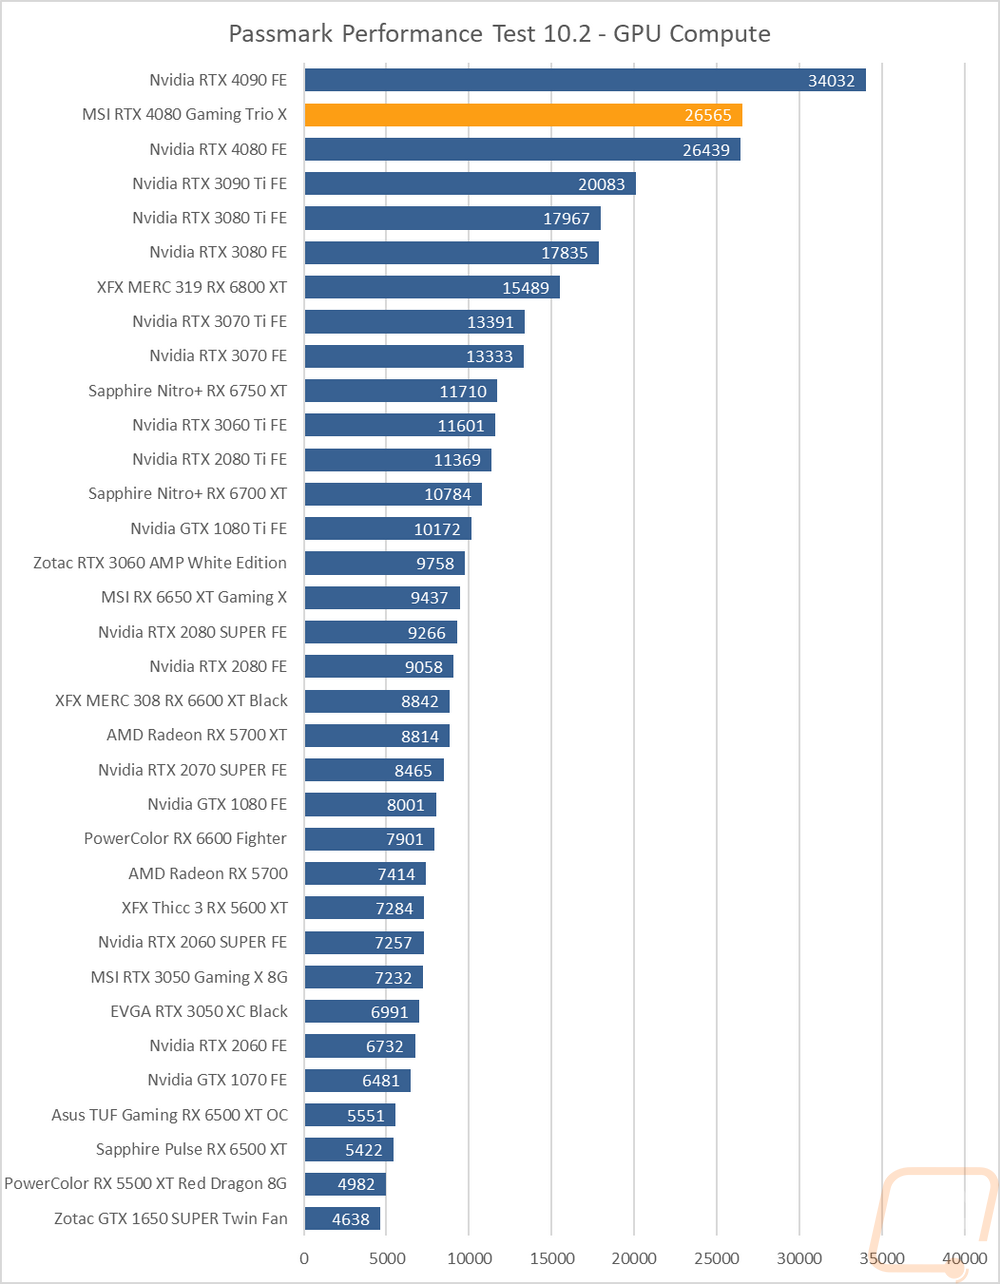
Now some people don’t need a video card for gaming, they need the processing power for rendering or 2D/3D production, or in some cases people who game also do work on the side. So it is also important to check out the compute performance on all of the video cards that come in. That includes doing a few different tests. My first test was a simple GPU Compute benchmark using Passmark’s Performance Test 10 and the 4080 Gaming X Trio scored 26565 to the 4080 Founders Editions 26439 which is just a difference of 126 points or .47% improvement overall.
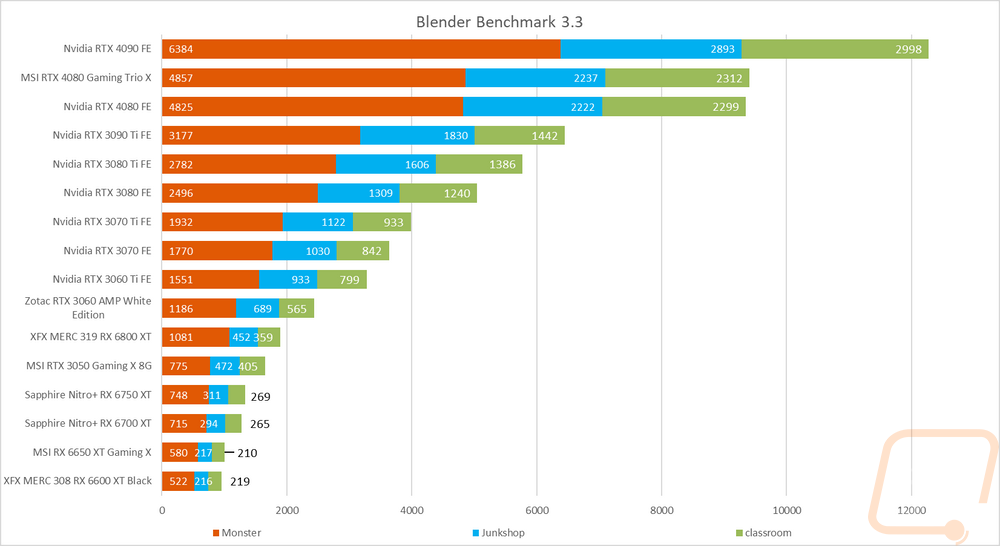
Blender is always my favorite compute benchmark because the open-source 3D rendering software is very popular and it isn’t a synthetic benchmark. With the latest version of Blender, they redid the benchmark so we now have a new test that runs three different renderings and gives each a score. I have all three stacked together so we can see the overall performance. The 4080 Gaming X Trio was consistent in improving on the scores from the 4080 Founders Edition but each score was just a small bump which even when added up together wasn’t a big difference.
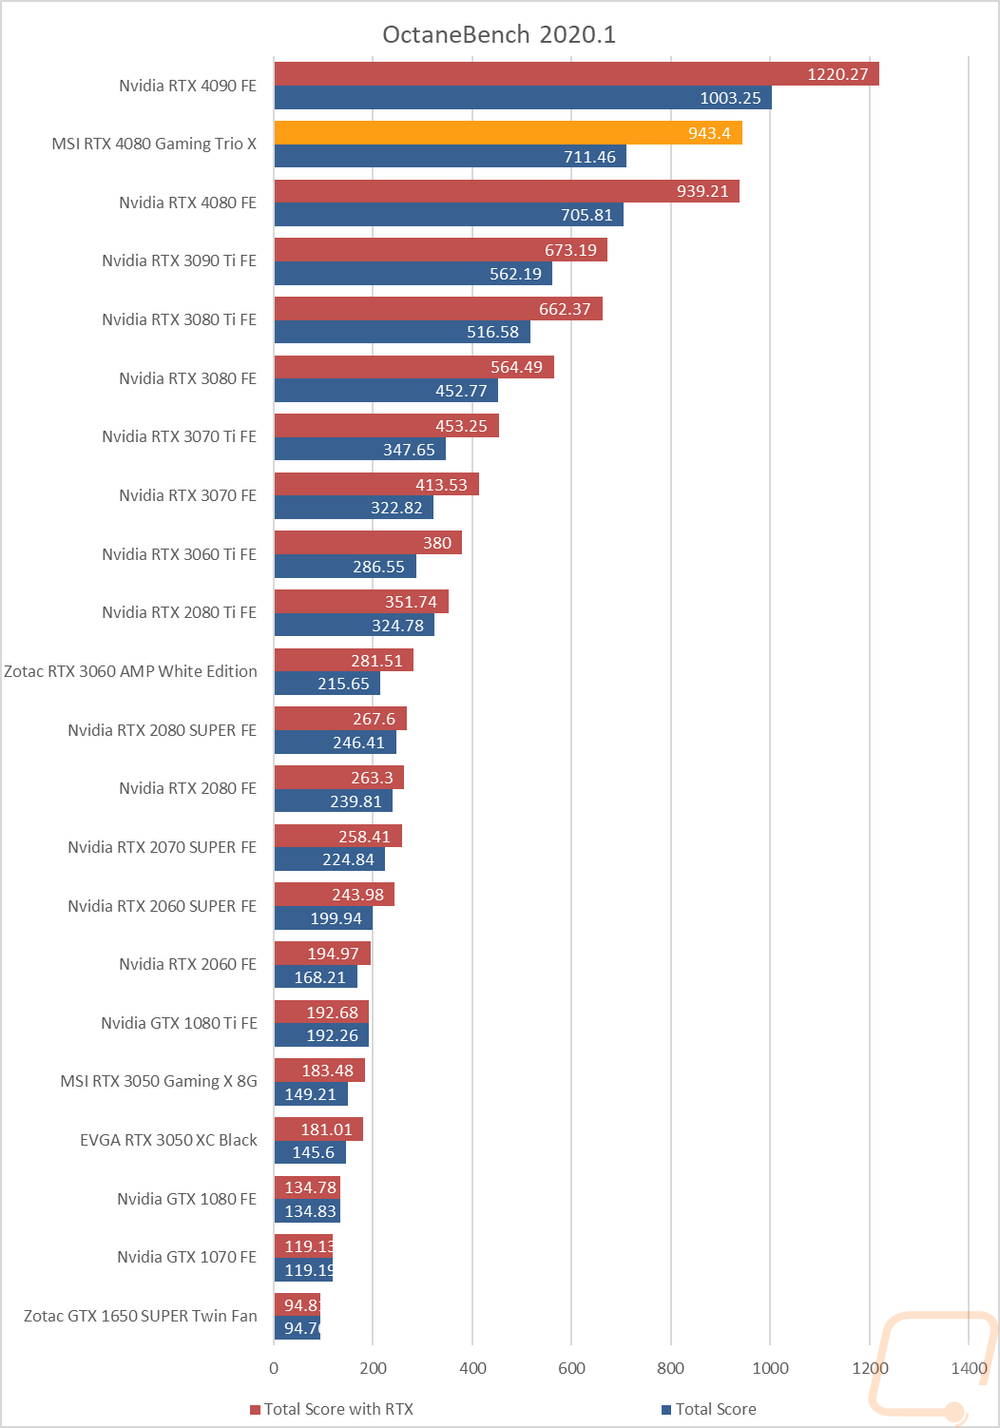
For CUDA-based cards, I also check out OctaneRender performance using their OctaneBench 2060.1 benchmark which allows me to check out both RTX and non-RTX rendering performance. Here the 4080 Gaming X Trio saw an improvement of .44% in the RTX results and .8% in the CUDA test over the 4080 Founders Edition.
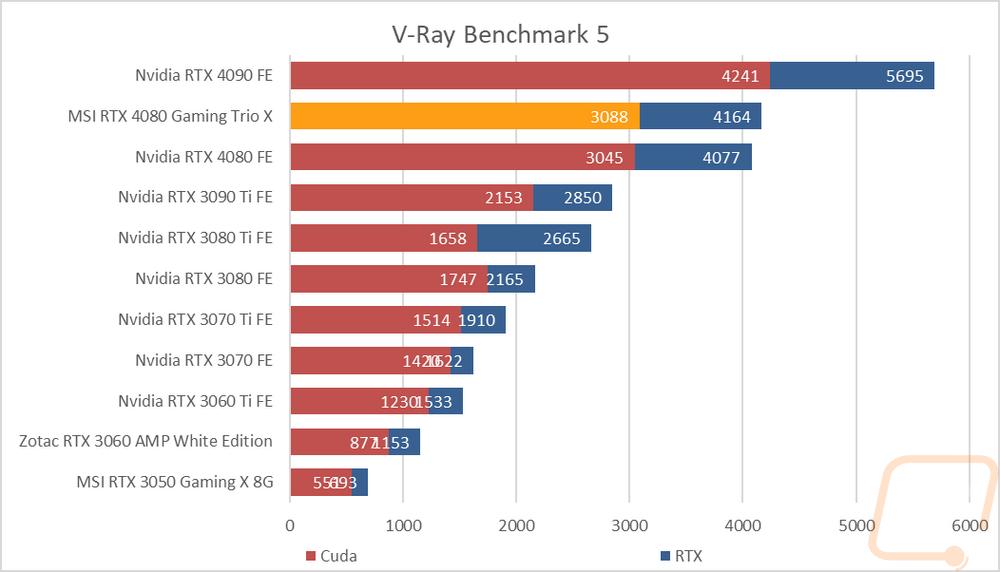
For an additional CUDA-based test I also ran V-Ray Benchmark 5 to check out CUDA and RTX performance in the 3D rendering and simulation software. The 4080 Gaming X Trio didn’t gain much in the CUDA test but did see a bigger improvement over the stock-clocked RTX 4080 Founders Edition in the RTX test. This wasn’t enough to make any difference in the gap between the 4080s and the 4090 at the top of the chart though.