Synthetic Benchmarks
As always I like to start my testing with a few synthetic benchmarks. 3DMark especially is one of my favorites because it is very optimized in both Nvidia and AMD drivers. It's nice to not have to worry about it being favored too much either way and the repeatability of the results makes it a nice chance to compare from card to card, especially when comparing with the same GPU. The 4080 Gaming X Trio is overclocked over the RTX 4080 Founders Edition with a small overclock of 90 MHz so it will be interesting to see how that changes the performance, same with the larger heatsink potentially allowing for more wattage as well.
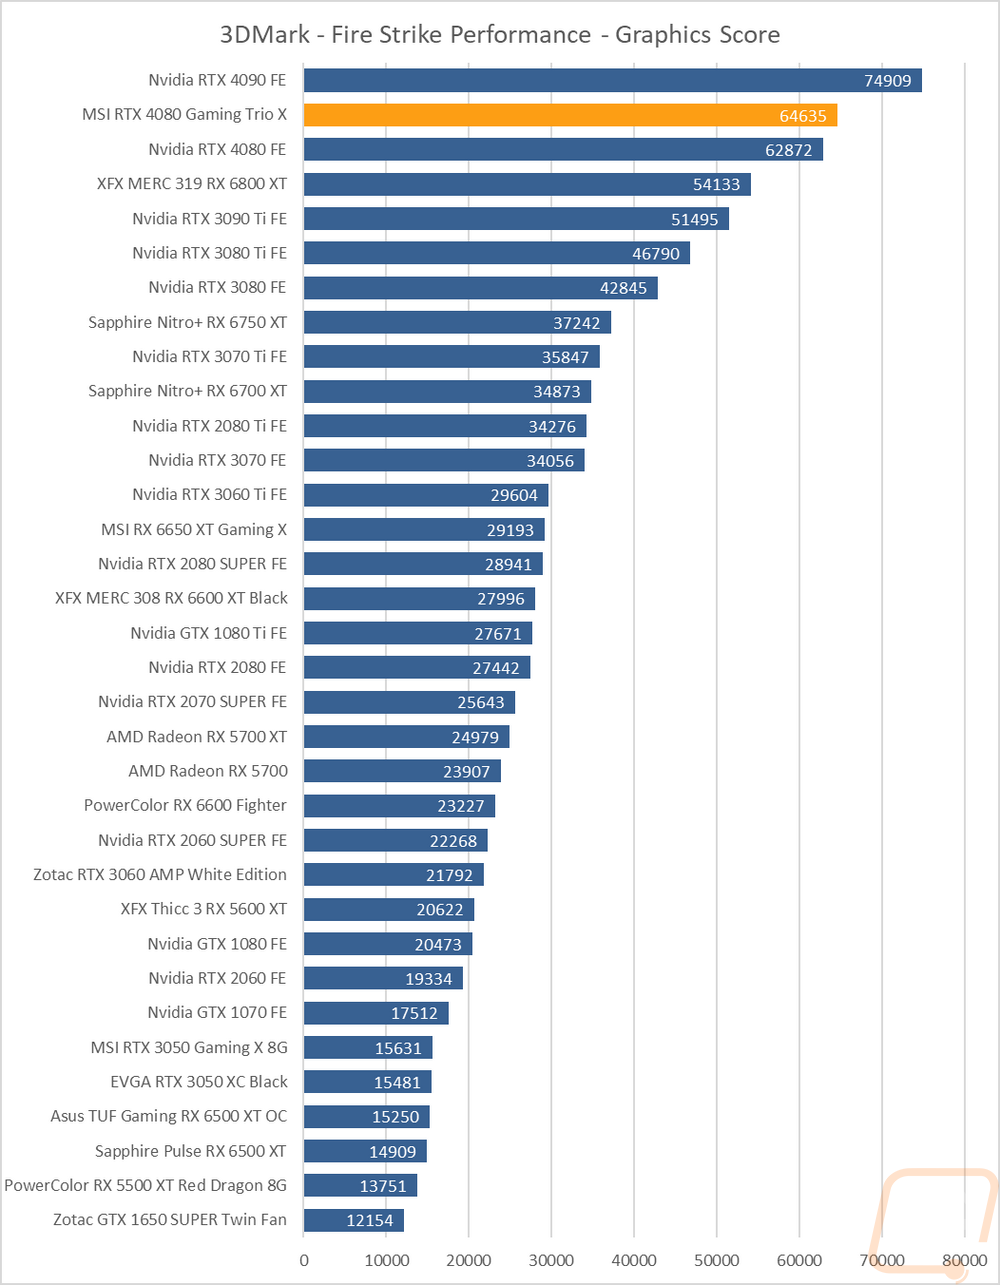
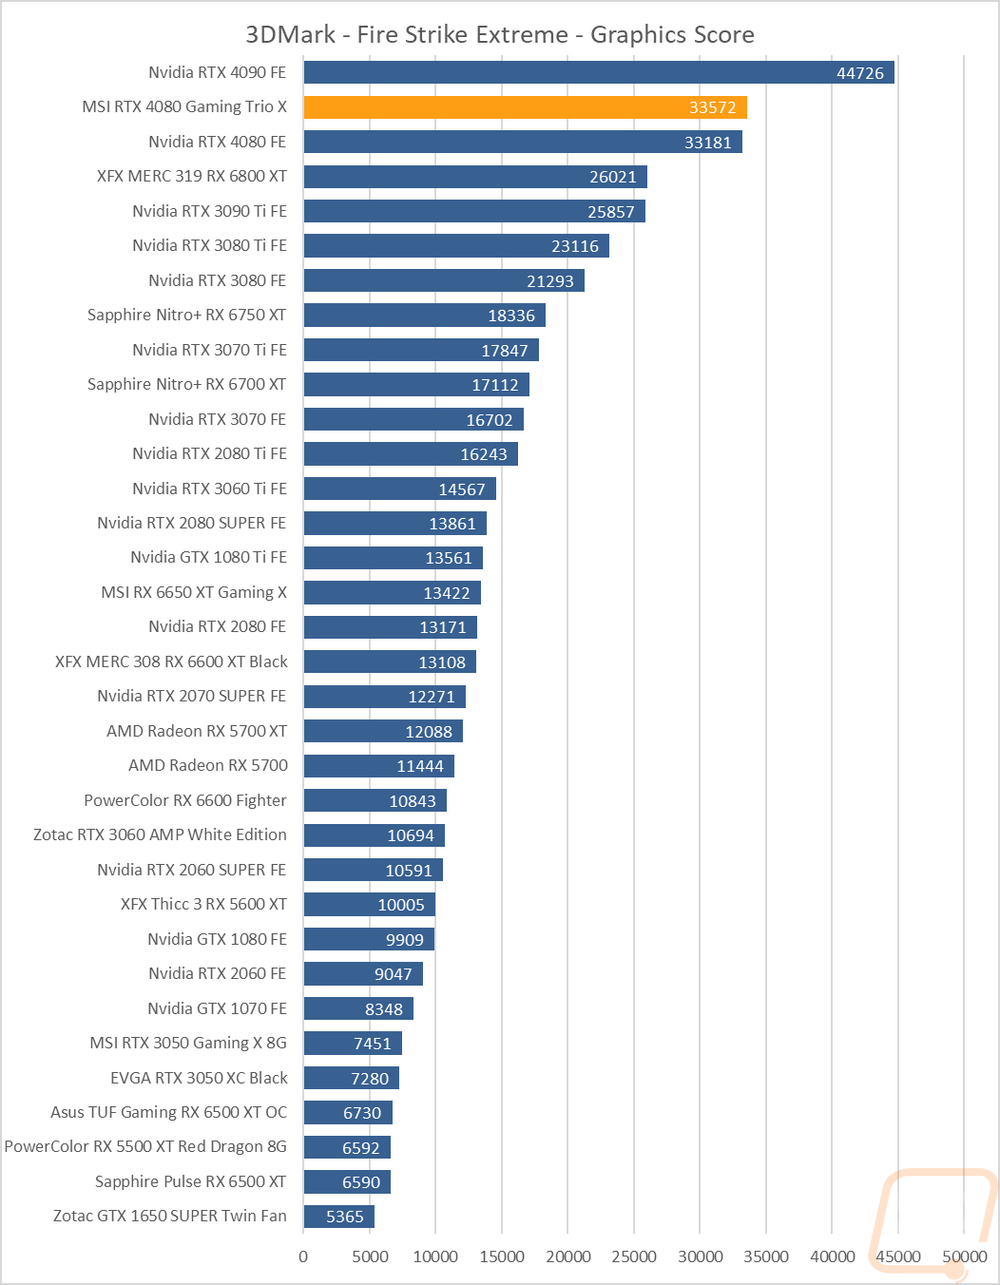
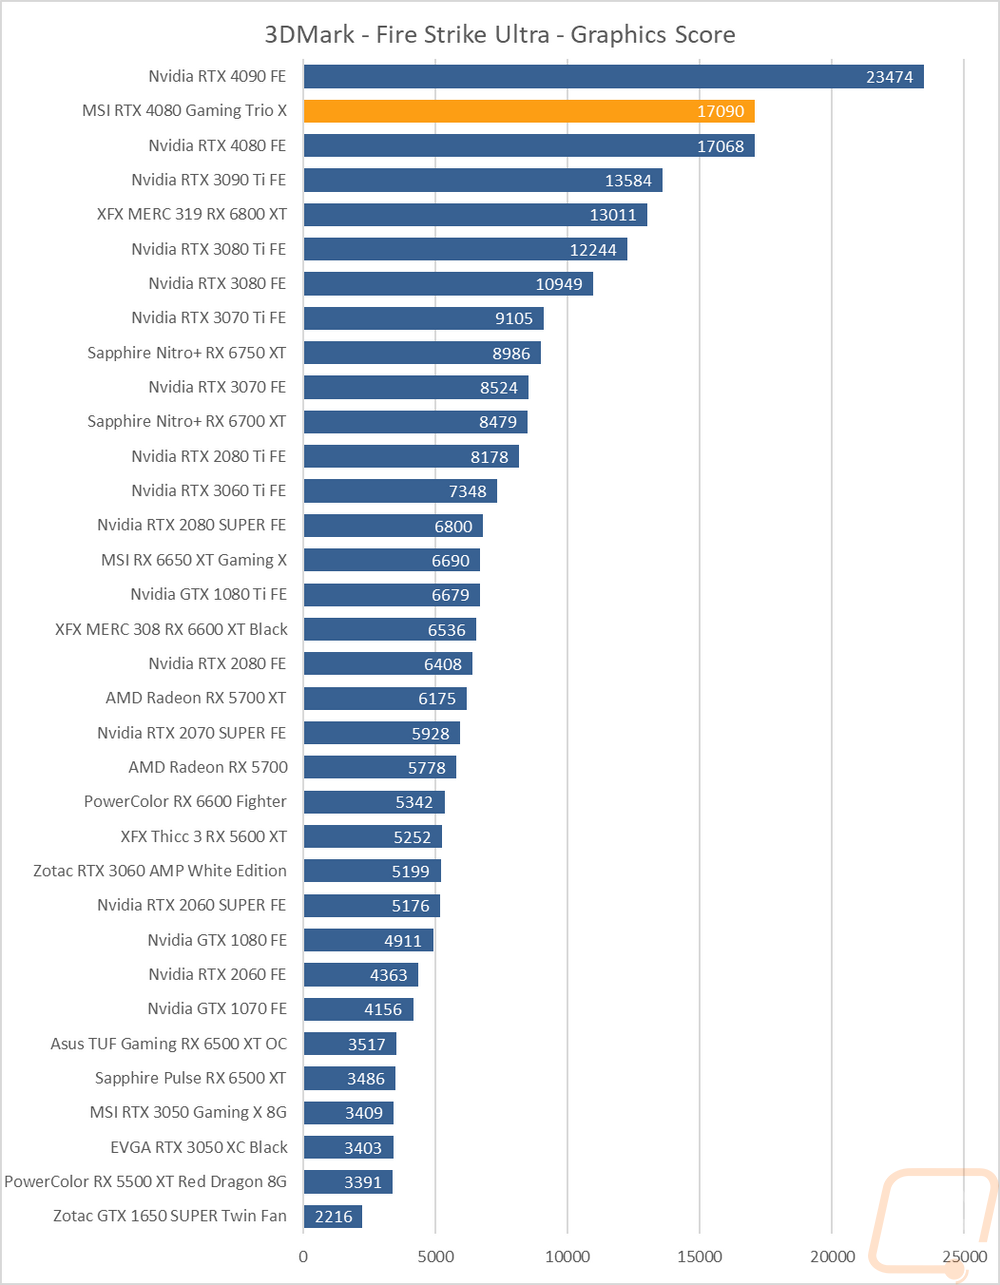
The first round of tests were done in the older Fire Strike benchmark which is a DX11 test. There are three detail levels, performance, extreme, and ultra. The 4080 Gaming X Trio put itself firmly ahead of the 4080 Founders Edition in all three of these tests. Interestingly the base fire strike result stands out more than on the other tests with the overclock giving it a 2.8% lead whereas on the ultra test it was just .1%.
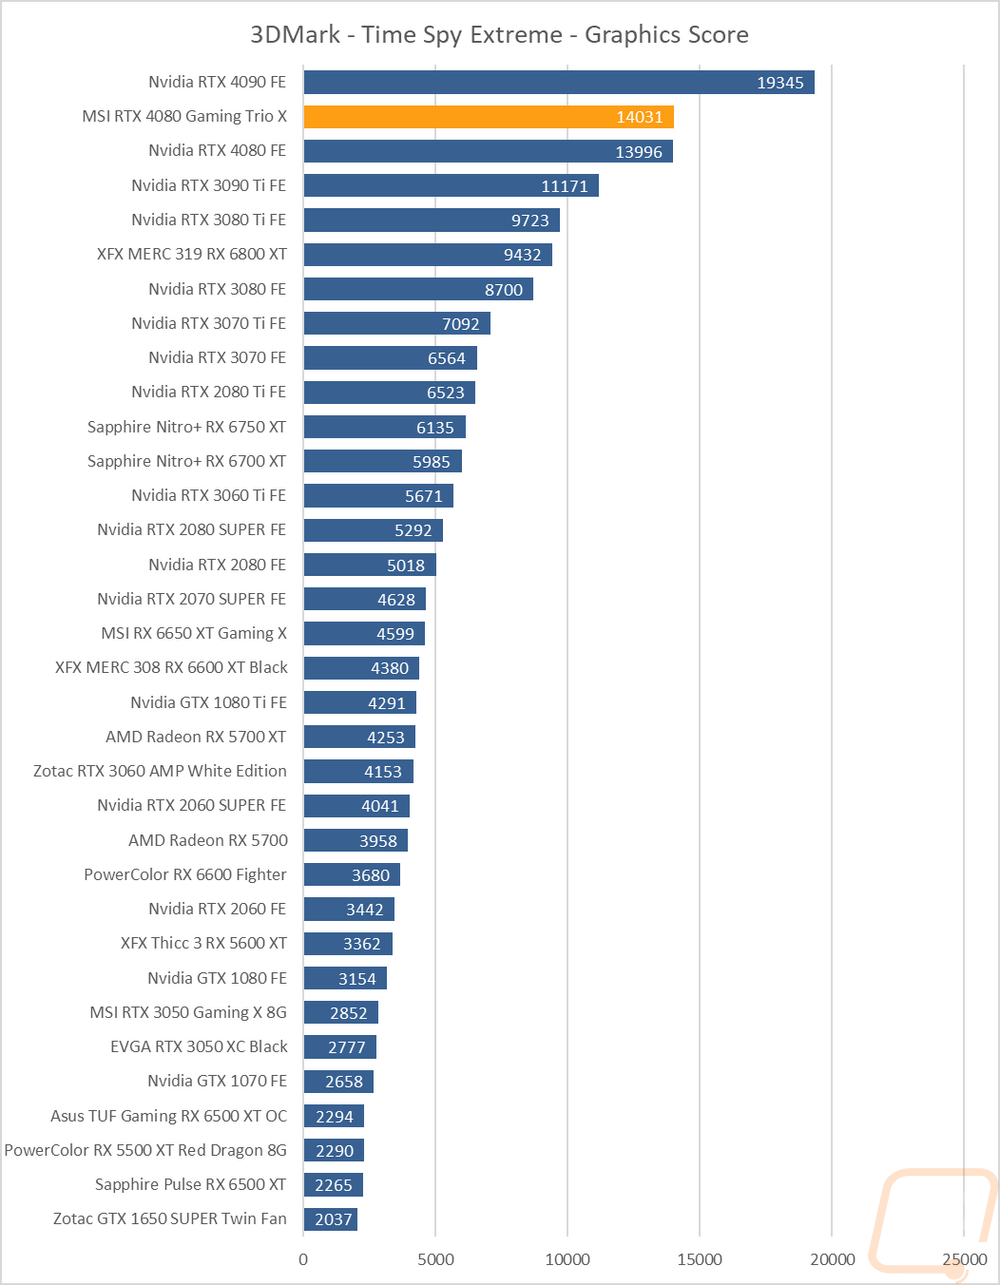
The next two were both based on the Time Spy benchmark. One is the standard test and then there is the extreme detail level. The 4080 Gaming X Trio performed similarly here with it ahead of the stock-clocked 4080 Founders Edition but has a larger lead on the base Time Spy where the overclock made less of a difference in the extreme detail test.

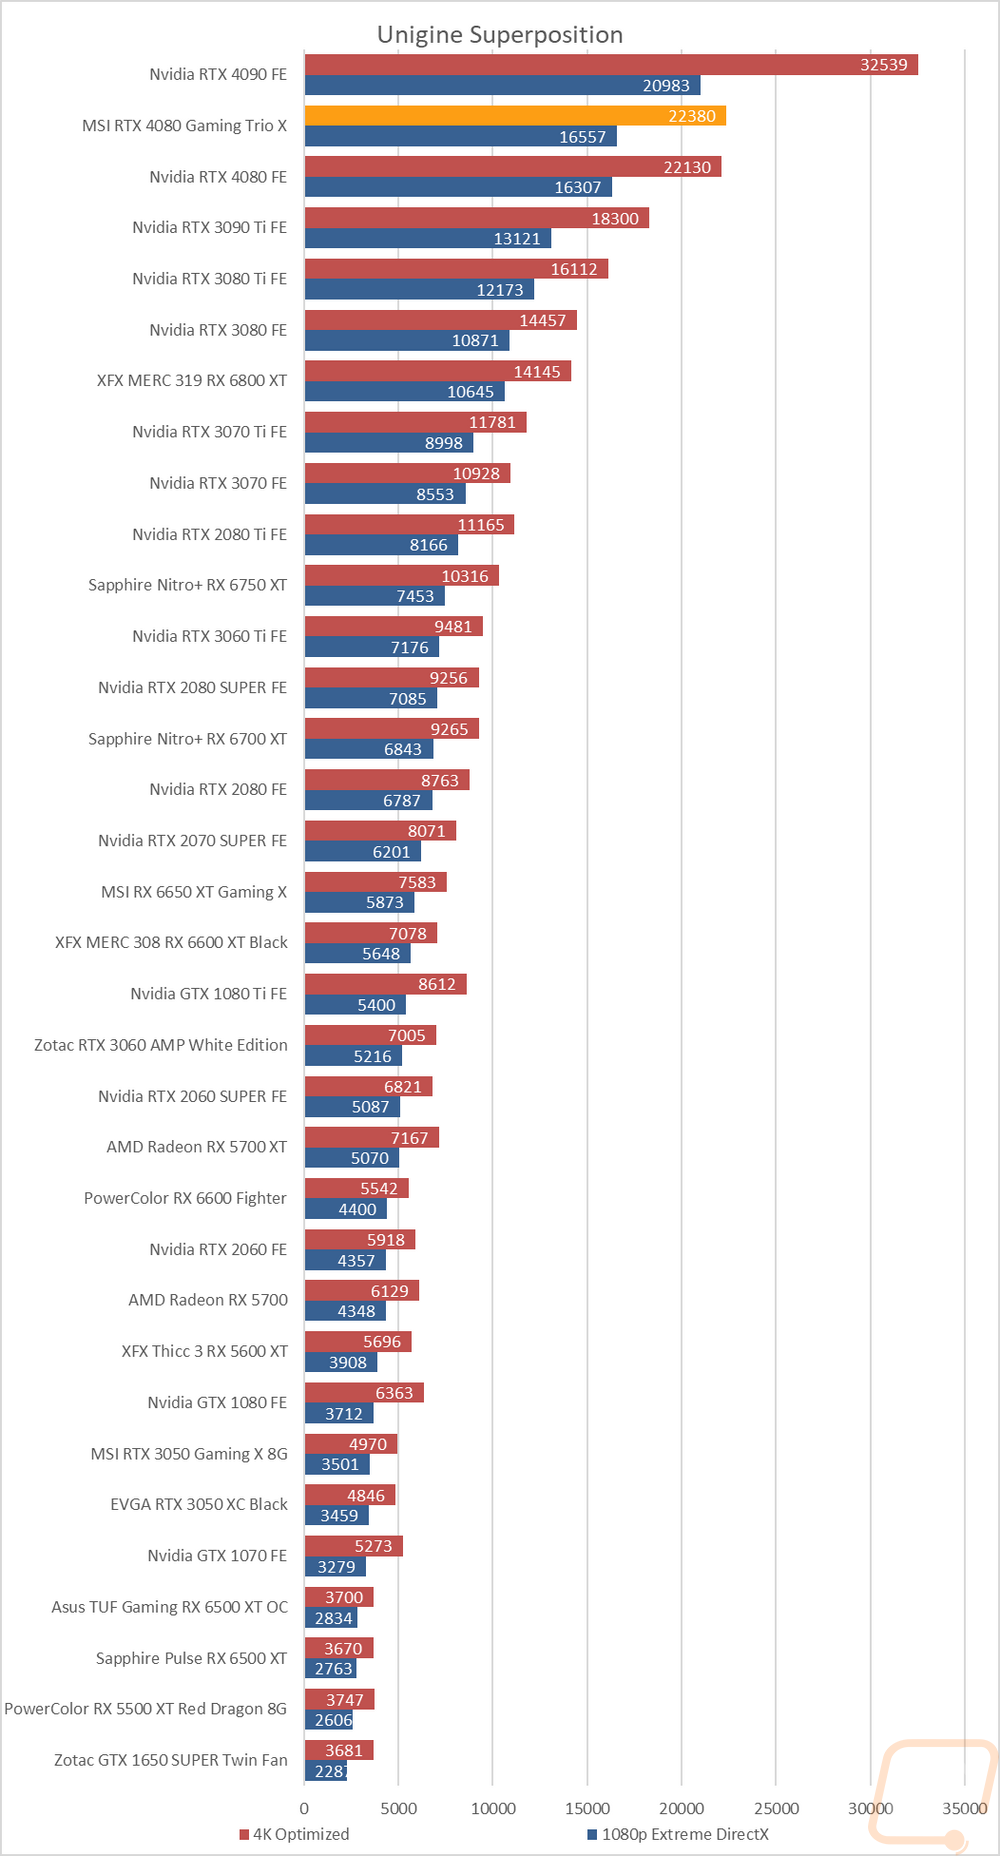
The last test was using the Unigine-based Superposition benchmark and I tested at 1080p with the extreme detail setting as well as the 4K optimized setting. In the extreme detail setting the 4080, Gaming X Trio improved on the RTX 4080 Founders Edition score by 250 points and 250 again in the 4k test as well.