Synthetic Benchmarks
As always I like to start my testing with a few synthetic benchmarks. 3DMark especially is one of my favorites because it is very optimized in both Nvidia and AMD drivers. It's nice to not have to worry about it being favored too much either way and the repeatability of the results makes it a nice chance to compare from card to card, especially when comparing with the same GPU.
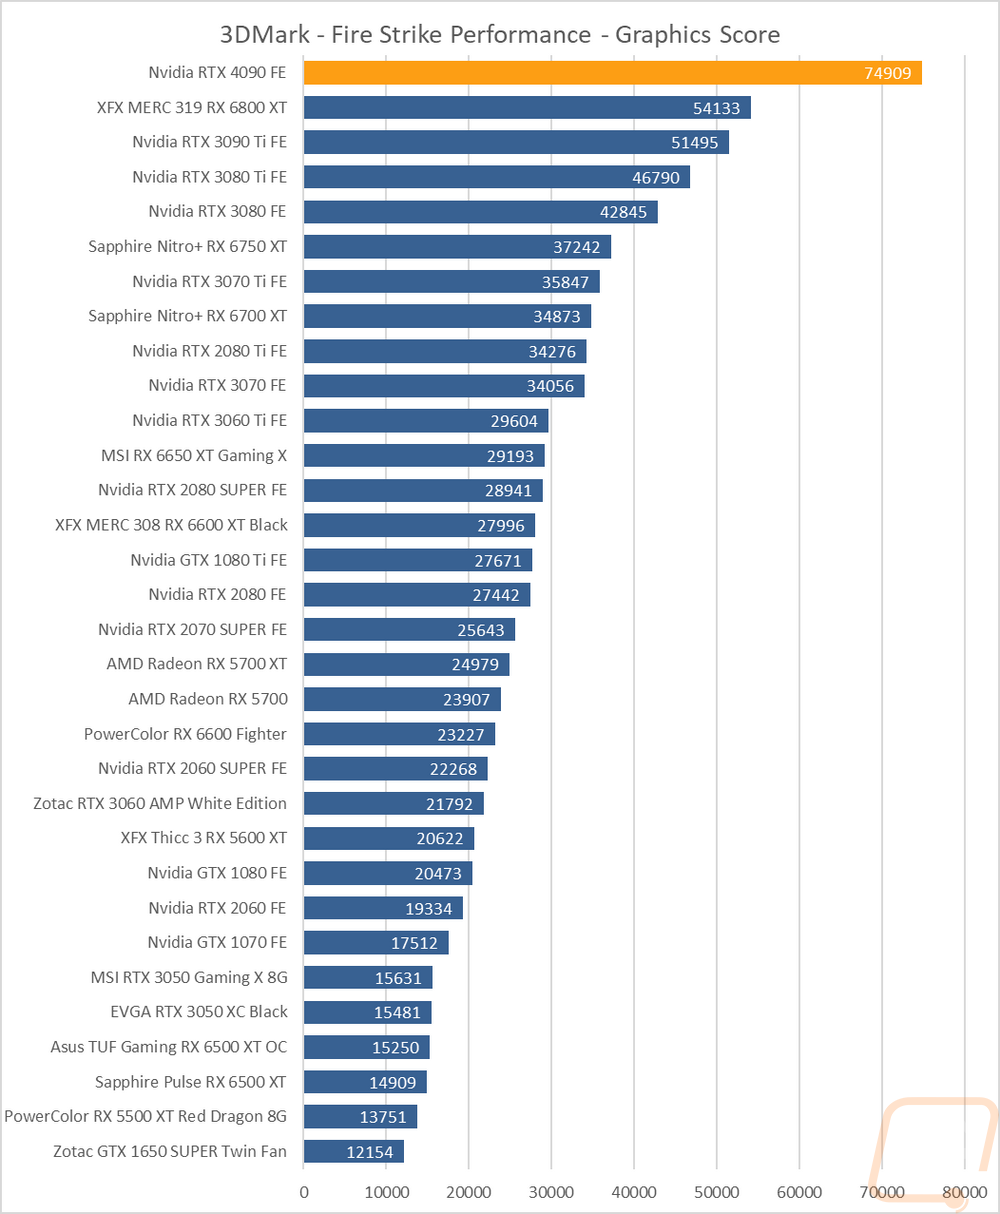
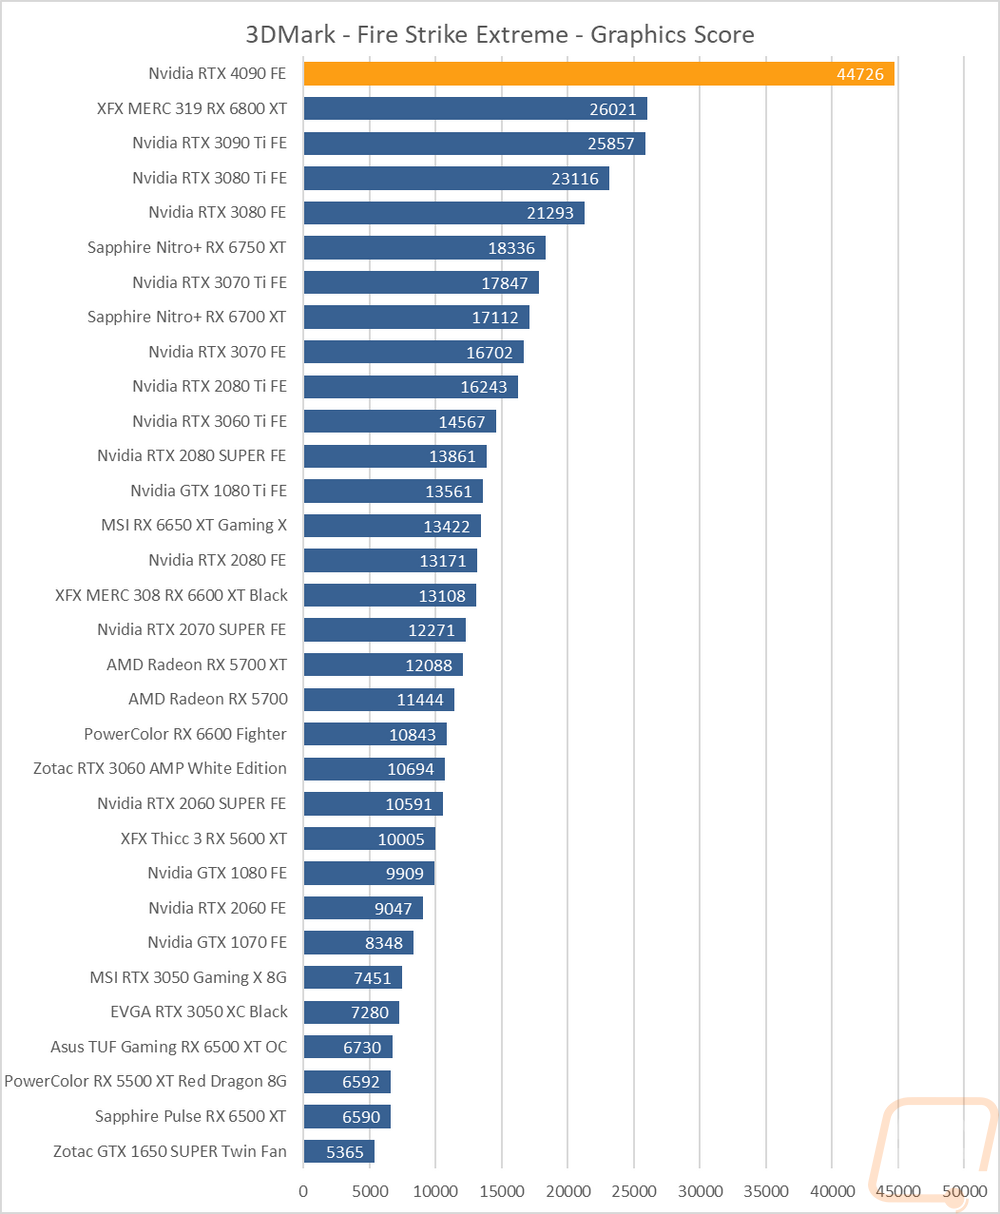
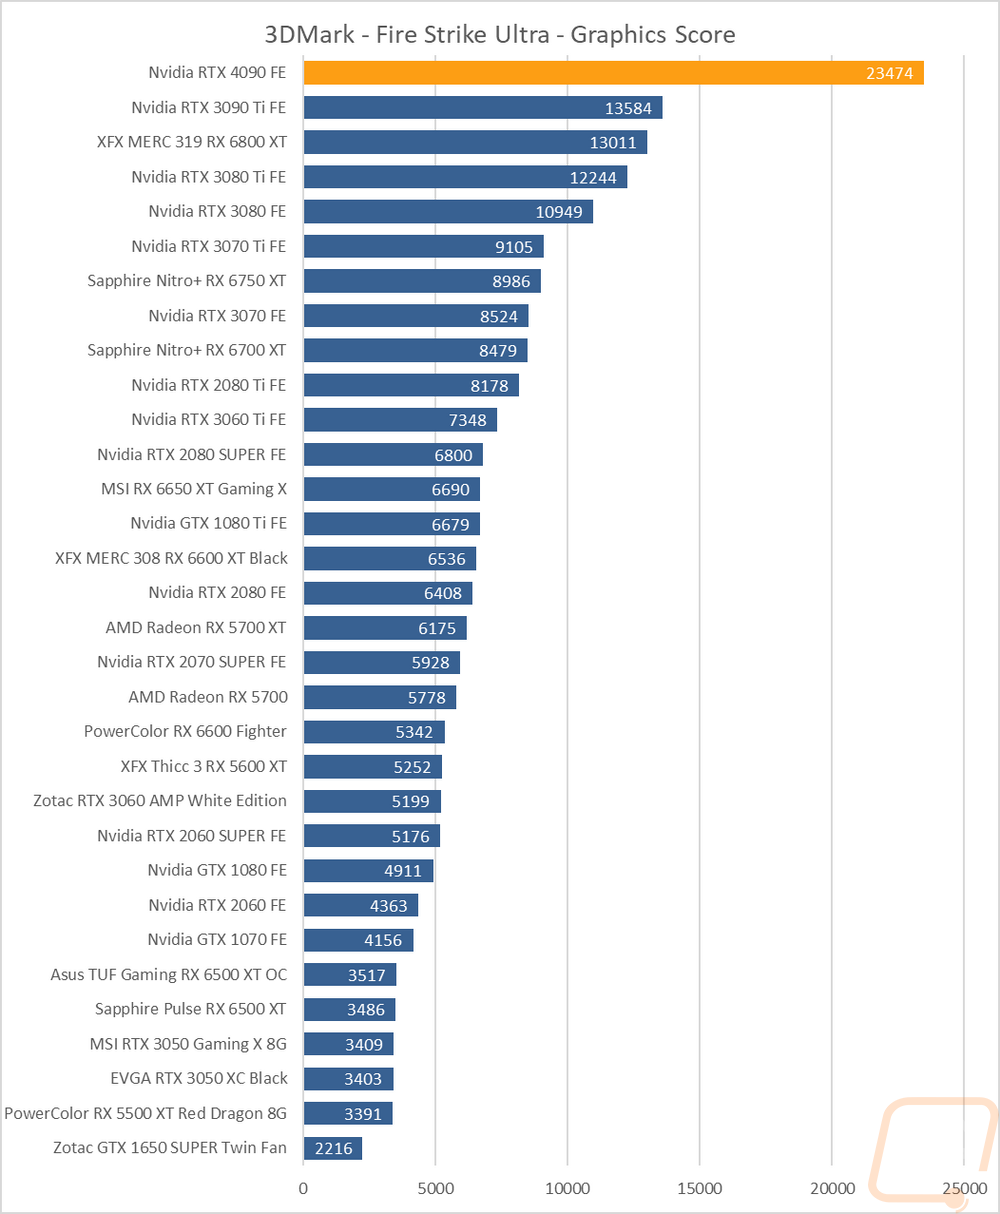
The first round of tests were done in the older Fire Strike benchmark which is a DX11 test. There are three detail levels, performance, extreme, and ultra. The RTX 4090 Founders Edition jumps out in front in all three of these tests but I should note that while our coverage includes most modern cards including an RTX 3090 Ti that Nvidia was nice enough to send over to fill in that gap in our numbers but on the AMD side we don’t have a Radeon 6900XT/6950XT which at least in this test given where the 6800XT performs would fill in that gap The 6950 XT would be in the 61500 range for an overclocked card, the 6900 XT would be in the 5600 range in base Fire Strike the RTX 4090 Founders Edition is still well above that though at 74909. The gap gets even larger in the extreme and ultra tests where the RTX 4090 Founders Edition can utilize its 24GB of GDDR6X VRAM and memory bandwidth with it scoring a 44726 which is still 73% ahead of the RTX 3090 Ti which in itself is mind-blowing. The same is seen in Fire Strike Ultra as well and for that test the 6950XT if we had one would be around 15000, nowhere near the 23474 of the RTX 4090.
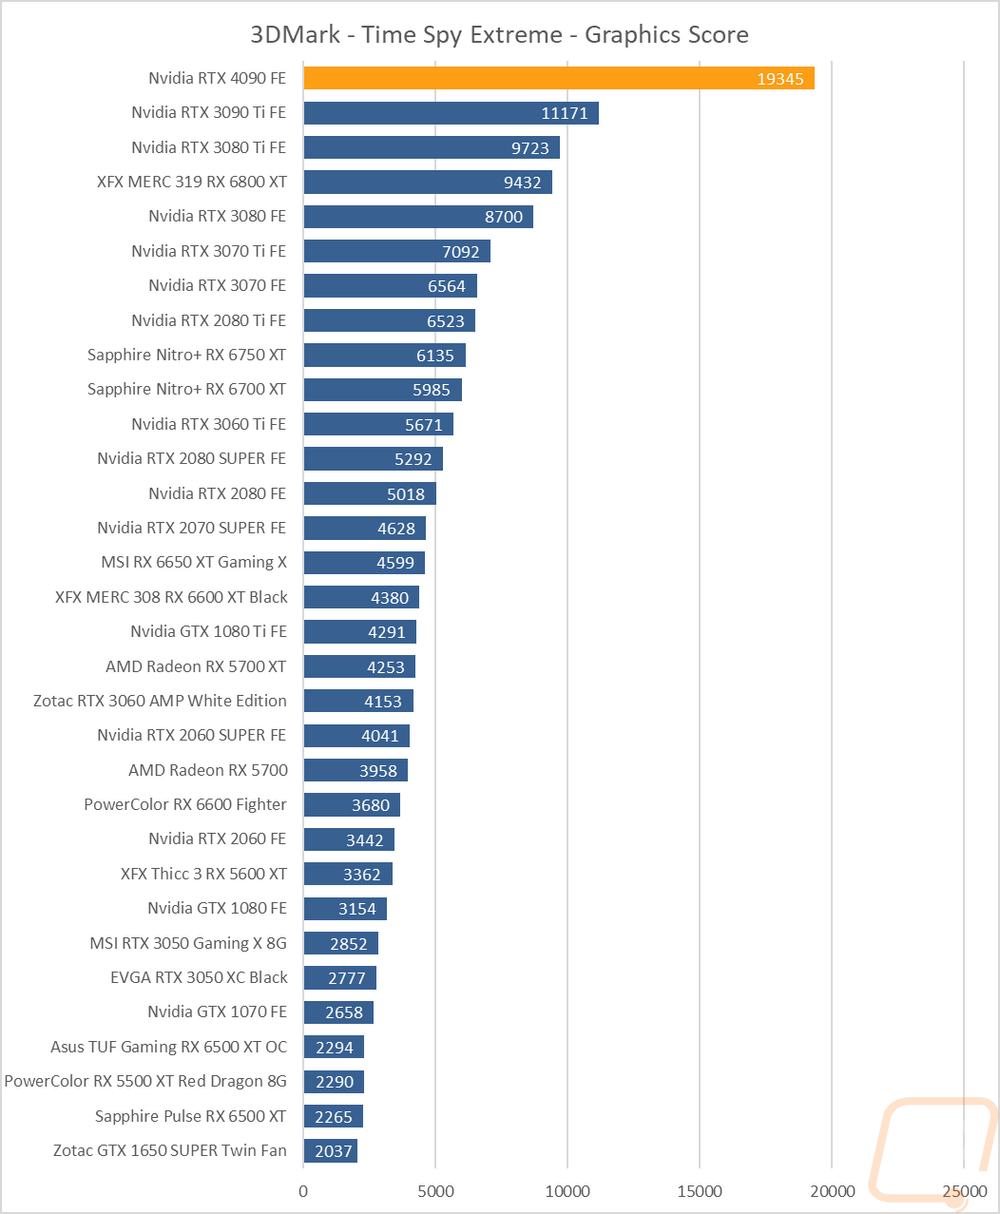
The next two were both based on the Time Spy benchmark. One is the standard test and then there is the extreme detail level. The RTX 4090 Founders Edition has an even bigger margin above everything tested here with its 88% jump over the RTX 3080 Ti and 67% over the RTX 3090 Ti. To fill in the gaps with the 6900XT/6950XT those would be in the 19900/21900 range for the base Time Spy test which is nowhere near the 35707 for the RTX 4090 Founders Edition. In the Time Spy Extreme test the 3090 Ti was way out ahead of the 3080 Ti with its 11171 but is dwarfed by the RTX 4090 at 19345 which is a 73% improvement.

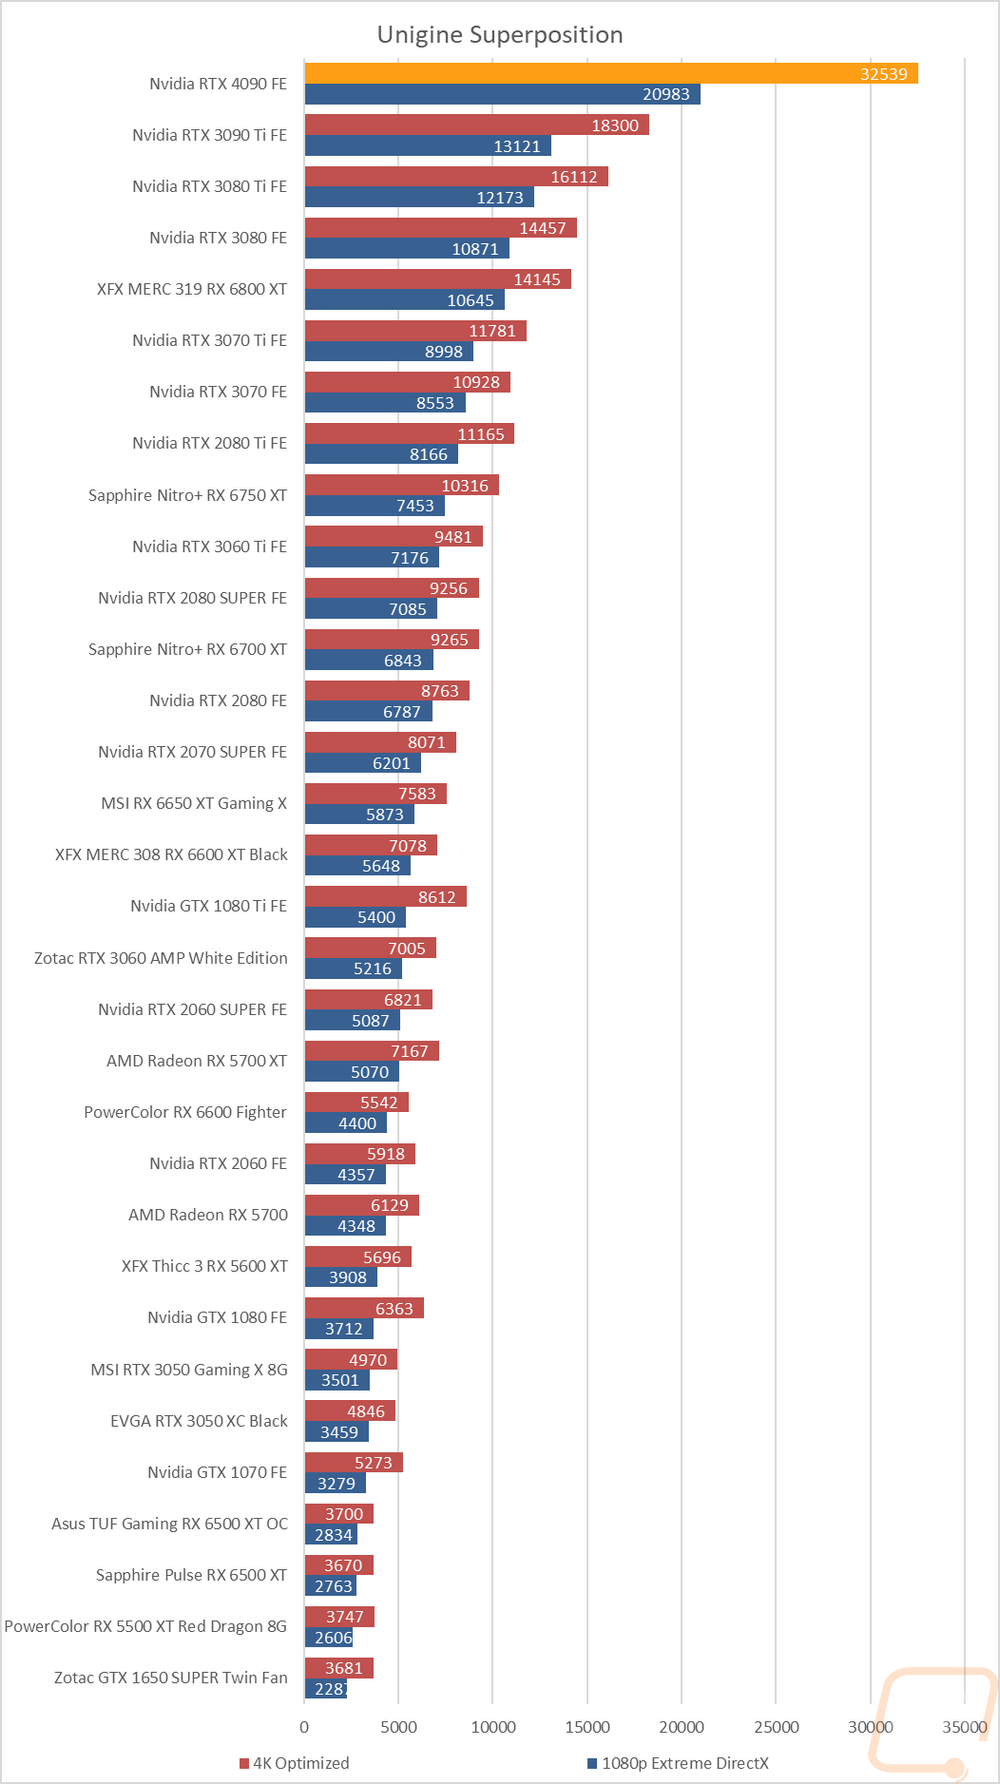
The last test was using the Unigine-based Superposition benchmark and I tested at 1080p with the extreme detail setting as well as the 4K optimized setting. In the extreme detail setting the RTX 4090, Founders Edition is over double the score of the RTX 3080 Ti and in the 4k optimized result, the gap is smaller at “just” 72%. Even the RTX 3090 Ti with its 18300 and 13121 scores couldn’t come close.