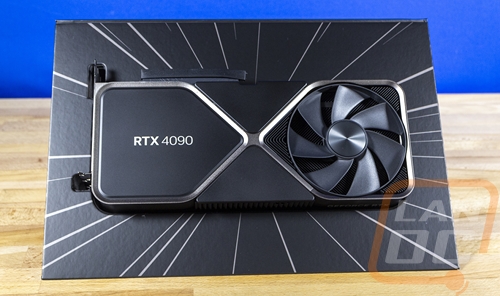
Two weeks ago during their GDC Keynote Nvidia announced the first few video cards from their upcoming 4000 series of GPUs based on the Ada Lovelace architecture. They announced the RTX 4090 and two RTX 4080 cards, one with 16GB of VRAM and the other with 12GB which in addition to the memory those cards have a different base GPU as well. But today the performance embargo for the RTX 4090 is lifted so we are going to focus on that and the RTX 4090 will be available for sale tomorrow should you be interested in picking one up. Today I’m going to dive into the 4000 series of cards to tell you a little about them if you haven’t read about them yet then we will check out the RTX 4090 Founders Edition closer and then dive into testing, it’s a lot to go over so let’s dive in!
Product Name: Nvidia RTX 4090 Founders Edition
Review Sample Provided by: Nvidia
Written by: Wes Compton
Amazon Affiliate Link: HERE
What is the 4000 Series all about
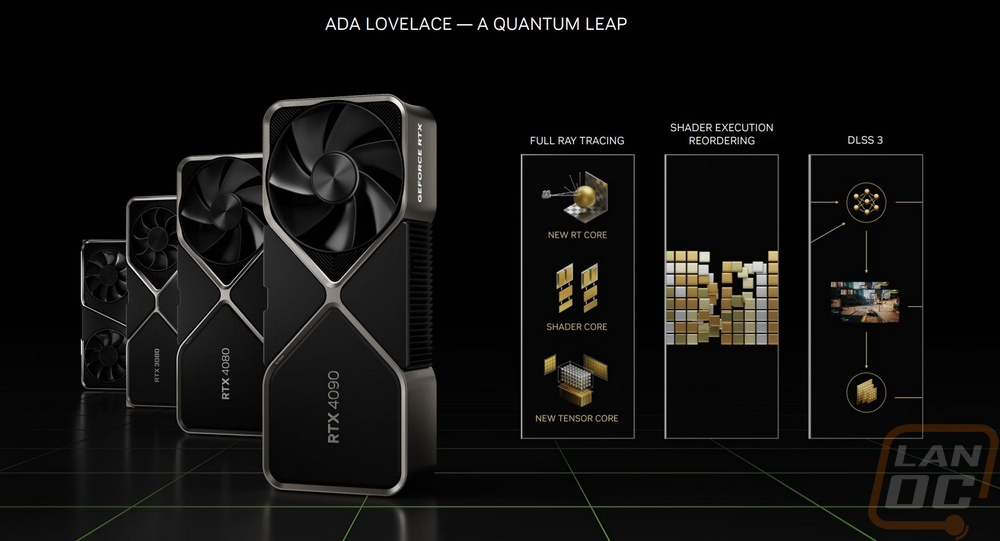
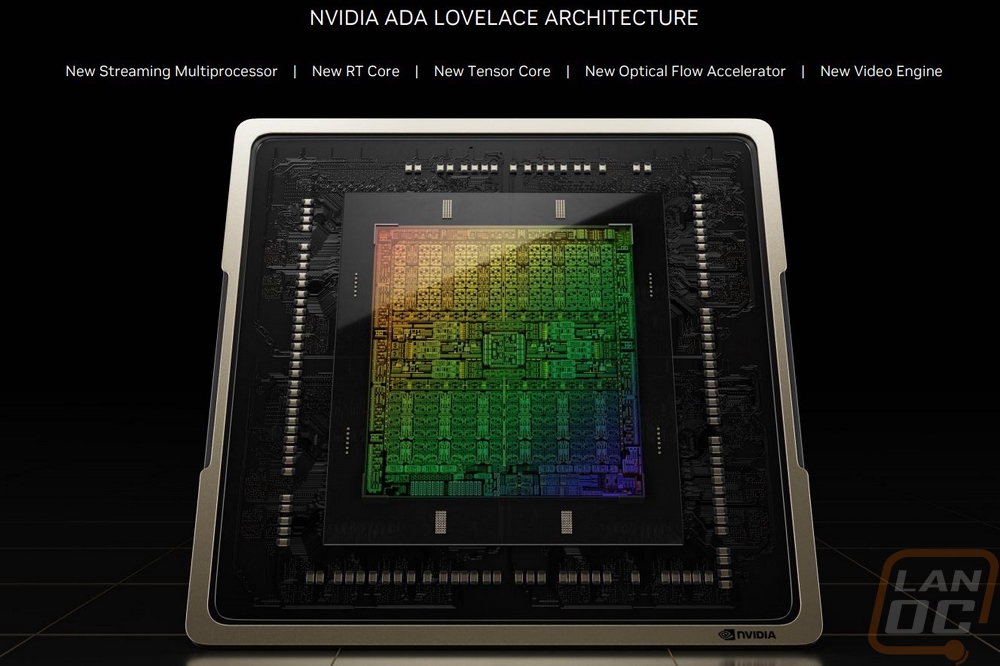
Nvidia’s 3000 Series of cards launched back in September of 2020 and with that brought their Ampere microarchitecture, the Samsung 8N manufacturing process, and a completely new card design as well. Here we are two years later but it feels like it's been four years and a lot has changed and a lot is changing with the new 4000 Series of cards. Ampere is in the mirror and the new cards are now based on the Ada Lovelace microarchitecture which is named after the English mathematician Ada Lovelace who is often regarded as the first computer programmer. The new Ada Lovelace based GPUs would also be produced by TSMC’s 4N process which is a 5 nm process and itself brings the possibility of efficiency improvements alongside the new microarchitecture. So what all has changed with Ada Lovelace?
The new microarchitecture has a new fourth-generation tensor core design and a new third-generation ray tracing core design to continue to expand on the ray tracing performance established over the previous two generations of cards and the AI processing originally introduced with Volta. The new tensor cores are capable of up to 1400 Tensor TFLOPs, four times that of the 3090 Ti which alongside the introduction of DLSS 3 are set to bring huge leaps in DLSS performance. Lovelace now has what they call Shader Execution Reordering or SER that can reschedule the workload to ensure that similar shaders are being processed together which helps a lot with processing ray tracing by allowing the multiprocessors to work more efficiently.
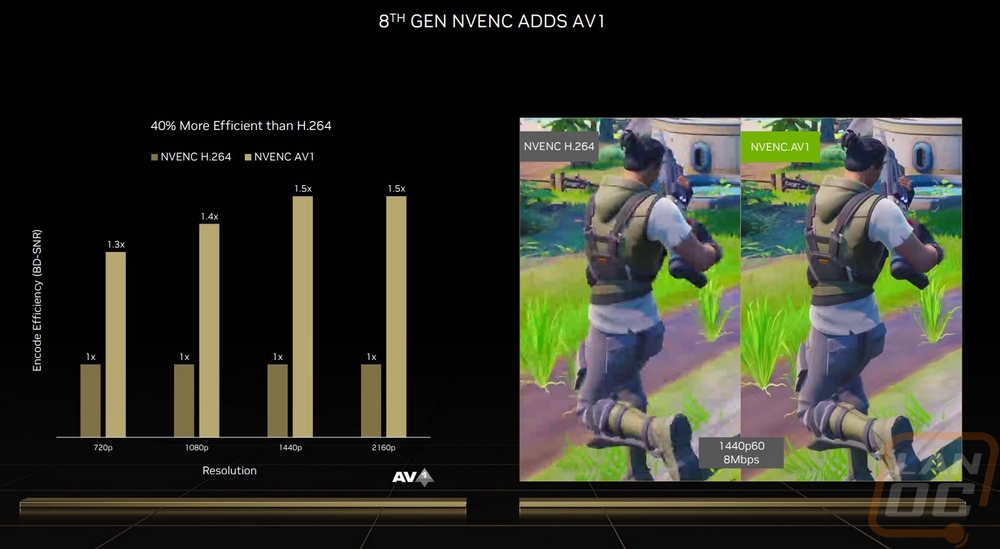
Nvidia has also doubled up on the AV1 processing which was added last generation with the new cards having two AV1 processors. This is important because AV1 which is a royalty-free video encoding format which is also 30% more efficient than H.265 meaning with it you can stream higher bitrate video with less bandwidth. AV1 is set to be added to streaming tools like OBS and Discord as well as video production tools as well and having two encoders in NVENC will be huge.
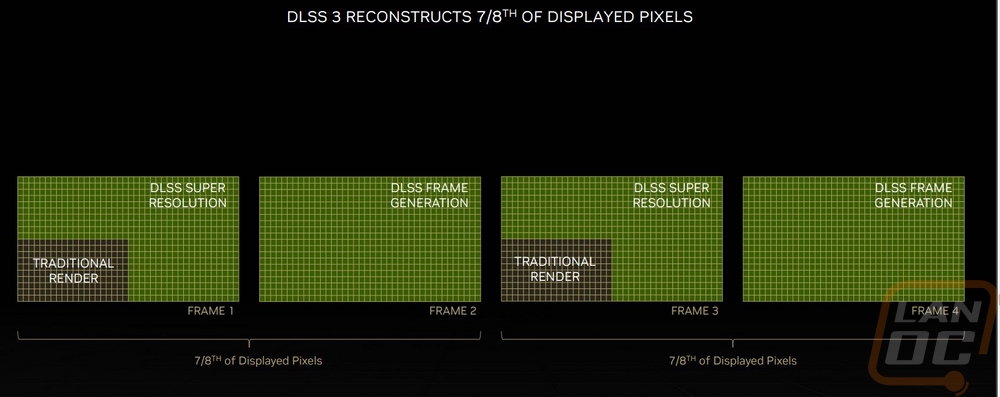
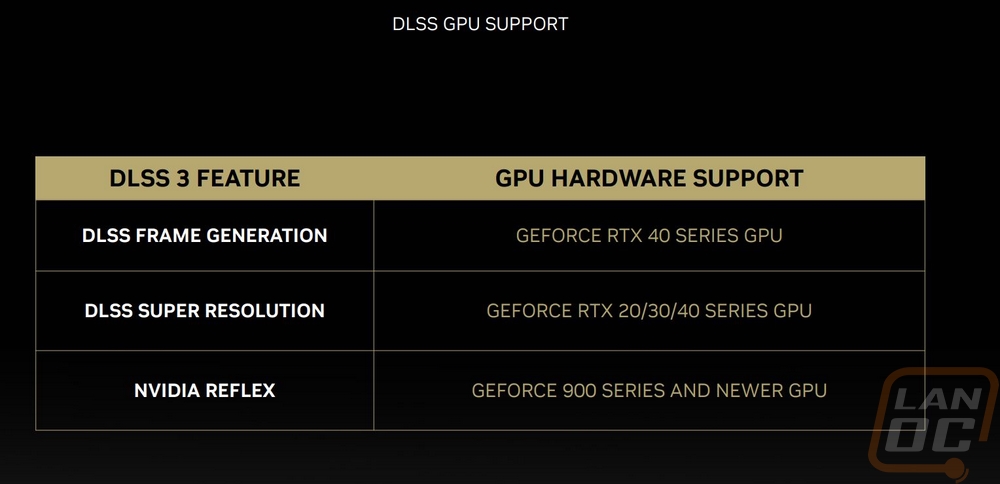
DLSS 3 in itself is a big change and sadly it is exclusive to the new 4000 series cards because it relies on Lovelace’s new Optical Flow Accelerator as well as the new much more powerful Tensor Cores. On the plus side though if you have a previous generation Nvidia card DLSS 3 is an extension of DLSS 2 so games that add DLSS 3 will also have DLSS 2. DLSS 3 combines the DLSS Super Resolution from DLSS 2 and adds in DLSS Frame Generation. So previously with DLSS Super Resolution, each frame generated would use the AI tensor cores to scale the resolution up to get the detail you want while keeping the processing time down. DLSS Frame Generation on the other hand takes every other frame and generates a complete frame. With the two combined DLSS 3 is reconstructing 7/8th of the pixels displayed. The DLSS Frame Generation has a really interesting side effect as well that DLSS Super Resolution didn’t have. When you are rendering an entire extra frame like that, it also brings performance improvements to games that are CPU limited which means that games that are CPU limited could implement DLSS 3 and see up to twice the frame rate improvement.
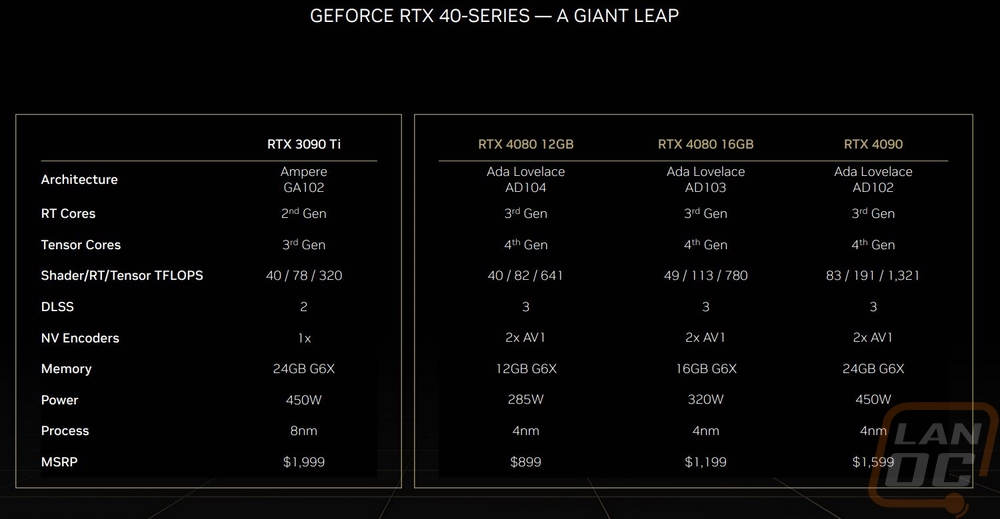
As far as 4000 Series cards, Nvidia did announce three different cards with their announcement of Ada Lovelace and the new generation of cards. The flagship of those cards is the RTX 4090 and then they have two different RTX 4080 models which have caused some confusion and uproar in the hardware community. All three are based on Ada Lovelace but they are on three different GPU variations. The RTX 4090 is on the AD102, the RTX 4080 16GB is on the AD103, and the RTX 4080 12GB is on the AD104. I will dive more into the new 4080 models as those launch later but obviously with them sharing the same name but having different memory levels has happened in the past with Nvidia cards but never before have those different memory capacities had a completely different GPU or memory controller which they have done here. The “104” designation on the GPU is normally seen on the xx70 cards which have had some people accusing Nvidia of rebranding their xx70 up to an xx80 so they could raise pricing but on the previous calls with Nvidia, they have responded that they felt that the cards performance was that of an xx80 card and that it should get the naming. I agree that the naming is going to be confusing, I don’t think we will know on the rest until the 4080s are tested and more importantly until we see the xx70 card from the 4000 series which may be a while.
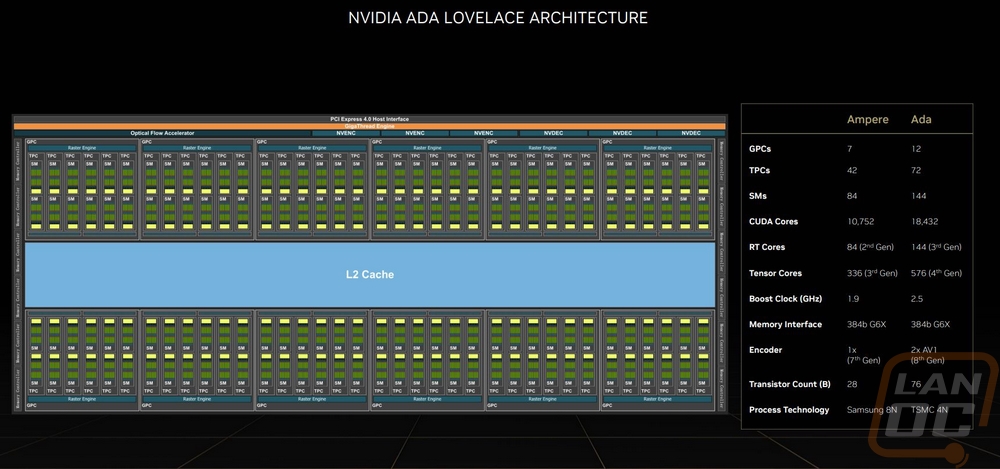
With our focus on the new RTX 4090 today I put together a table to compare its specs alongside the RTX 3090 Ti which was the former flagship, the RTX 3090, and the RTX 3080 Ti which are all Ampere-based cards at the top of Nvidia’s lineup over the last few years. It is interesting right in the top few specifications to see that the RTX 4090 has 11 graphics processing clusters whereas all three of the other cards had 7. This means the RTX 4090 is using 11 out of the 12 GPCs that Ada Lovelace has on its full size. TPCs or texture processing clusters and SMs (streaming multiprocessors) also scaled up which the TPC consists of SMs inside so that isn’t a surprise. This leads us to the big number though, all together the RTX 4090 has 16384 CUDA cores which is 52% more than the RTX 3090 Ti, which is on top of the architectural improvements as well. So with these numbers in mind, we know that each SM has a total of 128 CUDA cores. The 512 new 4th generation Tensor cores tell us each SM has 4 total and then the 128 total RT or ray tracing cores tells us each SM also has one ray tracing core as well.
On top of the brute force rise in processing power with more CUDA, Tensor, and RT cores as well as architectural improvements with the new tensor and rt cores Nvidia has also really stepped things up in clock speeds. They were able to do this because of the efficiencies that the TSMC 4N process brings with making things smaller. But the RTX 4090 has a GPU boost clock speed of 2520 MHz which is almost a full GHz over the clock speed on the RTX 3080 Ti and even compared to the RTX 3090 Ti which was clocked at 1860 MHz is a massive jump. Memory clocks have seen the same clock speed improvement as well. The RTX 4090 has the same 24 GB capacity that the RTX 3090 and RTX 3090 Ti had before and 384-bit memory interface that all four cards have. The L2 cache has been scaled up from 6144 KB up to a full MB which is an improvement of just under 71%. Altogether the changes have the Ada Lovelace die size at 76.3 billion compared to 28.3 Billion for the Ampere cards. Interestingly the TDP and minimum power supply requirements haven’t changed at all but the power connection lists having a new 4 8-pin to 16-pin dongle compared to the 3 8-pin to 16-pin dongle used on the RTX 3090 and RTX 3090 Ti.
|
Specifications |
RTX 3080 Ti |
RTX 3090 |
RTX 3090 Ti |
RTX 4090 |
|
Graphics Processing Clusters |
7 |
7 |
7 |
11 |
|
Texture Processing Clusters |
40 |
41 |
42 |
64 |
|
Streaming Multiprocessors |
80 |
82 |
84 |
128 |
|
CUDA Cores |
10240 |
10496 |
10752 |
16384 |
|
Tensor Cores |
320 (3rd Gen) |
328 (3rd Gen) |
336 (3rd Gen) |
512 (4th Gen) |
|
RT Cores |
80 (2nd Gen) |
82 (2nd Gen) |
84 (2nd Gen) |
128 (3rd Gen) |
|
Texture Units |
320 |
328 |
336 |
512 |
|
ROPs |
112 |
112 |
112 |
176 |
|
Boost Clock |
1665 MHz |
1695 MHz |
1860 MHz |
2520 MHz |
|
Memory Clock |
1188 MHz |
1219 MHz |
1860 MHz |
2520 MHz |
|
Memory Data Rate |
19 Gbps |
19 Gbps |
21 Gbps |
21 Gbps |
|
L2 Cache Size |
6144 KB |
6144 KB |
6144 KB |
10501 KB |
|
Total Video Memory |
12 GB GDDR6X |
24 GB GDDR6X |
24 GB GDDR6X |
24 GB GDDR6X |
|
Memory Interface |
384-bit |
384-bit |
384-bit |
384-bit |
|
Total Memory Bandwidth |
912 GB/s |
936.2 GB/s |
1008 GB/s |
1008 GB/s |
|
Texture Rate (Bilinear) |
532.8 GigaTexels/second |
556 GigaTexels/second |
625 GigaTexels/second |
1290.2 GigaTexels/second |
|
Fabrication Process |
Samsung 8 nm 8N NVIDIA Custom Process |
Samsung 8 nm 8N NVIDIA Custom Process |
Samsung 8 nm 8N NVIDIA Custom Process |
TSMC 4 nm NVIDIA Custom Process |
|
Transistor Count |
28.3 Billion |
28.3 Billion |
28.3 Billion |
76.3 Billion |
|
Connectors |
3 x DisplayPort 1 x HDMI |
3 x DisplayPort 1 x HDMI |
3 x DisplayPort 1 x HDMI |
3 x DisplayPort 1 x HDMI |
|
Form Factor |
Two Slots |
Triple Slot |
Triple Slot |
Triple Slot |
|
Power Connectors |
1x16-pin (Dongle to 2x 8-Pins) |
1x16-pin (Dongle to 3x 8-Pins) |
1x16-pin (Dongle to 3x 8-Pins) |
1x16-pin (Dongle to 4x 8-Pins) |
|
Minimum Power Supply |
750 Watts |
850 Watts |
850 Watts |
850 Watts |
|
Total Graphics Power (TGP) |
350 Watts |
450 Watts |
450 Watts |
450 Watts |
|
Maximum GPU Temperature |
93° C |
92° C |
93° C |
90° C |
|
PCI Express Interface |
Gen 4 |
Gen 4 |
Gen 4 |
Gen 4 |
|
Launch MSRP |
$1199 |
$1499 |
$1999 |
$1599 |
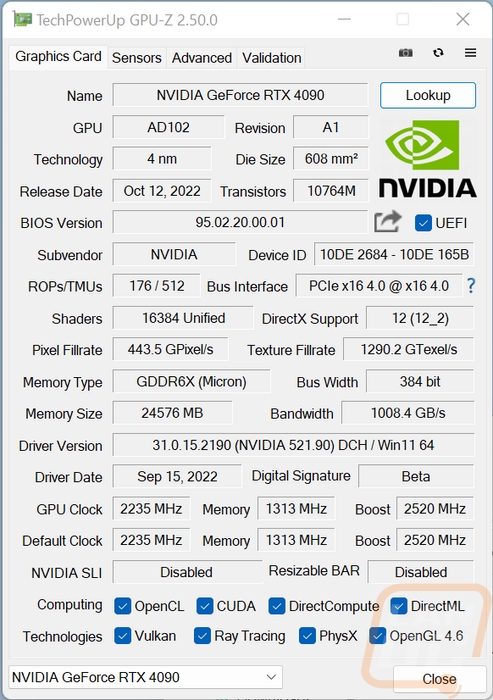
Before getting into testing I did also run GPUz to double-check that our clock speeds match up with the specifications which it did. I also have this to document the card BIOS revision as of testing as well as the driver which is the 521.90 Beta driver for before the launch.
Packaging
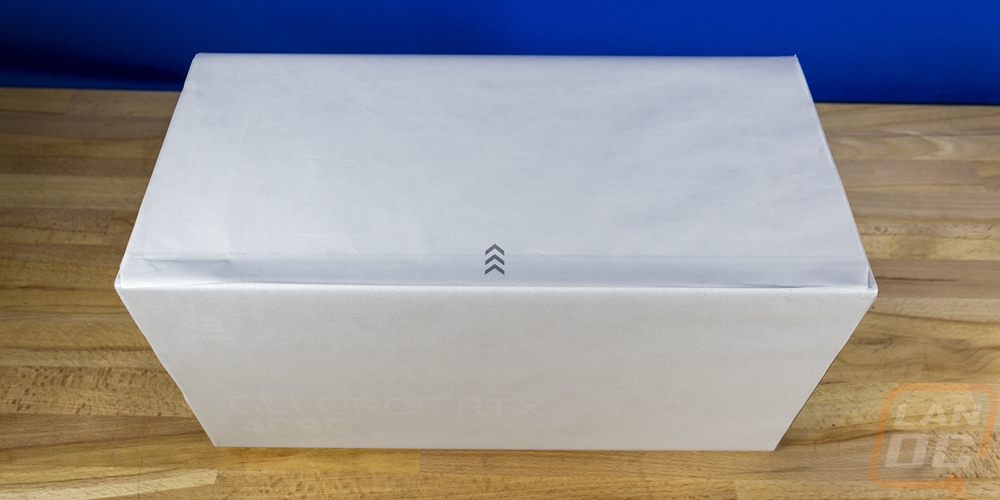
Typically when I check out the packaging for a video card or any product really it is focused on just the box itself but with the RTX 4090, Founders Edition even the box that Nvidia sent everything in was unique enough for me to mention it. The cardboard shipping box was sized specifically to fit the RTX 4090 Founders Edition box and it had a pull tab that pulled a stripe all around from three sides. Once that was pulled the box flips open and has this main package with pull-out sides. Each side is an inch thick with a cardboard and foam padding sandwich and inside of all of that the RTX 4090 Founders Edition comes wrapped in tissue paper.

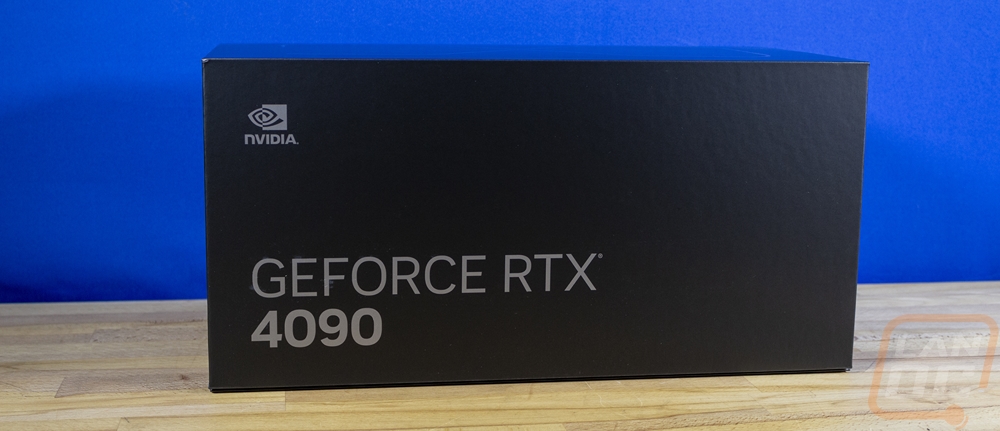
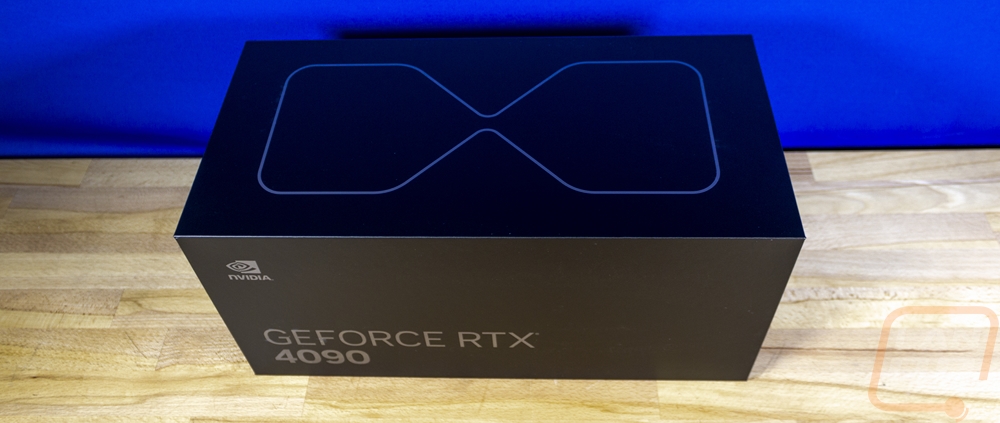
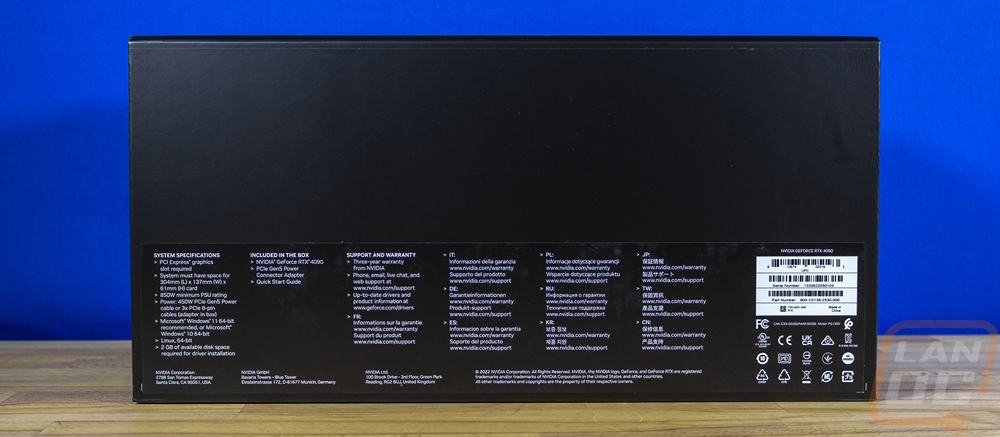
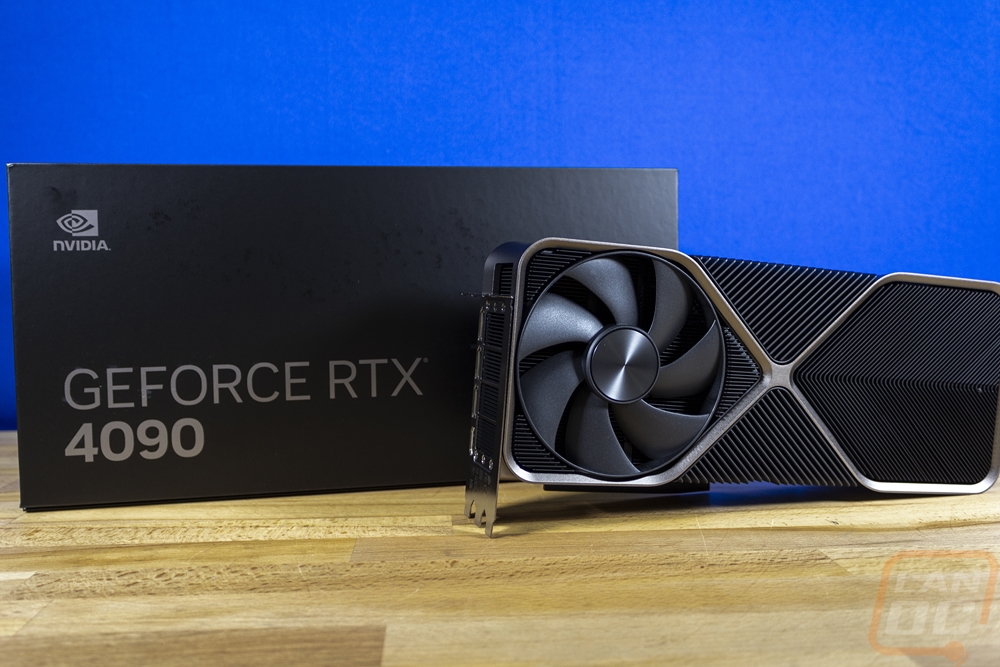
The box for the RTX 4090 Founders Edition is huge, this is 3 or 4 times the size of the standard Nvidia Founders Edition box and they don’t have the silver accent stripes that we saw on the 3000 series cards. The front of the box has a small Nvidia logo up in the top left corner and then the GeForce RTX 4090 branding in a larger silver font. All of that is over top of the black box which carries on for the top, back, and bottom. The top does have a silver drawing of the hourglass shape that they have used on the last few Founders Editions. The back of the box also has a sticker on it with a list of what is inside, information on support and warranty, and a system specification requirements listing. The sticker also has the serial number and UPC as well as a bunch of the required certification logos as well.
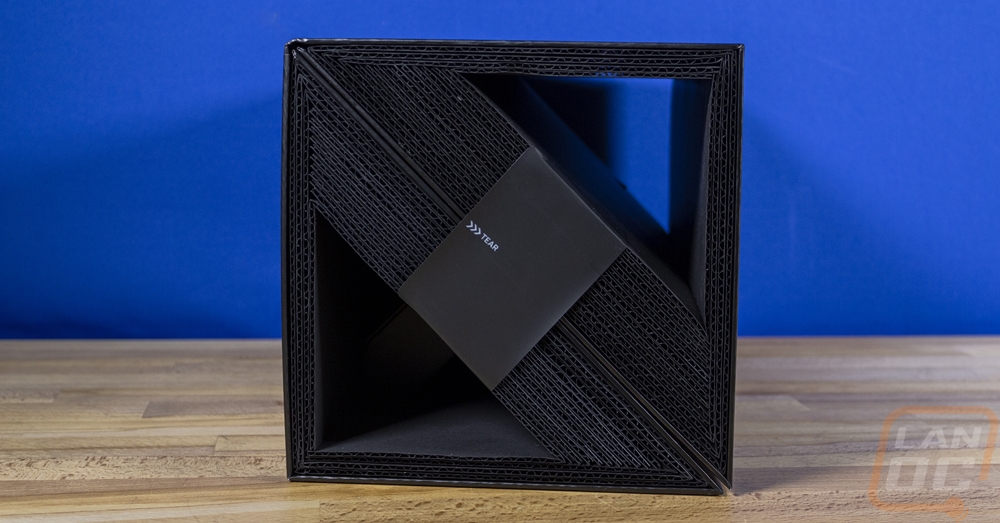
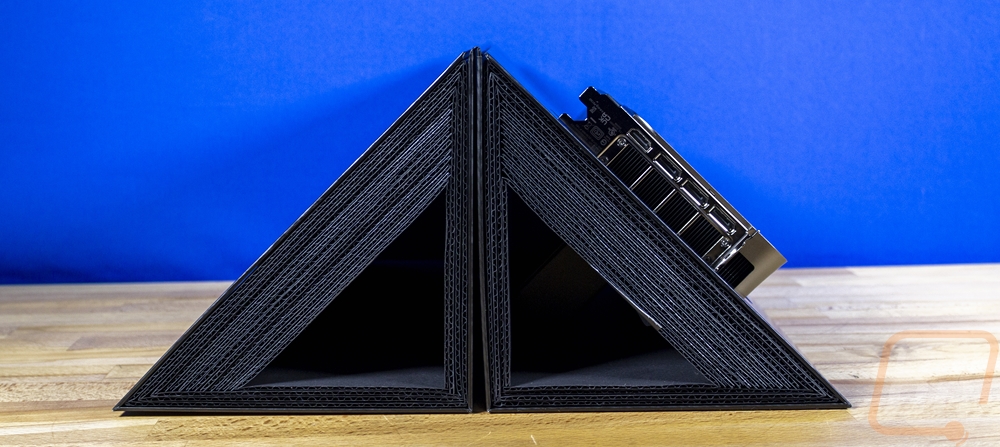
What is unique about this box becomes apparent from the side view where you can see completely through the box. Other than the hard cardboard on the outside the rest of the interior is all corrugated plastic in black and on both sides you have this strip with instructions to tear on it to open the box up.
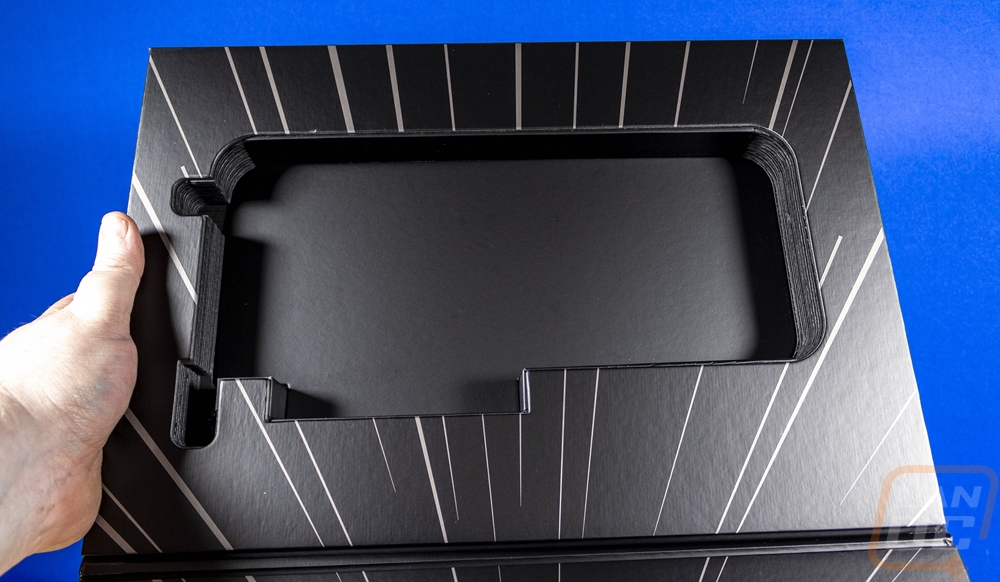
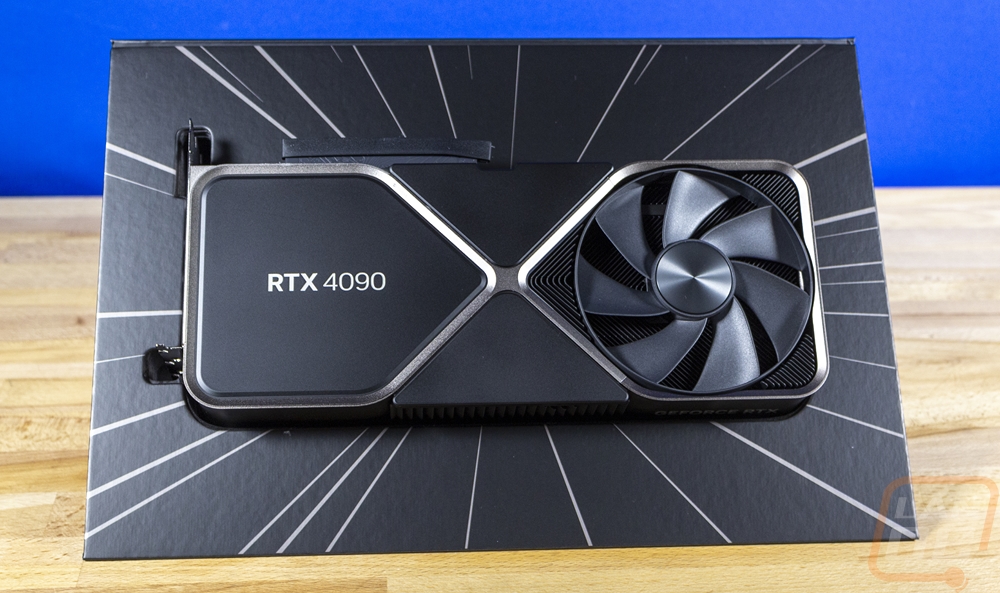
Once you tear the seal, half of the box flips up showing the RTX 4090 Founders Edition sitting in its perfectly cutout shape. The silver accents are here on the inside with hyperspeed-like stripes and you can see that the top half of the box also has the same cutout shape to hold the card. Once open the box forms a triangle shape and it displays the card. Nvidia has done a great job of giving you a little spectacle with their Founders Edition cards but this is to an all-new level and I love it.
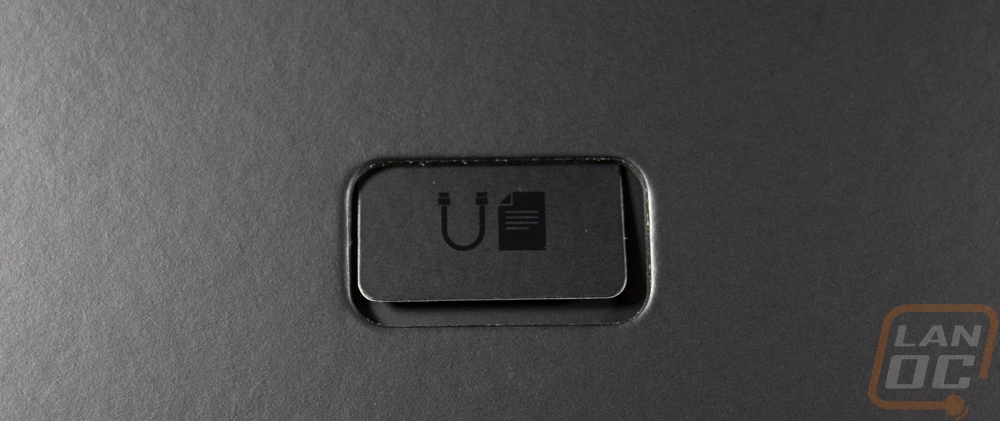
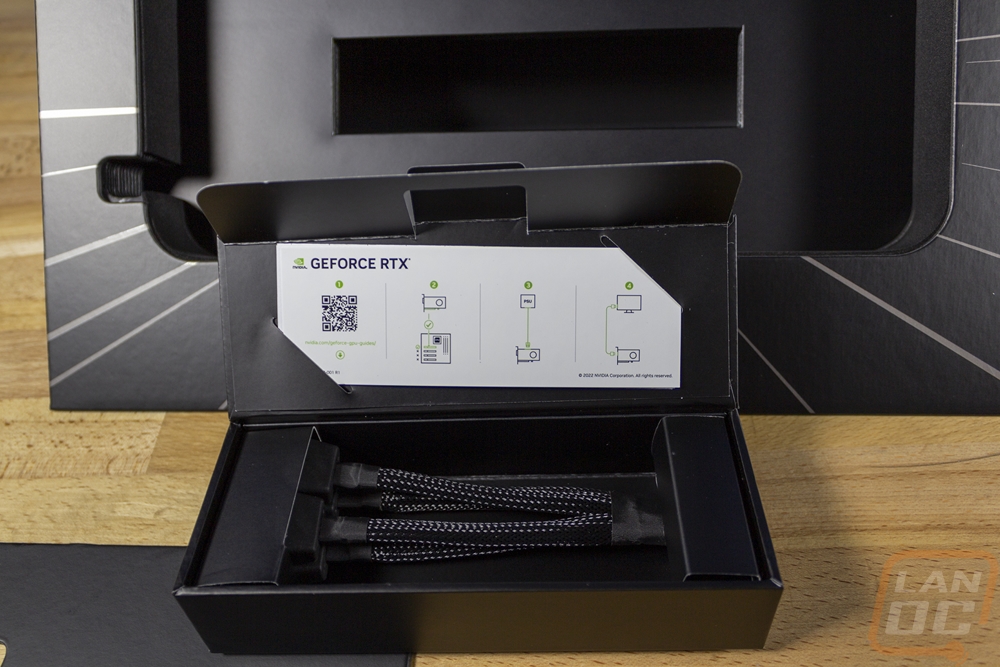
Once you pull the card out up under that there is a thick cardboard panel that has a hole in the center. The hole lets you see this small pull tab which has a picture of an adapter and documentation on it. Pulling on that pulls the hard panel and a box out which was hiding behind the RTX 4090 Founders Edition. Inside the box, you have a card with instructions on installing the GPU as well as a QR code for more detailed instructions. There is also a power adapter for the RTX 4090 Founders Edition for anyone who doesn’t have a new PCIe 5.0 compatible power supply. The power adapter is similar to the 3000 series adapters only this one has twice as many plugs attached to it. You have four 8-pin plugs on one end and the new 12-pin connection on the other end. The adapter is sleeved and all blacked out as well.
Card Layout and Photos
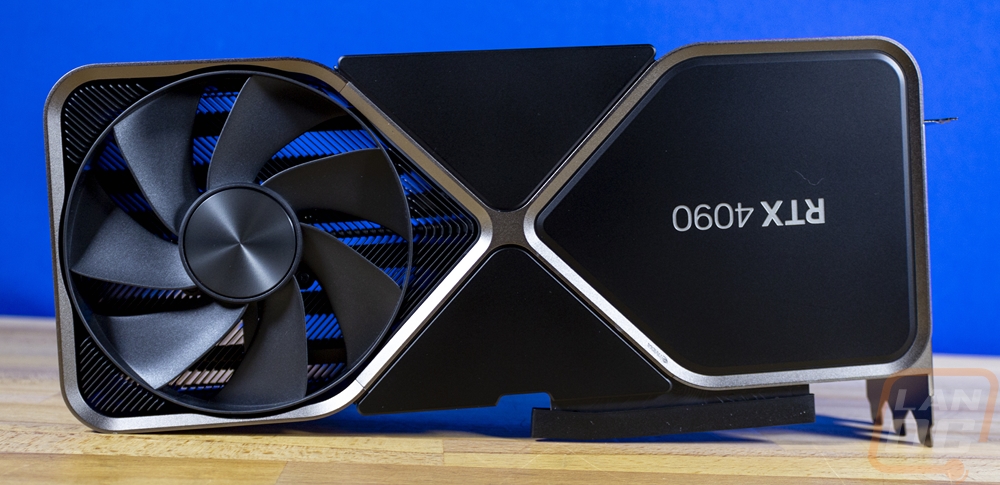
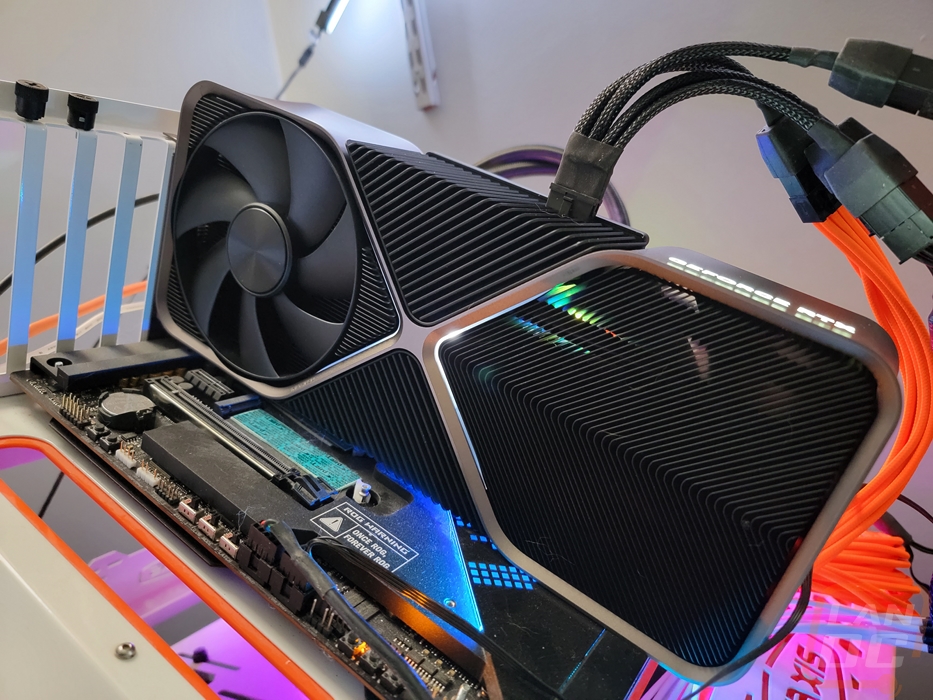
If you saw any of the 3000 series Founders Edition cards the styling used on the new RTX 4090 Founders Edition is going to be familiar. Its design has an external heatsink design combined with an hourglass-like outline that splits everything up. The hourglass or infinity shape is all cast metal and has a silver finish that looks great against the blacked-out heatsinks over the rest of the card. Like with the 3000 series cards the RTX 4090 Founders Edition also has a dual fan blow-through design that is possible because of a shorter PCB design that goes from the rear PCI bracket to the end of the X shape in the middle. It also has a V shape to the end of the PCB to help leave room for the second fan. The biggest thing here though is the card itself which is similarly sized to the RTX 3090 Founders Edition which was a big departure from the standard card sizes that Nvidia has restrained itself to in the past. Make no mistake, this thing is huge and with the design being almost all heatsink and the rest of the design being all metal it is a heavy card as well.
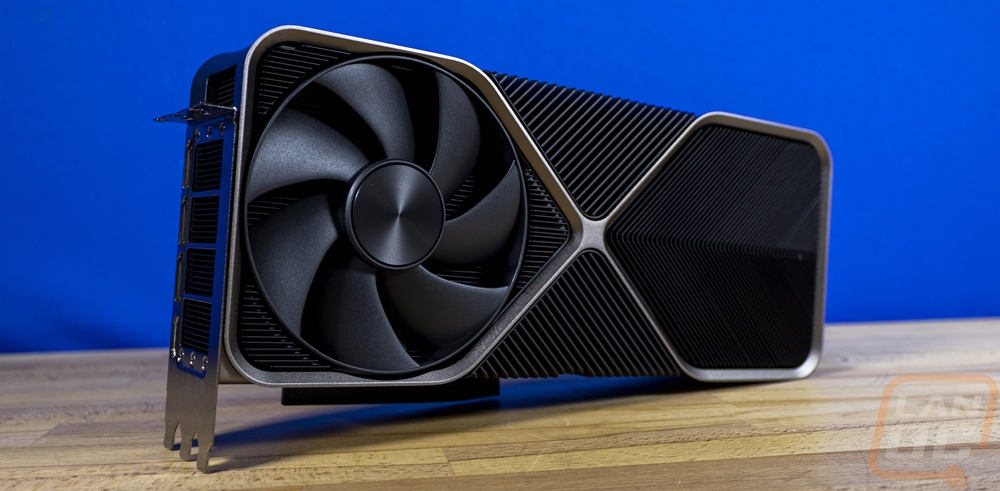
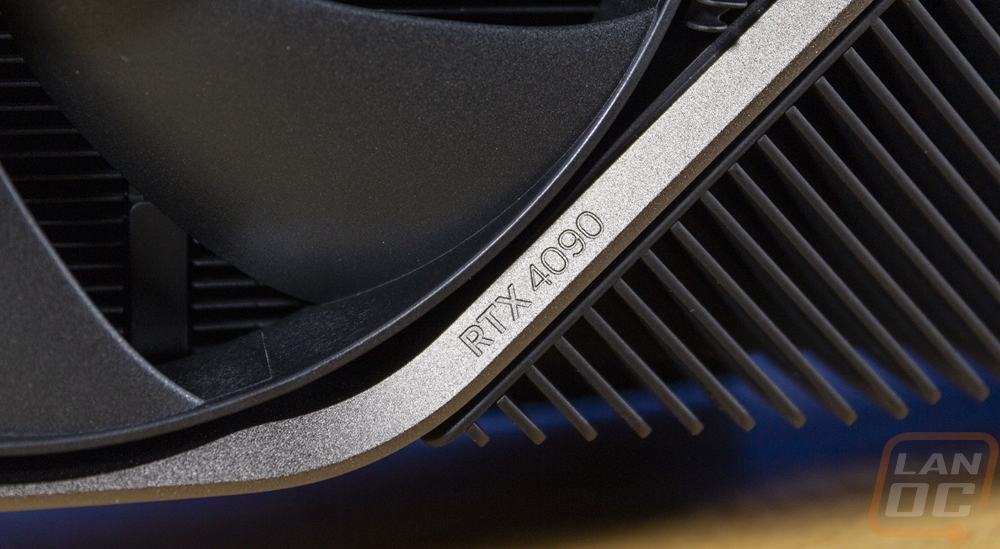
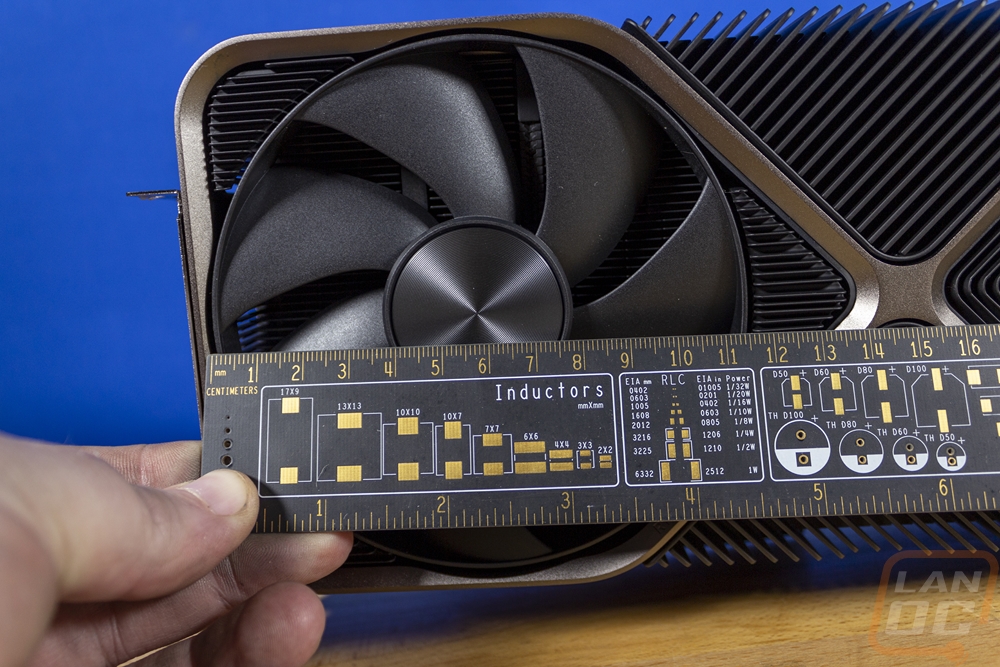
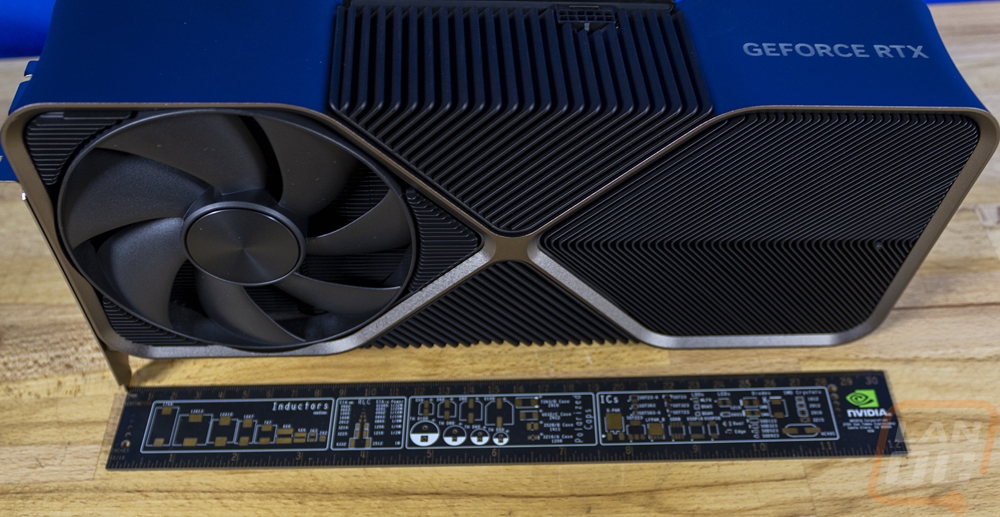
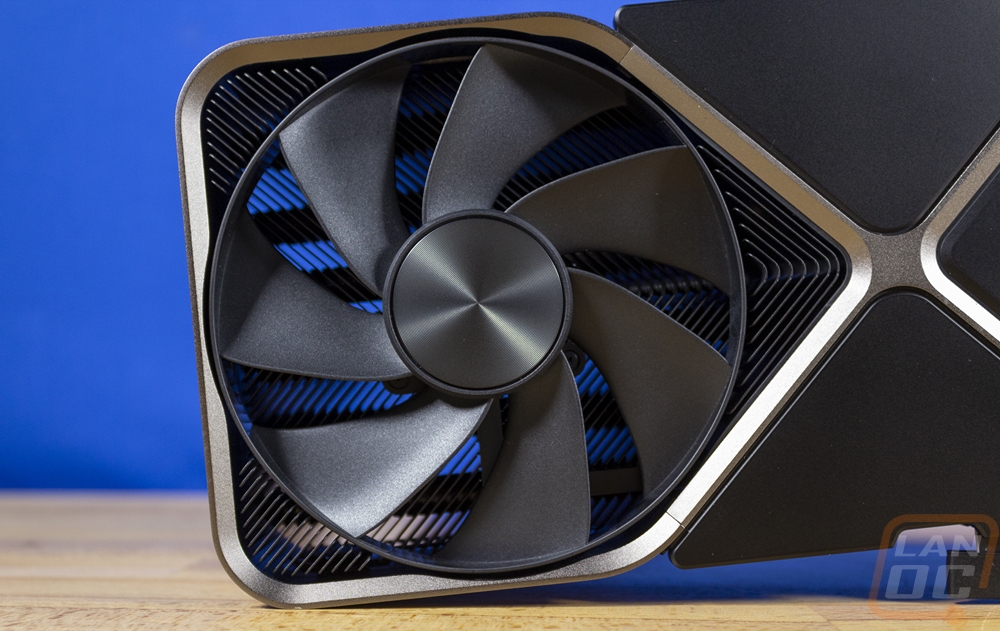
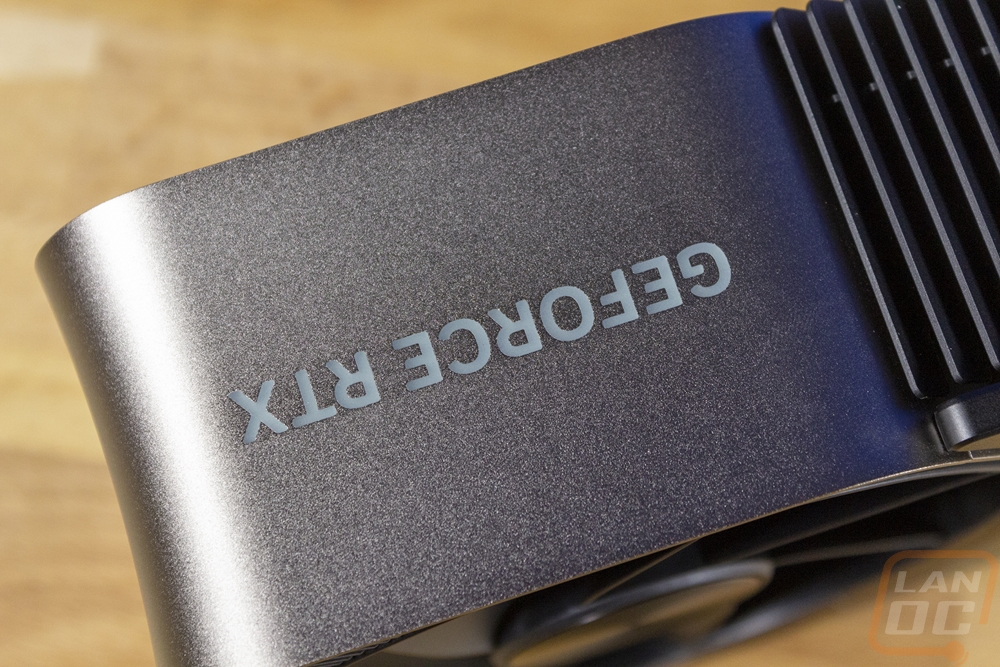
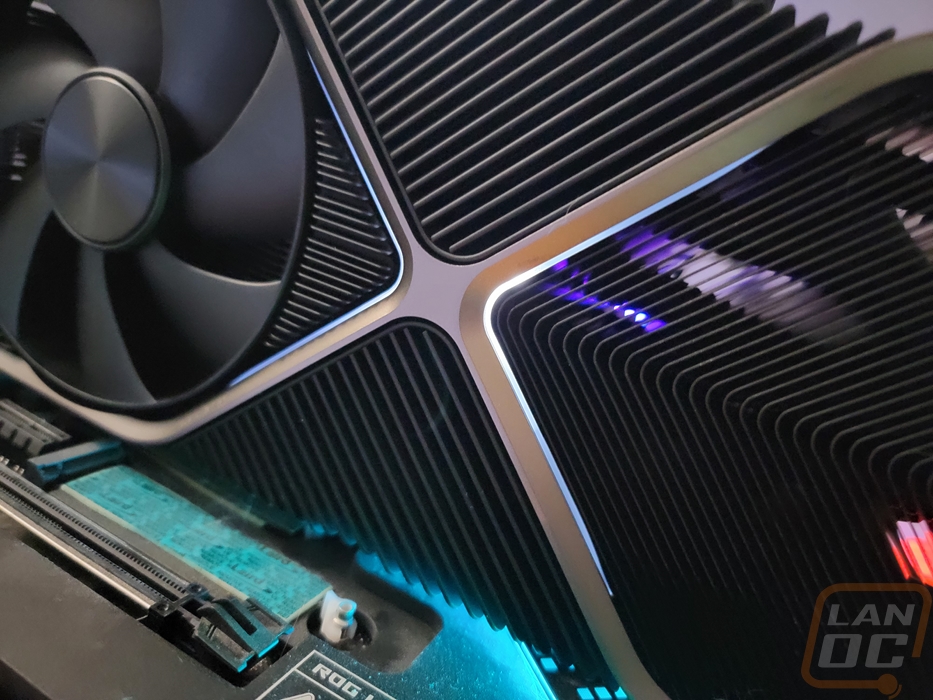
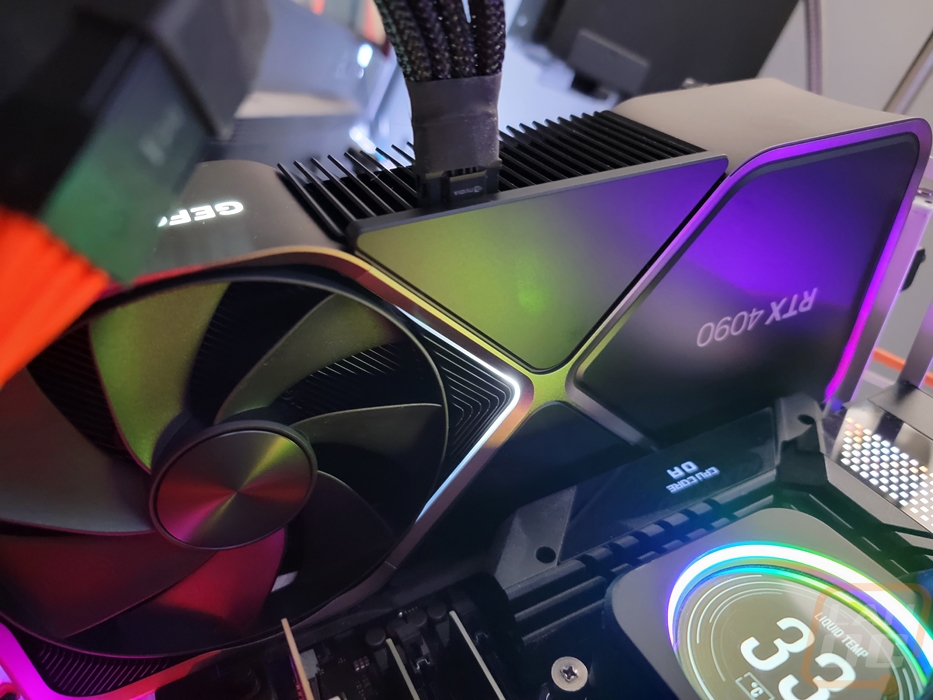
While the cooler design from the outside isn’t different from the 3090 Founders Edition, this time around Nvidia did pack in a larger fan size which is around 115mm. You can see how the larger fan has changed the design with the infinity loop on the left, top, and bottom all having notches cut into it to fit the new fan. Beyond that, each gap in the cooler has a heatsink fit into it. The fan on this side blows against the PCB but is also the most important with it being right over top of the GPU. The heatsink layout around it is designed to push most towards the rear out of the rear PCI bracket but the rest does go into the two 45-degree heatsinks which vent to the top and bottom of the card. The right side is the blow-through portion which has a V-shaped heatsink for the fan on the rear. The overall length of the card is 336mm which is longer than our ruler. The card is 140mm tall and 60mm wide making it a full 3-slot design. A small touch that I really like is if you look closely at the infinity loop on the front you can catch the RTX 4090 branding debossed into it.
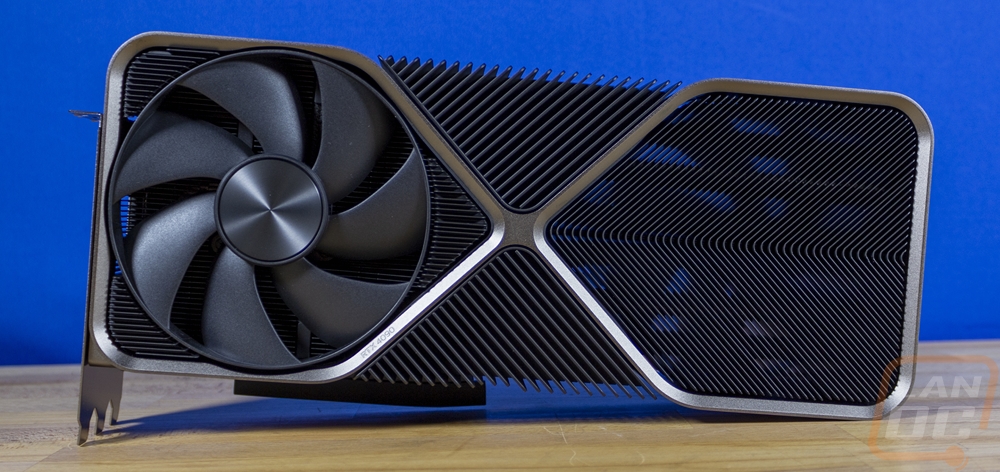
The back side of the RTX 4090 Founders Edition has similar styling to the front with the same all-metal infinity loop that goes around it. This side however has a solid backplate filling in the area where the fan was on the front and it has the RTX 4090 branding printed on it here upside down so that it is easier to read when installed in most cases. The backplate fills in the triangle-shaped areas in the middle as well then at the back we have another large fan. This is the blow-through fan that cools the cooler that sticks out past the end of the PCB which when you look through the heatsink there you can see the six heatpipes that pull heat from the GPU and memory out across the cooler. The silver infinity loop does have another hidden gem with the Nvidia logo debossed into it similarly to the 4090 name on the front.
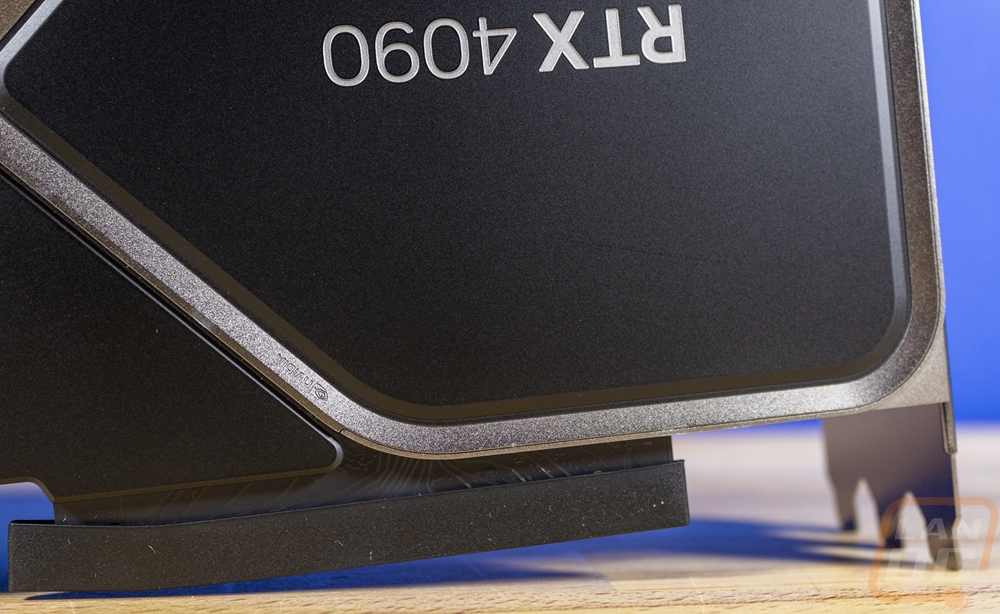
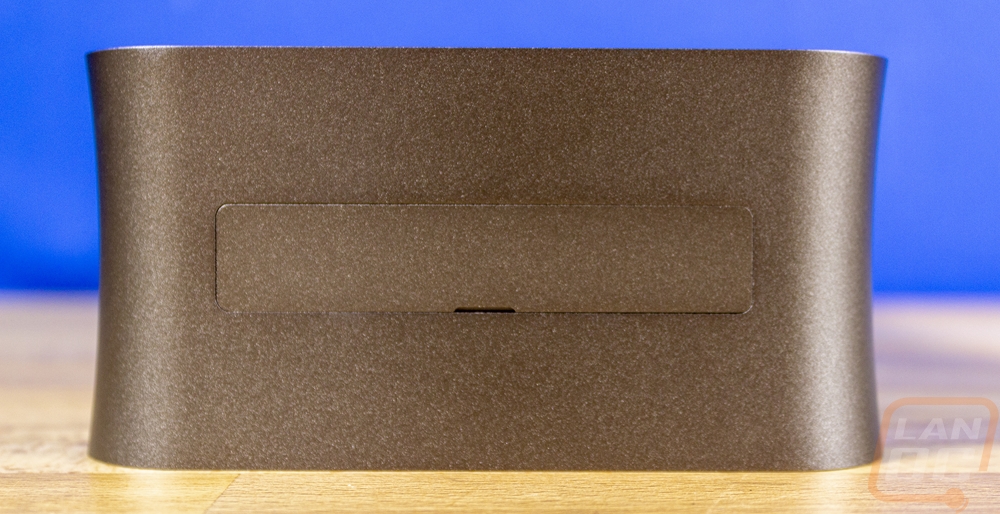
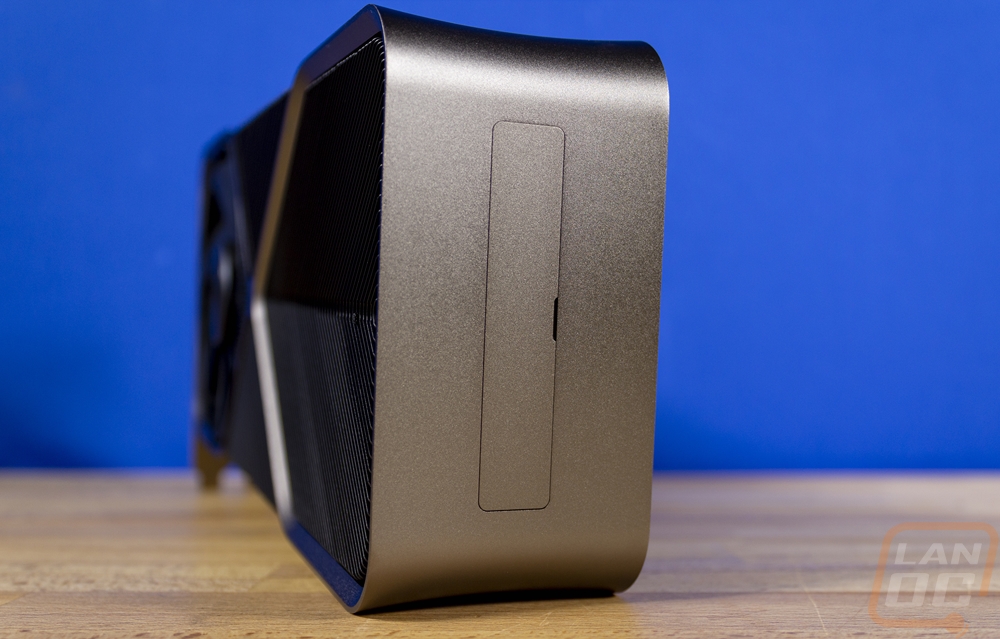
Looking around on the edges of the RTX 4090 Founders Edition the infinity loop areas extend across the edge of the card to the other side and here the silver finish has a little bit darker of a finish that looks different depending on the lighting and the angle. This view gives a better idea of the cards 3 slot size with it being a full 60mm thick. The silver goes under the heatsink in the middle on the top and bottom with the exposed angled heatsinks. Then on the end, the has a removable plate that covers up the rear support screws. This plate looks like it would be hard to remove but it is held in place by two magnets and if you have nails can be pulled out. Of course, I scratched the end of our card up before I figured that out fitting something else in there. The end also shows how the shape of the top and bottom has a little bit of an hourglass shape which is a nice touch.
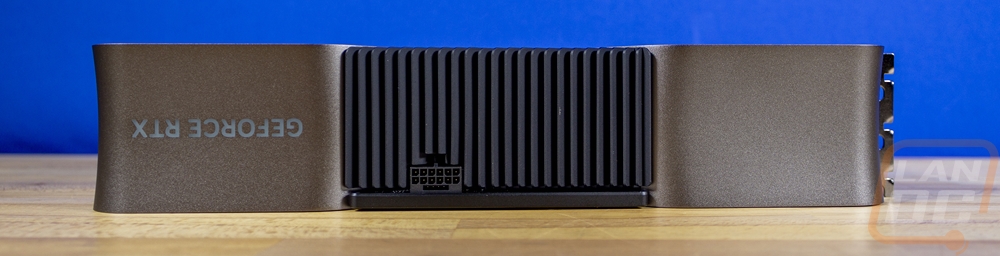
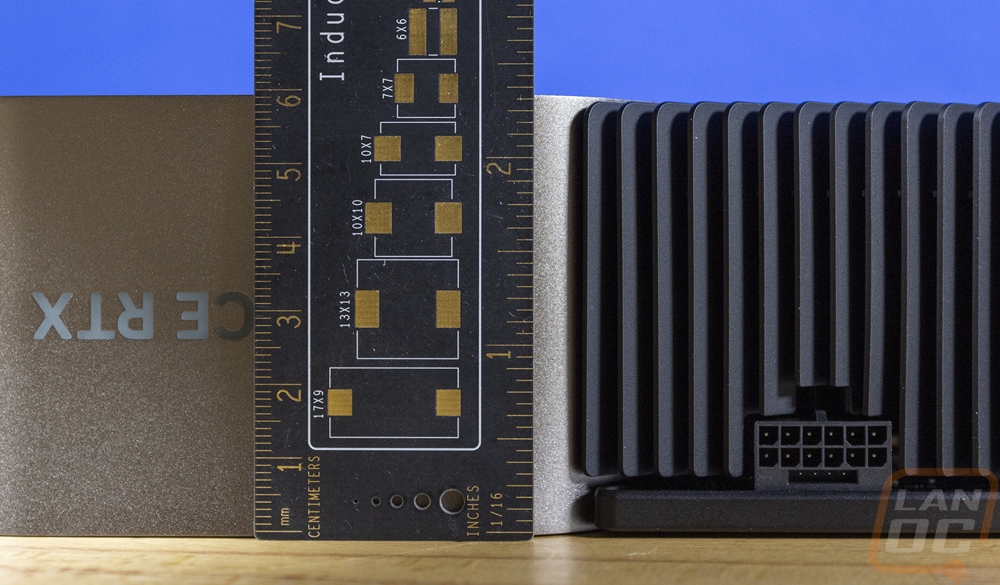
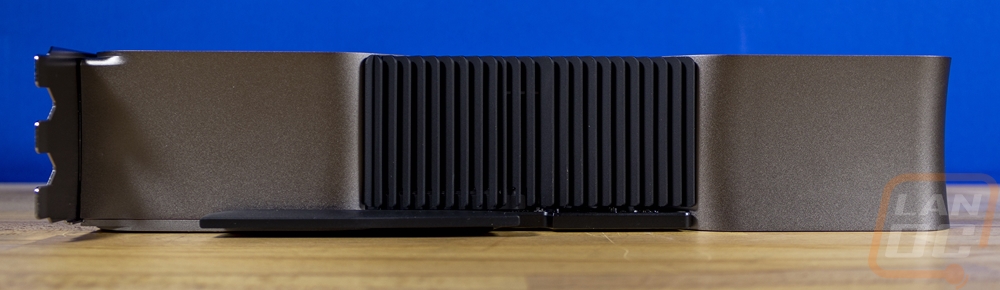
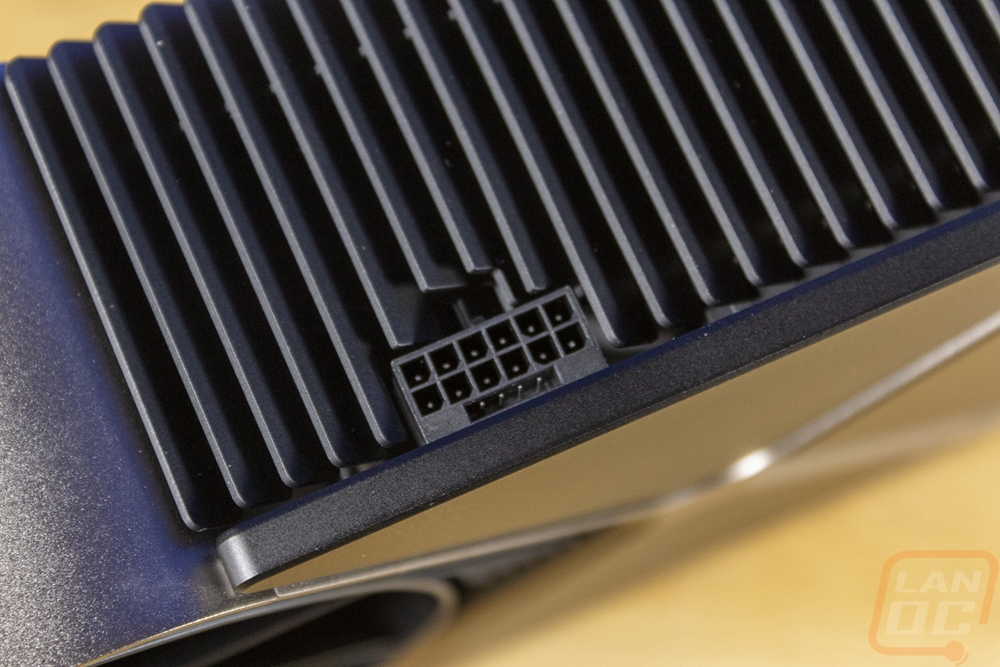
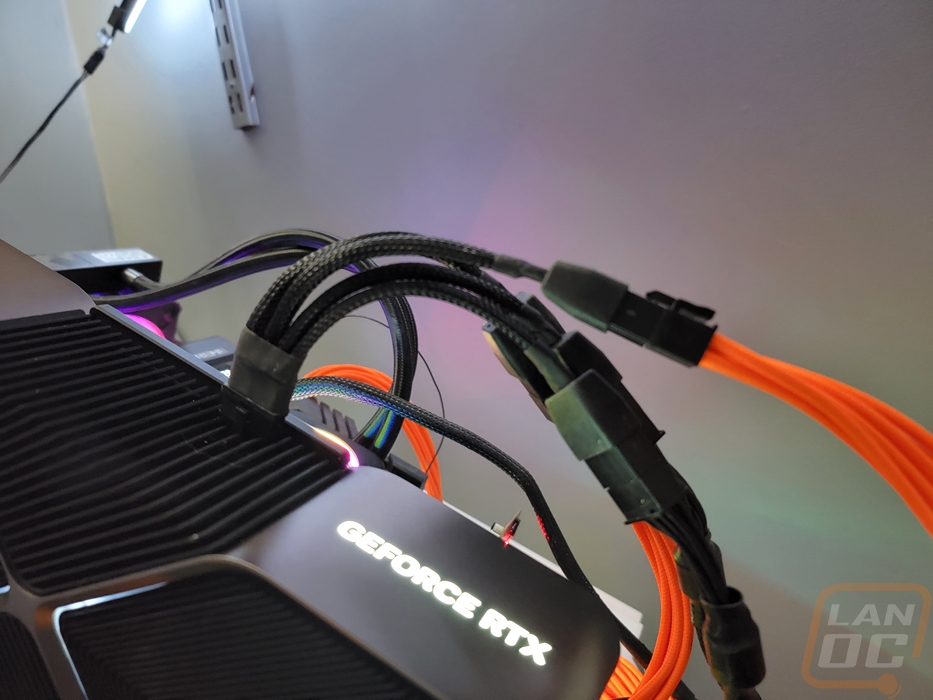
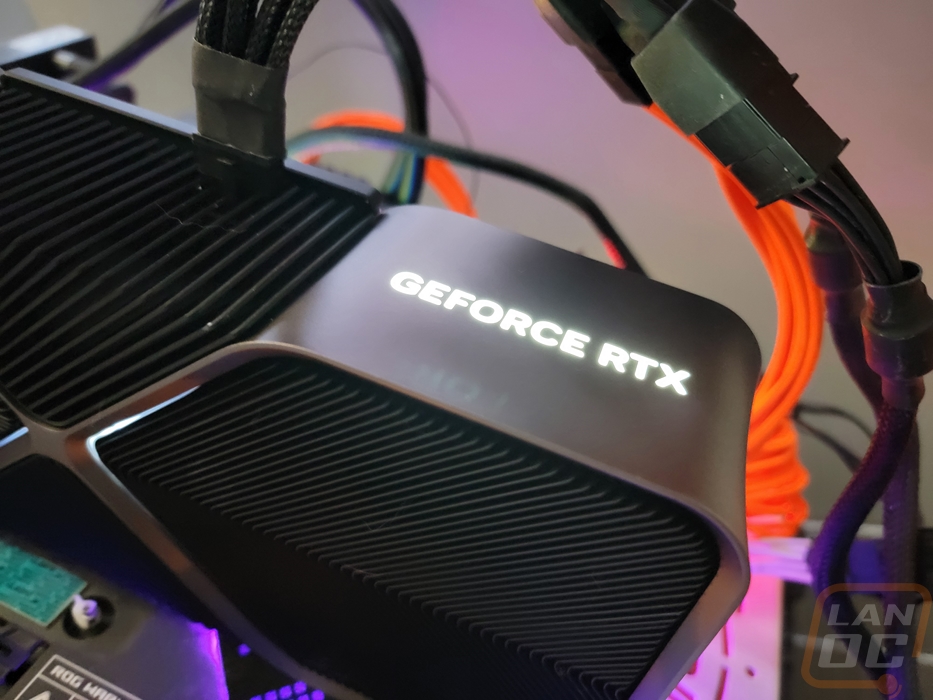
Up on the top edge of the RTX 4090 Founders Edition, the power connection is the farthest point back that the shortened PCB reaches. The power connector is similar to the 12-pin that the RTX 3090 FE had only this one has an additional four pins on the PCB side. The new plug isn’t positioned at an angle this time around which is a weird decision as far as space goes. Before with the angle, the cable wouldn’t stick directly up which combined with the height of the card is going to be tight for cases that barely fit the large card. The top also has the GeForce RTX branding at the end over top of the fan, this is backlit like last generation's higher-end cards.
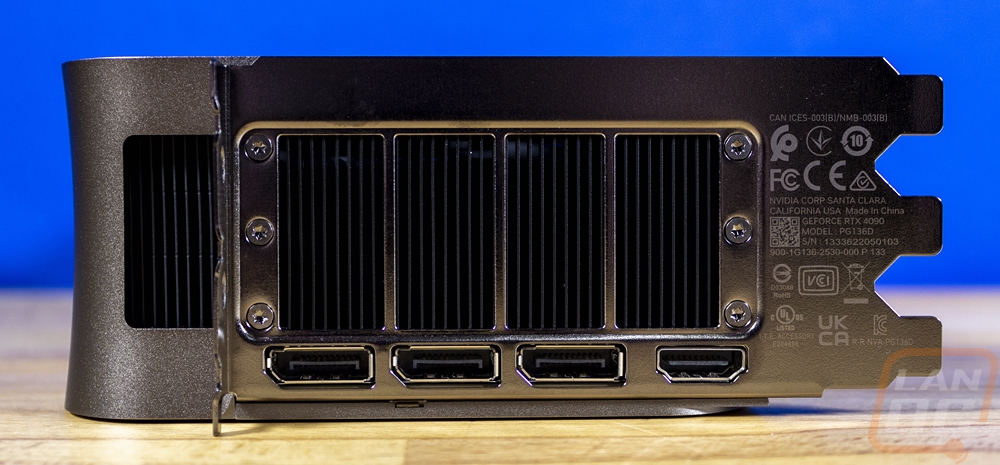
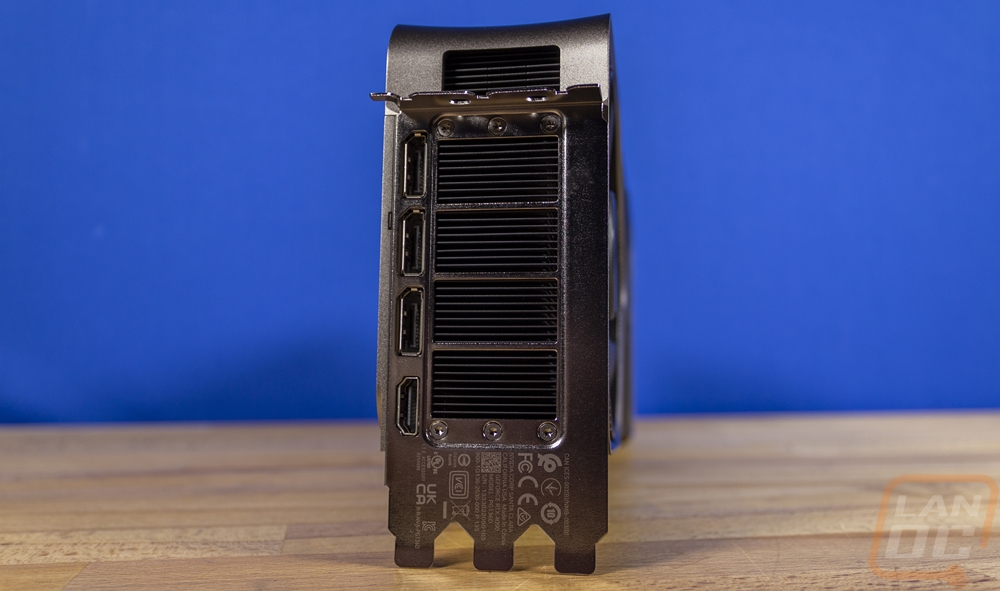
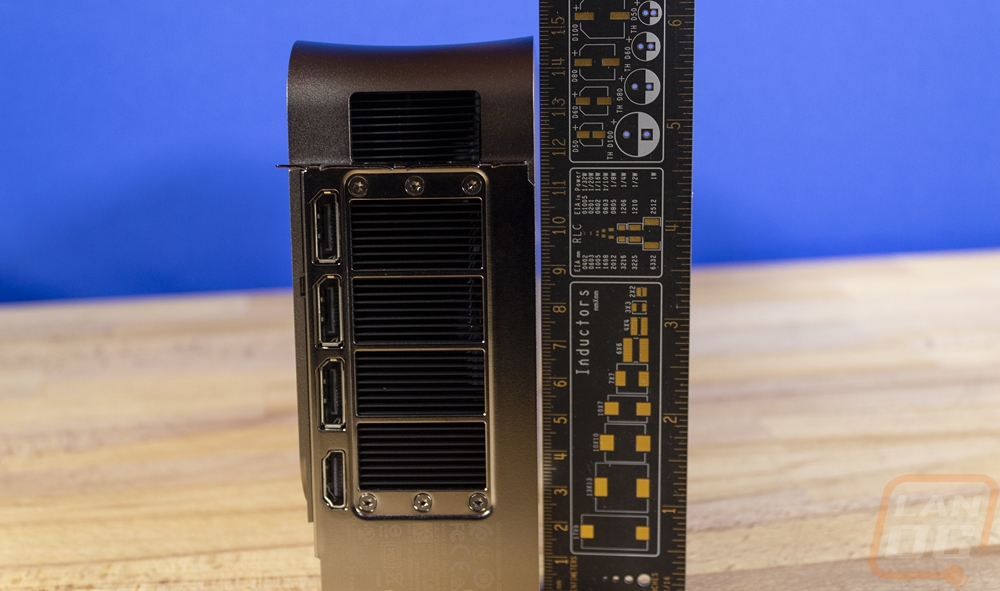
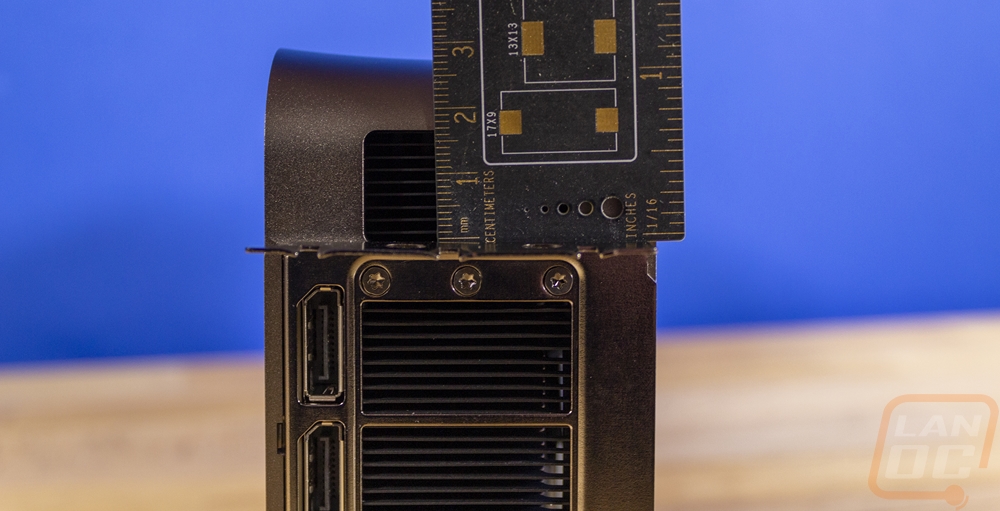
For the rear I/O and the PCI bracket, the RTX 4090 shares its 3-slot design with the RTX 3090 and the 3090 Ti, beyond that no other Founders Edition or reference cards have had a 3-slot design. Nvidia has been careful to also not to block the airflow with this bracket. Rather than have a series of smaller holes the RTX 4090 Founders Edition has just four holes which take up most of the rear bracket. Below those it has a standard layout of display connection options with three DisplayPorts and one HDMI down at the bottom, the same layout that Nvidia used in all of their 3000 series cards and not having the HDMI in the middle like in the 2000 series. The bracket also has the model and serial number information etched on it as well as the certification logos that it is required to have which keeps all of that visible but also hidden away from being on the rest of the card. This and the 3090 FE models are the only Founders Edition cards that also go beyond the “standard” height of a card with the top of the card sitting 30mm above the top of the PCI bracket when normally that is less than 10mm. This isn’t unusual for any of the aftermarket cards, in fact, a lot of those cards go well above this but I am surprised Nvidia has gone this direction with OEMs in mind, especially with the power plug also on top adding more height when plugged in.
Speaking of the power plug on top, here is a look at the included adapter which takes the new compact connection and uses four traditional 8-pin plugs. This is the 12VHPWR power connection and it can support up to 600 watts. It is standard on ATX 3.0 power supplies which are coming out now. The four-way adapter works for now, but using the proper 12VHPWR cable in the future will be a lot more compact.
The RTX 4090 Founders Edition sticks with the same lighting setup as last year's cards. The Geforce RTX logo on the top edge is backlit which is the only branding that is backlit. Then the X shape in the middle of the infinity rings on both sides has just a slight amount of backlighting. I hate companies using lighting just to show off their branding and the mix here is near perfect. By default it is all lit up in white but like with last generation's cards I imagine that RGB is there for the software that has access to it like iCue.
Test Rig and Procedures
Test System
CPU: Intel Core-i9 12900K – Live Pricing
Motherboard: Asus ROG Maximus Z690 Extreme – Live Pricing
Cooling: Corsair H100i Elite LCD Display - Live Pricing
Noctua NT-H1 Thermal Paste - Live Pricing
Memory: Micron DDR5 2x32GB 4800MHz – Live Pricing
Storage: Sabrent Rocket Q4 2TB – Live Pricing
Power Supply: Corsair AX1200 - Live Pricing
Case: Primochill Wetbench - Live Pricing
OS: Windows 11 Pro 64-bit - Live Pricing
|
Our Testing Procedures |
|
|
3DMark |
All 3DMark-based tests are done using the most recent version. We test using all three versions of Fire Strike and both Time Spy and Time Spy Extreme. Tests to look at ray tracing performance are done with Port Royal when supported and for Nvidia cards that support DLSS, the DLSS subtest is also done at 1440p with the performance setting and DLSS 2.0. |
|
Unigine Superposition |
1080p Extreme and 4k Optimized benchmarks along with the VR Future test are done. The VR test is done at the Oculus resolution |
|
VRMark |
Only the Blue room test is run |
|
CS:GO |
This test is done using the workshop map called CS:GO Benchmark. You can find more information at this link. https://www.gamingpcbuilder.com/how-to-install-csgo-fps-benchmark-map/ I test at 1080p, 1440p, and 4K resolutions. All auto settings are turned off and detail is set to their highest settings. shadow quality high, model texture detail high, shader detail very high, AA set to 16x, uber shaders enabled |
|
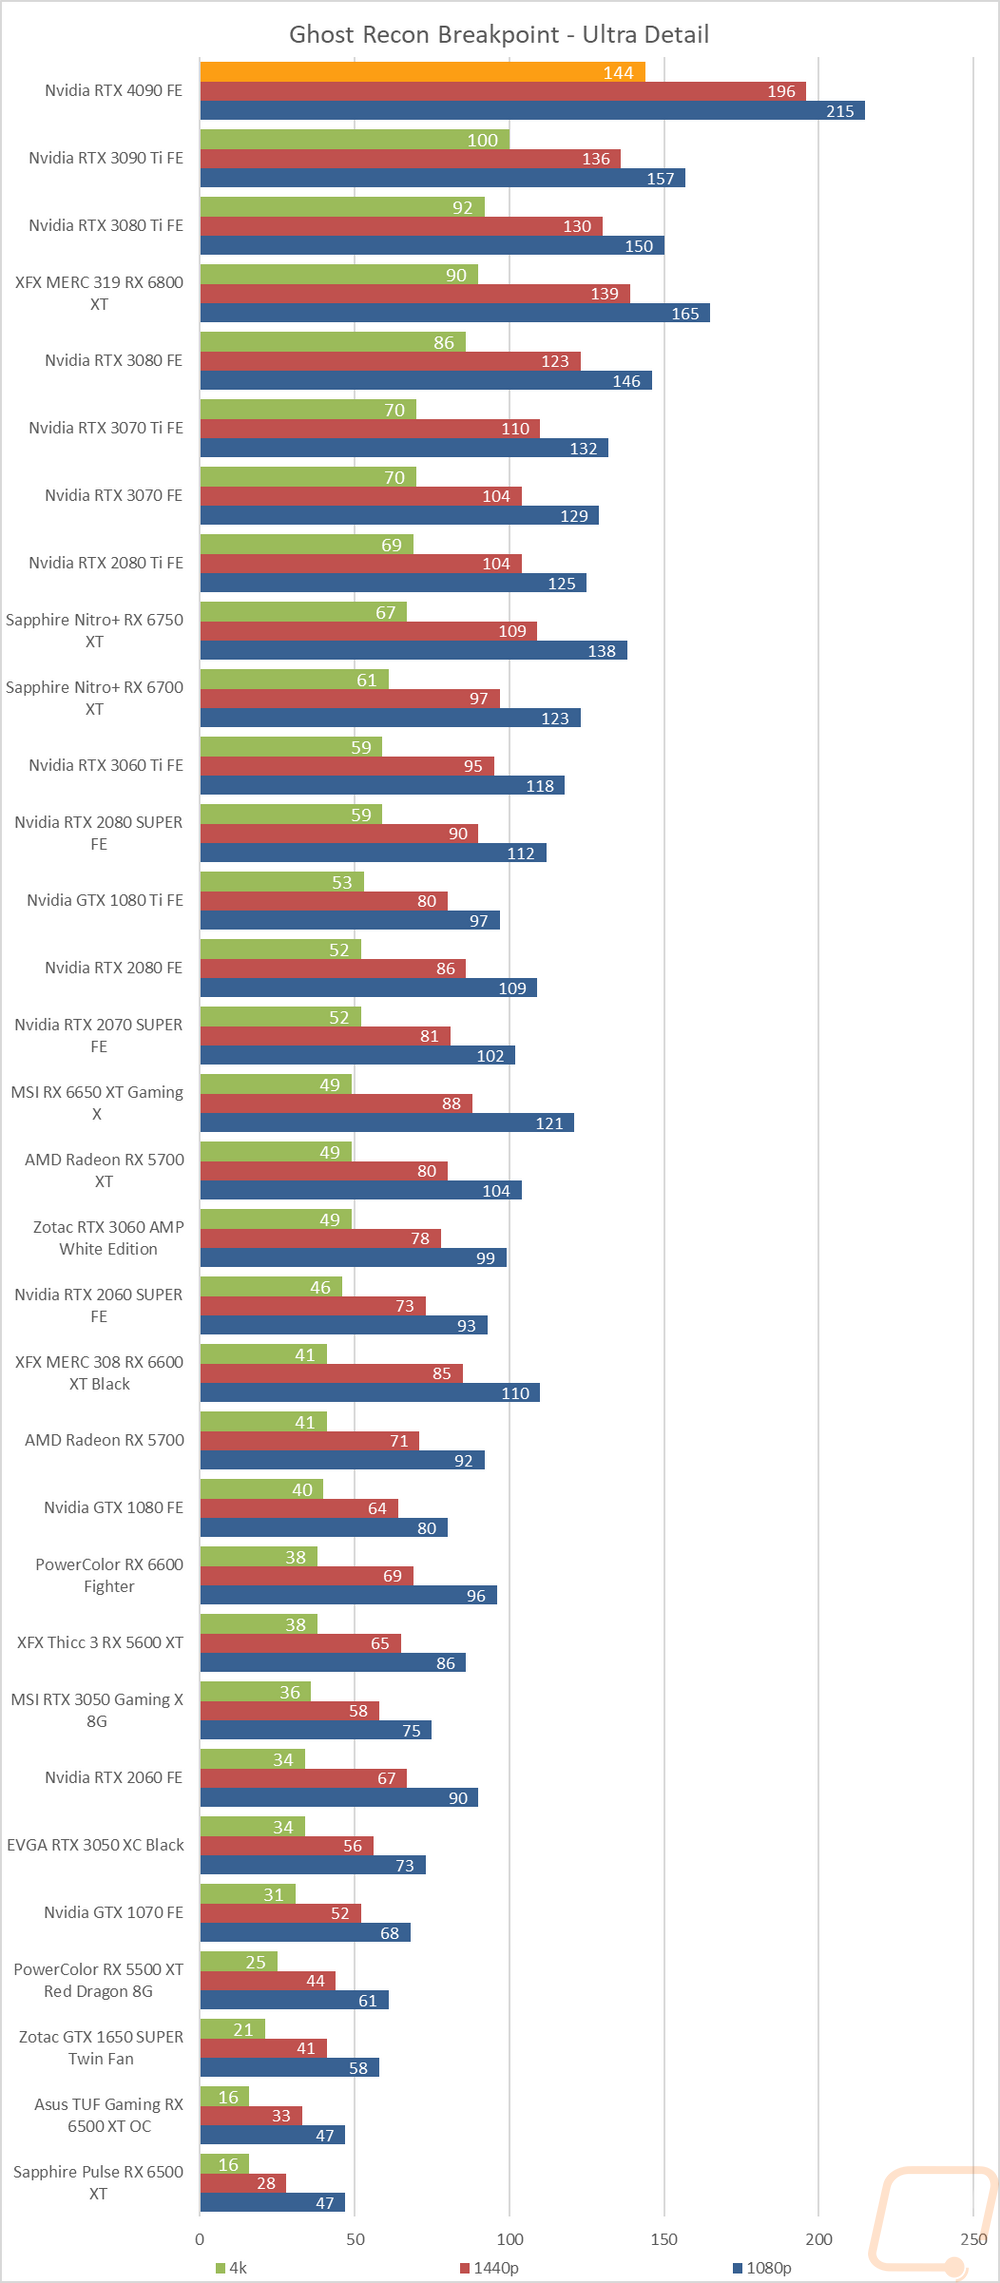
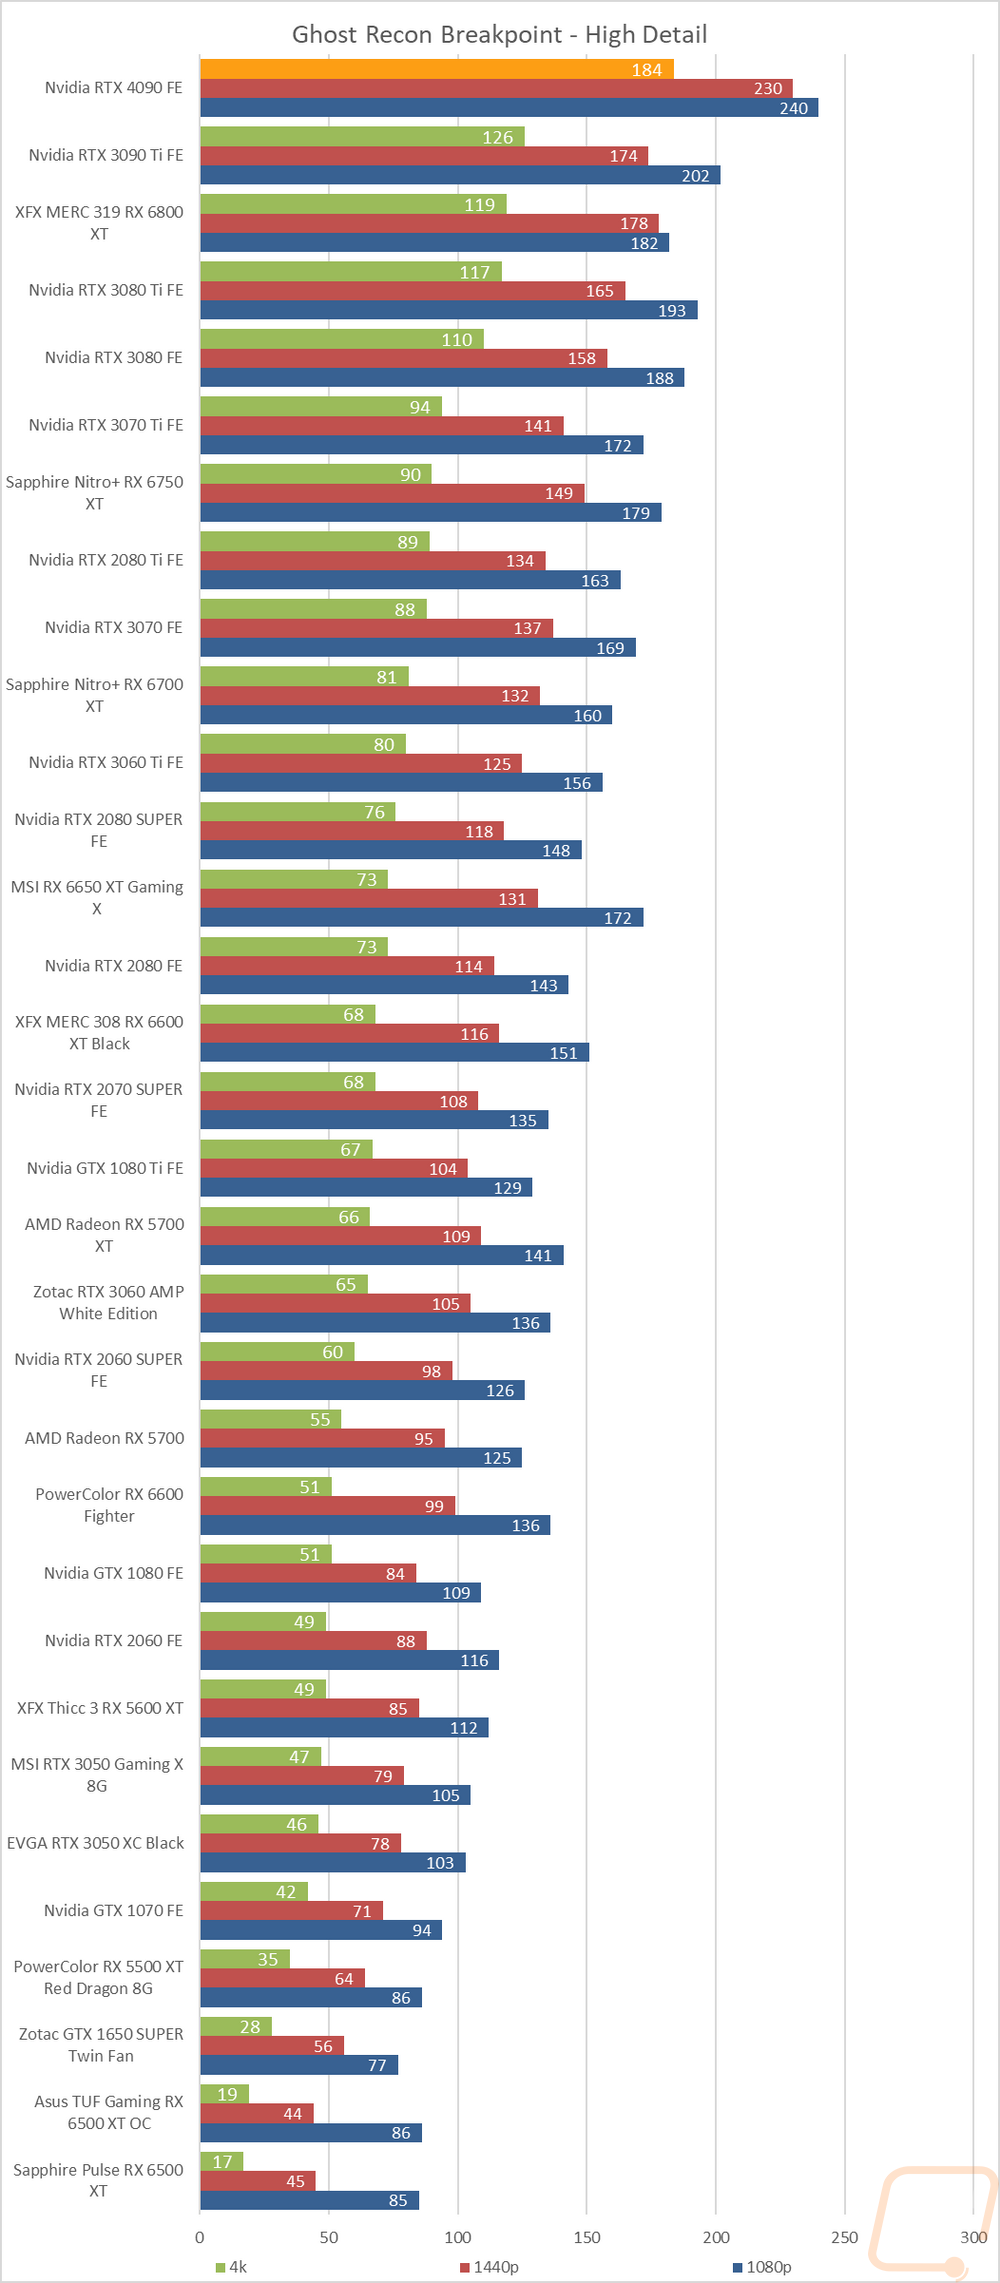
Ghost Recon Breakpoint |
Built-in benchmark tested at 1080p, 1440p, and 4k with the Ultra and Medium detail settings |
|
Watch Dogs: Legion |
Built-in benchmark testing at ultra and high details. Tested at 1080p, 1440p, and 4k. I also do RTX and DLSS testing on Nvidia cards at 4K using the Ultra detail settings as a base as well. |
|
Borderlands 3 |
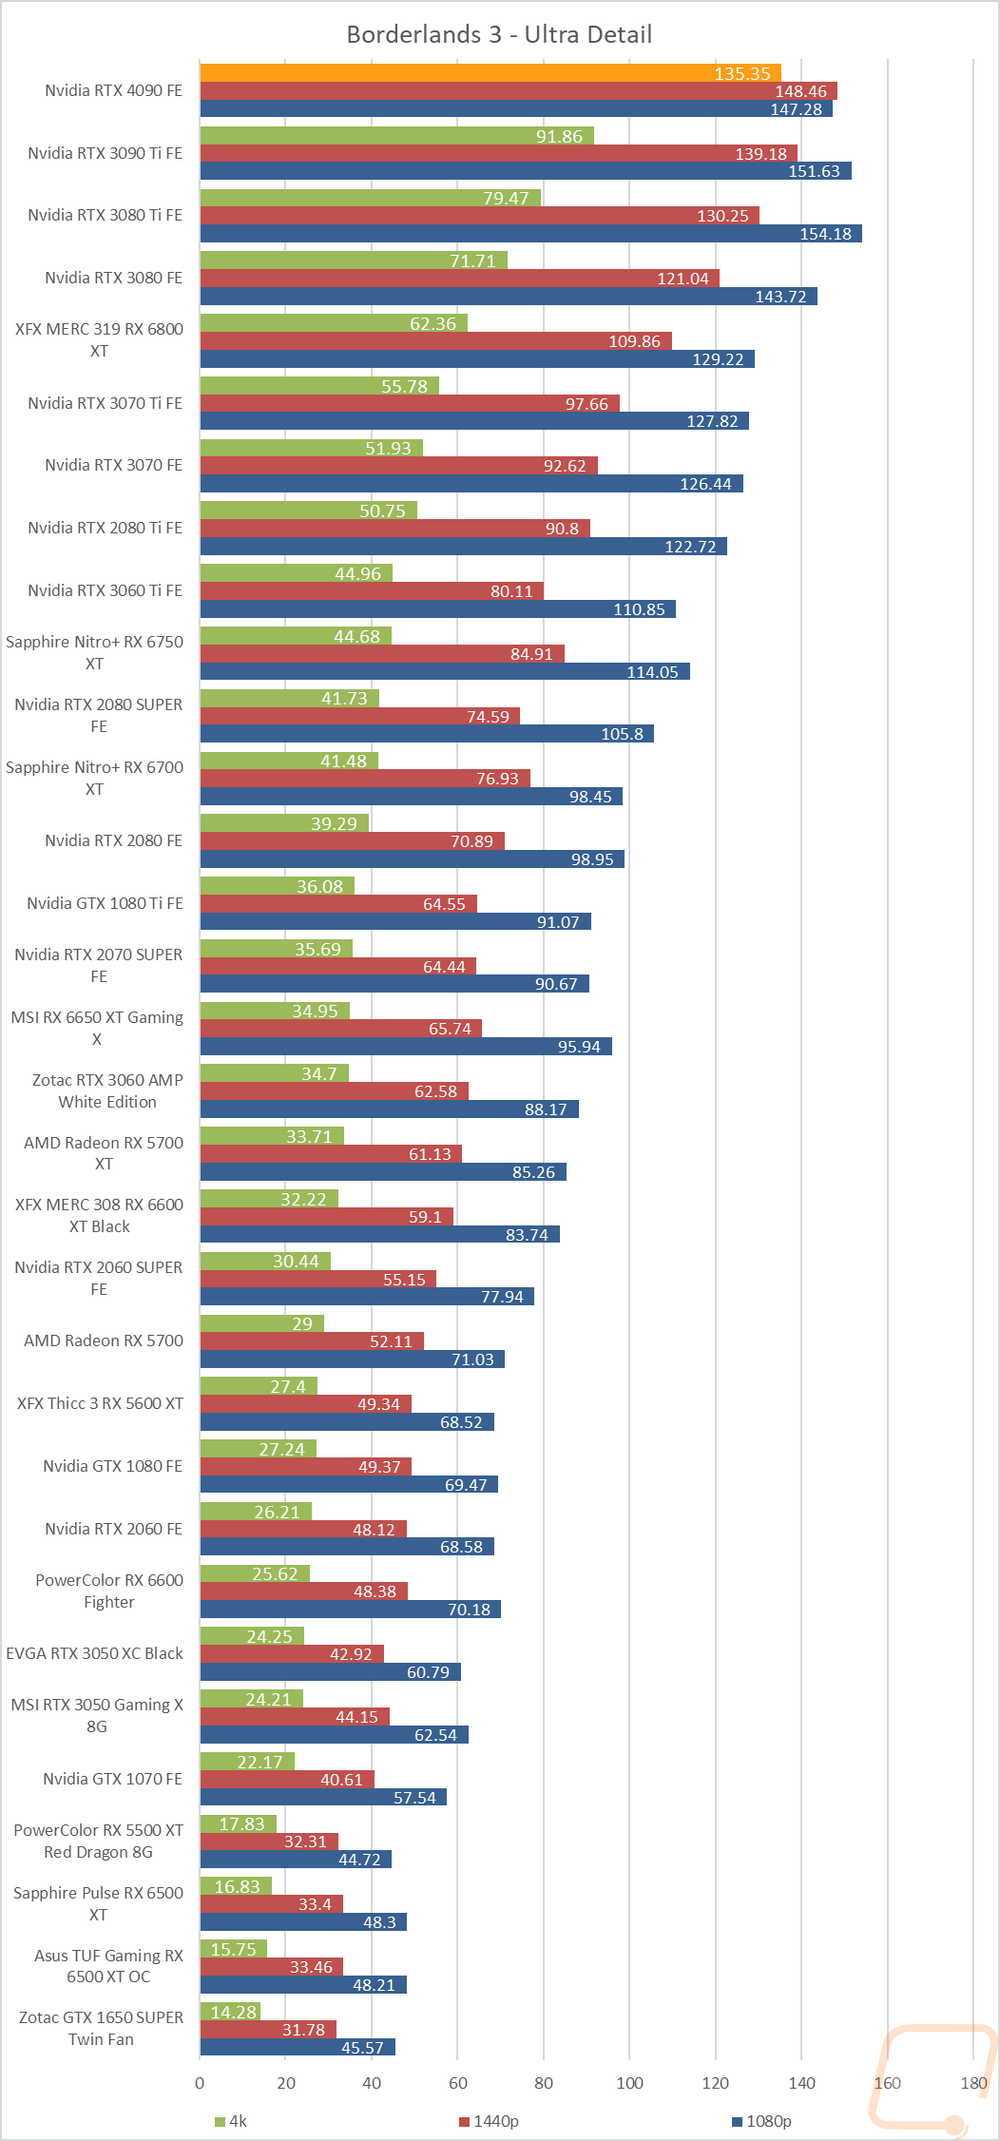
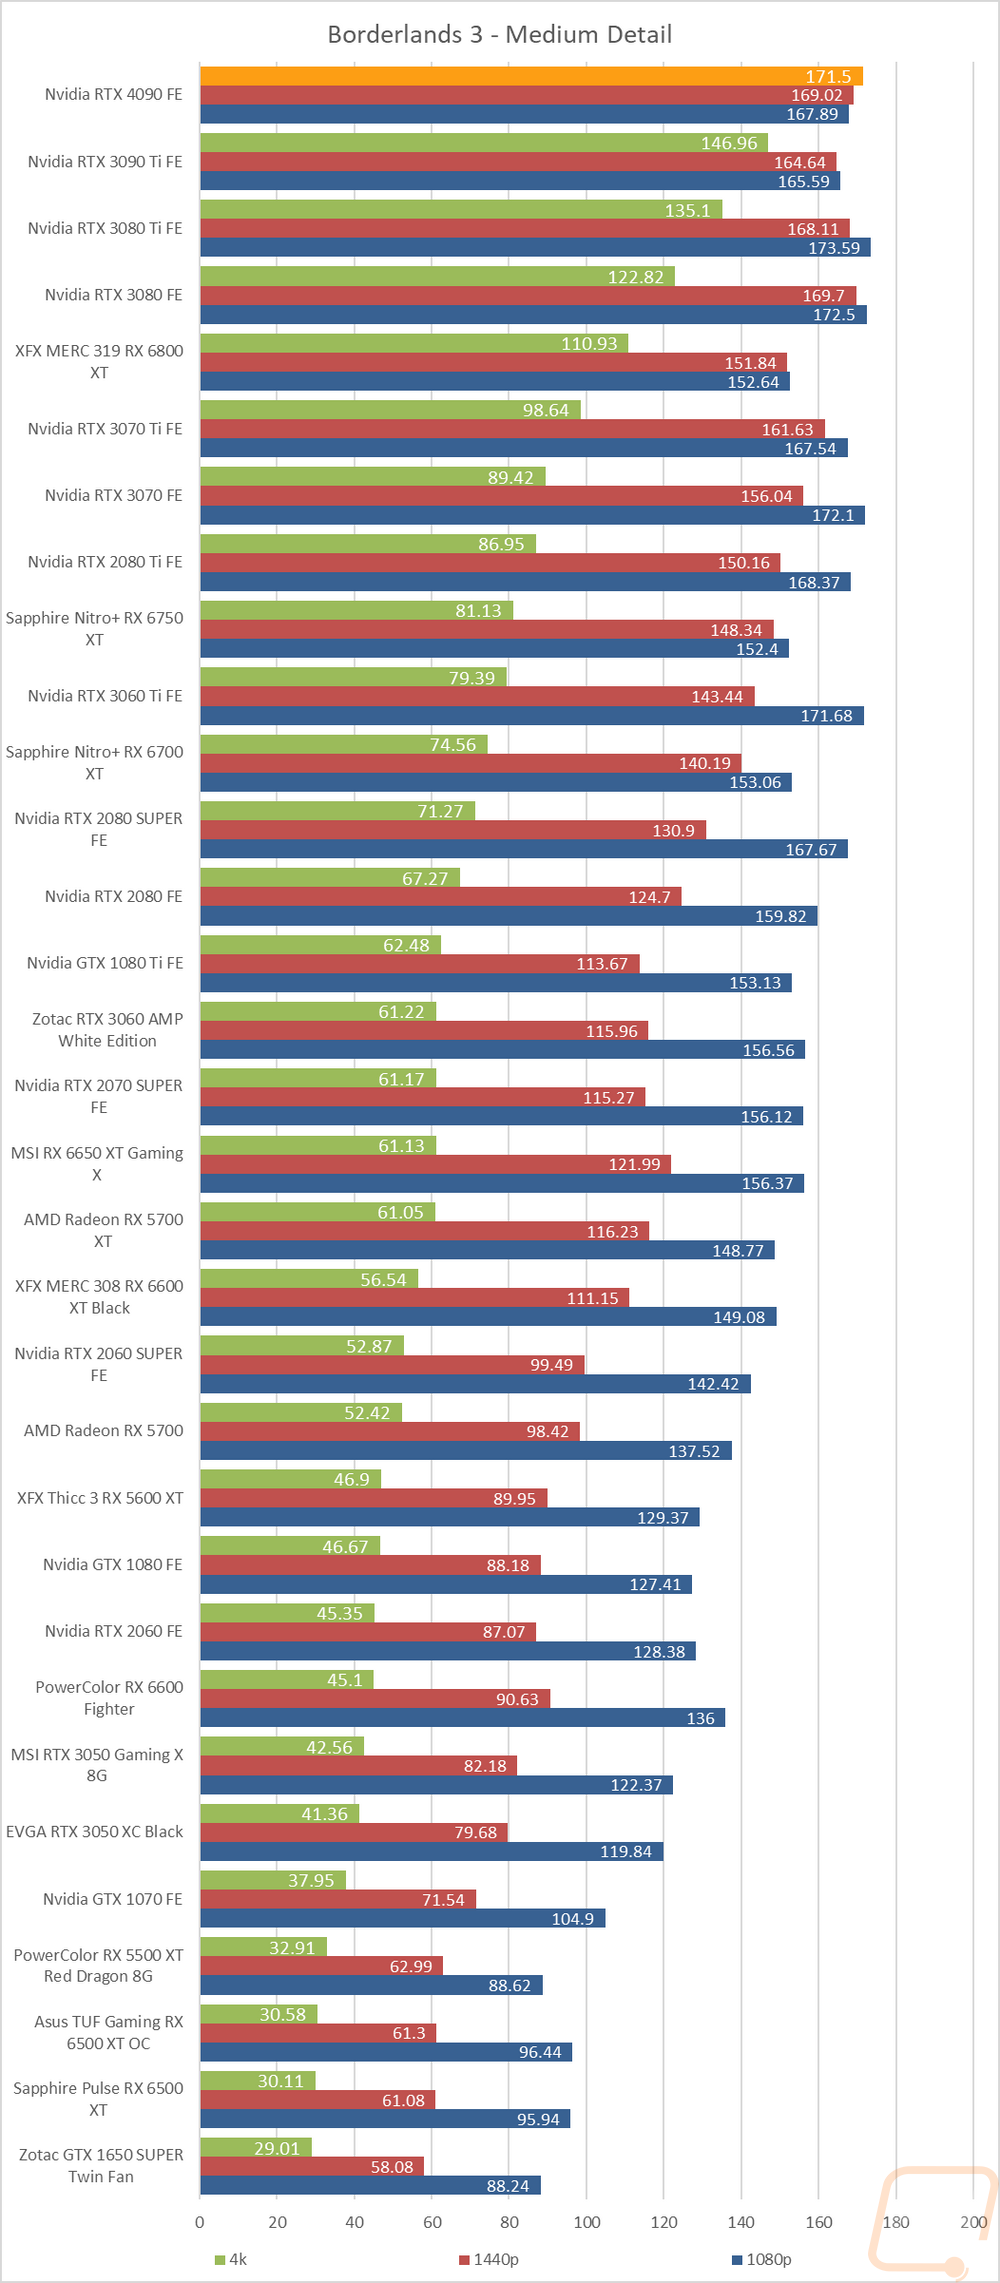
Built-in benchmark testing with the ultra detail setting and medium detail setting, done at full screen with default settings at 1080p, 1440p, and 4k on DX11 |
|
Metro Exodus |
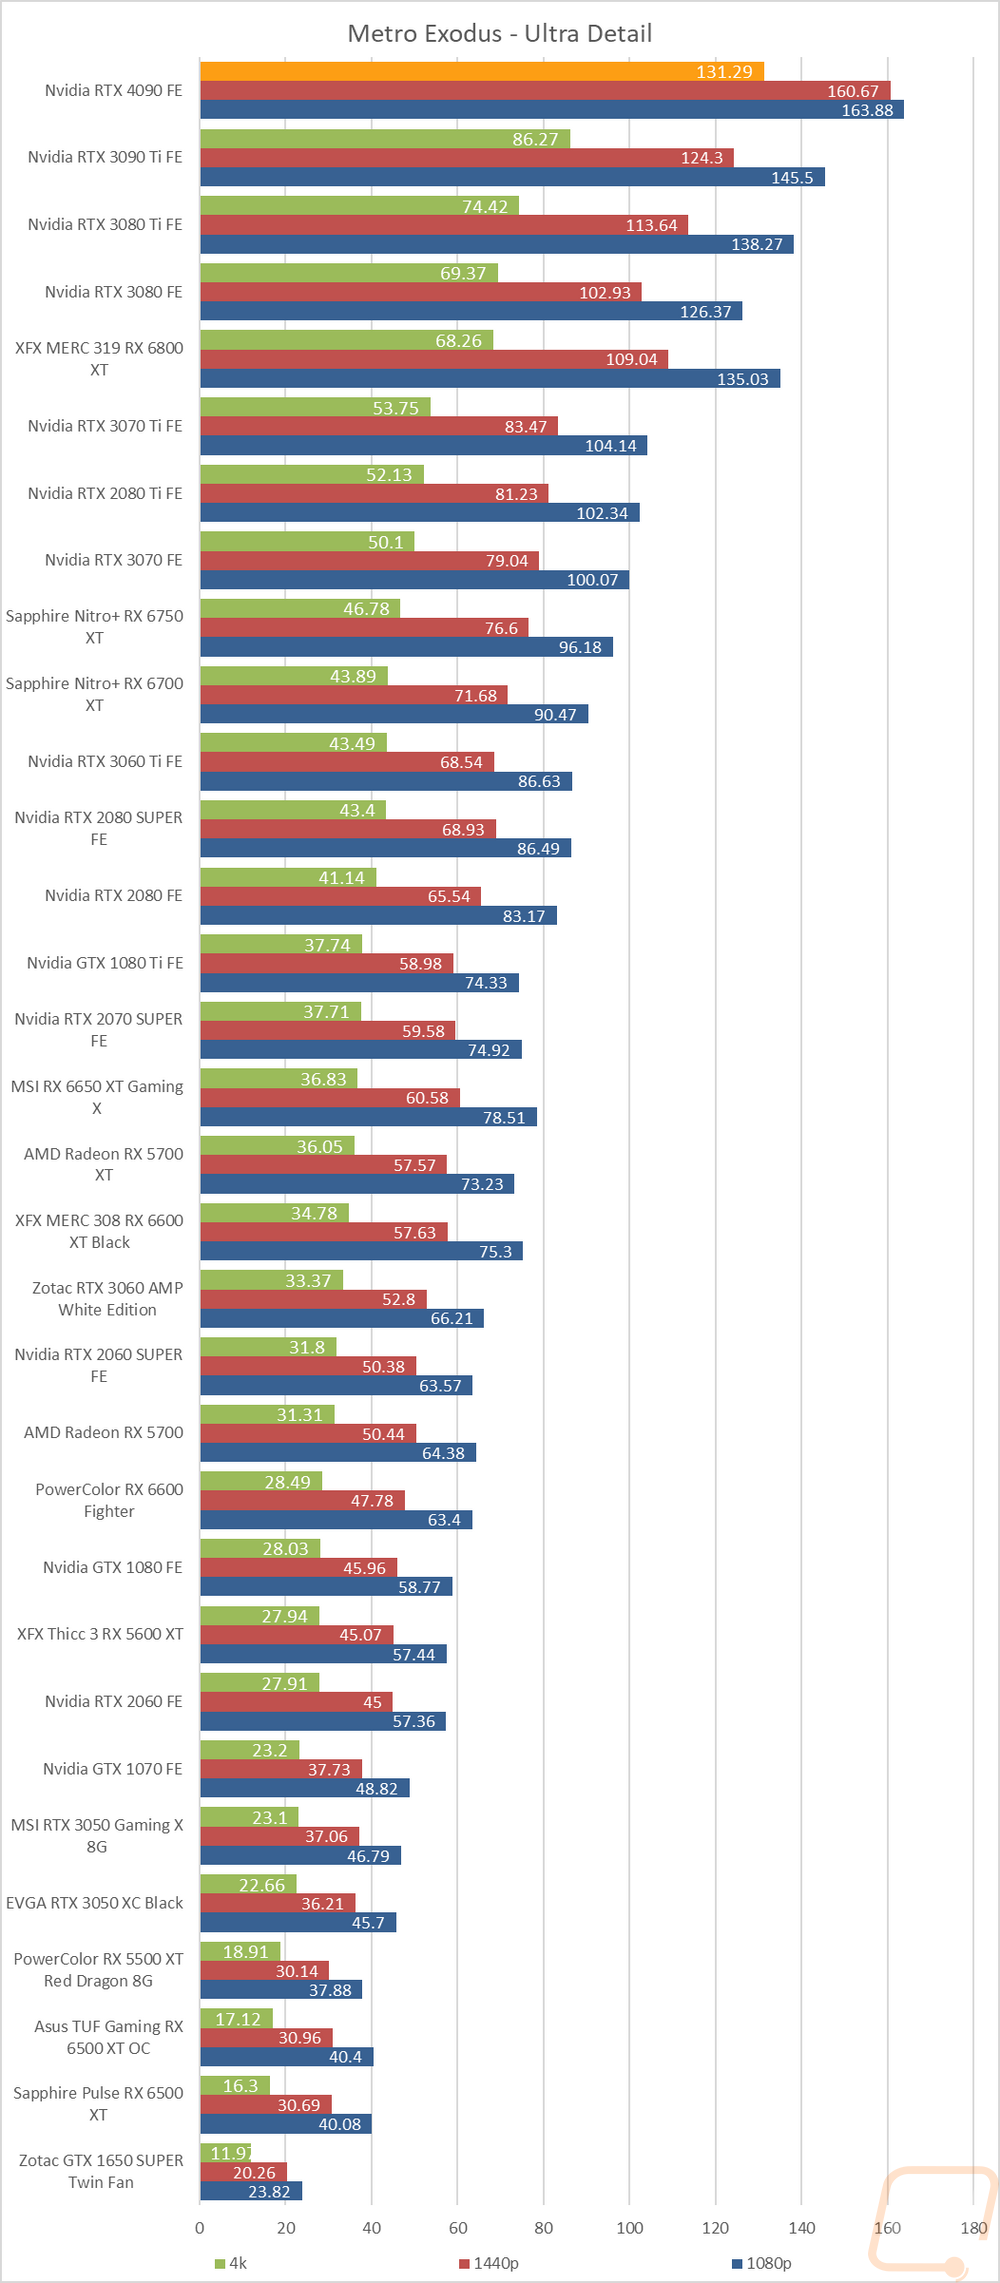
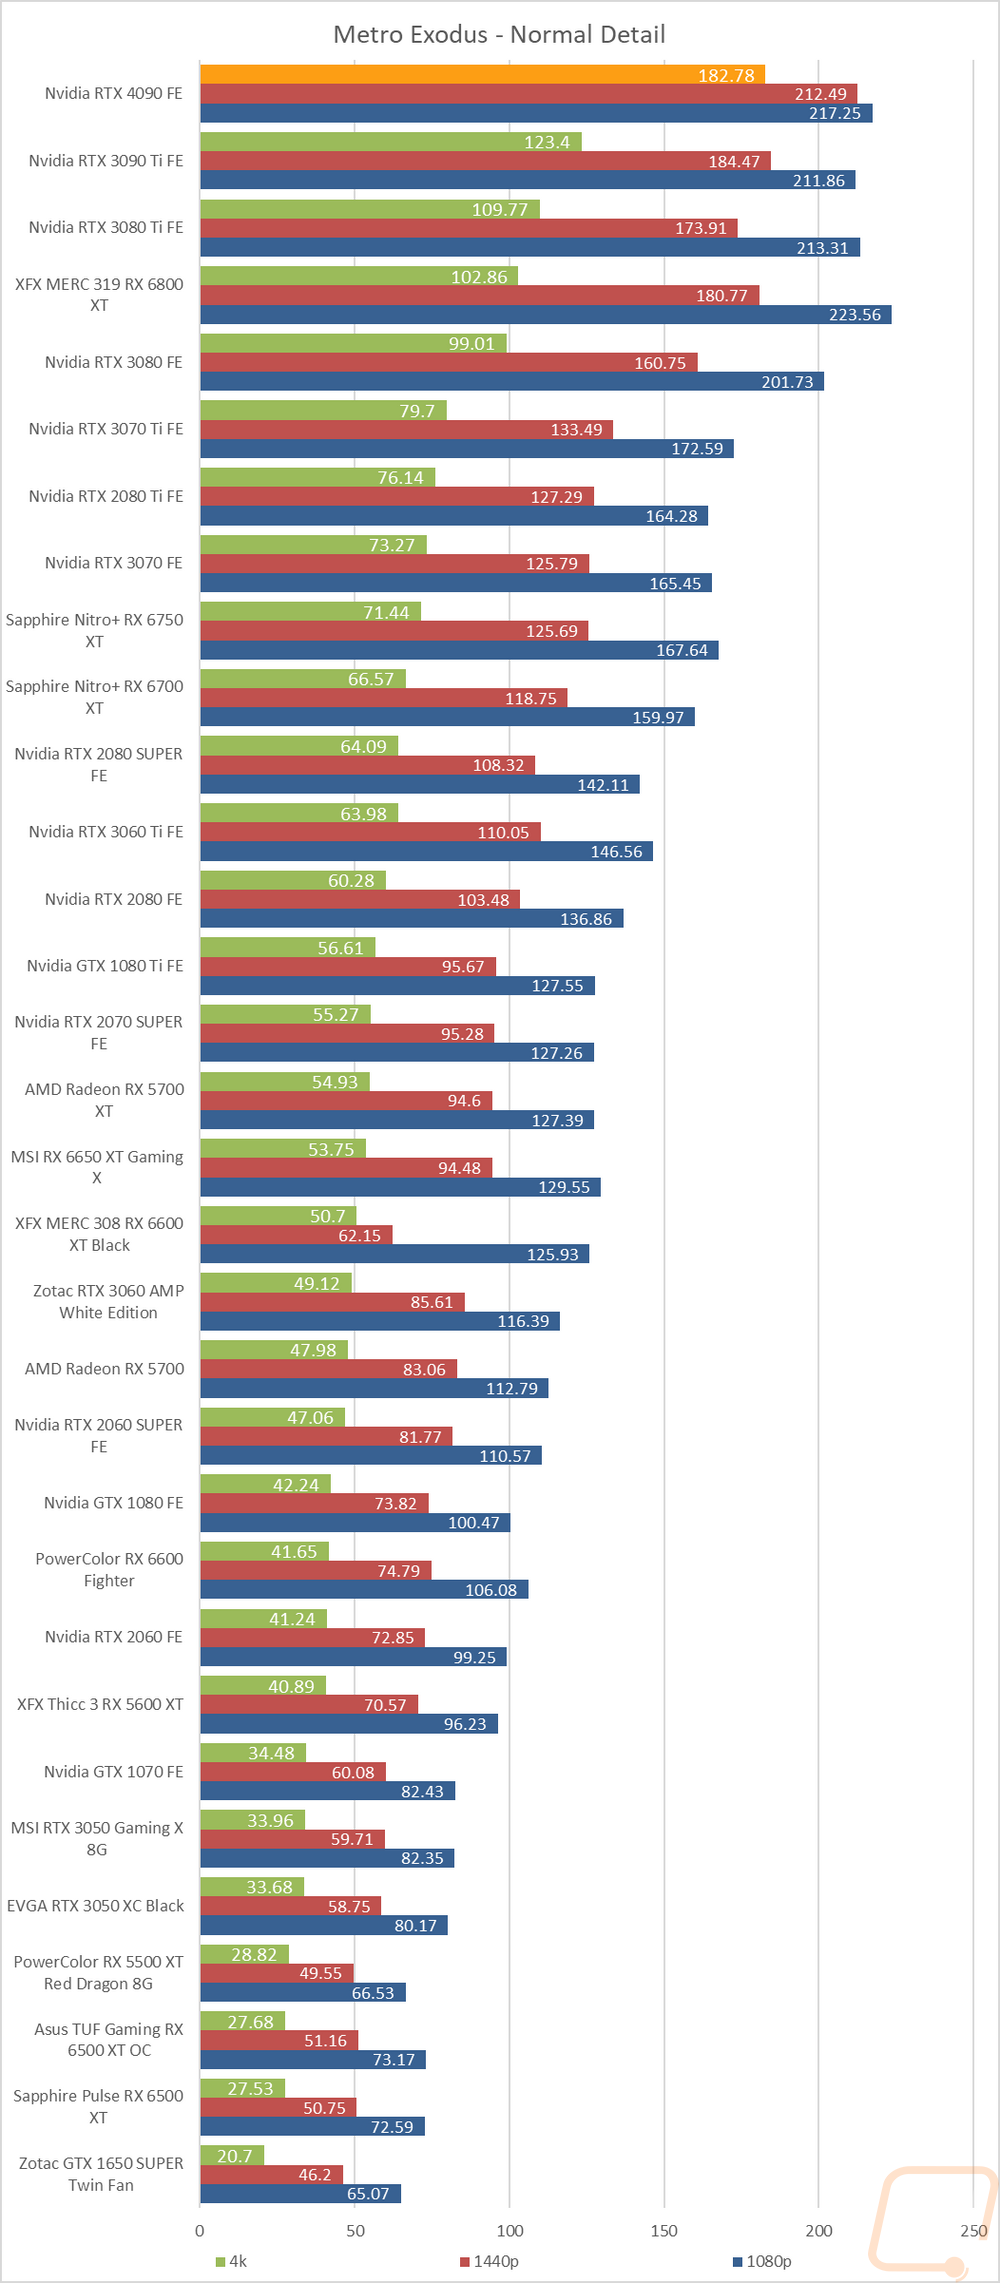
Using built-in benchmark, testing at ultra and normal details at 1080p, 1440p, and 4k. I also do RTX and DLSS testing at 4K with the ultra-detail base settings for Nvidia cards as well. |
|
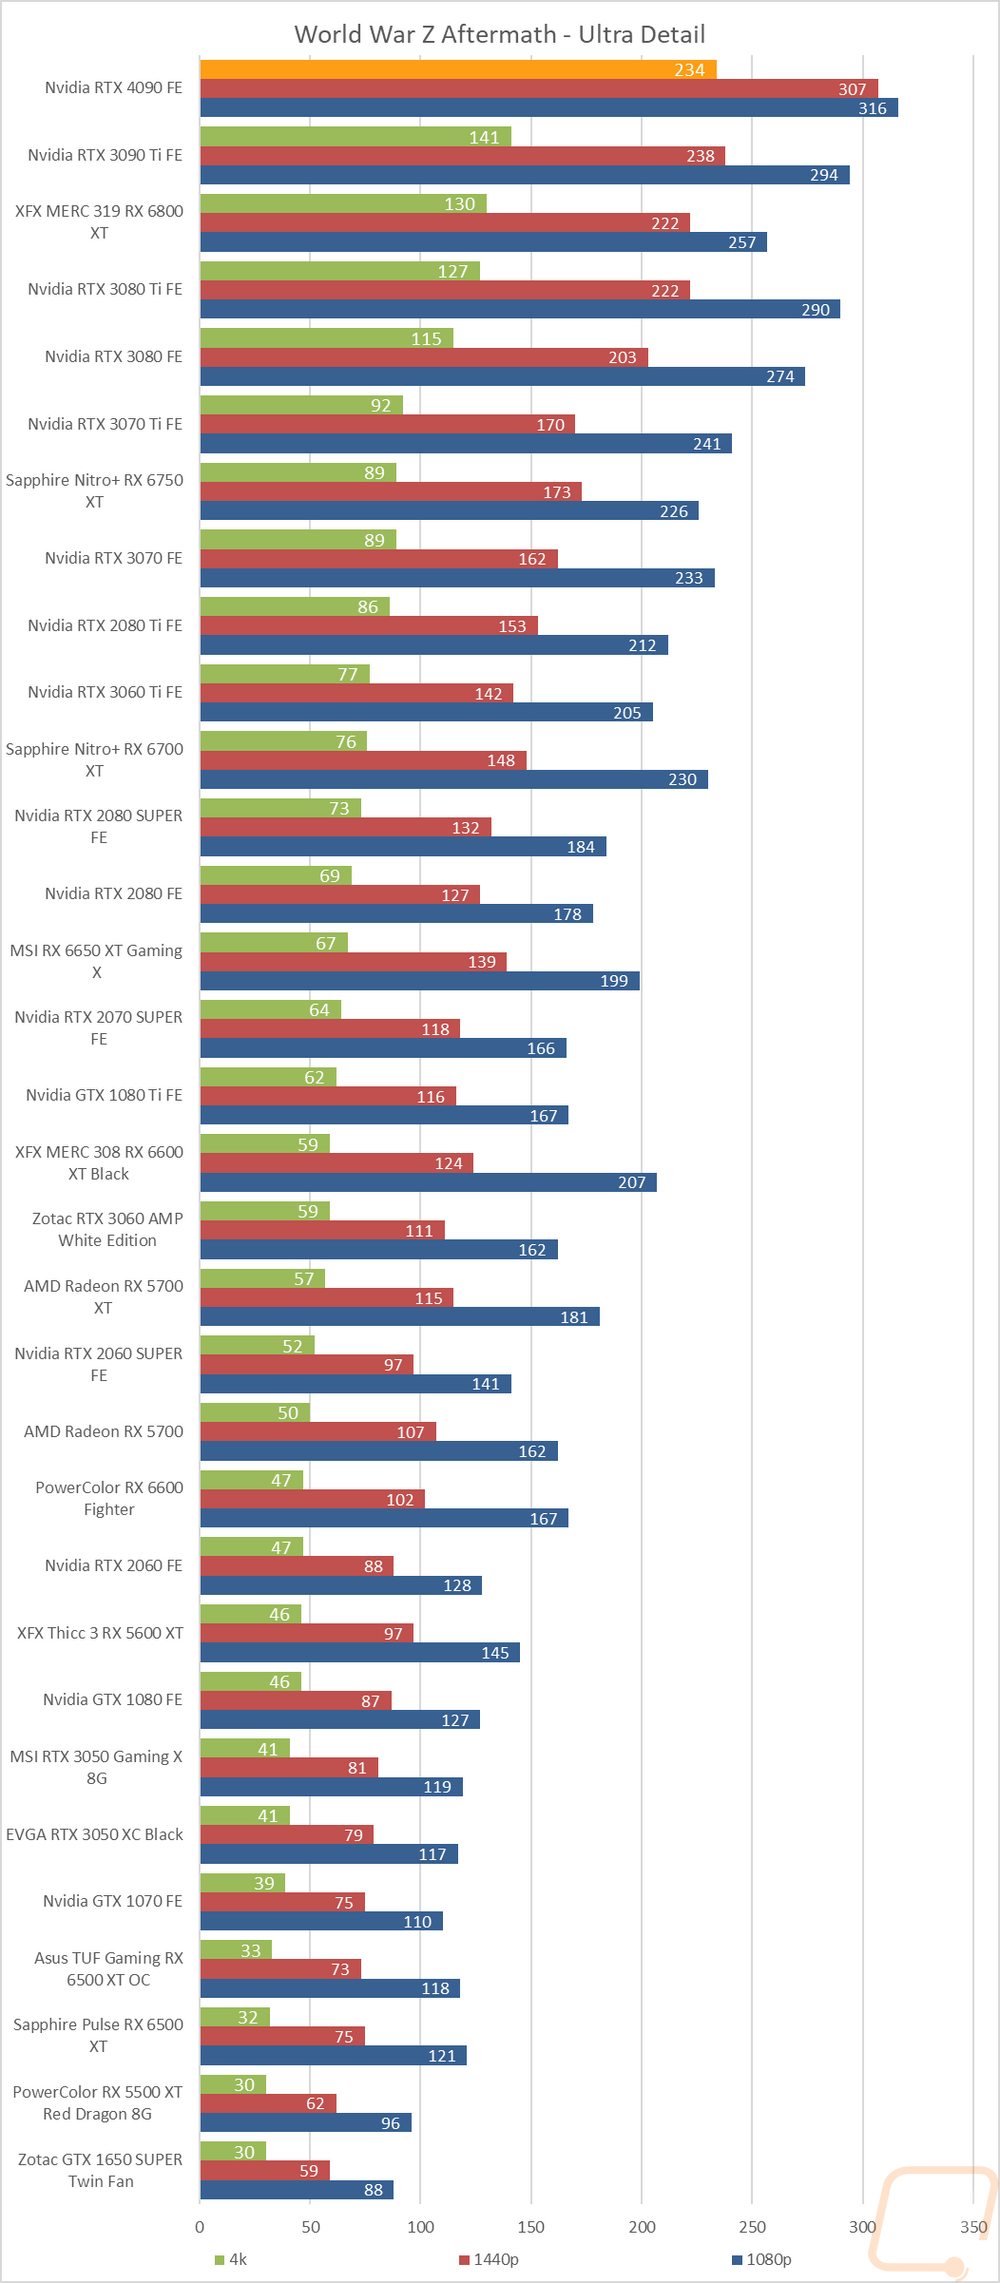
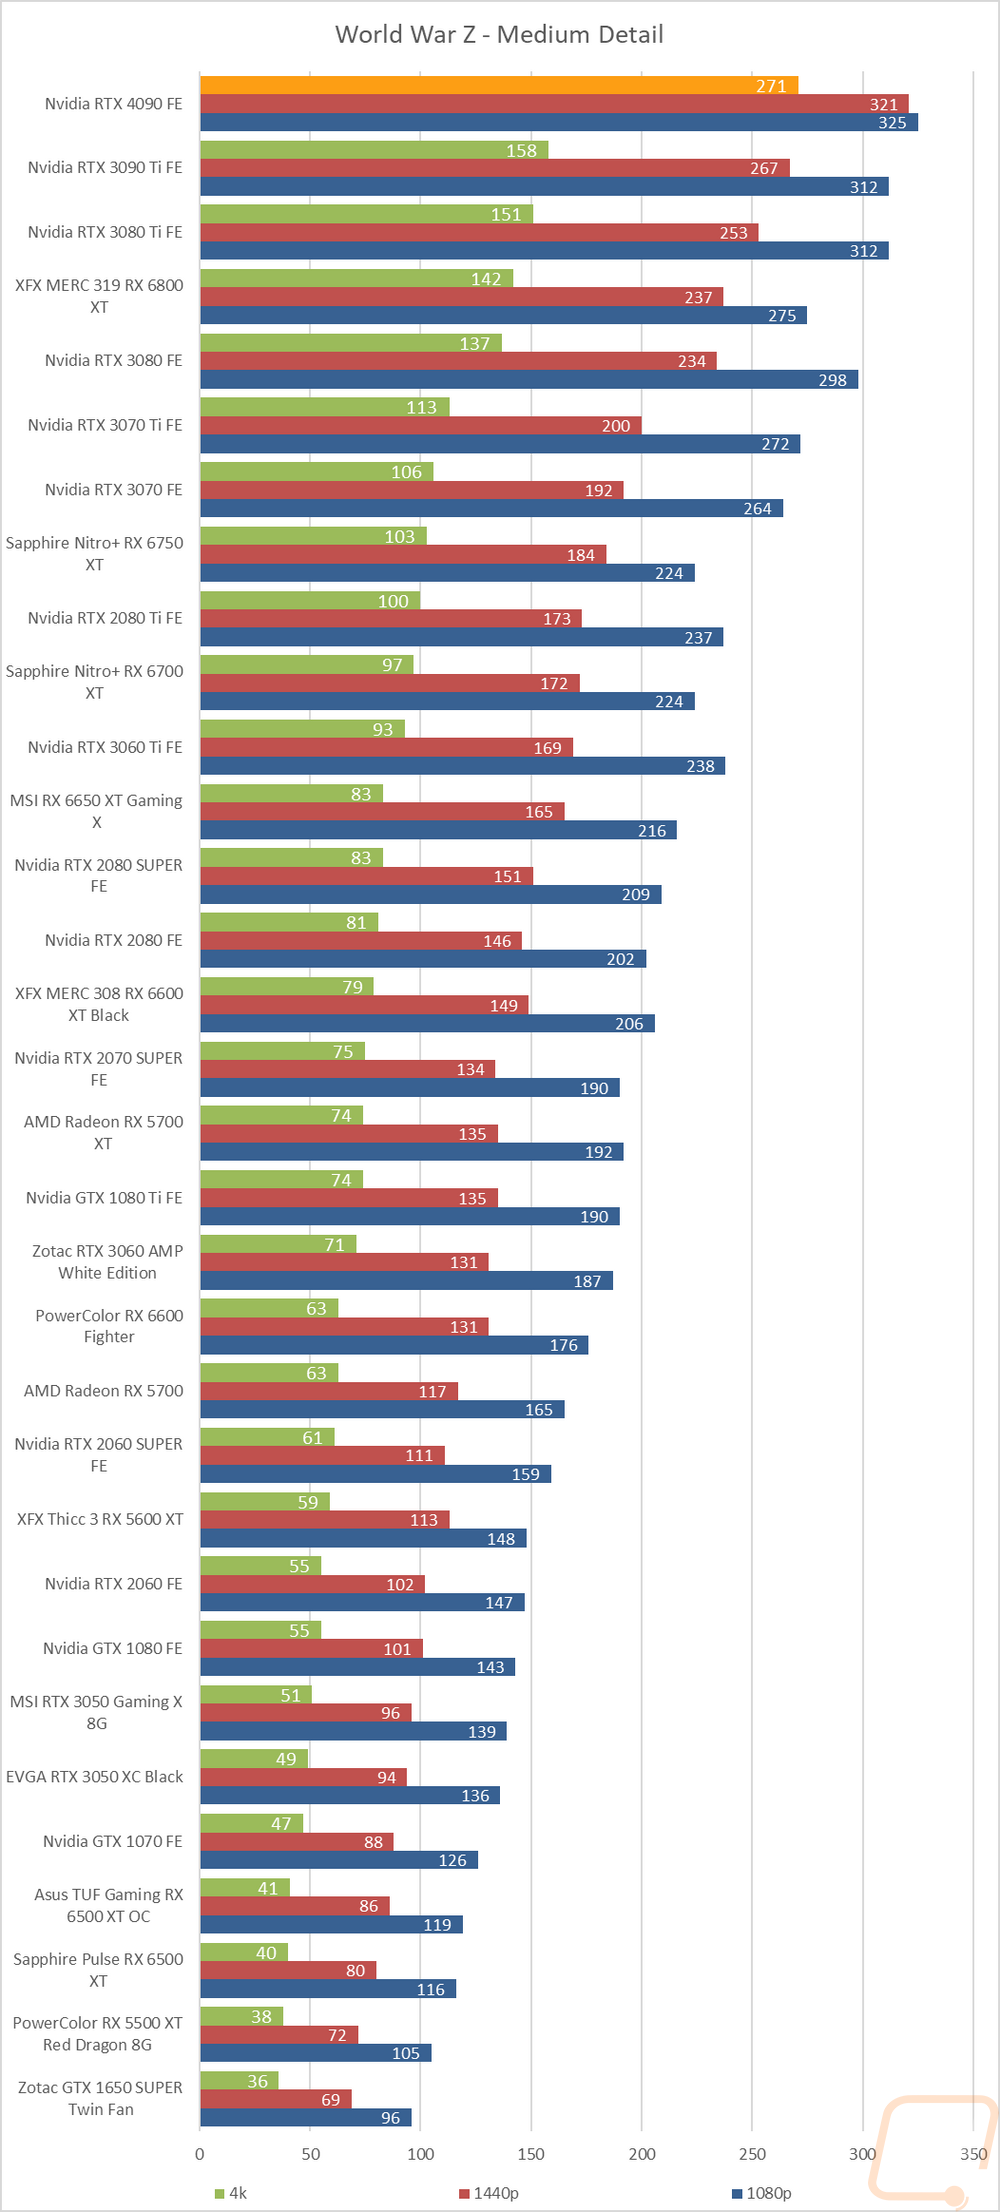
World War Z Aftermath |
Built-in benchmark in DX11 testing both the Ultra detail and Medium detail levels at 1080p, 1440p, and 4K resolutions |
|
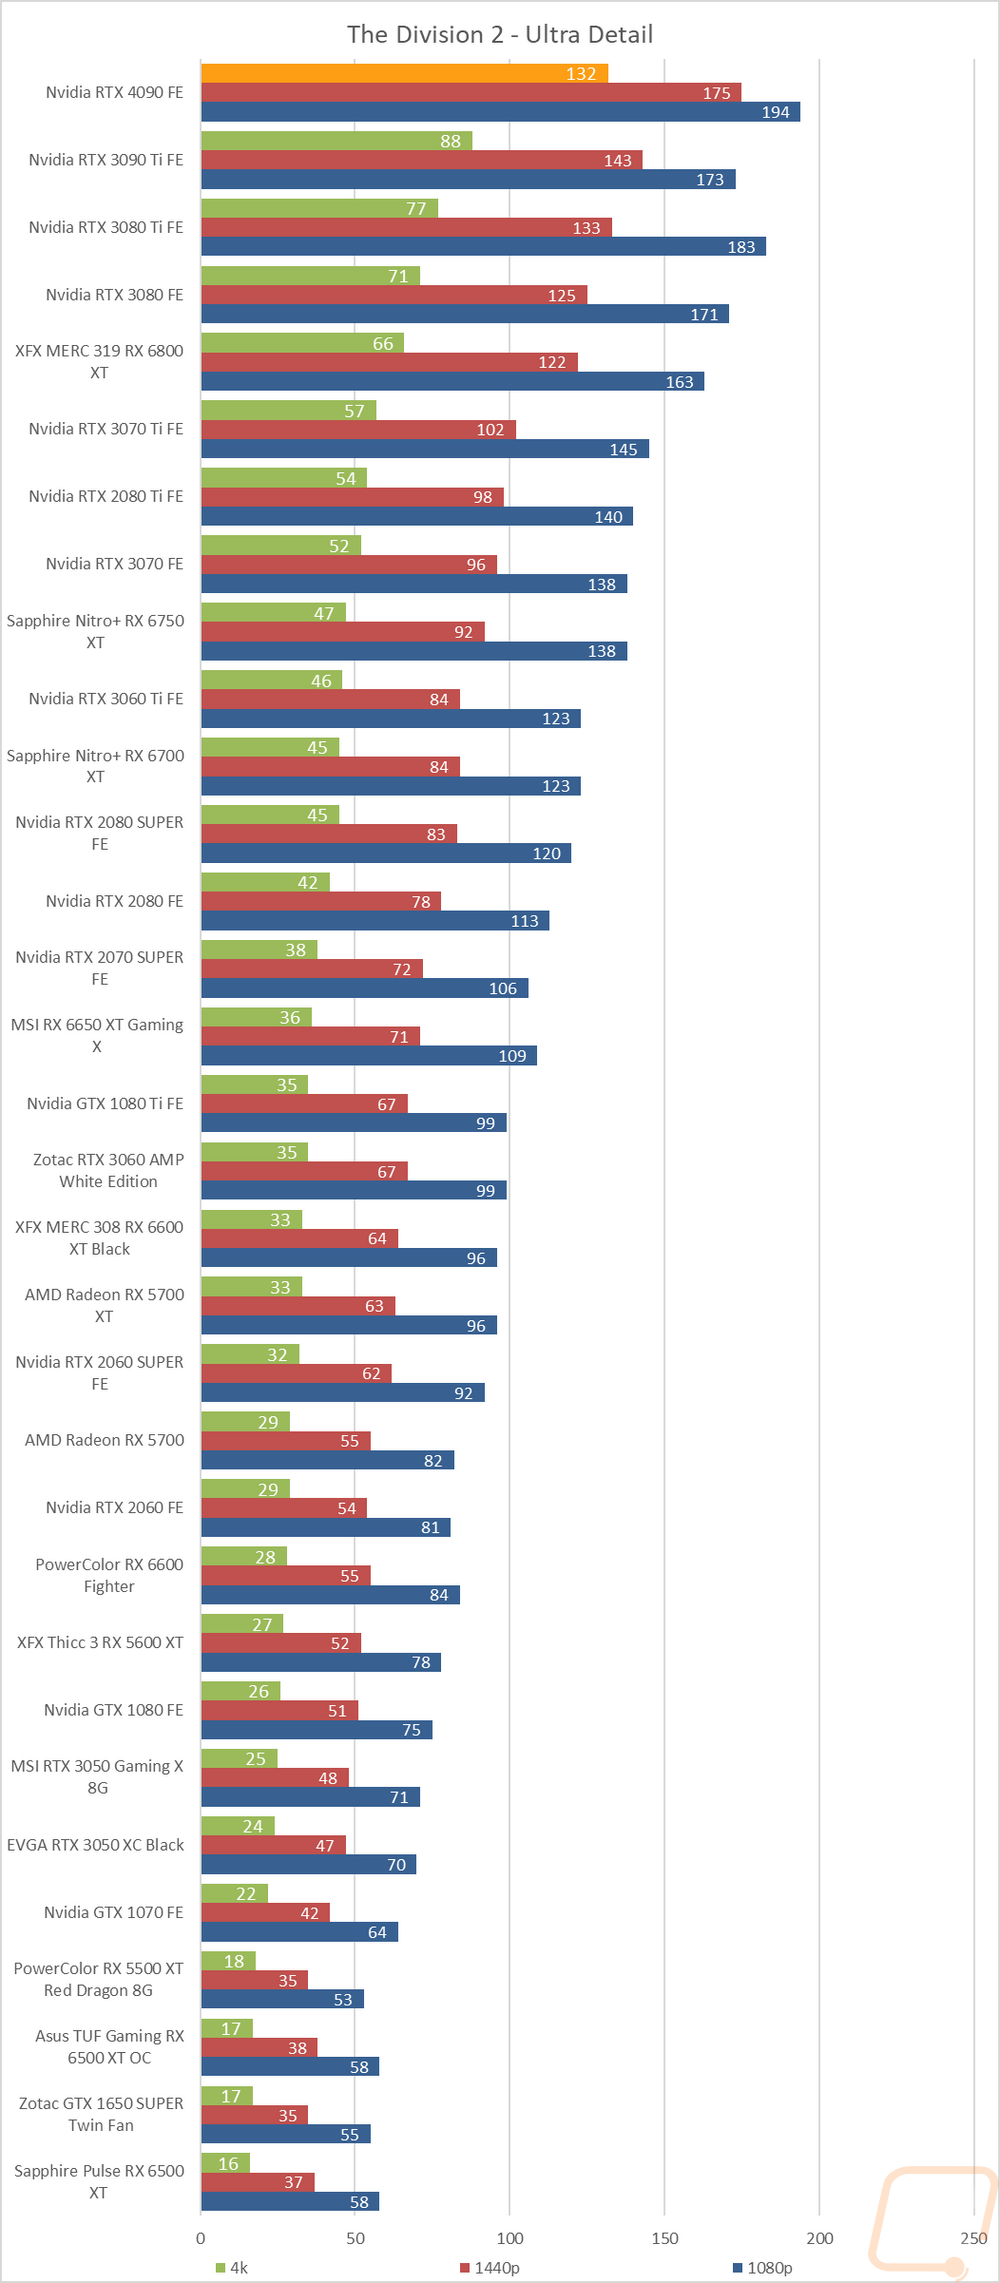
The Division 2 |
Built-in benchmark at Ultra detail with V-Sync turned off at 1080p, 1440p, and 4k resolutions. |
|
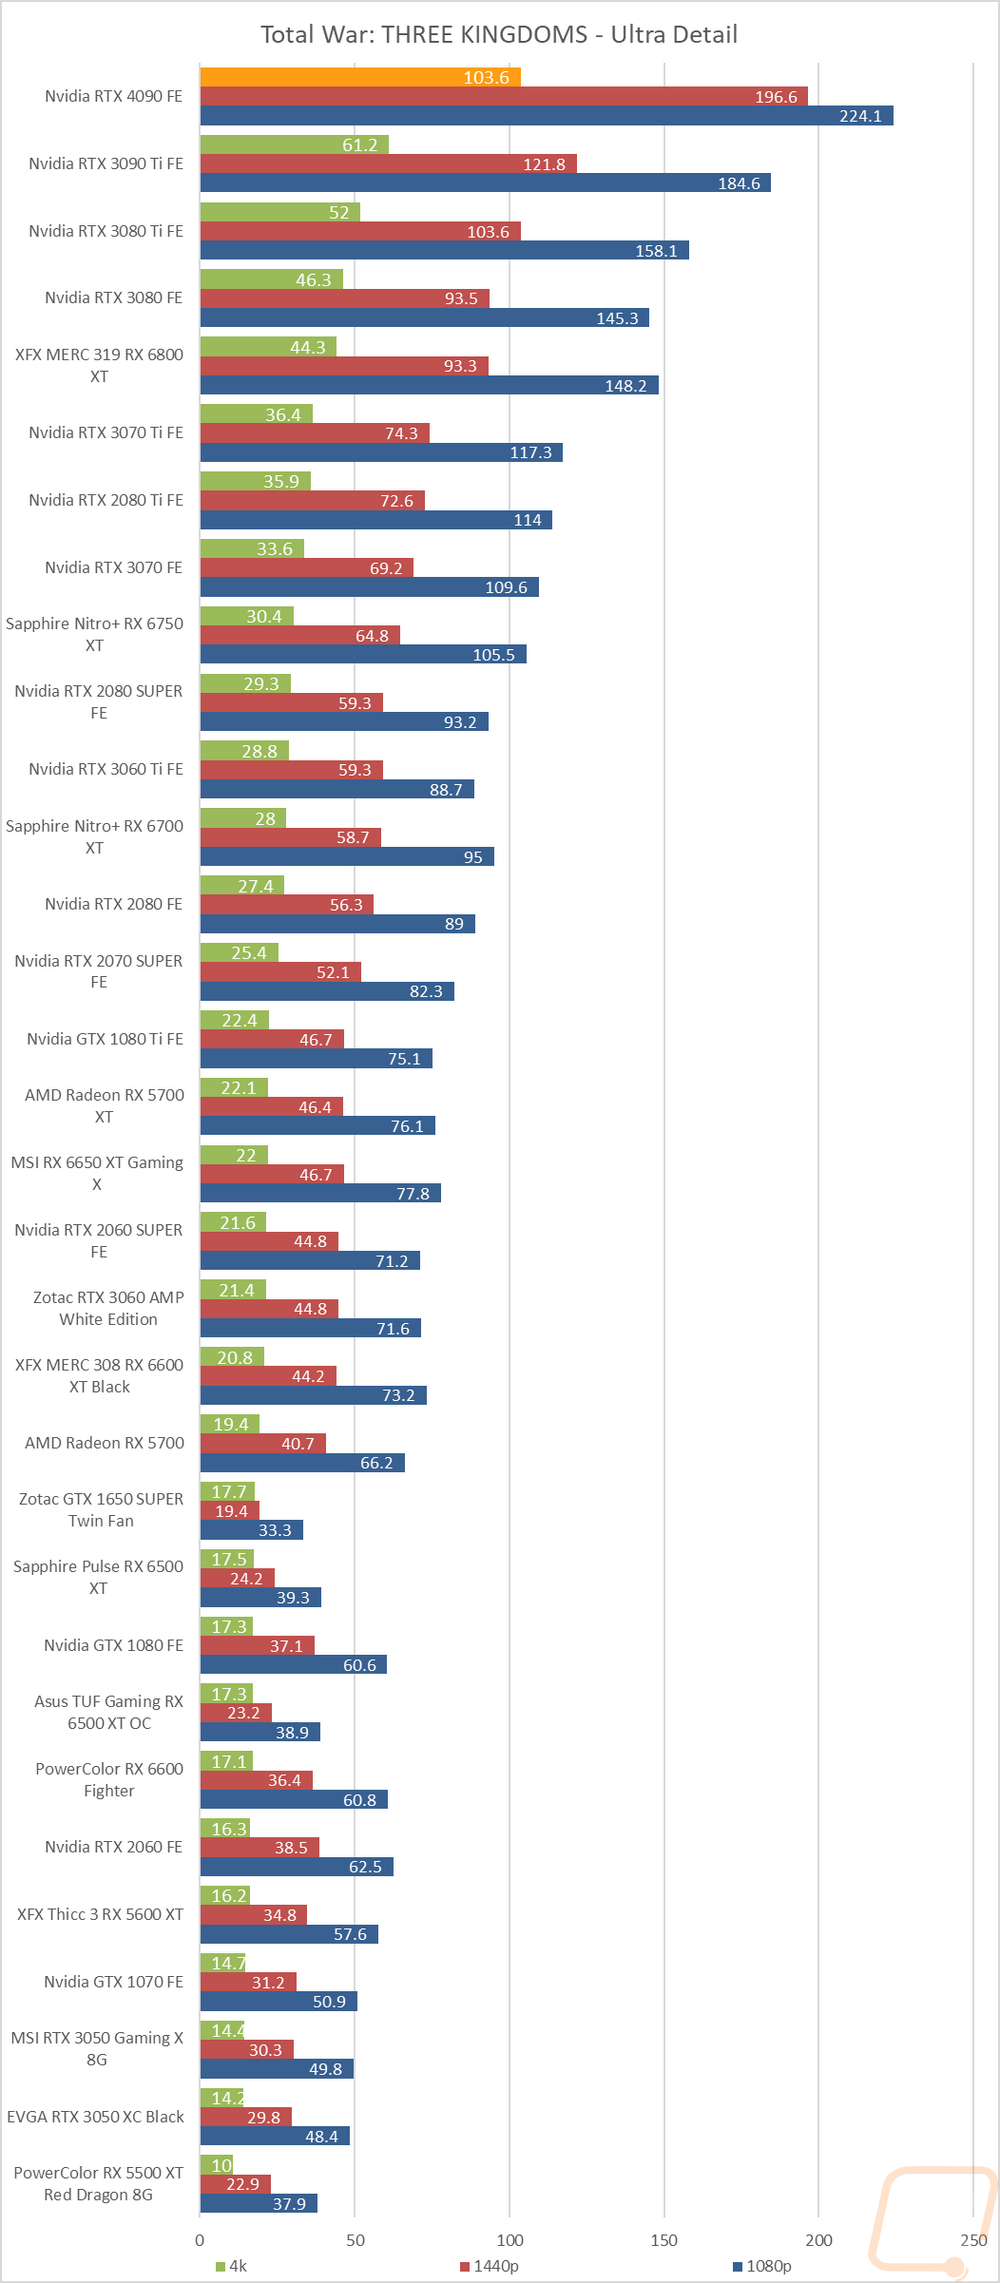
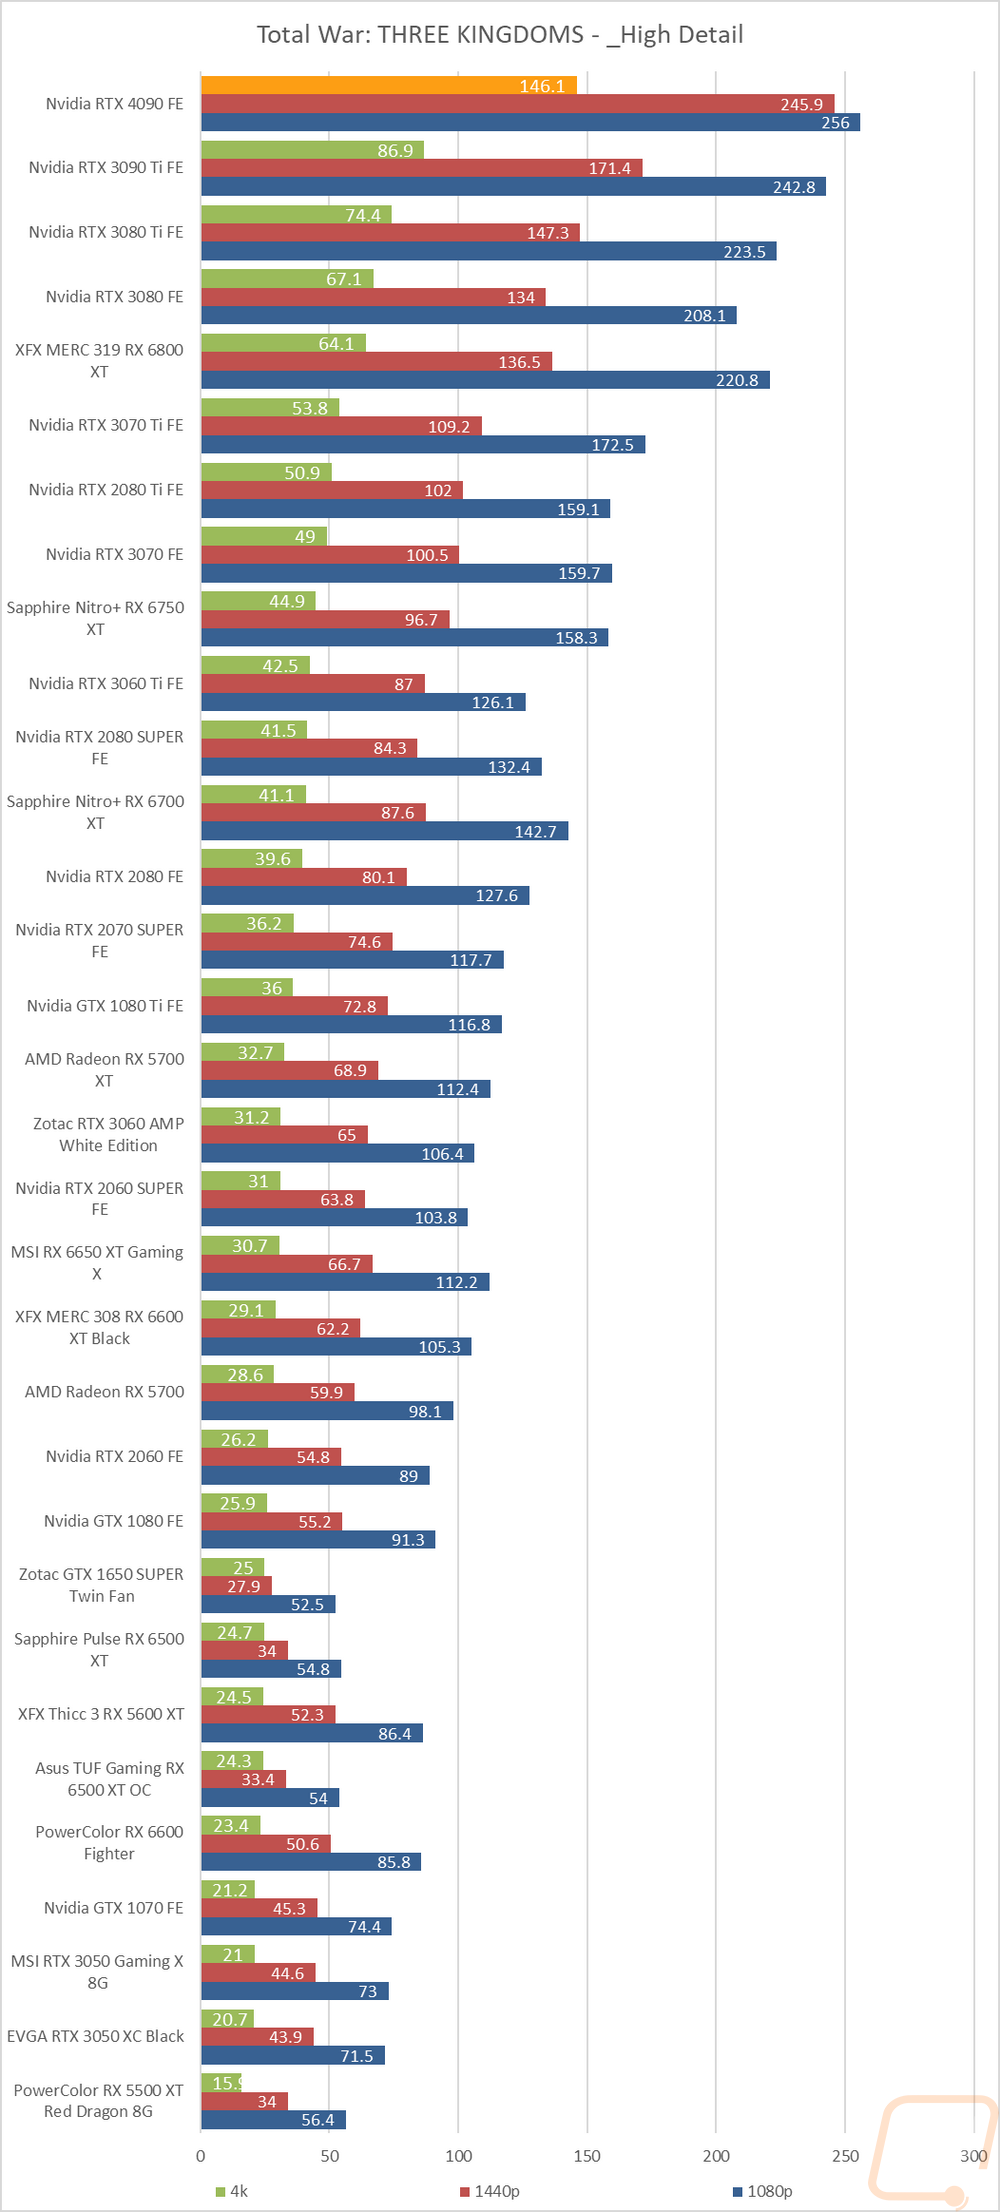
Total War: Three Kingdoms |
Built-in benchmark using the Battle Benchmark setting. Tested at 1080p, 1440p, and 4k at both high and ultra detail settings |
|
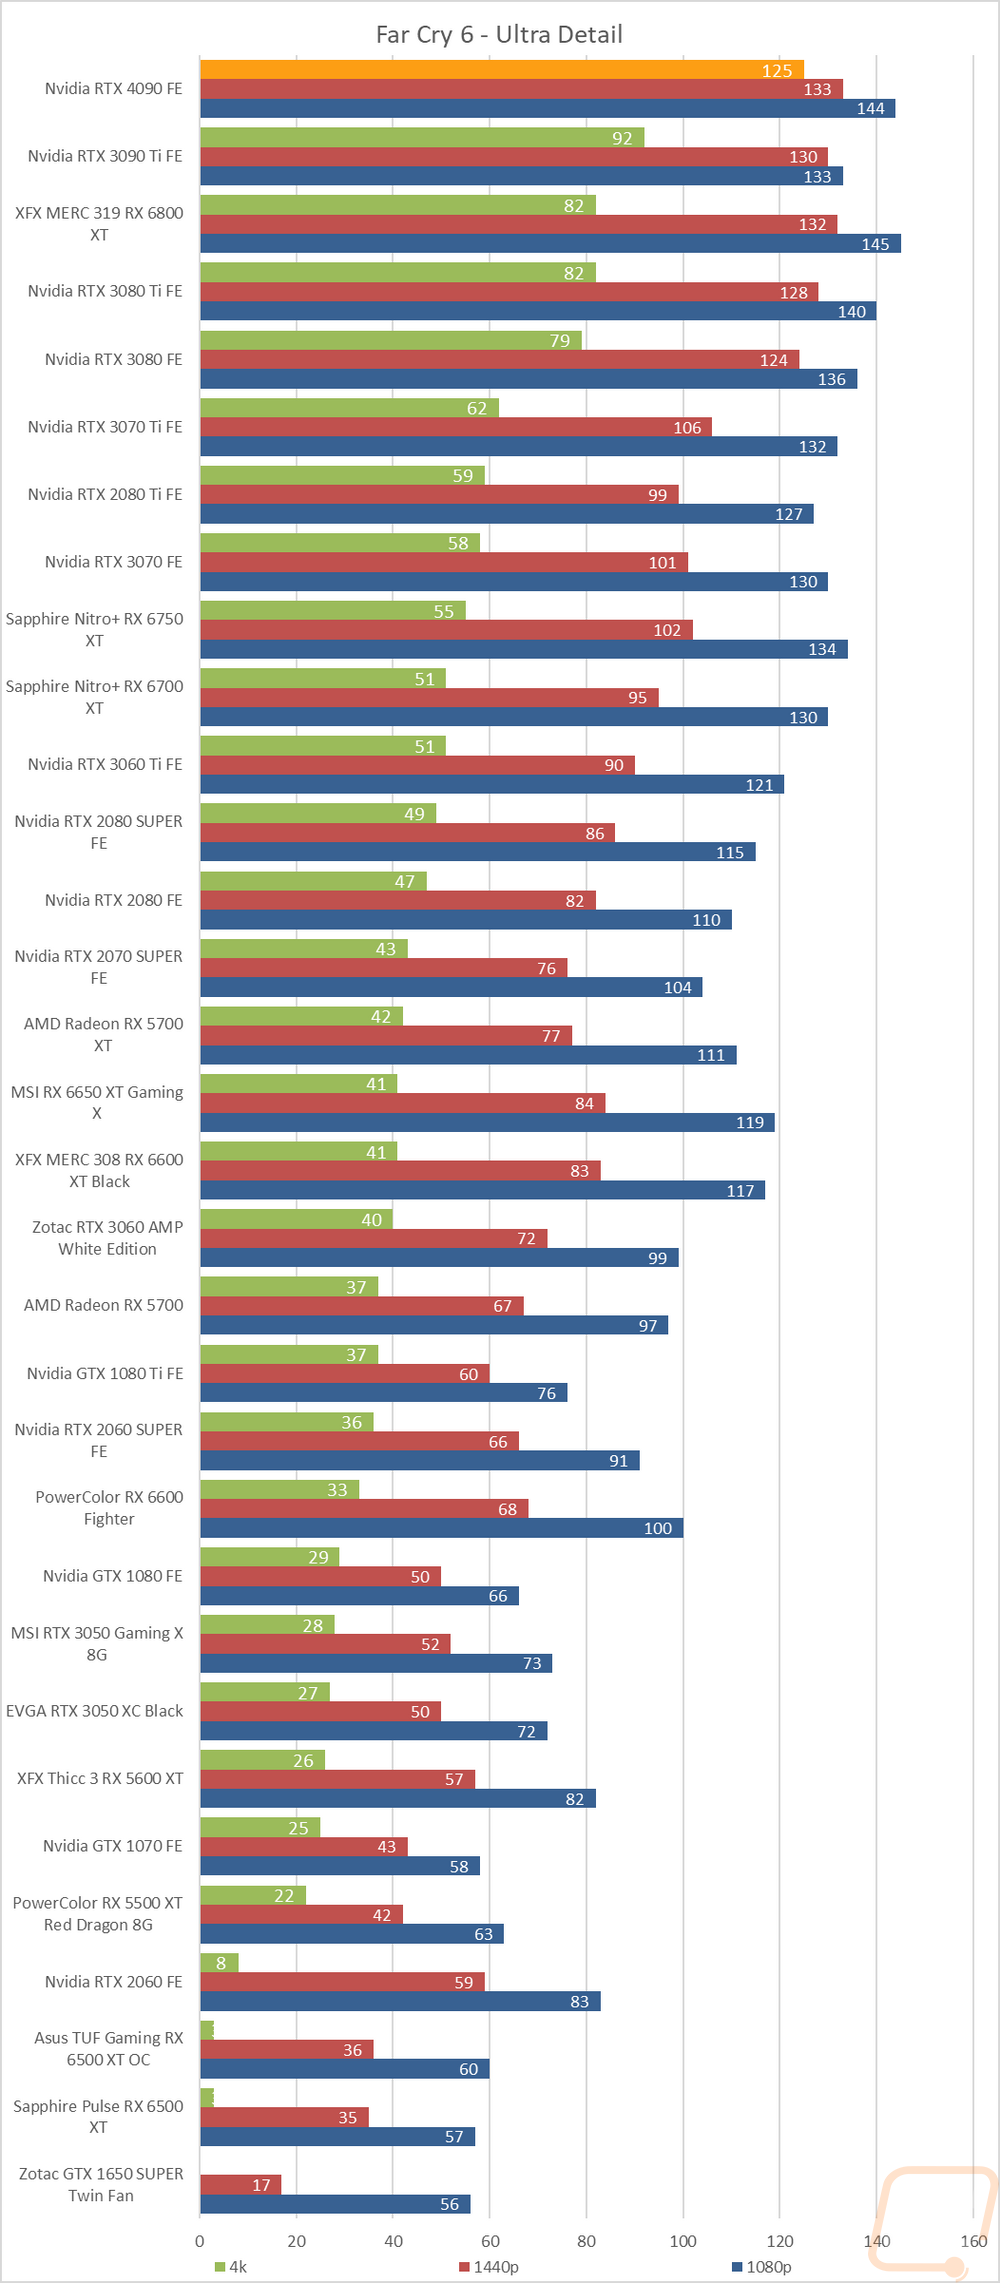
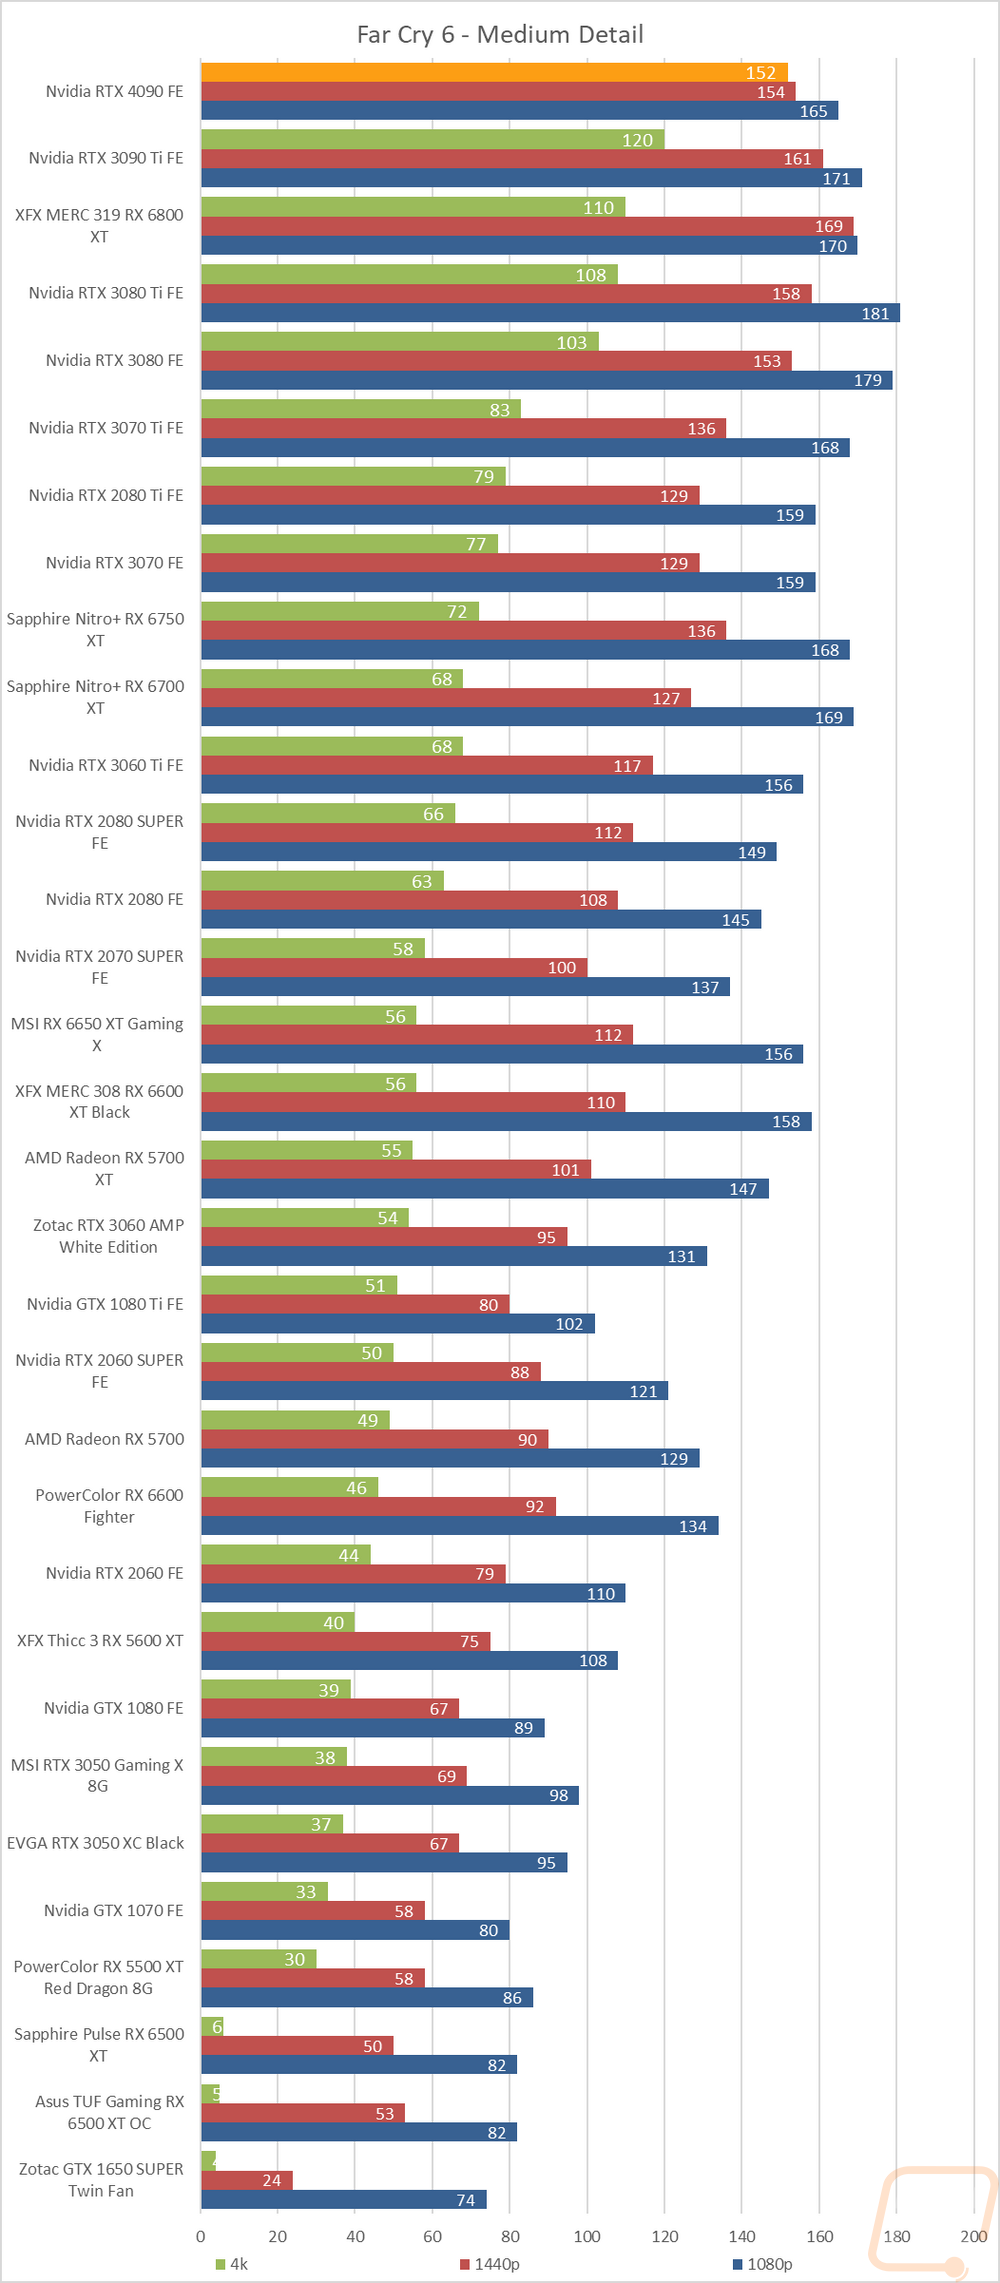
Far Cry 6 |
Built-in benchmark tested at 1080p, 1440p, and 4k with the Ultra and Medium detail settings |
|
V-Ray 5 |
V-Ray 5 benchmark us run with CUDA and RTX settings on cards that support it |
|
Boundary Benchmark |
Testing different DLSS detail levels on cards that support it. All testing is done at 4k with RTX on |
|
Bright Memory Infinite RTX Benchmark |
Benchmark all of the different RTX detail levels. Resolution at 4k and DLSS on balanced for each test |
|
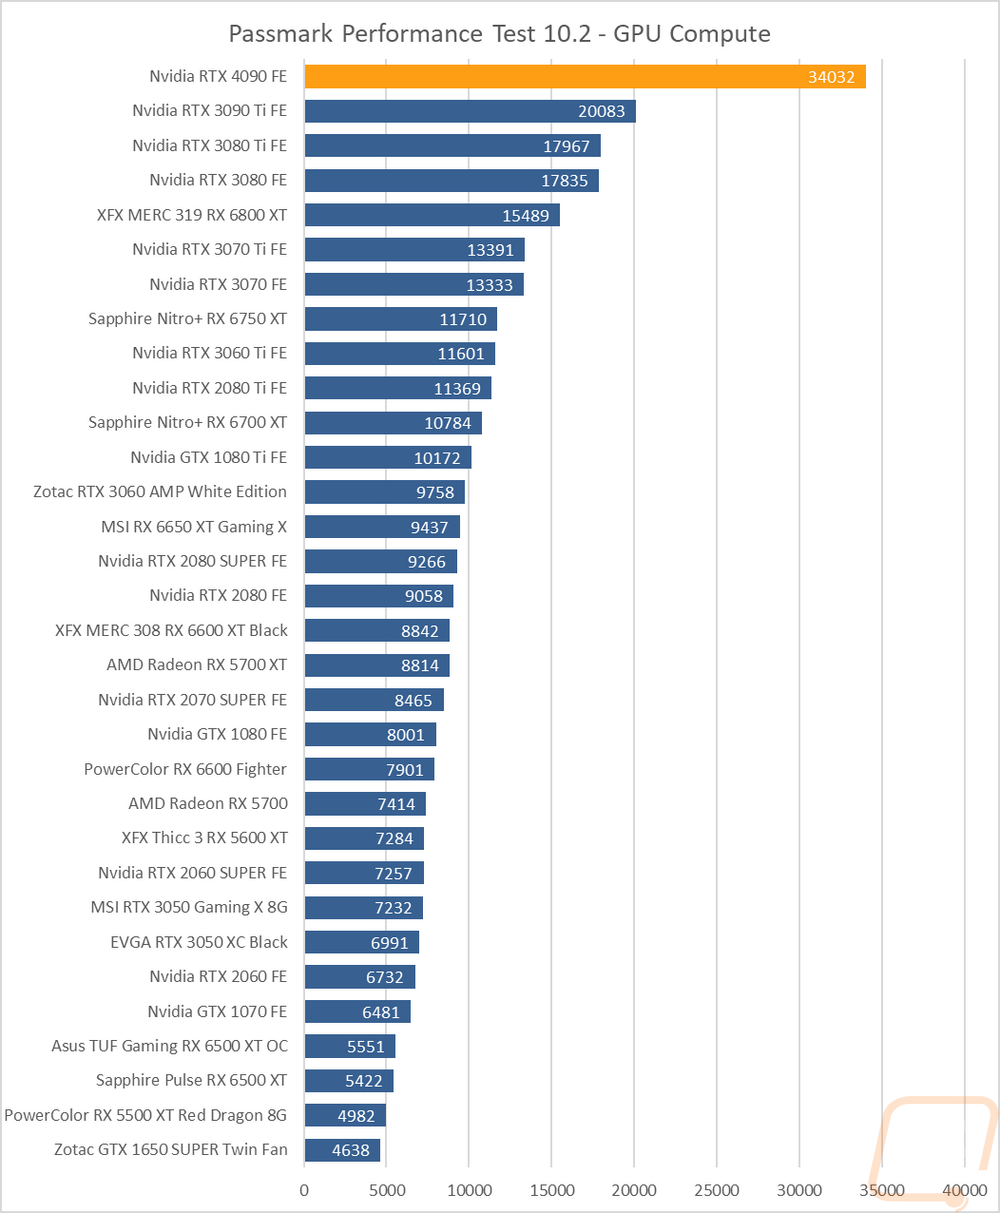
Passmark Performance Test 10.2 |
Test using the GPU Compute Score inside of Passmark’s Performance Test 10.2 |
|
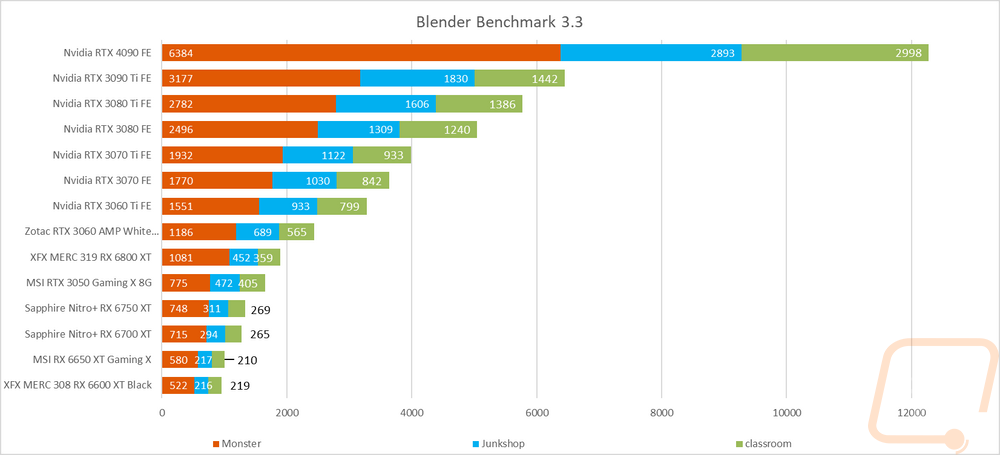
Blender |
Using the standard Blender Benchmark I run the test using the Blender 3.3 setting which tests using the Monster, Junkshop, and Classroom tests. |
|
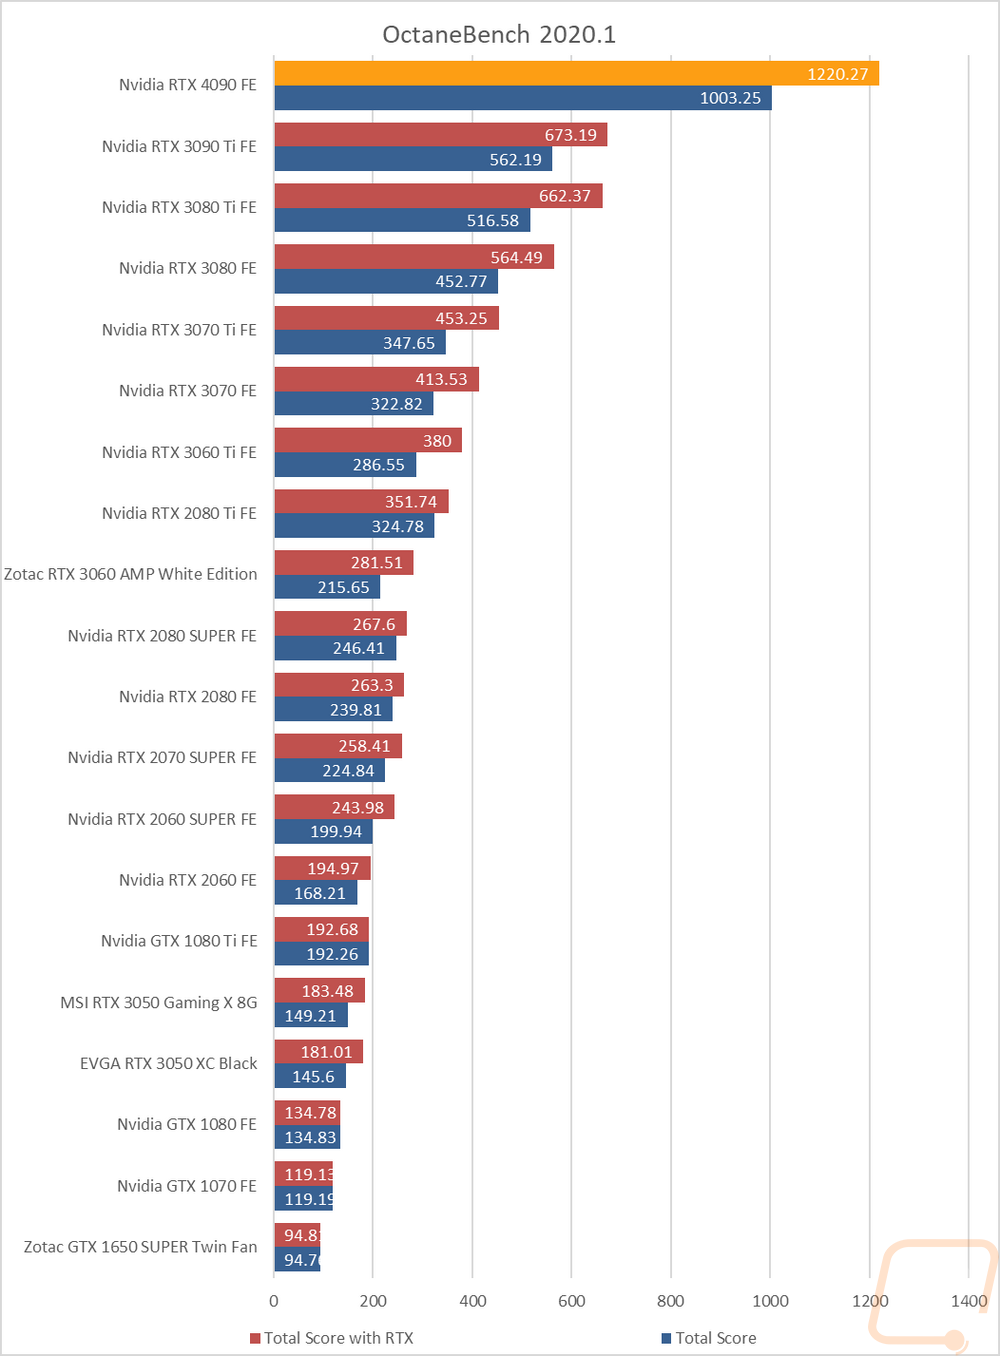
OctaneBench 2020.1 |
OctaneBench is designed to test rendering in OctaneRender. RTX and non-RTX are both ran. This is a CUDA-only test so only Nvidia cards are tested |
|
Power Testing |
I run three power tests. Two I use a Kill-A-Watt hooked up in line with the power cord for the test rig. Two tests are done, one using the AIDA64 Stress Test and the second using the 3DMark Time Spy benchmark on the second test. I also use GPUz to document the GPU only reading off the card itself for wattage when doing the Time Spy test. The Time Spy test uses only the second test here because the 3rd test is the combined test that loads the CPU as well. |
|
Noise Testing |
Our Noise testing is done using a decibel meter 18 inches away from the video card on the bottom/fan side of the card. We test at 50% and 100% fan speeds as well as a third test while under load using AIDA64's stress test. This is done using a Protmex PT02 Sound Meter that is rated IEC651 type 2 and ANSI S1.4 type 2. Tests are done set weighted to A and set to a slow response using the max function and tested a second time with C weighting as well. The ambient noise level in the testing area is 33.3 decibels using A weight and 50.0 using C weight. |
|
Temperature Testing |
Using AIDA64, the GPU stress test is run for 30 minutes or until the result has leveled off. The test is run twice, once with the stock fan profile and a second time with 100% fan speed. During this, I also document the 100% fan speed RPM and document the delta between the fan profile and 100% fan speed as well. |
Synthetic Benchmarks
As always I like to start my testing with a few synthetic benchmarks. 3DMark especially is one of my favorites because it is very optimized in both Nvidia and AMD drivers. It's nice to not have to worry about it being favored too much either way and the repeatability of the results makes it a nice chance to compare from card to card, especially when comparing with the same GPU.
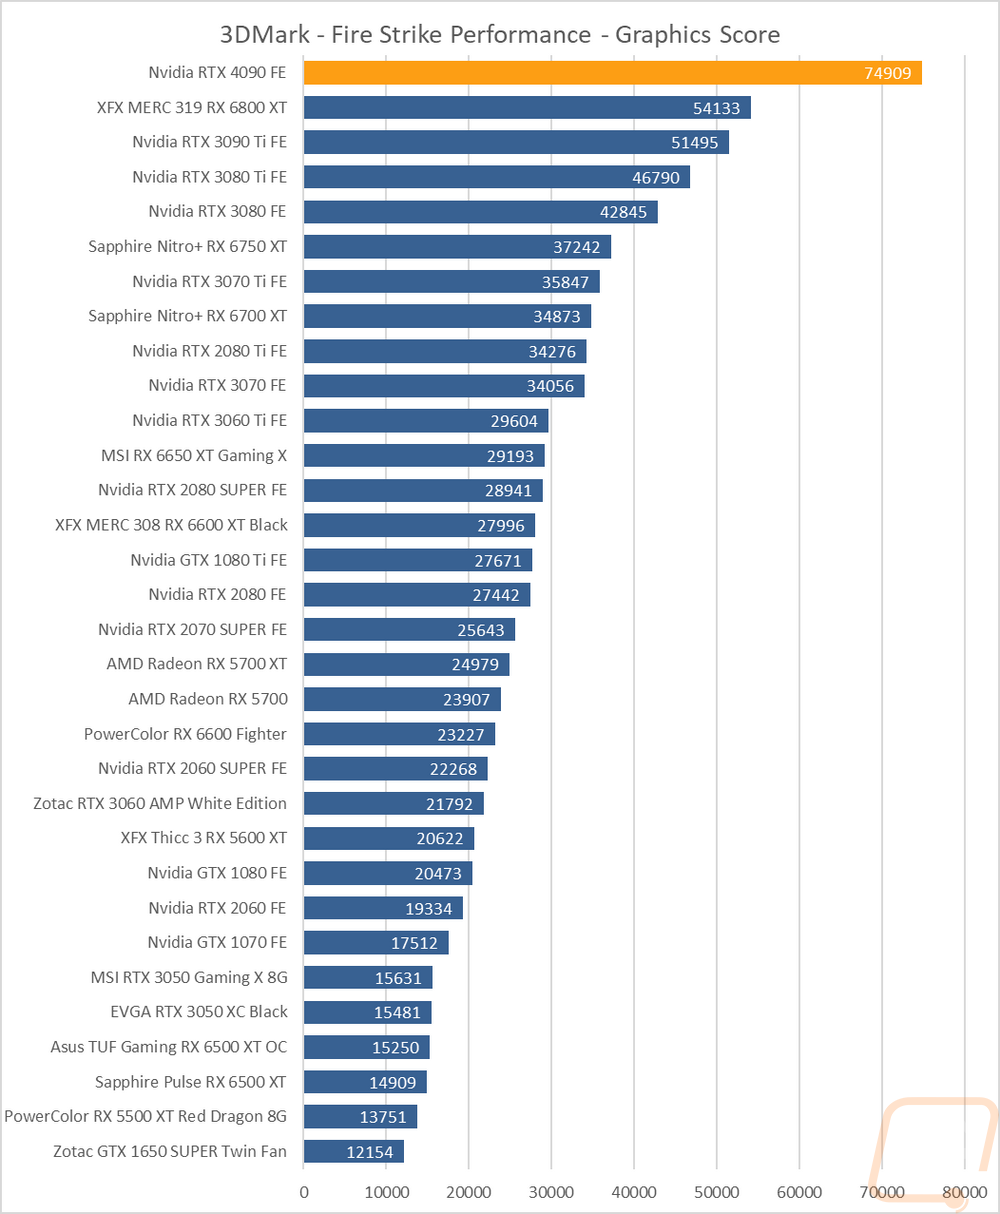
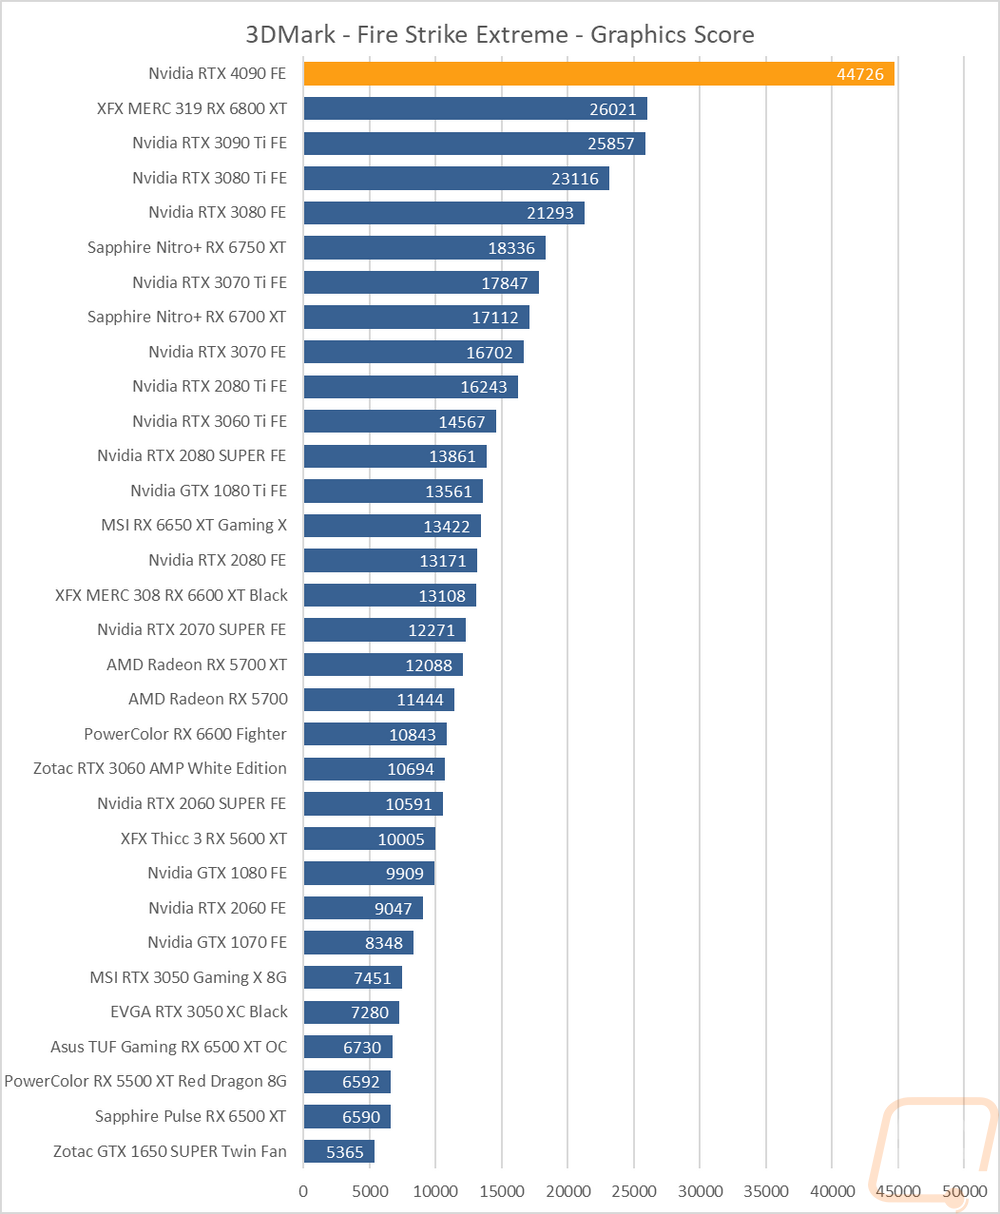
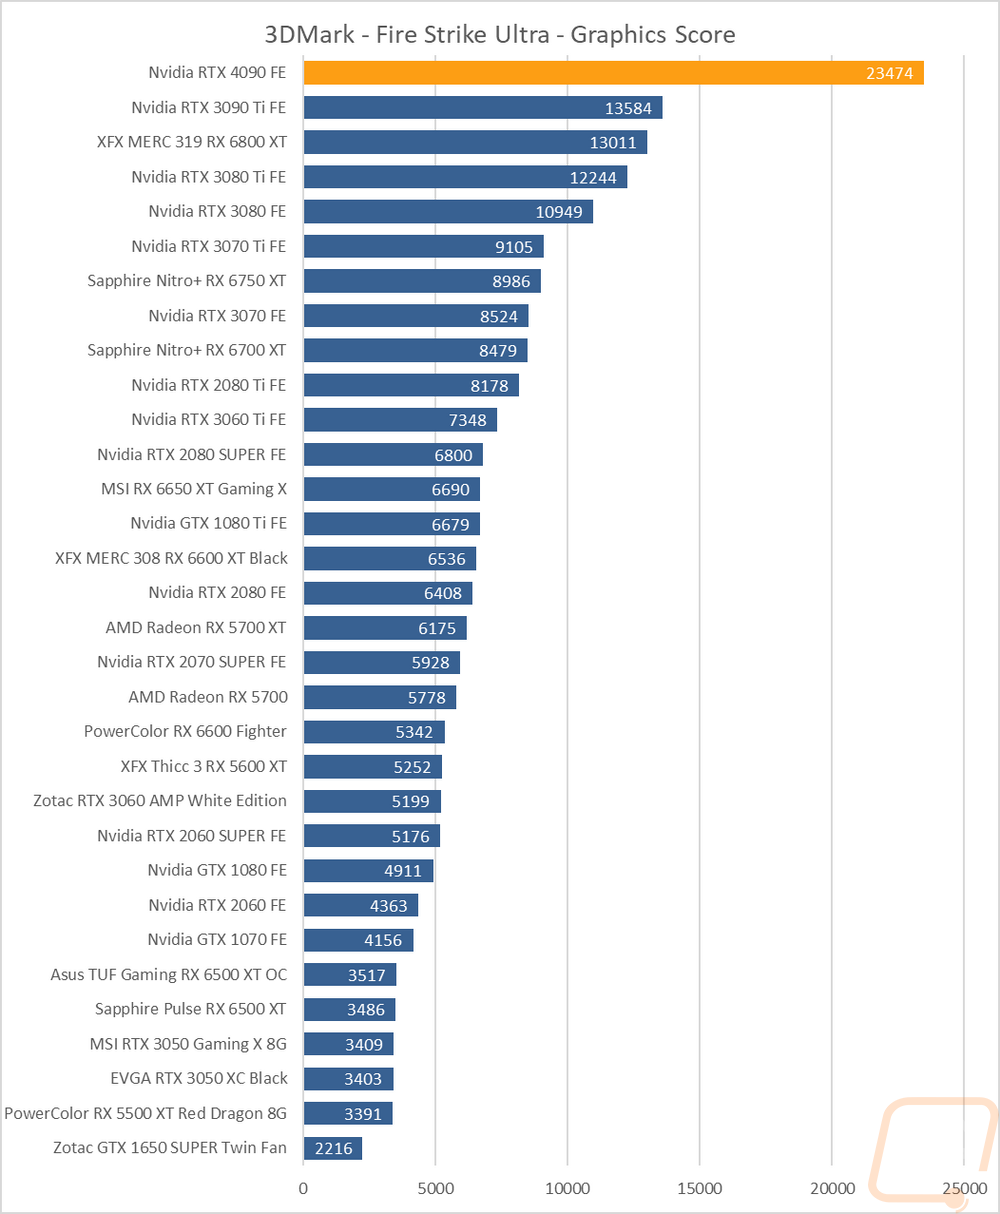
The first round of tests were done in the older Fire Strike benchmark which is a DX11 test. There are three detail levels, performance, extreme, and ultra. The RTX 4090 Founders Edition jumps out in front in all three of these tests but I should note that while our coverage includes most modern cards including an RTX 3090 Ti that Nvidia was nice enough to send over to fill in that gap in our numbers but on the AMD side we don’t have a Radeon 6900XT/6950XT which at least in this test given where the 6800XT performs would fill in that gap The 6950 XT would be in the 61500 range for an overclocked card, the 6900 XT would be in the 5600 range in base Fire Strike the RTX 4090 Founders Edition is still well above that though at 74909. The gap gets even larger in the extreme and ultra tests where the RTX 4090 Founders Edition can utilize its 24GB of GDDR6X VRAM and memory bandwidth with it scoring a 44726 which is still 73% ahead of the RTX 3090 Ti which in itself is mind-blowing. The same is seen in Fire Strike Ultra as well and for that test the 6950XT if we had one would be around 15000, nowhere near the 23474 of the RTX 4090.
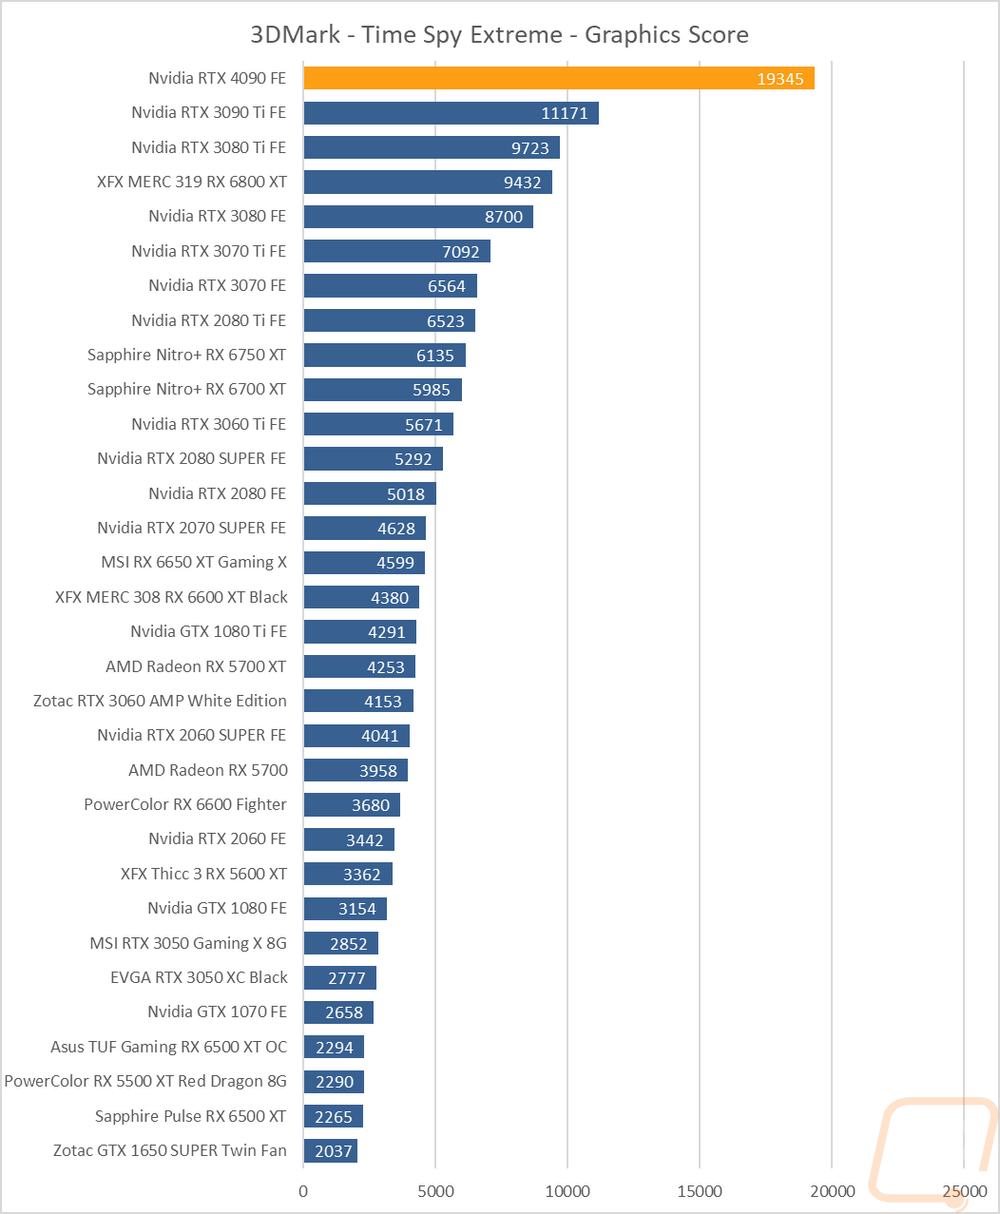
The next two were both based on the Time Spy benchmark. One is the standard test and then there is the extreme detail level. The RTX 4090 Founders Edition has an even bigger margin above everything tested here with its 88% jump over the RTX 3080 Ti and 67% over the RTX 3090 Ti. To fill in the gaps with the 6900XT/6950XT those would be in the 19900/21900 range for the base Time Spy test which is nowhere near the 35707 for the RTX 4090 Founders Edition. In the Time Spy Extreme test the 3090 Ti was way out ahead of the 3080 Ti with its 11171 but is dwarfed by the RTX 4090 at 19345 which is a 73% improvement.

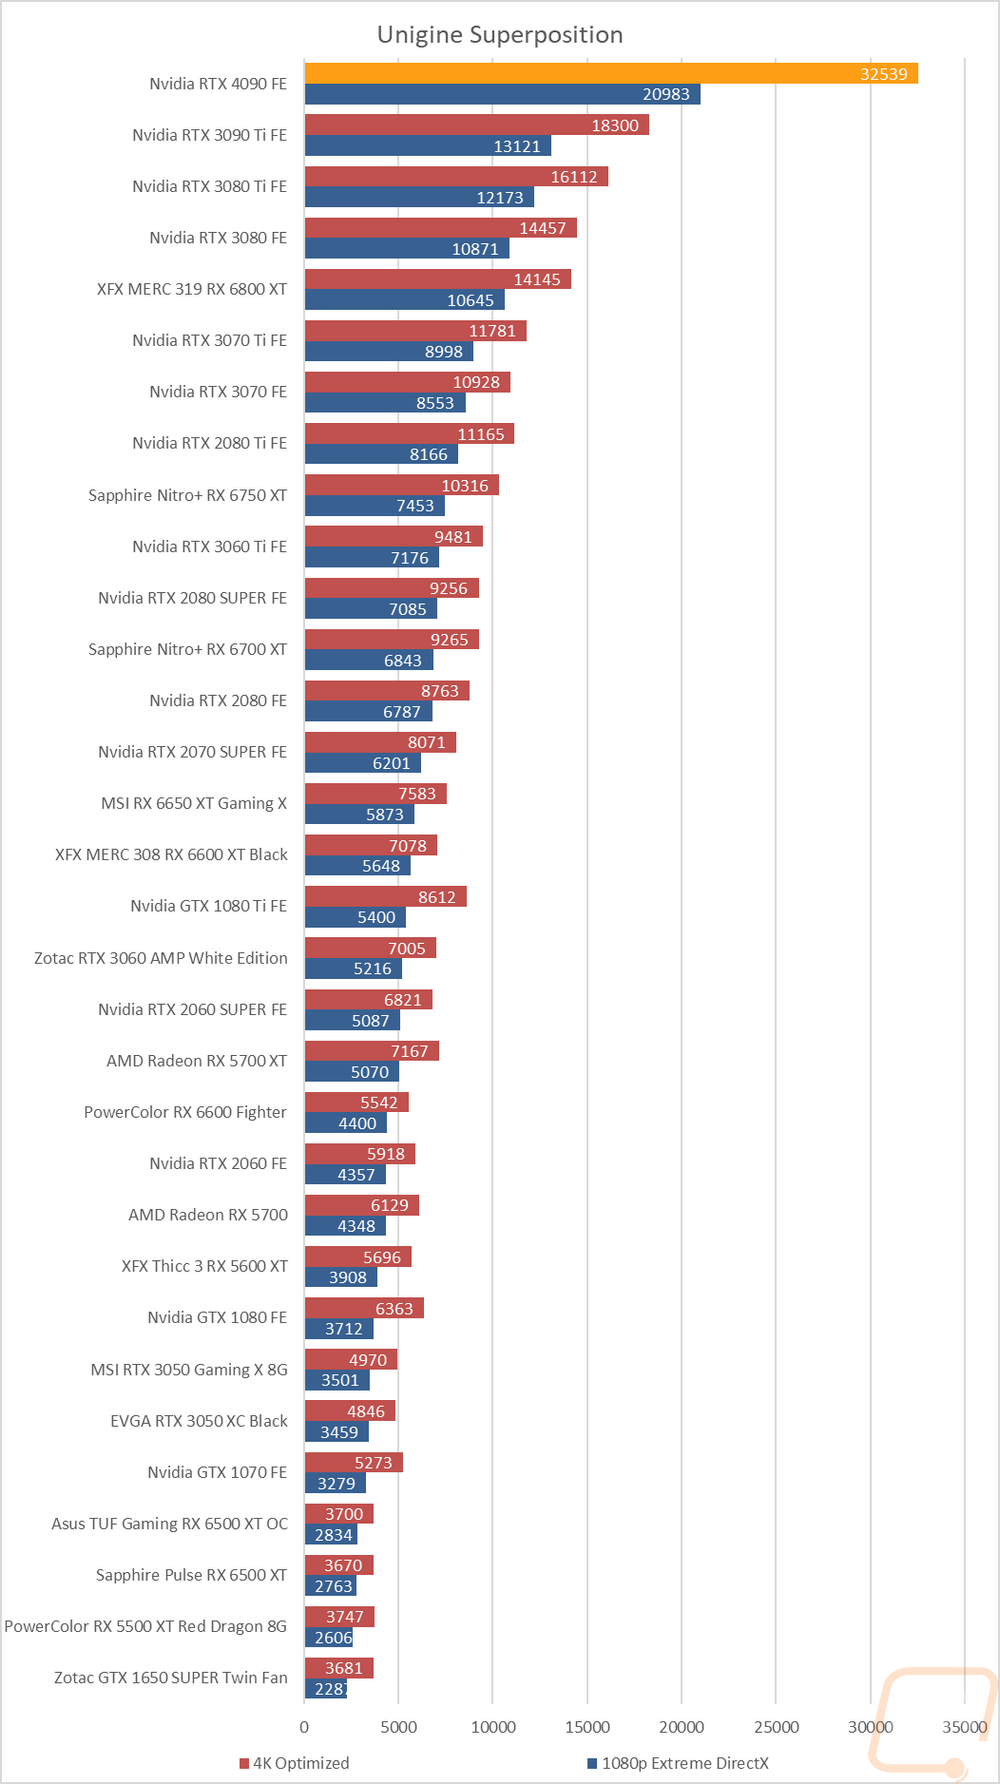
The last test was using the Unigine-based Superposition benchmark and I tested at 1080p with the extreme detail setting as well as the 4K optimized setting. In the extreme detail setting the RTX 4090, Founders Edition is over double the score of the RTX 3080 Ti and in the 4k optimized result, the gap is smaller at “just” 72%. Even the RTX 3090 Ti with its 18300 and 13121 scores couldn’t come close.
VR Benchmarks
As for Virtual Reality, I love it but it is more demanding than traditional gaming. This is partially because of the resolutions needed to render for two eyes and because they render more than what is immediately visible. But also because of post effects to get the proper “fisheye” effect for it to look proper in your eyes with the HMD. You also have to have much higher expectations for frame rates in VR, skipping frames or lower FPS can cause motion sickness in VR. Because of that, I ran a few tests.
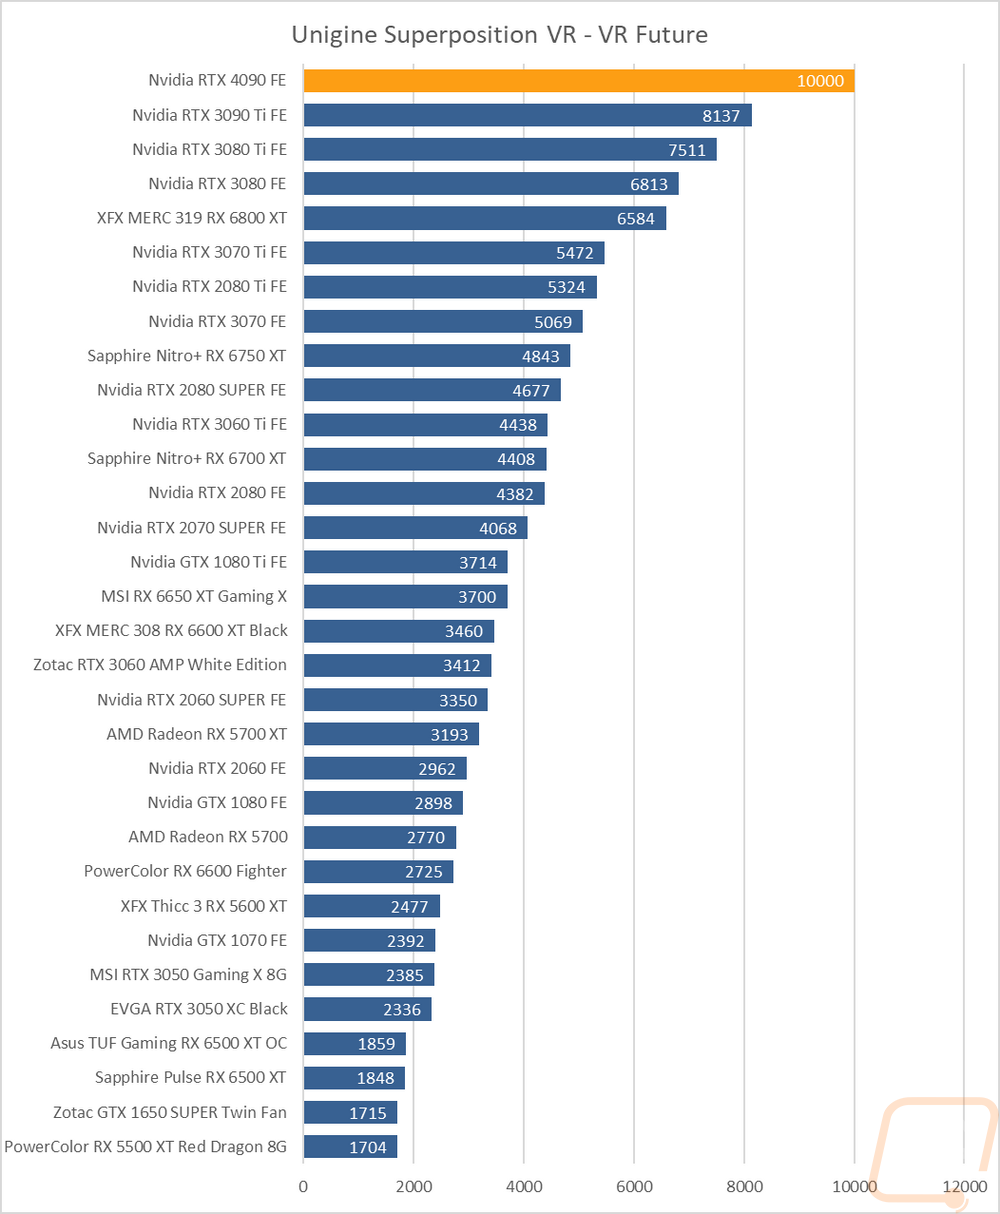
My first test was again in Superposition. This time I tested the VR Future test using the Oculus resolution. Here the RTX 4090 Founders Edition is up at the top but the gap here is a lot smaller than we saw in the base superposition tests. The big thing to note here is that with a score of 10000 the RTX 4090 maxed out this test so we don’t even know how much higher it could have scored but the smaller gap between it and the RTX 3090 Ti indicates it most likely would have been a lot more still.
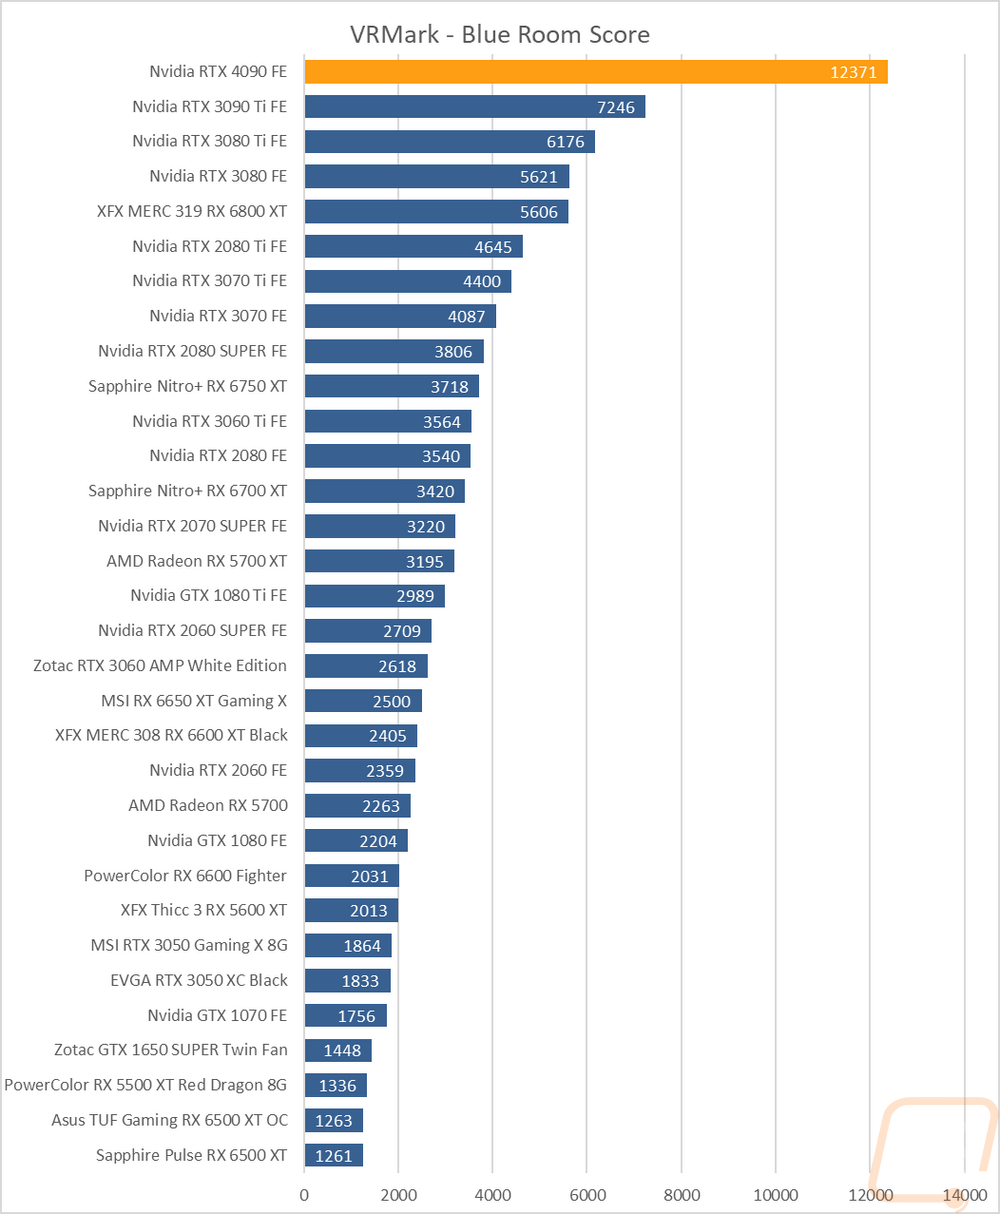
My second round of VR testing was in VRMark which has three tests that are similar to the VR tests in Superposition. I only focused on just the most demanding test called Blue Room which is looking more at future VR performance. The RTX 4090 Founders Edition did better here with it scoring twice as many points compared to the 3080 Ti and is 5125 points ahead of the RTX 3090 Ti.
In-Game Benchmarks
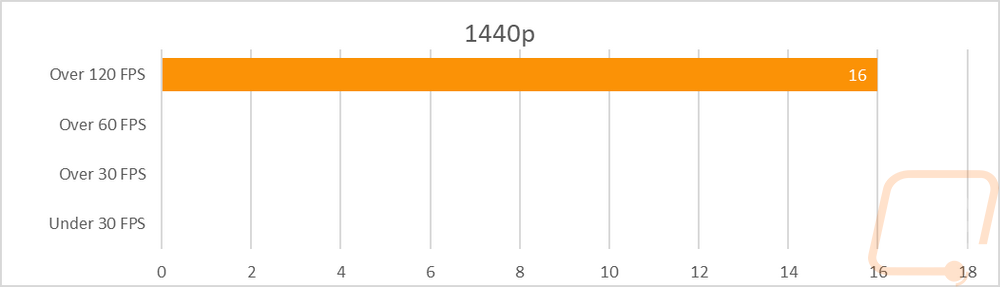
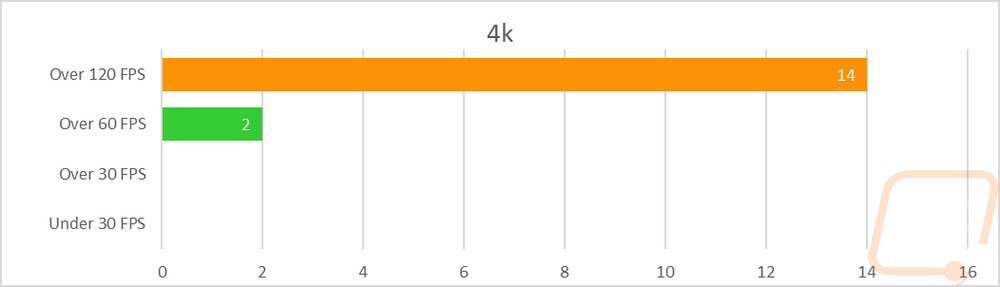
Now we finally get into the in game performance and that is the main reason people pick up a new video card. To test things out I ran through our new benchmark suite that tests 10 games at three different resolutions (1080p, 1440p, and 4k). Most of the games tested have been run at the highest detail setting and a mid-range detail setting to get a look at how turning things up hurts performance and to give an idea of if turning detail down from max will be beneficial for frame rates. In total, each video card is tested 54 times and that makes for a huge mess of results when you put them all together. To help with that I like to start with these overall playability graphs that take all of the results and give an easier-to-read result. I have one for each of the three resolutions and each is broken up into four FPS ranges. Under 30 FPS is considered unplayable, over 30 is playable but not ideal, over 60 is the sweet spot, and then over 120 FPS is for high refresh rate monitors.
So how did the RTX 4090 Founders Edition do when we step back and look at our in game tests as a whole? Well, 1080p and 1440p testing for all of our results have everything in the 120+ FPS range and I’m being fair to say that we could easily have another category over 200 FPS as well with half of the results at both resolutions at or above that point. Really it is only at 4k do we see anything other than full 120+ results with 4k having two results in the 60-119 FPS range.

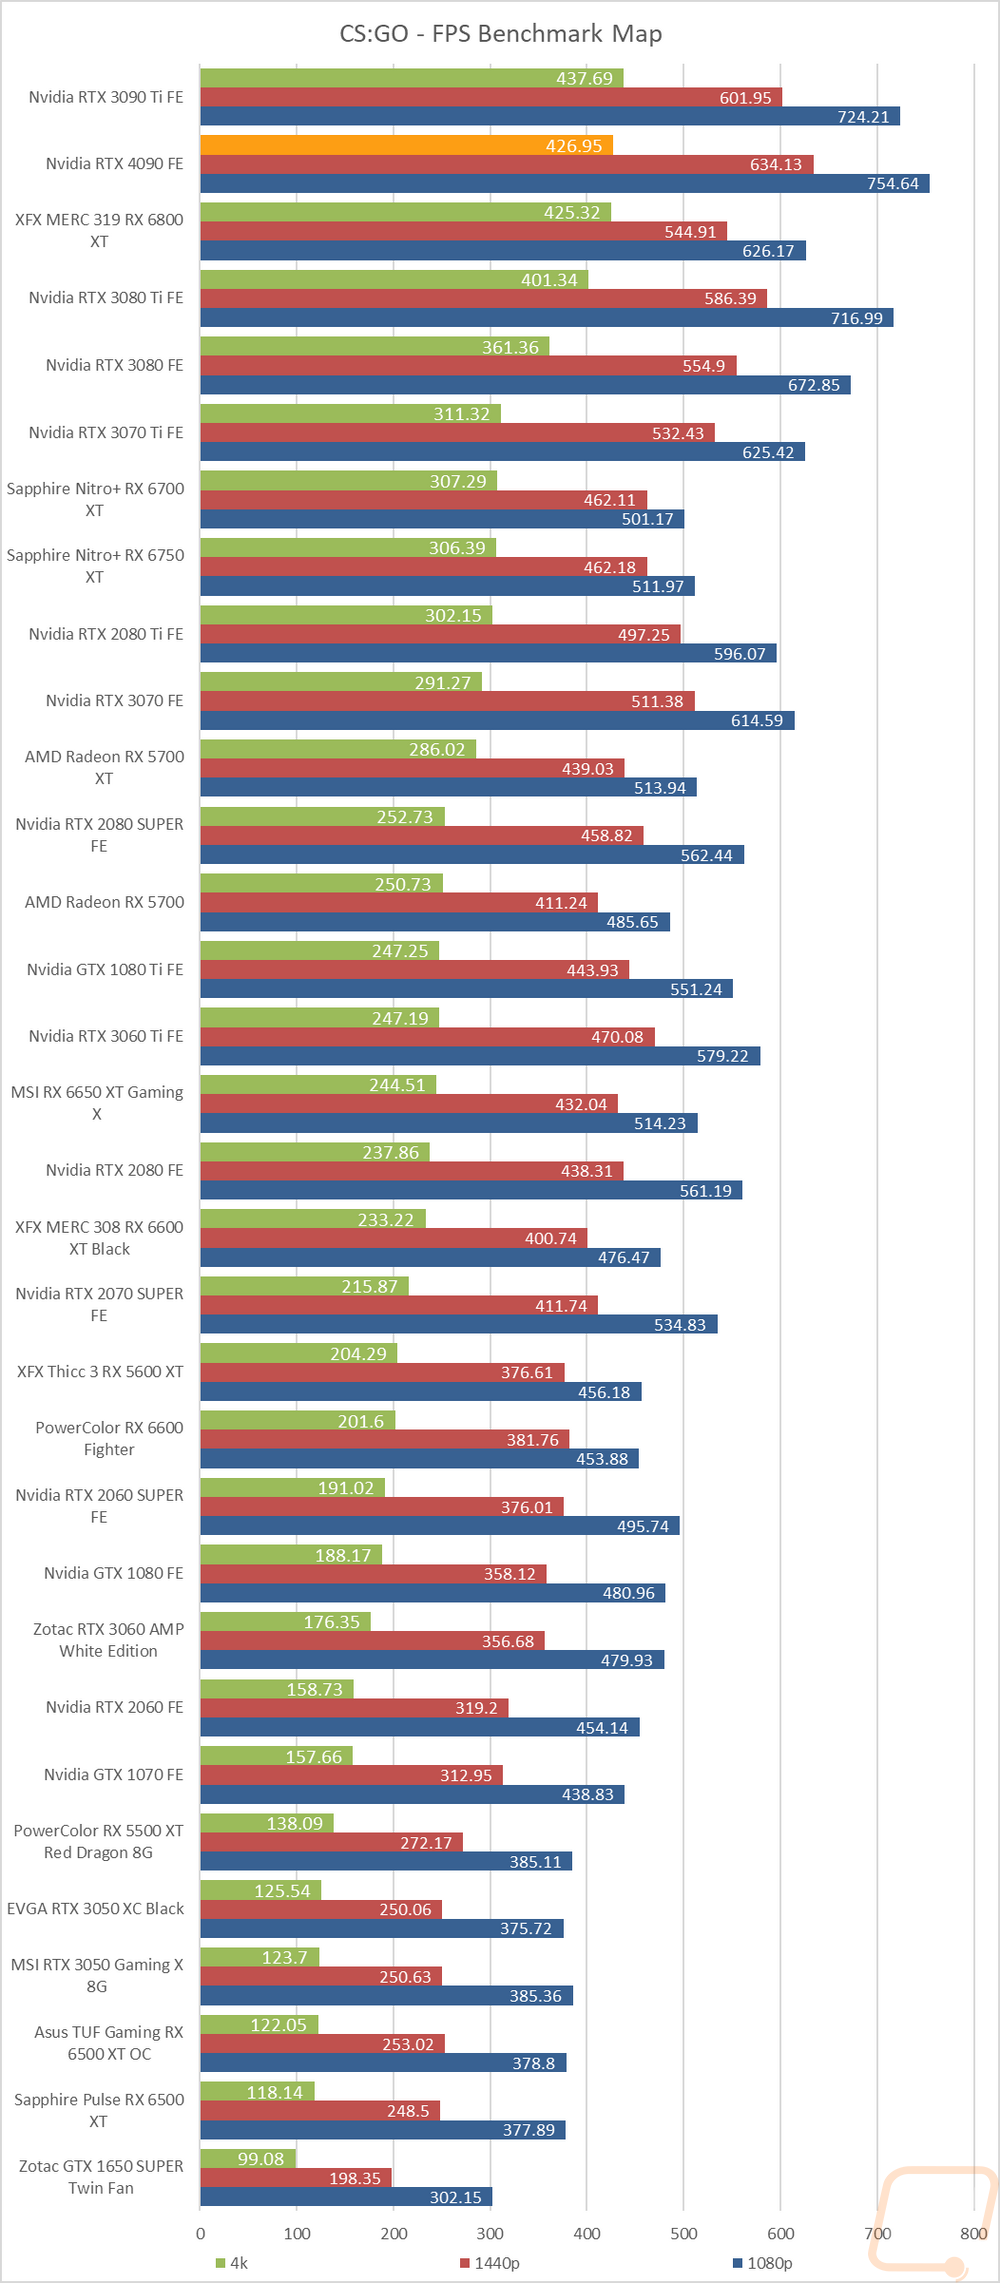
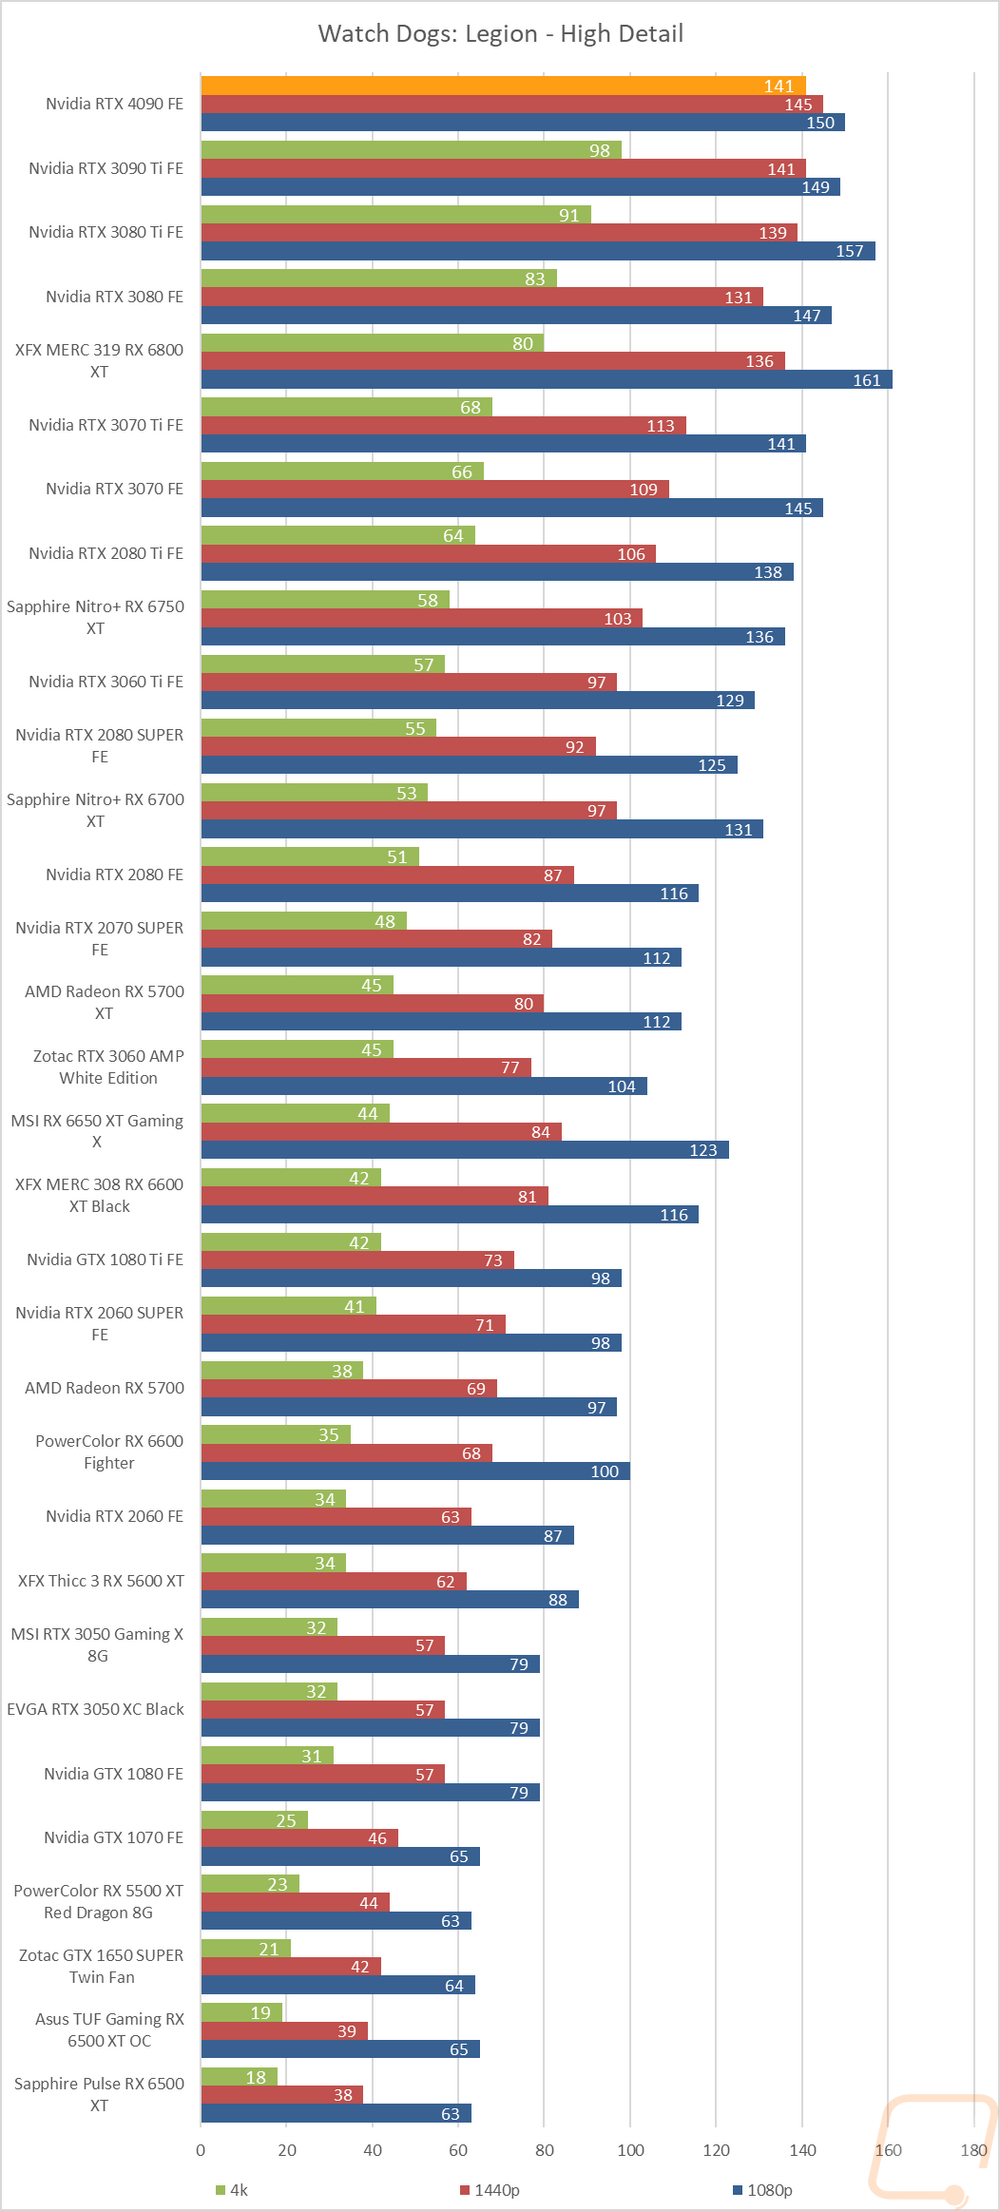
Of course, I have all of the actual in game results as well for anyone who wants to sort through the wall of graphs below. The RTX 4090 results can only be viewed at 4K, both 1080p and 1440p results in nearly every test just show that even with an Intel i9-12900 K-based test bench we are CPU limited at 1080p and 1440p in basically every test. The same goes for 4k in some situations as well. There are a few results though where the 4090 at 1080p/1440p was a little slower than the 3080 Ti and the 3090 Ti which might be a driver issue. That is most noticeable in CS:GO where the 3090 Ti came in slightly faster at 4K as well with even 4K being CPU limited once we get past the 3080 Ti at 4K. But looking at the 4K results the RTX 4090 in just about every game is getting the same or better frame rate when playing at 4K than the RTX 3090 Ti and the RTX 3080 Ti at 1440p which is an impressive jump in performance, especially over the 3090 Ti which is a monster of a card in itself.
The performance gap between them is incredible. If we take the CS:GO results out because of the CPU-limited results across the board there below is what we have. The RTX 4090 is faster at 4K than the RTX 3090 Ti and RTX 3080 Ti are at 1440p. We can also see that on average in our in-game tests the RTX 4090 is 49% faster than the RTX 3090 Ti and 65% faster than the RTX 3080 Ti. With everything below 4K being CPU limited the possibility of DLSS 3 being able to double performance in those situations makes that an interesting thought and I will check out DLSS 3 more here soon as well.
|
|
1440p Average FPS (without CS:GO) |
4K Average FPS (without CS:GO) |
|
RTX 4090 |
195 |
158 |
|
RTX 3090 Ti |
153 |
106 |
|
RTX 3080 Ti |
151 |
96 |
Compute Benchmarks
Now some people don’t need a video card for gaming, they need the processing power for rendering or 2D/3D production, or in some cases people who game also do work on the side. So it is also important to check out the compute performance on all of the video cards that come in. That includes doing a few different tests. My first test was a simple GPU Compute benchmark using Passmark’s Performance Test 10 and no surprise here but the RTX 4090 blew away everything else tested by a huge margin. The 3080 Ti and 3080 are the next closest cards tested because we don’t have the last generation's RTX 3090 or the 6900 XT to test. But even without those, the 4090 is nearly twice as fast as the 3080 and 3080 Ti and three times as fast as the 2080 Ti which was the top dog just a few years ago. Even with the newly added RTX 3090 Ti in the mix, it doesn’t fill the gap.
Blender is always my favorite compute benchmark because the open-source 3D rendering software is very popular and it isn’t a synthetic benchmark. With the latest version of Blender, they redid the benchmark so we now have a new test that runs three different renderings and gives each a score. I have all three stacked together so we can see the overall performance. The 4090 dwarfs all of the other cards tested here with just its score in the first test being higher than the 3080 Ti’s combined results and nearly to the combined results of the RTX 3090 Ti. If anything I should be upset that the 4090 made it impossible to see the results for all of the cards at the bottom of this chart.
For CUDA-based cards, I also check out OctaneRender performance using their OctaneBench 2060.1 benchmark which allows me to check out both RTX and non-RTX rendering performance. Here the RTX 4090 Founders Edition is at the top once again with an 84% jump between it and the RTX 3080 Ti and 78% between it and the RTX 3090 Ti.
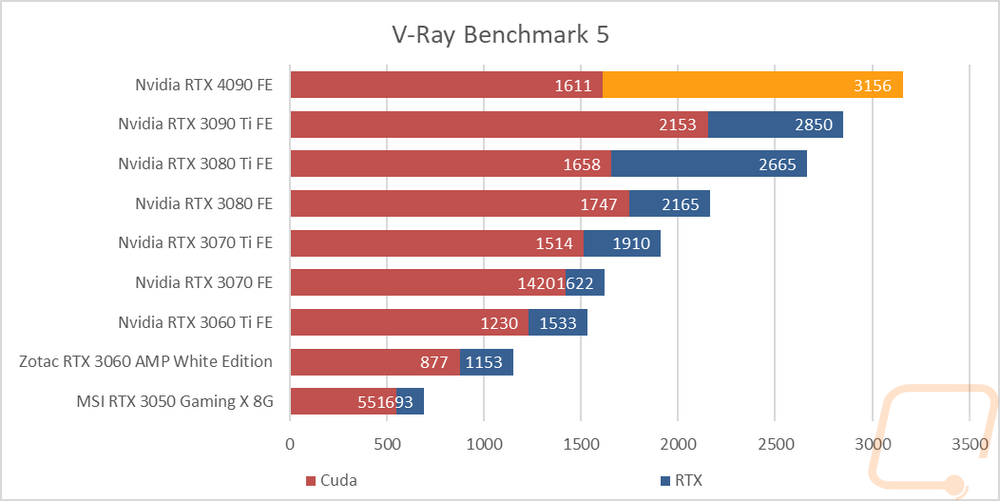
An additional CUDA-based test that I wanted to run the RTX 4090 Founders Edition and other Nvidia cards through is V-Ray Benchmark 5. I ran this with the Cuda test and again with RTX. Surprisingly the 4090 didn’t top the chart here in the CUDA test but it did with the RTX-based test.
RTX and DLSS
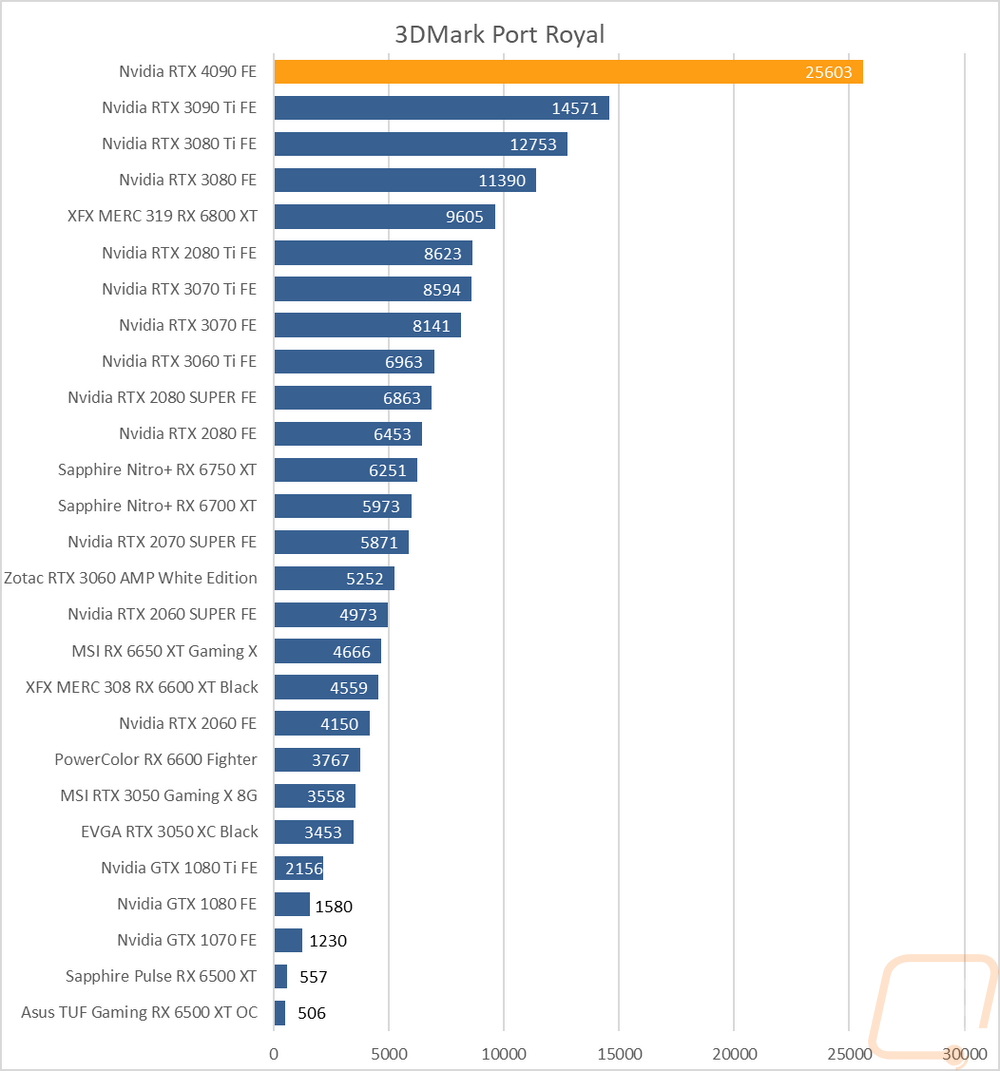
Being an RTX card I also like checking out the performance of some of Nvidia’s features. Namely the ray tracing performance and the performance improvements you can see by using DLSS combined with the tensor cores. My first test goes back to our synthetic benchmarks with 3DMark where I check out their Port Royal benchmark. This is the one test that does also have AMD Ray Tracing support which is great to get a look at how different cards including older non-RTX cards perform. The RTX 4090 Founders Edition did almost exactly double what the RTX 3080 Ti did in this same test showing just how good the 128 new gen 3 RT cores can perform, the RTX 3090 Ti stands out from the 3080 Ti but that isn’t enough to even make a dent in the RTX 4090’s lead.
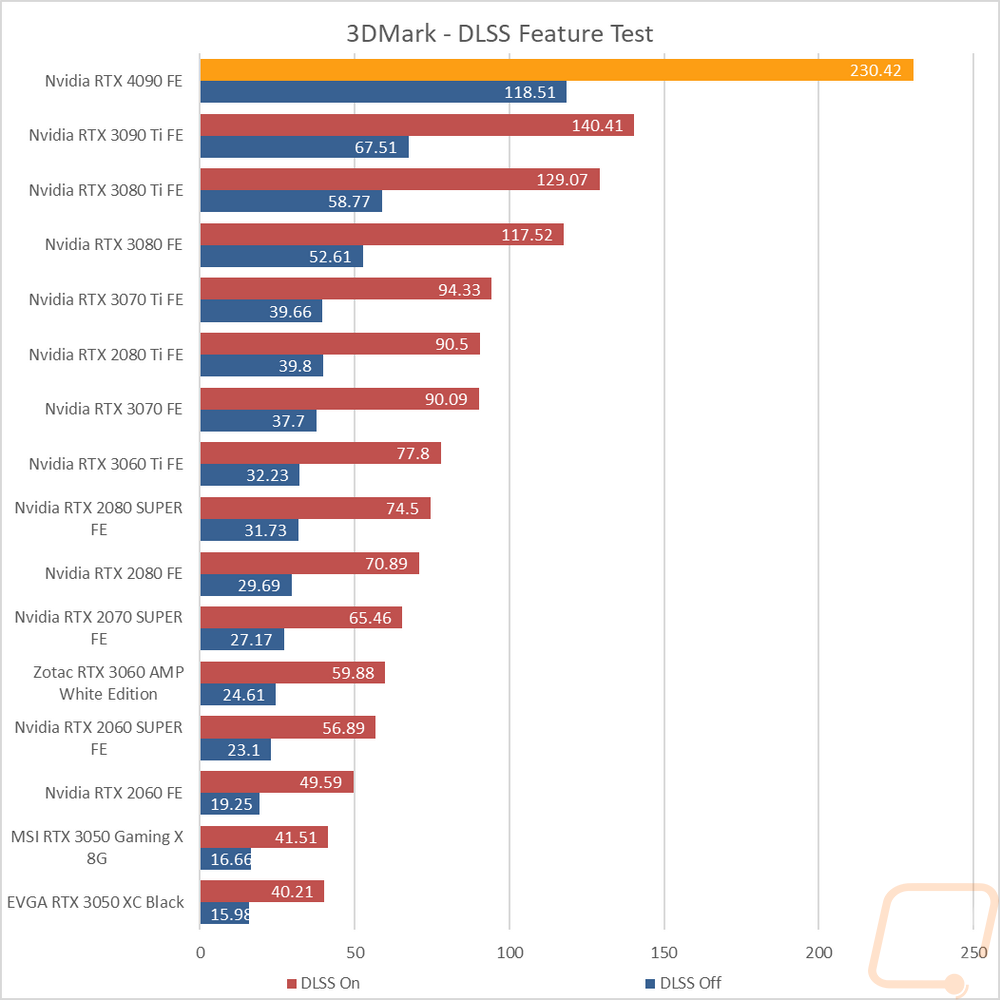
3DMark also has added in a few feature tests, one being a look at DLSS performance. For this one, I have the resolution set to 1440p and DLSS 2.0 turned on. I then have run the test on every card supported to get a comparison of how their test performs with and without DLSS. The RTX 4090 Founders Edition dominated here as well with the DLSS on result sitting at 78% over the 3080 Ti and 64% over the RTX 3090 Ti. More importantly, the RTX 4090 Founders Edition improved the result by 94% from DLSS off to DLSS on.
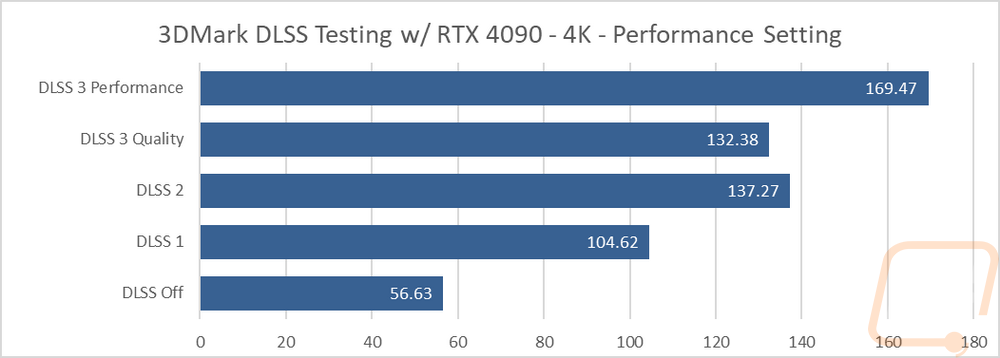
While in 3DMark I did get the chance to test out an unreleased copy which has added DLSS 3 into the mix. With that I did a few tests with the RTX 4090 Founders Edition testing DLSS 1, 2, and 3 as well as DLSS 3 with both performance and quality settings. These were all run at 4k with the performance setting for DLSS 2. It is interesting to see how the base FPS is 56.63 and running DLSS 3 on the performance setting was three times as fast. Even DLSS 3 on the quality setting was sitting right with DLSS 2 on the performance setting.
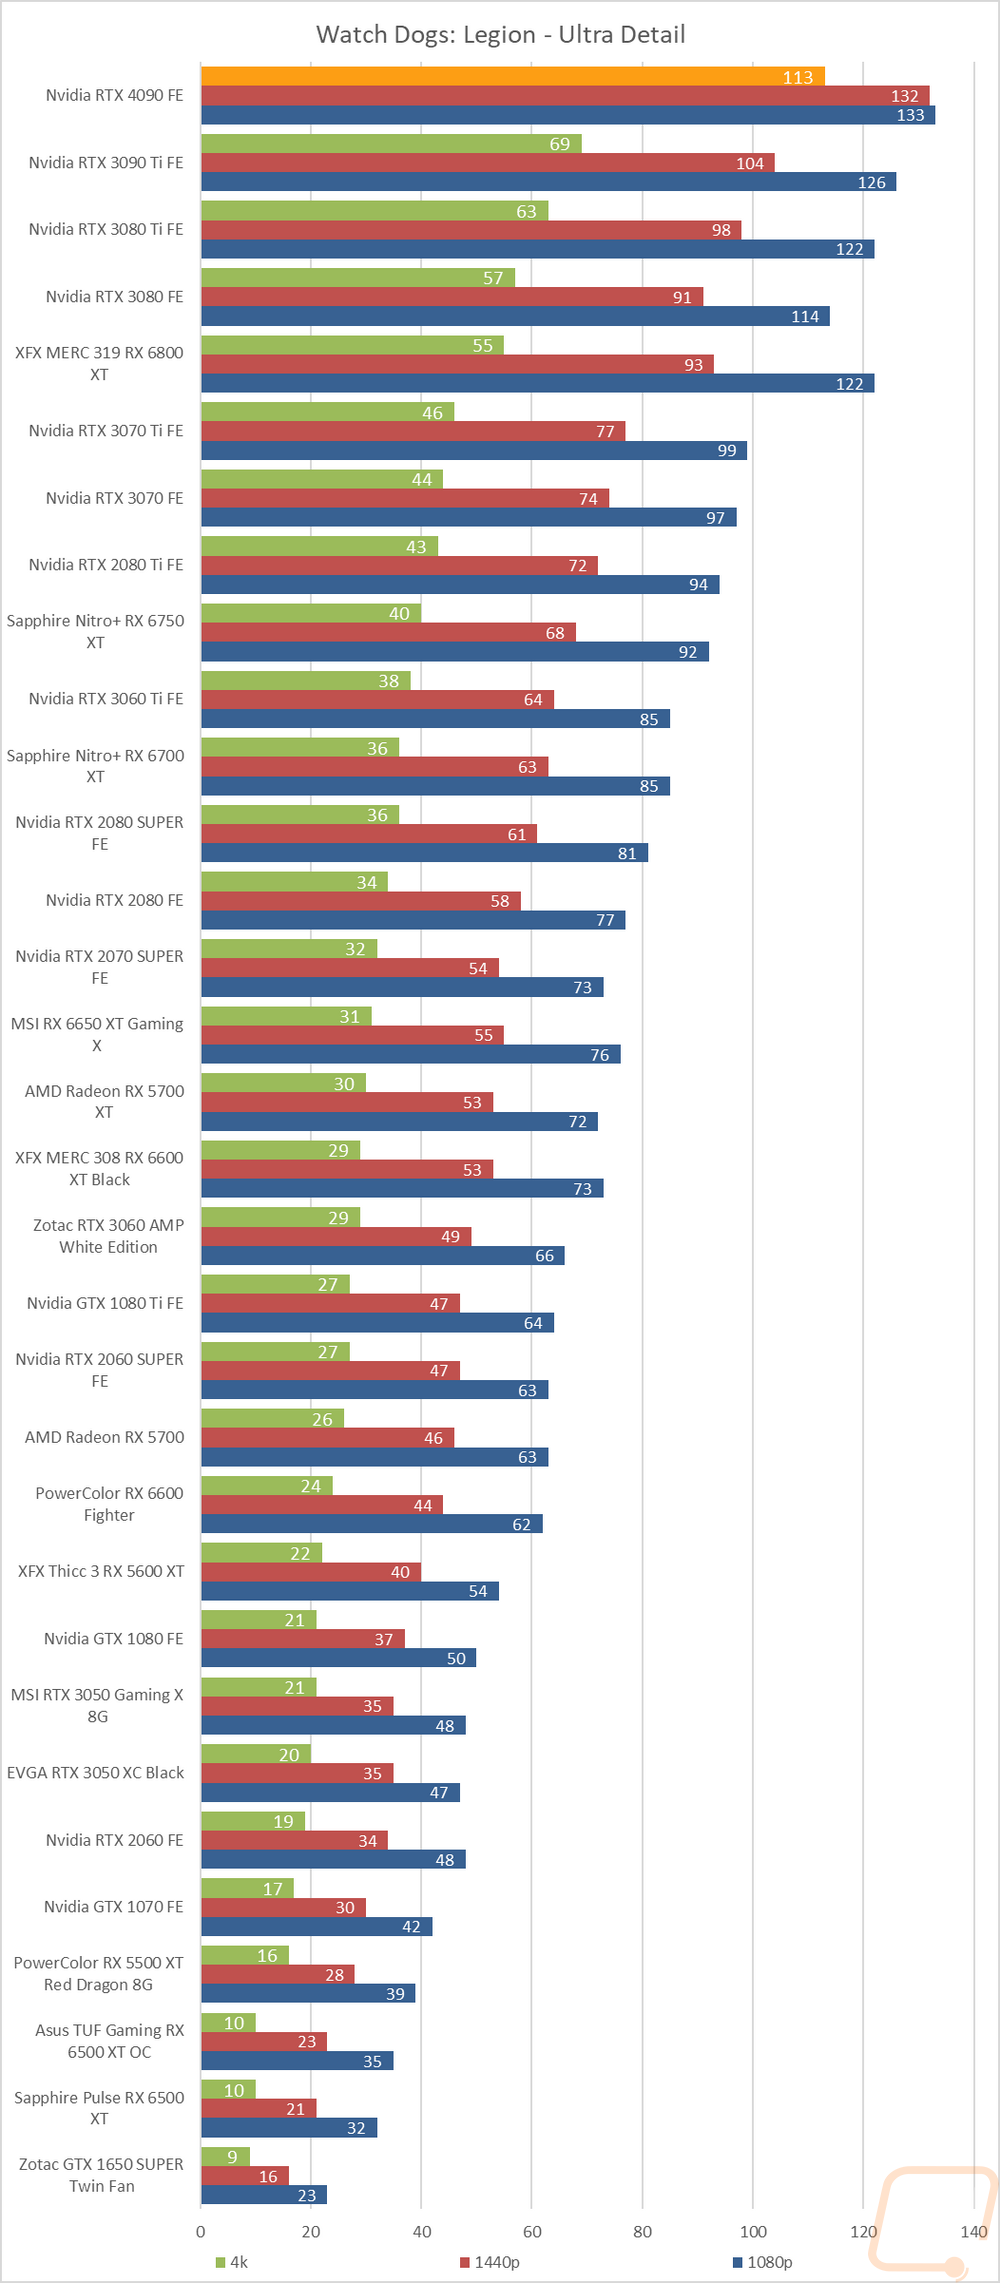
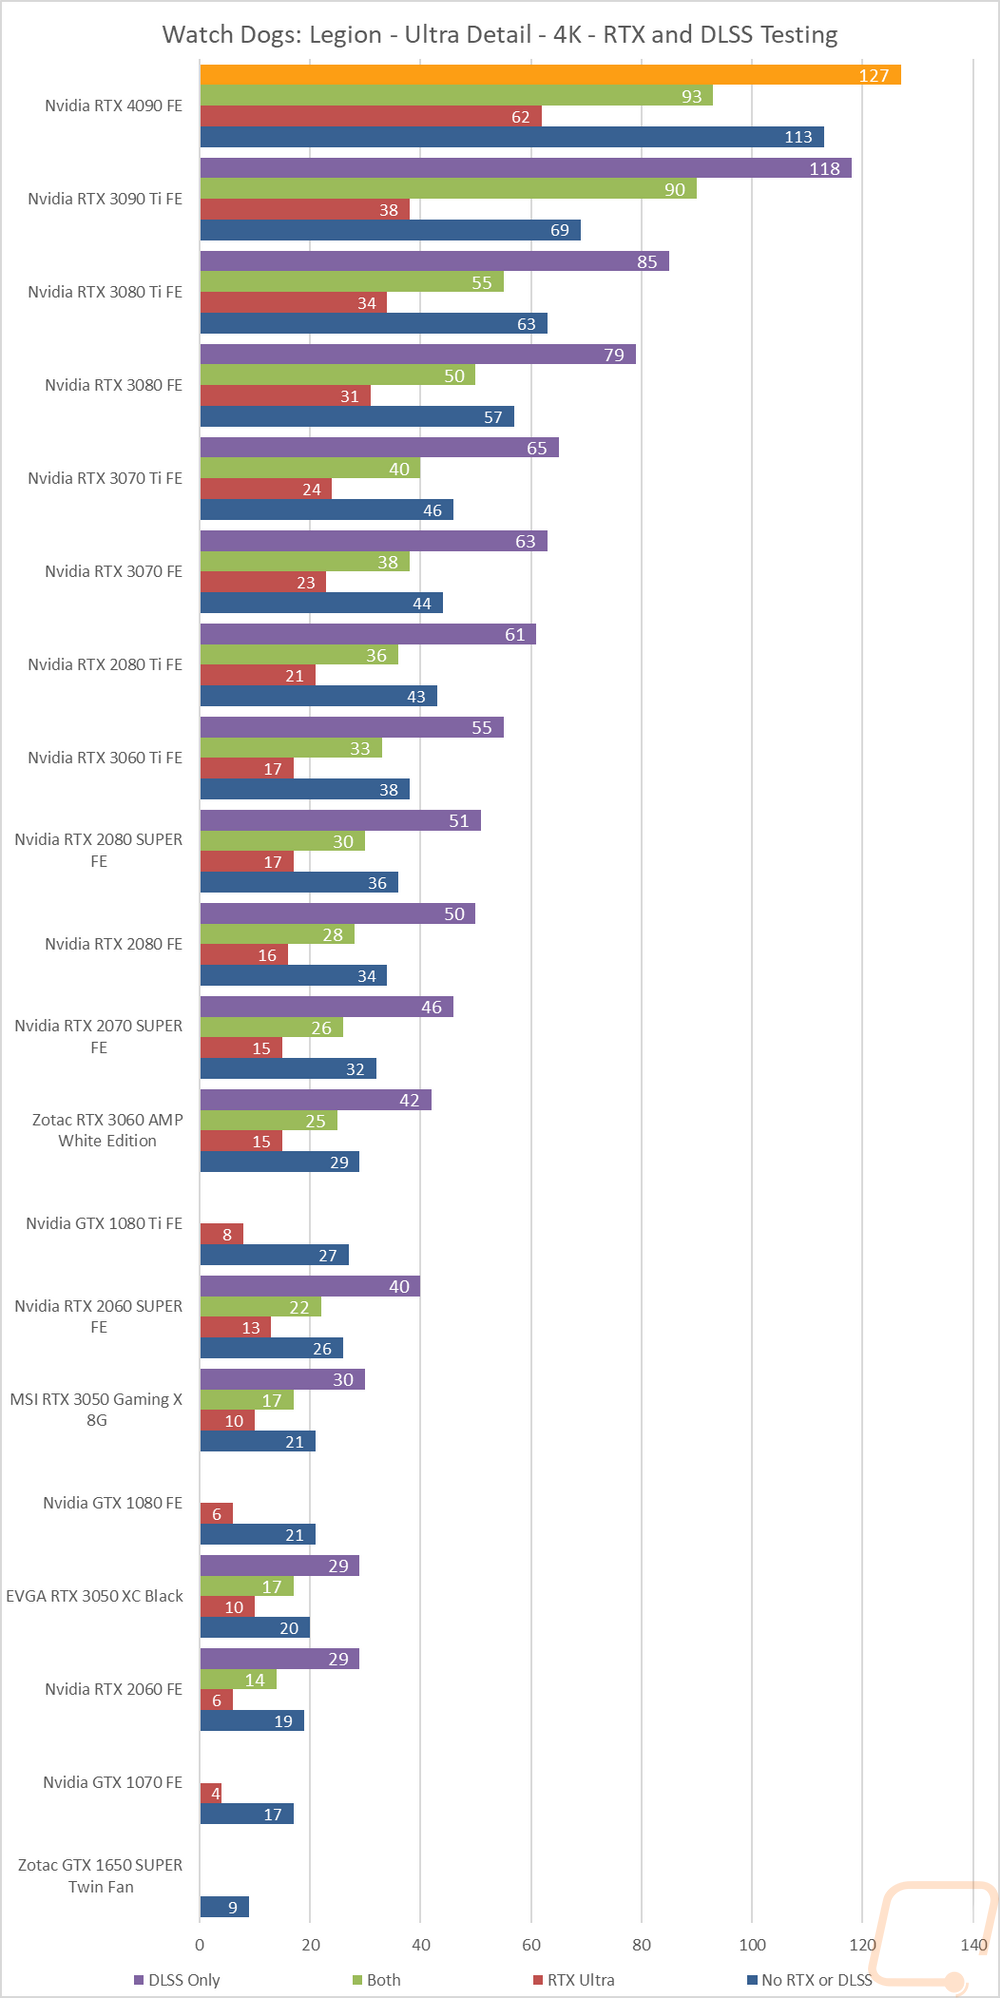
I then jumped into game tests, this time with Watch Dogs: Legion. For this one, I wanted to get an idea of the performance you will see when taking advantage of Nvidia’s RTX and DLSS features. I tested at 4k with the ultra detail setting and with ultra being the setting for DLSS and RTX when they are on as well. I then test with no RTX or DLSS on and then with RTX DLSS on and off and on together. Here the RTX 4090 Founders Edition is out in front, no surprises there. Running with DLSS on and RTX on came in at 93 FPS which wasn’t enough to match the performance of the game without RTX on but is still smooth while adding more to the overall detail.
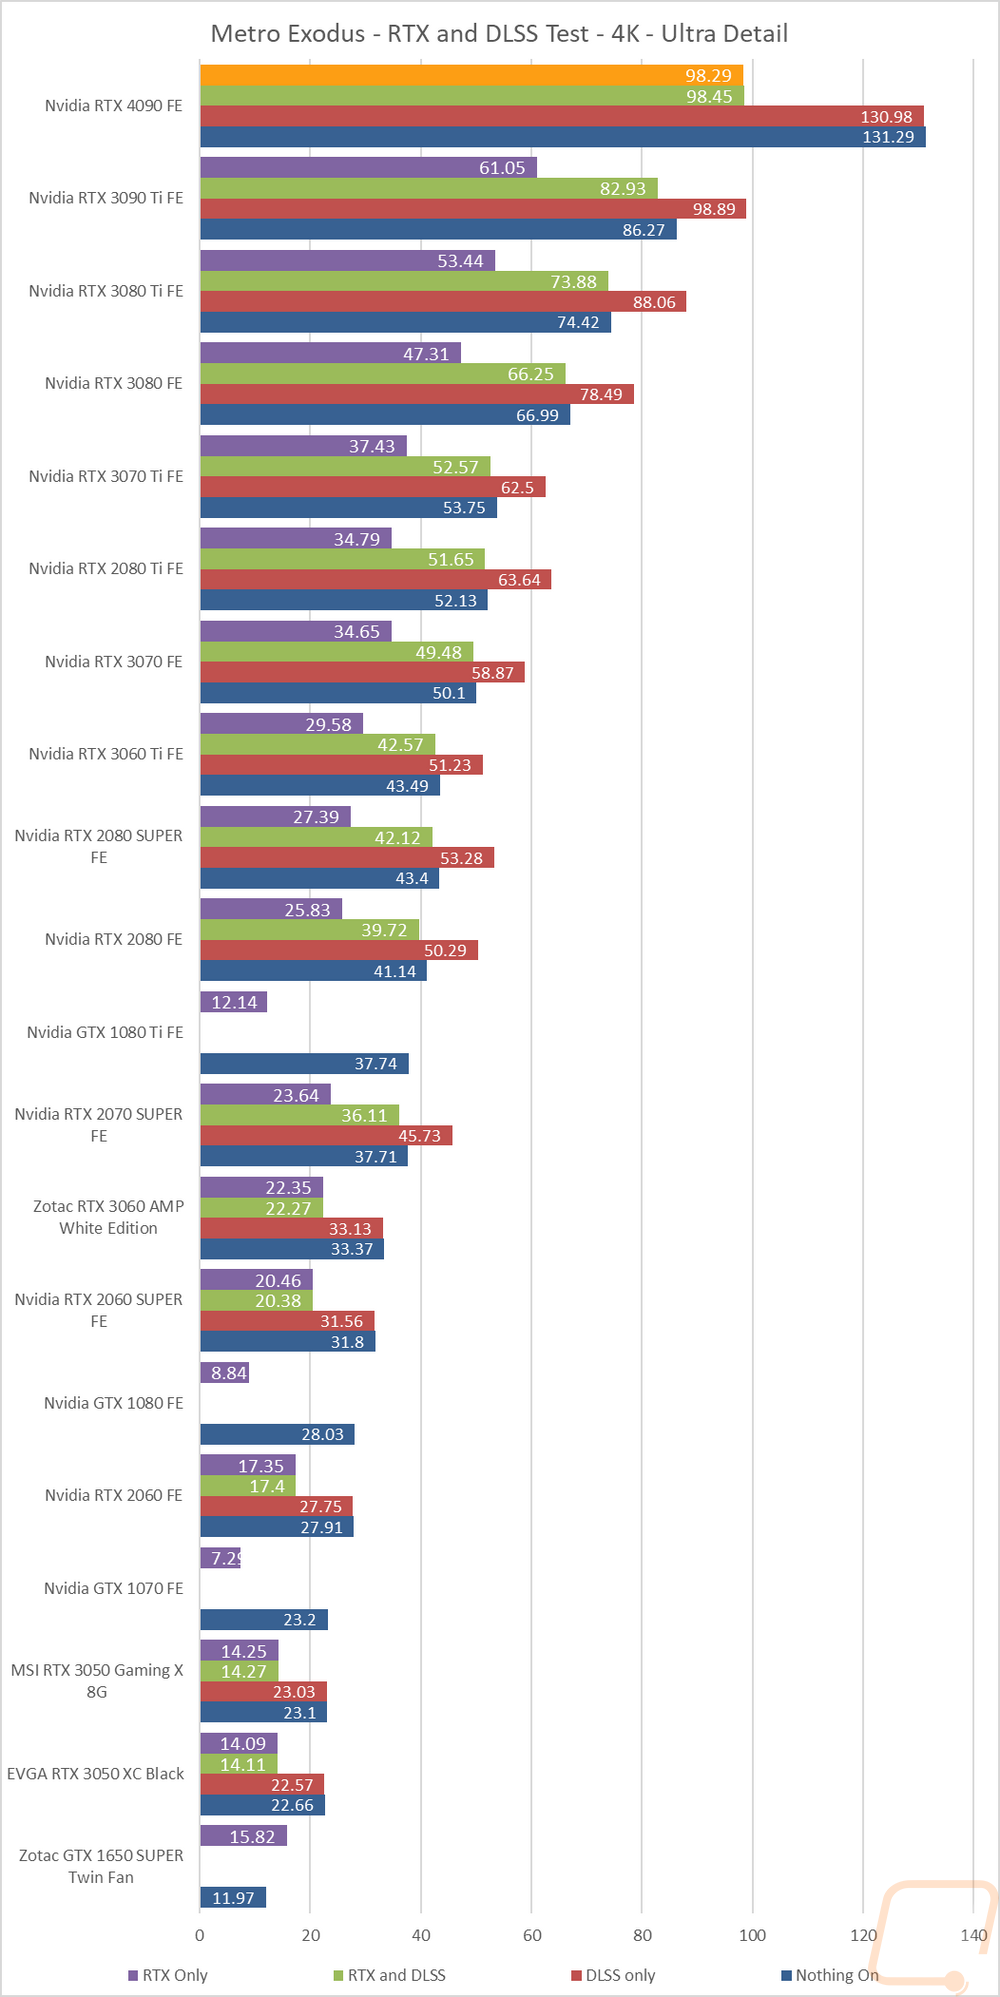
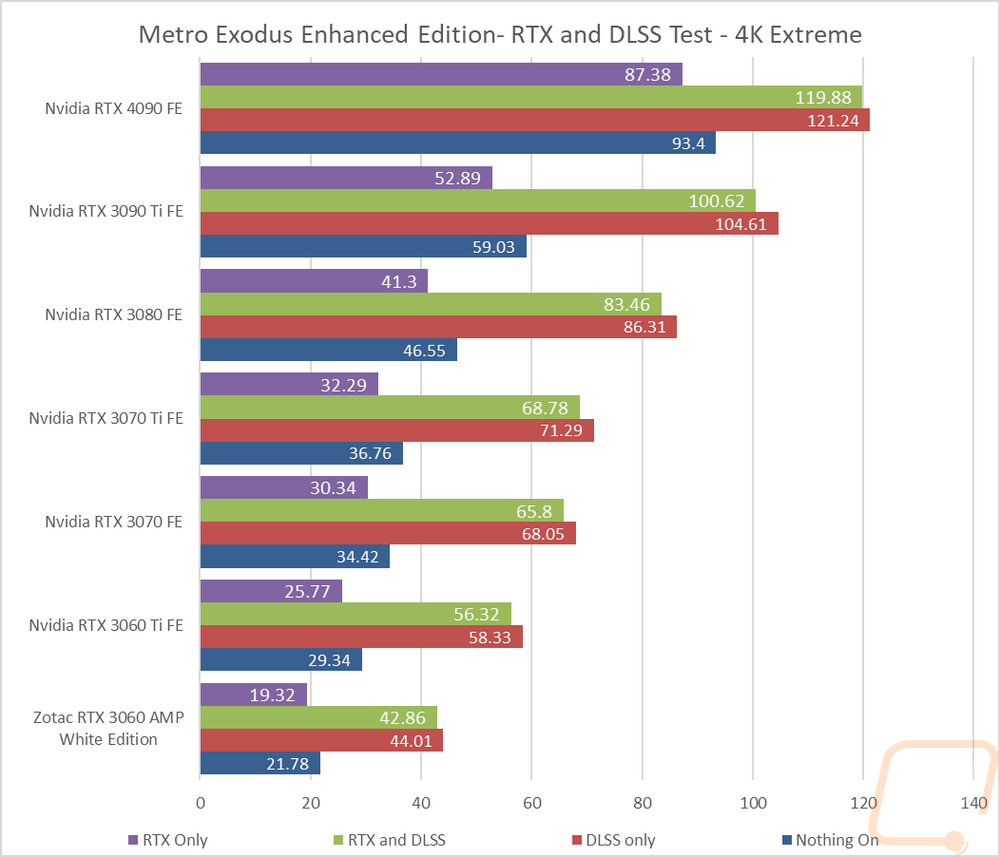
Next, I wanted to check out the performance in Metro Exodus which we have used for testing for a long time now. This test is similar as well with it set to 4K and Ultra detail, I use the included benchmark to test DLSS and RTX individually and then with them both on and both off to give us a look at overall frame rates depending on which direction you go. Sadly this test surprised me with DLSS not working at all as the matching numbers show. The original version of Metro Exodus only has the original DLSS 1, DLSS 2 support was added in the Metro Exodus Enhanced Edition so if you are gaming on a higher-end Nvidia card, especially the RTX 4090 be sure you are playing on it. To confirm this isn’t an issue with Metro Exodus Enhanced Edition I did similar tests with it and we can see DLSS 2 working on it though running it without RTX doesn’t offer much of a performance benefit so be sure you are taking advantage of that.
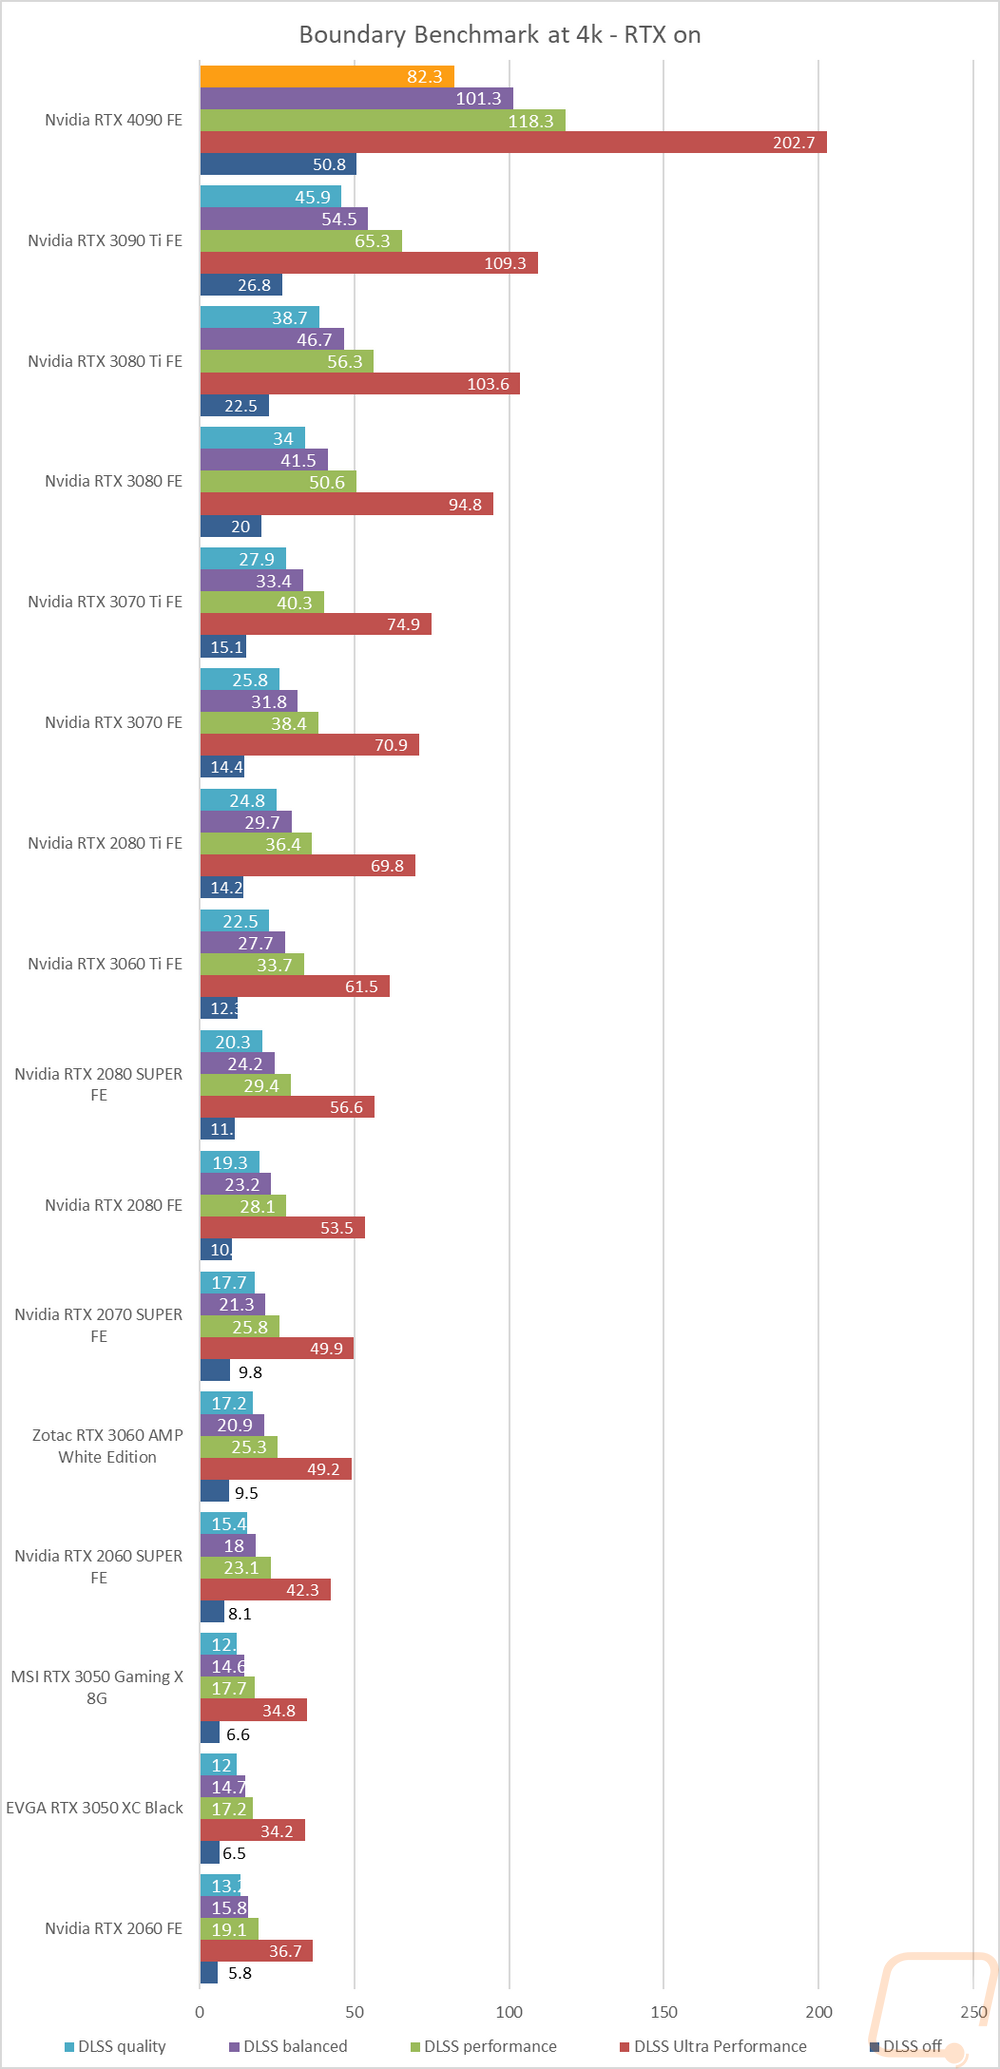
Next, I tested using a benchmark based on the game Boundary. For this one, I wanted to see how all of the different DLSS settings would perform, including turning it off completely. This is run using the free benchmark and with the resolution set to 4k and RTX on. This is a test where in the past we have only really seen smooth frame rates when running DLSS in the ultra-performance setting but the monster performance of the RTX 4090 Founders Edition puts the base non-DLSS performance at 50.8 FPS so turning DLSS on even with the highest quality settings was enough to push performance from not quiet smooth up into the smooth range and with the performance and ultra-performance settings get even more impressive high-refresh numbers. The DLSS ultra-performance setting did four times the FPS without DLSS at all.
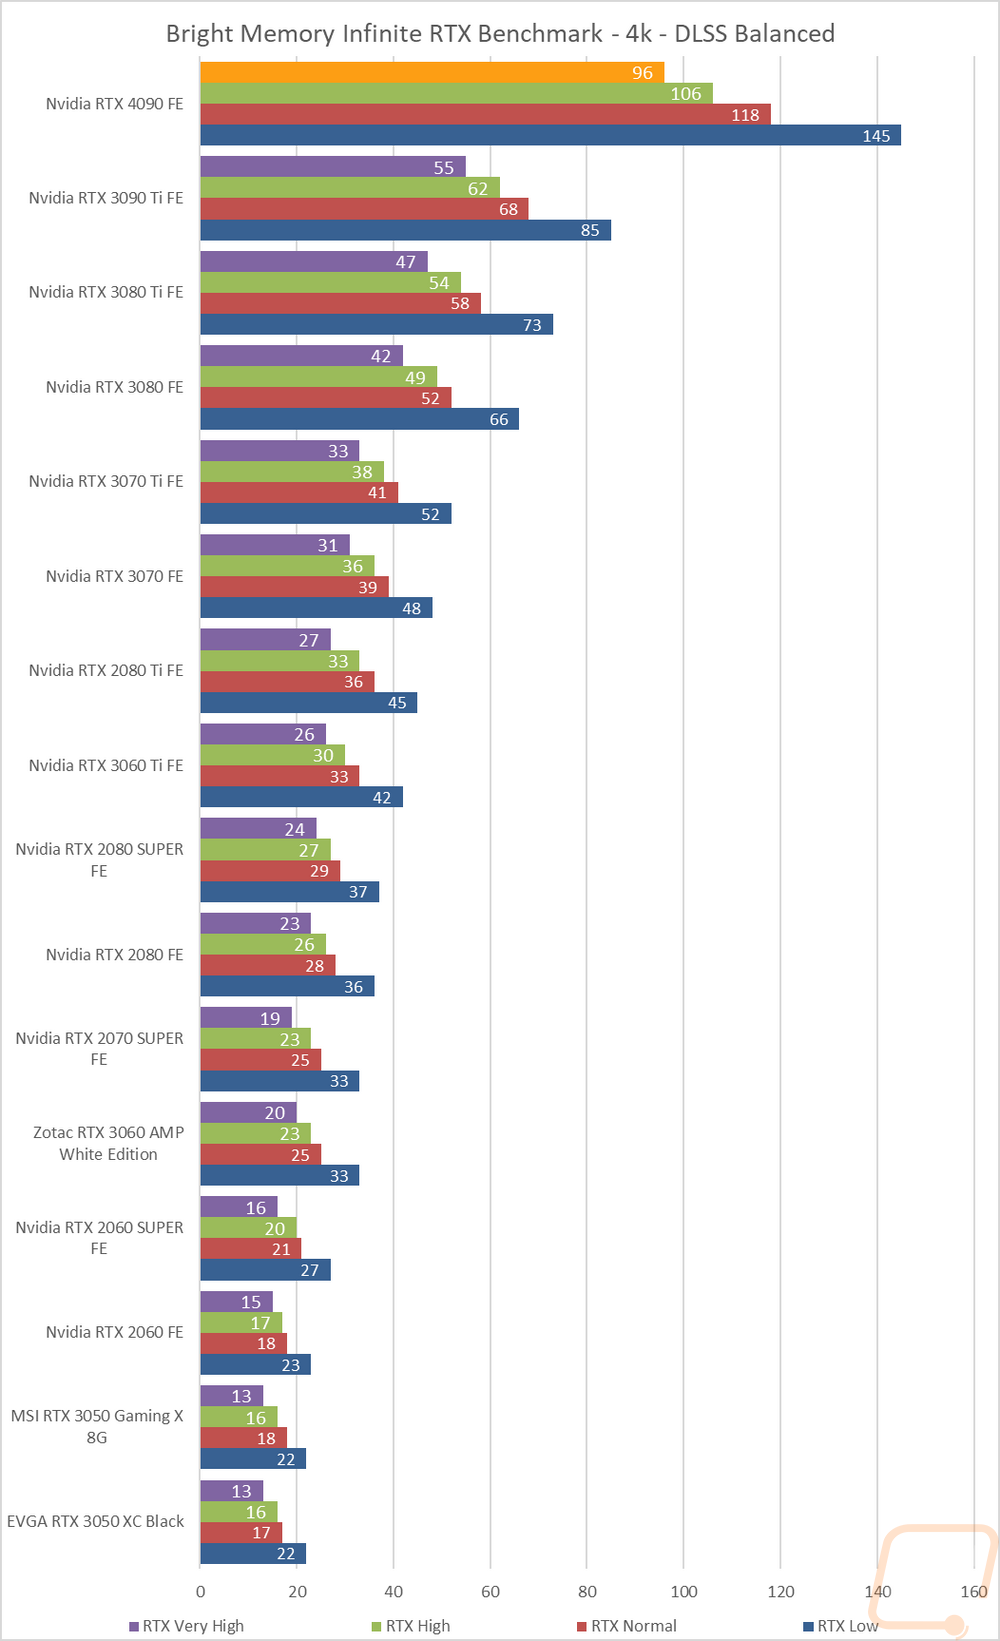
The last tests were done in a benchmark based on the game Bright Memory with their free steam benchmark. This is similar to the previous Boundary test only it is looking at RTX settings individually with the resolution set to 4K and DLSS set to the balanced setting. The RTX 4090 Founders Edition is fast in all four of the tests but it is interesting to see how the RTX quality levels affect the performance with it ranging from 145 FPS down to 96 FPS depending on if it is on low or very high.
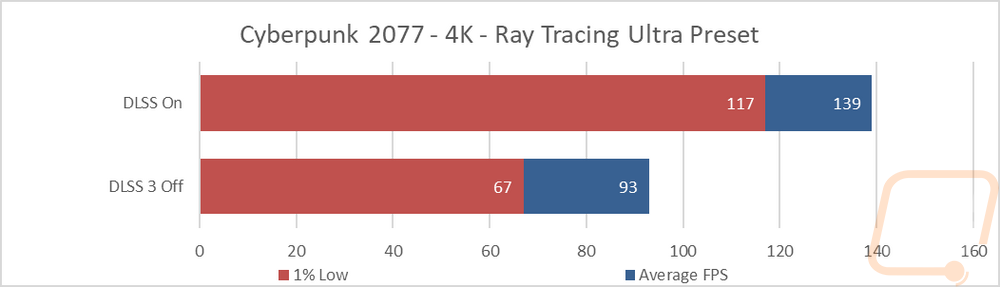
While not part of our normal test suite, I wanted to check out how DLSS 3 performed in actual games and Nvidia helped with access to a few beta builds of different games and I dove into testing in Cyberpunk 2077 in a few different aspects. With the resolution cranked up to 4k and with the ray tracing ultra preset on which is the highest detail setting including ray tracing on its highest detail. I ran the built-in benchmark using Nvidias Frameview to get FPS readouts because at the time Cyberpunk FPS readings in the beta build with DLSS 3 weren’t working correctly. What I found was that with DLSS 3 off the average FPS was 93 with a 1% low of 67 FPS and turning DLSS 3 on it jumped up to 139 with a 1% low of 117. That is a jump of 49% and the 1% lows went from a 38% gap to 18% which shows just how much smoother the gameplay is on top of the additional FPS.
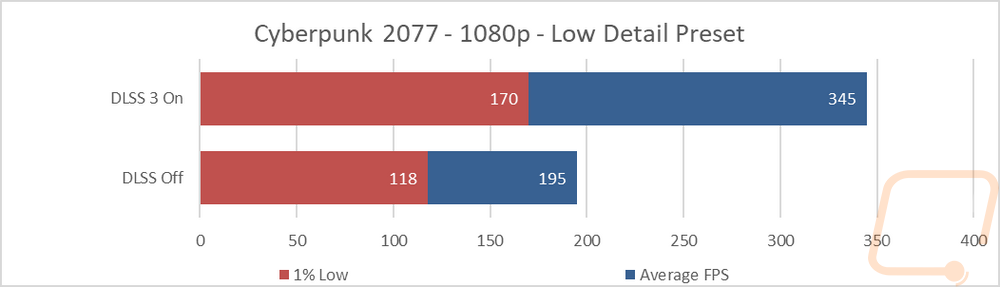
When testing DLSS 3 another aspect that Nvidia brought up that caught my eye was that with DLSS 3 not only can it help raise your FPS as a whole. But with CPU-limited games because of it handling every other frame, it can take the load off of your CPU and double up your FPS. To check this out I turned the detail in Cyberpunk 2077 all the way down and the resolution down to 1080p. With DLSS off the FPS averaged 195 with a 1% low of 118. Turning DLSS 3 on with those same settings the FPS jumped up to 345, a 77% improvement but with that because of the way this works the 1% lows in that situation are lower at 170 FPS.
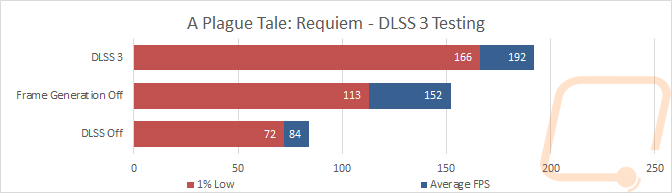
Along with Cyberpunk 2077, I also tested the upcoming game A Plague Tale: Requiem which is coming out on the 18th and has implemented DLSS 3 as well. I put it to the test with full DLSS and then tested again with just DLSS Super Resolution and a third time with all of it off. What I found was that without DLSS on at all the game averaged 84 FPS and had a 1% low of 72 FPS which was playable with the RTX 4090. Turning DLSS Super Resolution on the average FPS jumped up to 152 and the 1% lows improved to 113 but there is a bigger gap between those. Then adding frame generation into the mix the average FPS went up even further to 192 FPS and the 1% lows were closer again at 166 FPS. From 84 FPS to 192 FPS is a huge improvement!
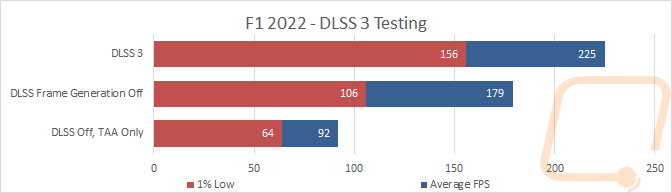
For another CPU-limited game, I tested with a beta version of F1 2022 and I tested this in a similar situation. I tested with all of DLSS 3 turned on, then with frame generation off, and then with DLSS completely off. F1 2022 improved from 92 FPS without DLSS to 225 FPS with all of DLSS 3 on. Turning off frame generation dropped that down to 179.
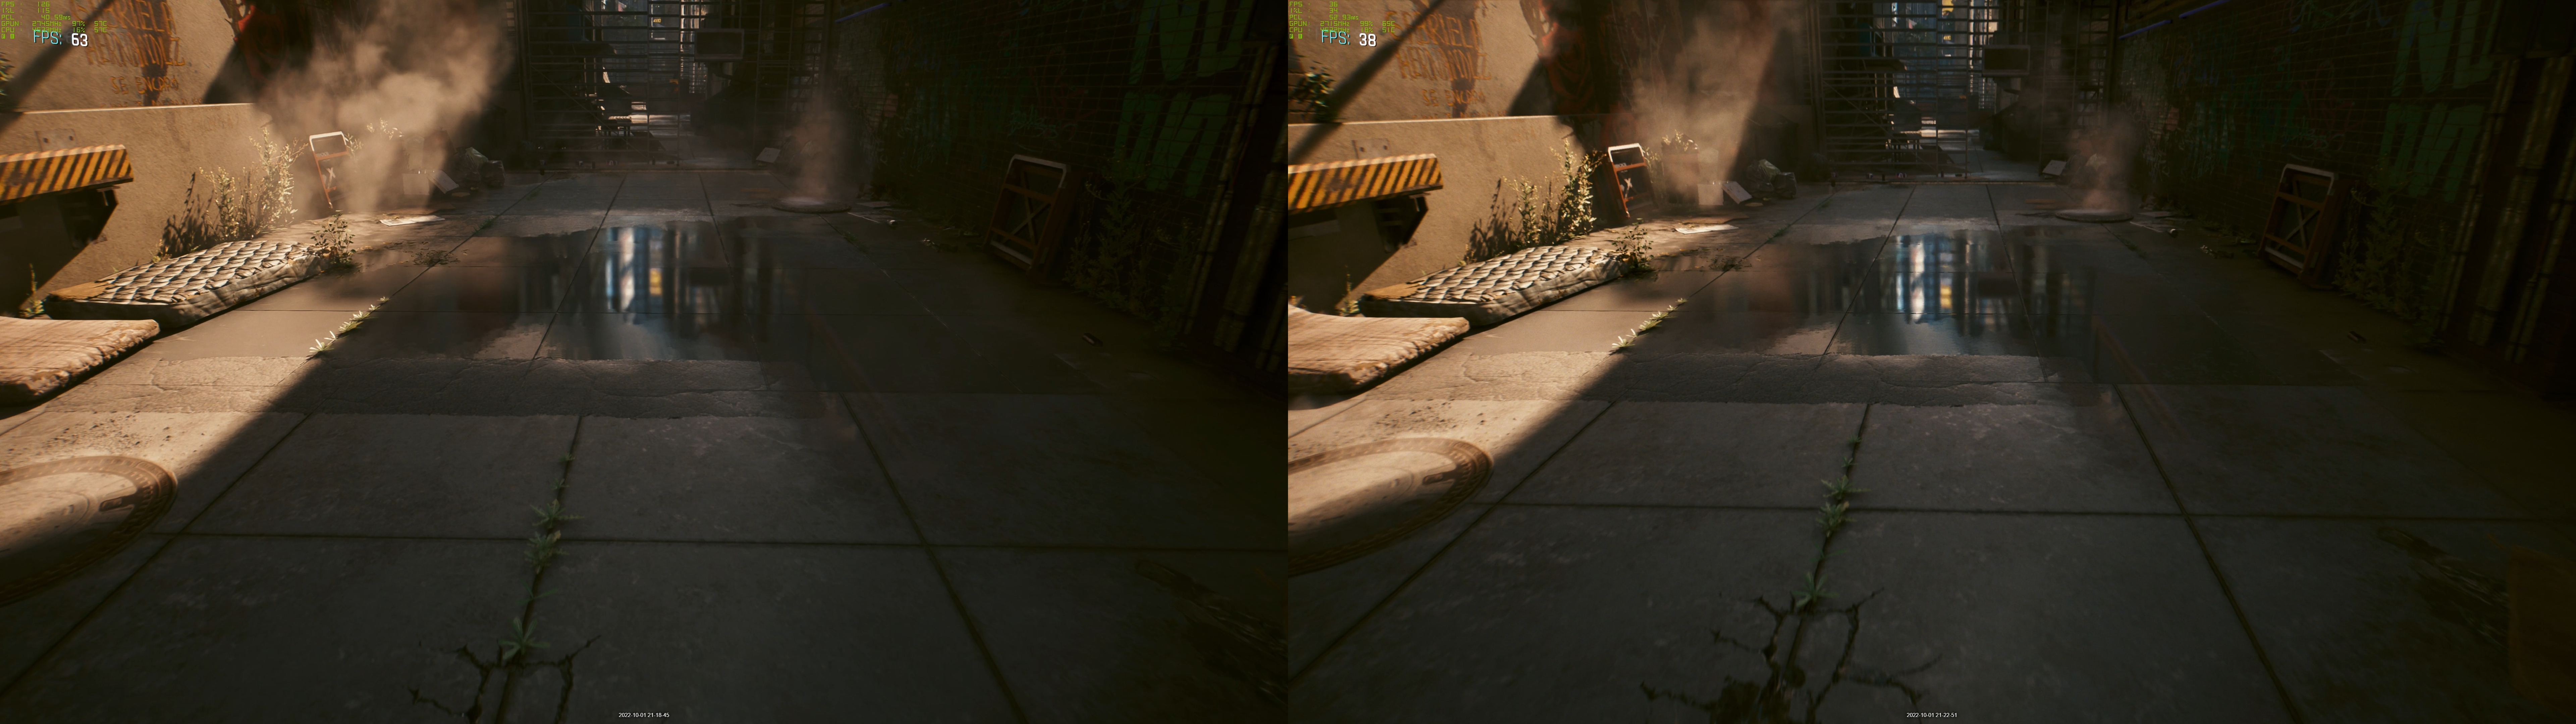
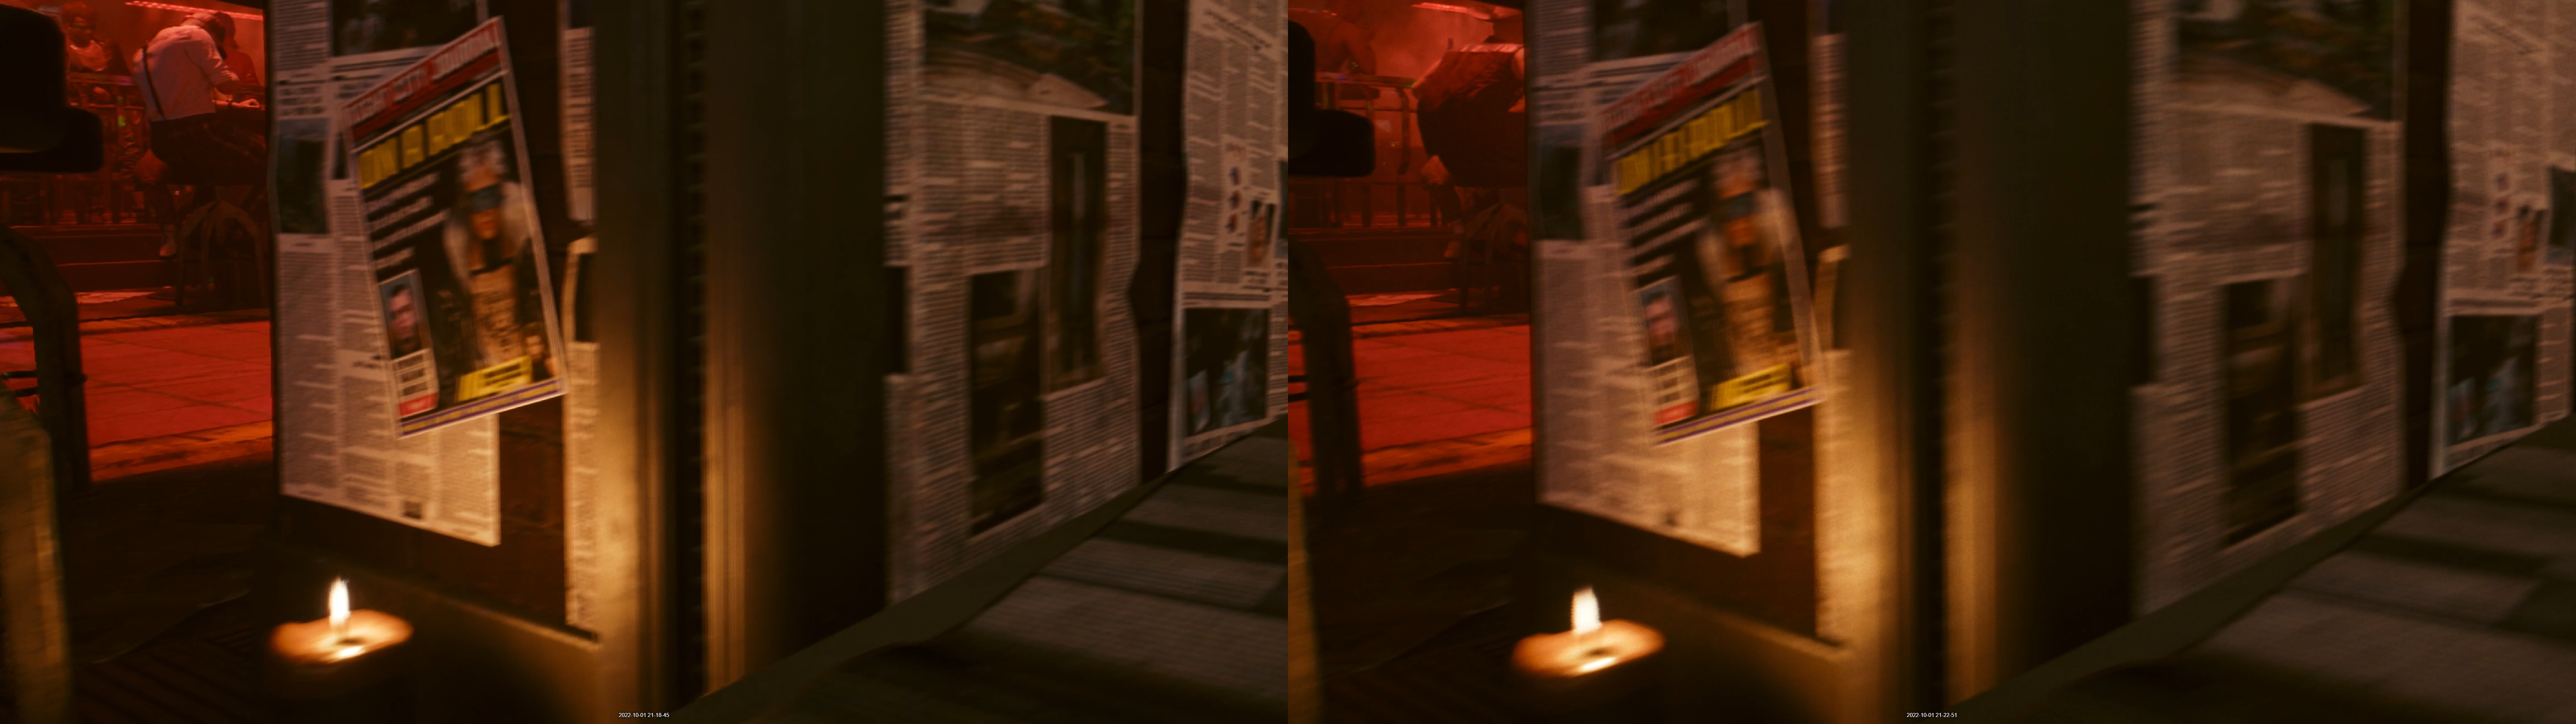
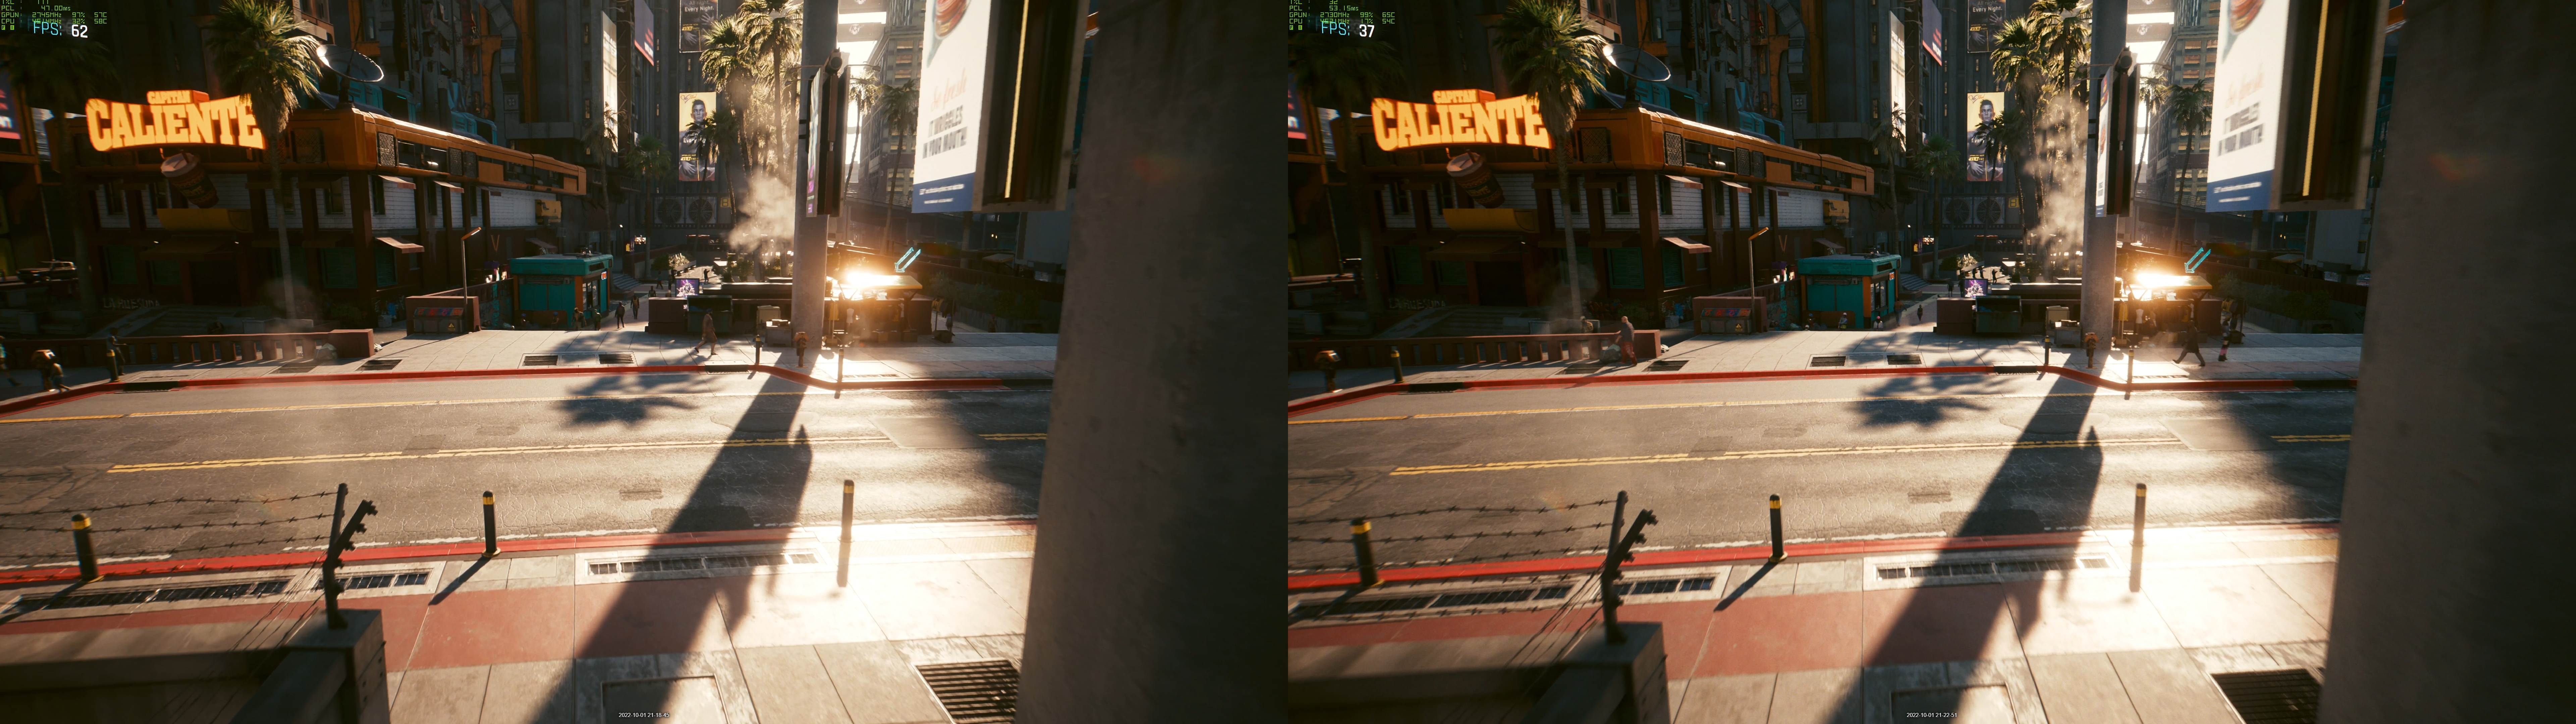
When doing my Cyberpunk 2077 DLSS 3 testing I did also run through the benchmark with DLSS 3 on and again with it off while recording video to get a few side y side images using Nvidia’s iCat tool for comparison. Recording at the highest possible detail levels with OBS at the same time as running the benchmark slowed things down significantly, especially on the non-DLSS 3 side so don’t pay much attention to the frame rates indicated. For some reason, iCat didn’t integrate the labels I put on the images as well when I created these but for the record DLSS 3 is on the left and no DLSS at all is on the right. In the first image of an alleyway at full-screen, everything looks amazing with just a few small details like the lights in the reflection being a little less crisp. Zooming into the trash cans through the smoke we can see that the colors on a few things are a little more toned down in the DLSS 3 image and if anything the trash bags are a little crisper.
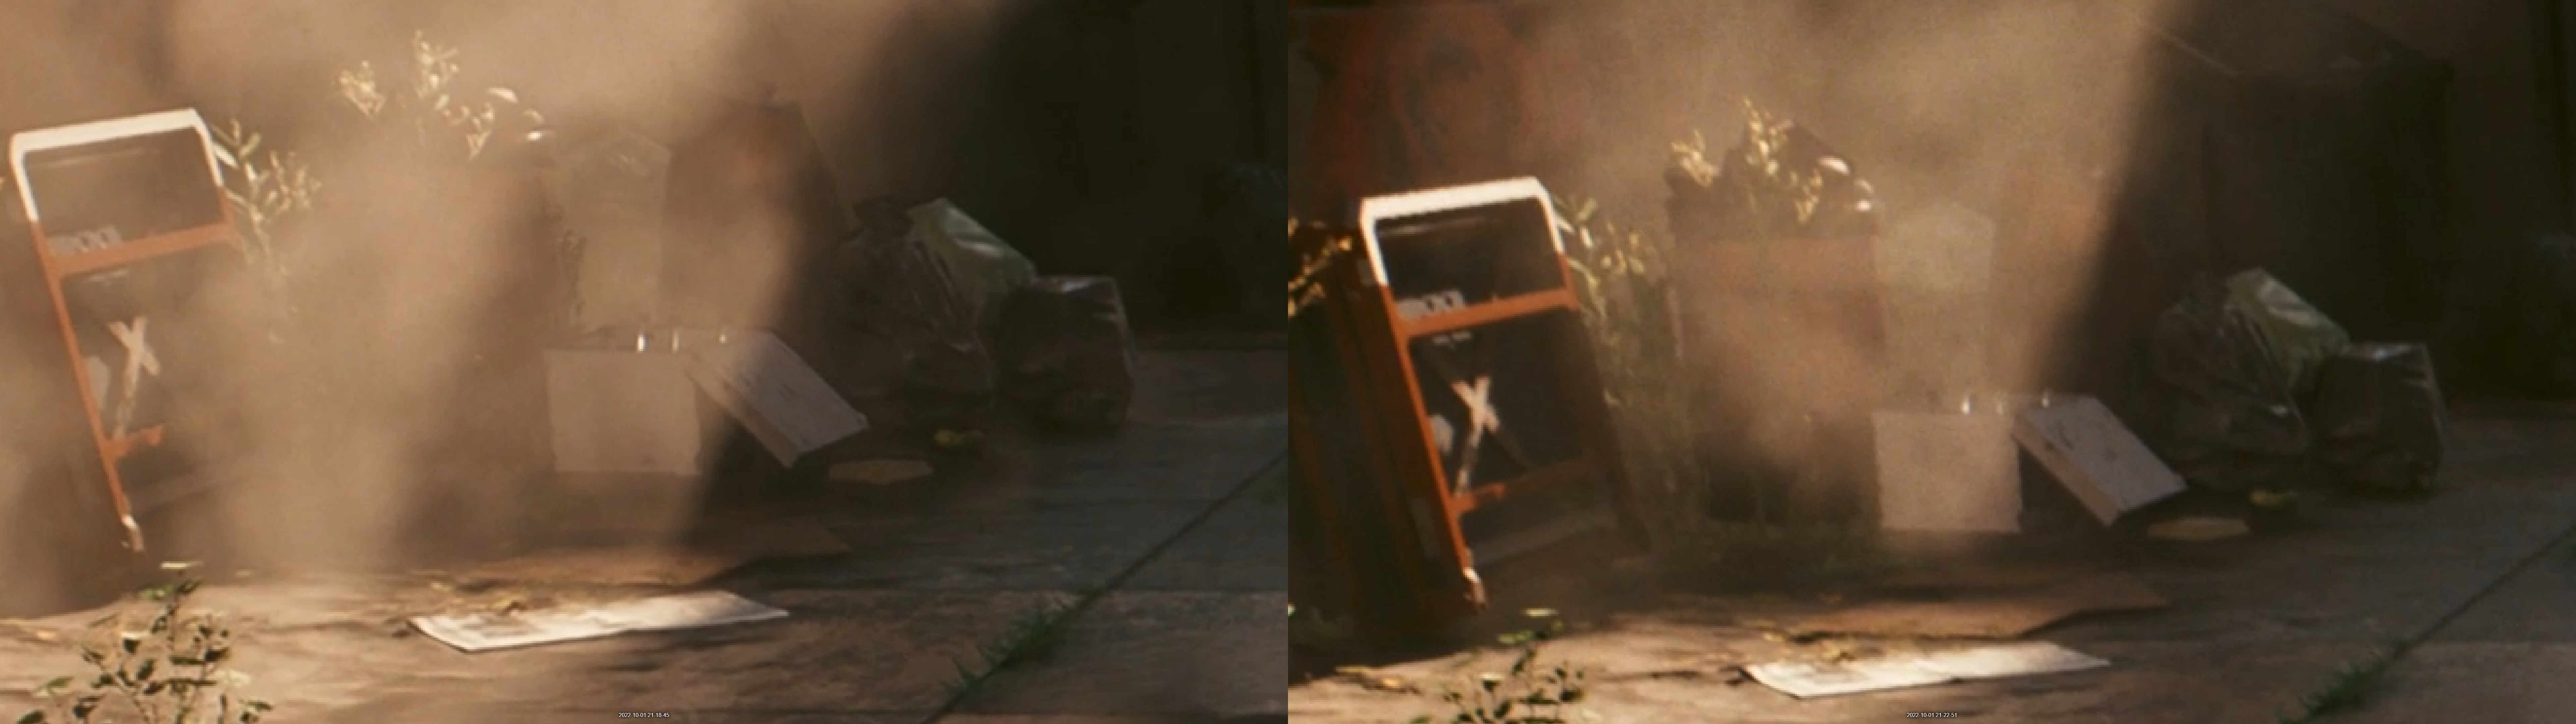
Going inside I found that the DLSS 3 on image things like the papers on the walls were crisper and easier to read. The neon lights are a little brighter on the DLSS 3 side as well.
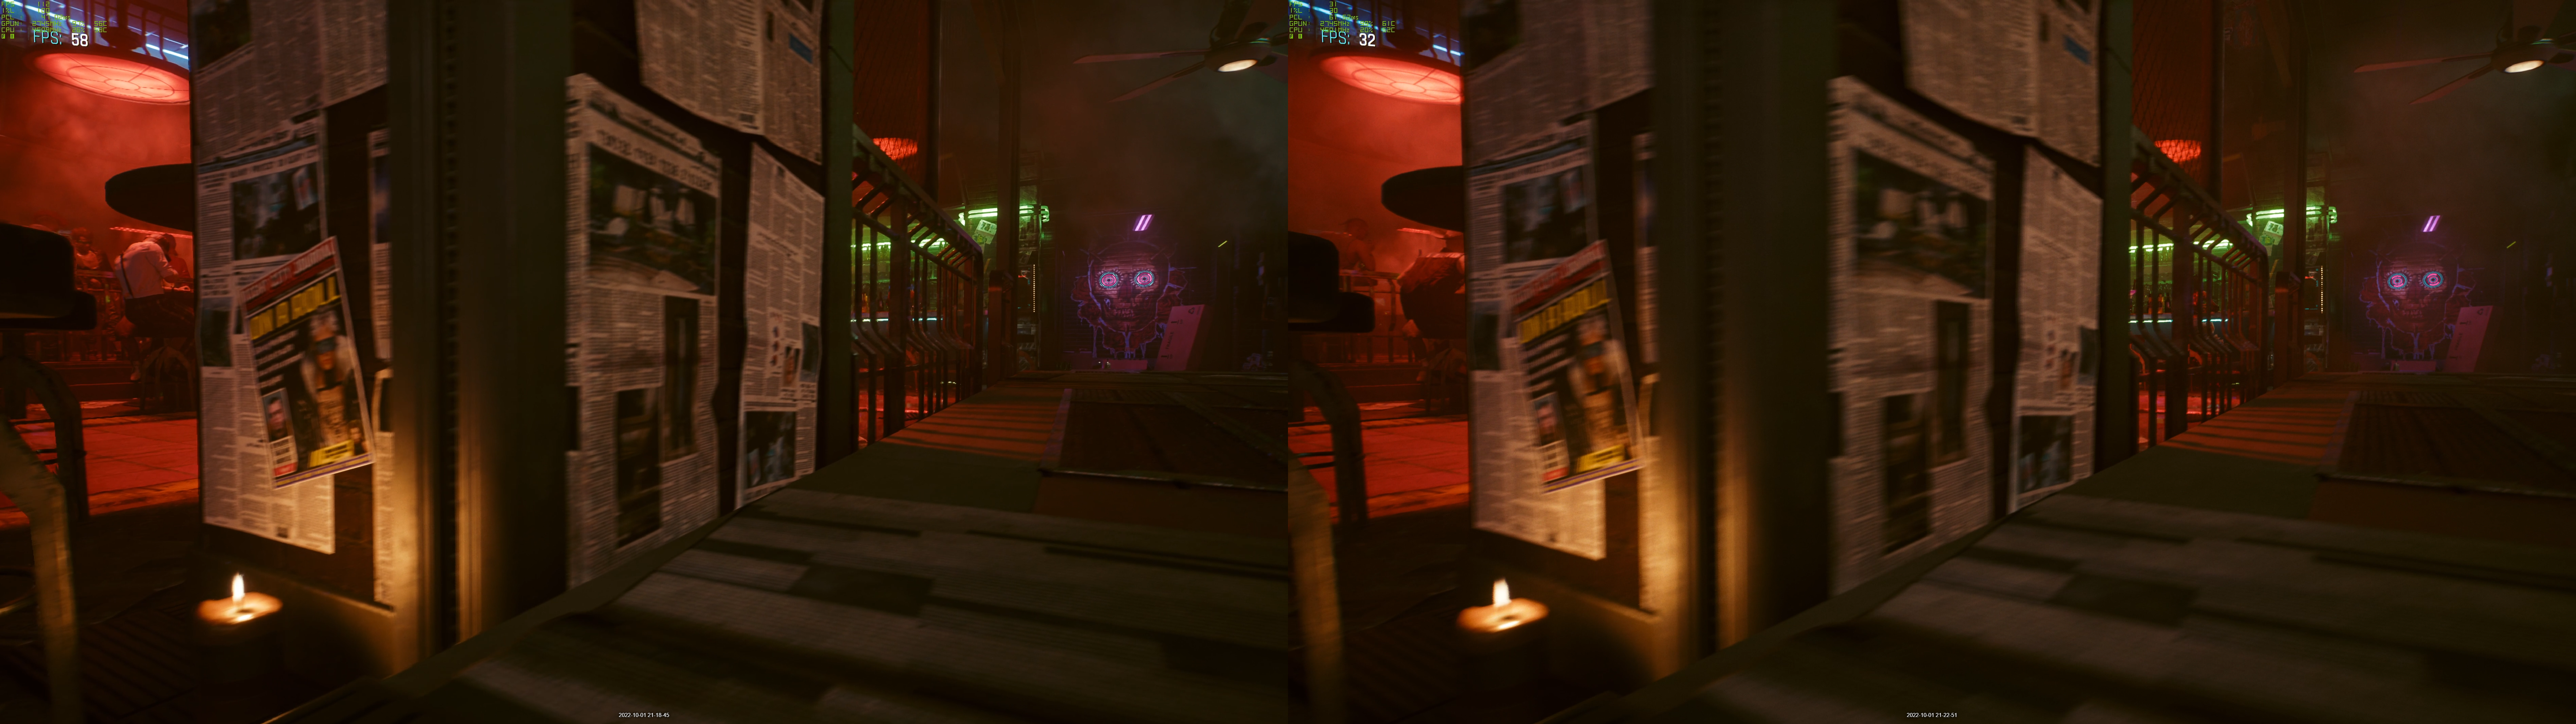
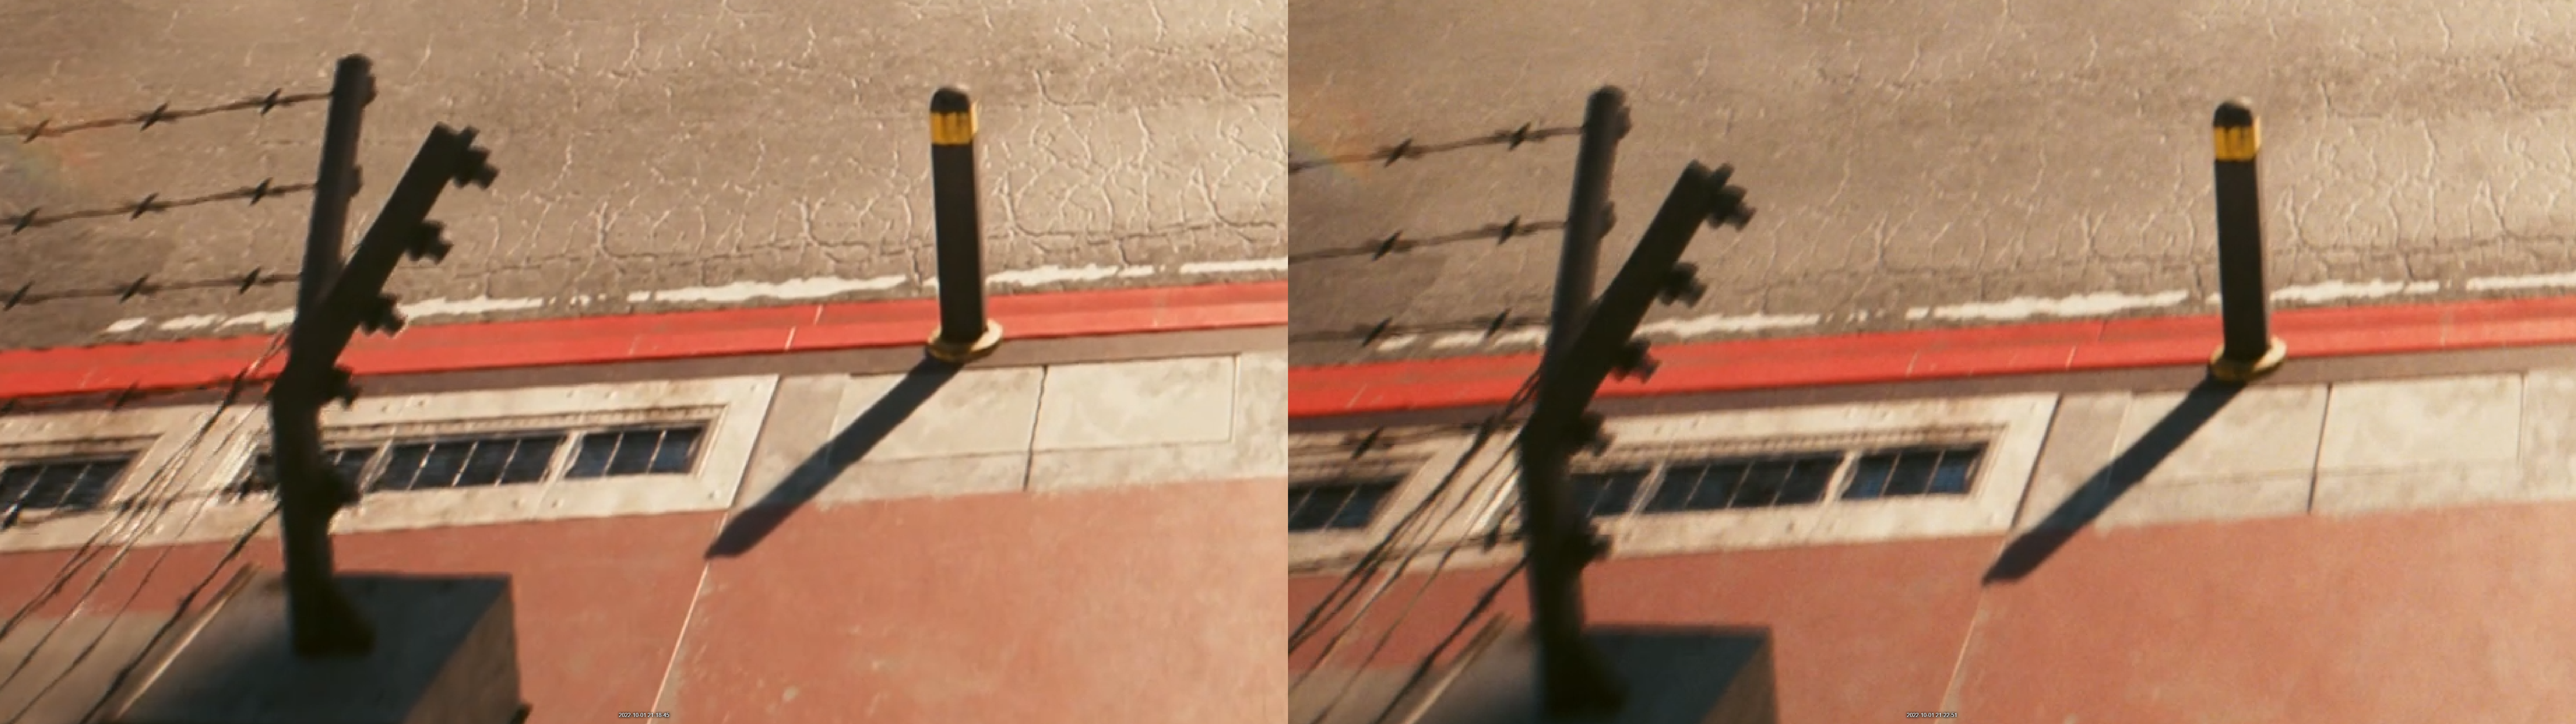
Going outside again into the street I found that the DLSS 3 image is a little sharper in details like the signing and when I zoom in on the post and shadows. There are a few colors that are richer with DLSS off but overall in all three of the examples, I found that the running DLSS 3 looks great. This was especially true when playing at speed, I couldn’t tell the difference between them at all until I had side-by-side images paused.
As of right now, Nvidia has a list of 35 games that have DLSS 3 coming which is a much better list than the original DLSS launch. It seems that DLSS as a whole has proven itself and Nvidia is also working to try to make it easy to implement DLSS 3 which should help drive its implementation as well. The fact is, what game studio wouldn’t want to get the performance improvements that we are seeing right now with DLSS 3, but if it is hard to integrate into their game it will lose its value to them.
Cooling Noise and Power
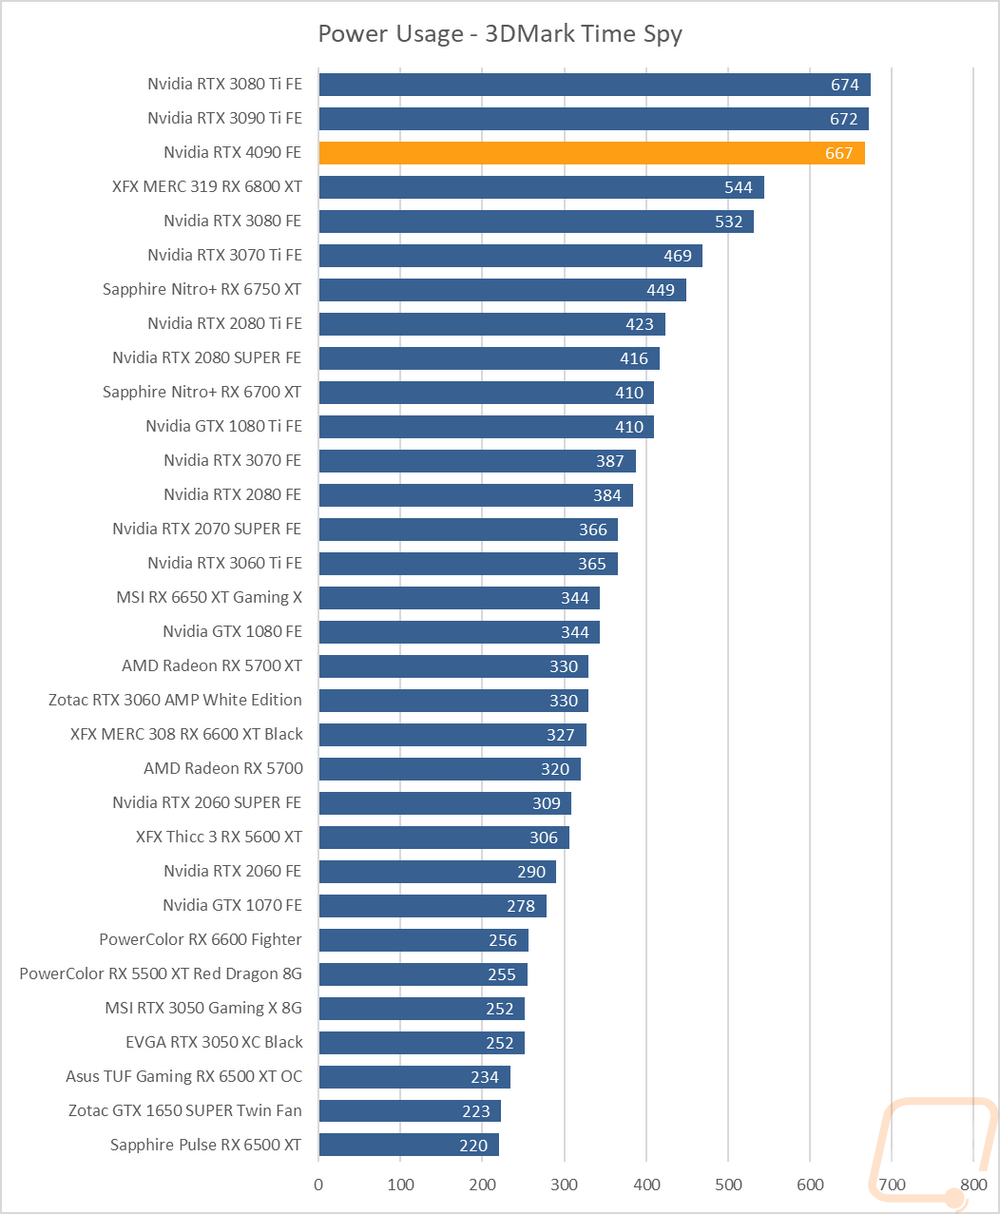
For my last few tests, rather than focusing on in game performance, I like to check out other aspects of video card performance. These are also the most important ways to differentiate the performance between cards that have the same GPU. To start things off I took a look at power usage. For this, I use our Kill-A-Watt hooked up to the test bench to record the total wattage of the system. I ran two tests with the first using 3DMark Time Spy to put the system under a load similar to normal in game performance. Here our test system with the RTX 4090 Founders Edition pulled a total of 667 watts which surprisingly didn’t put it at the top of the chart where the 3080 Ti FE and RTX 3090 Ti were both ahead of it by a few watts.
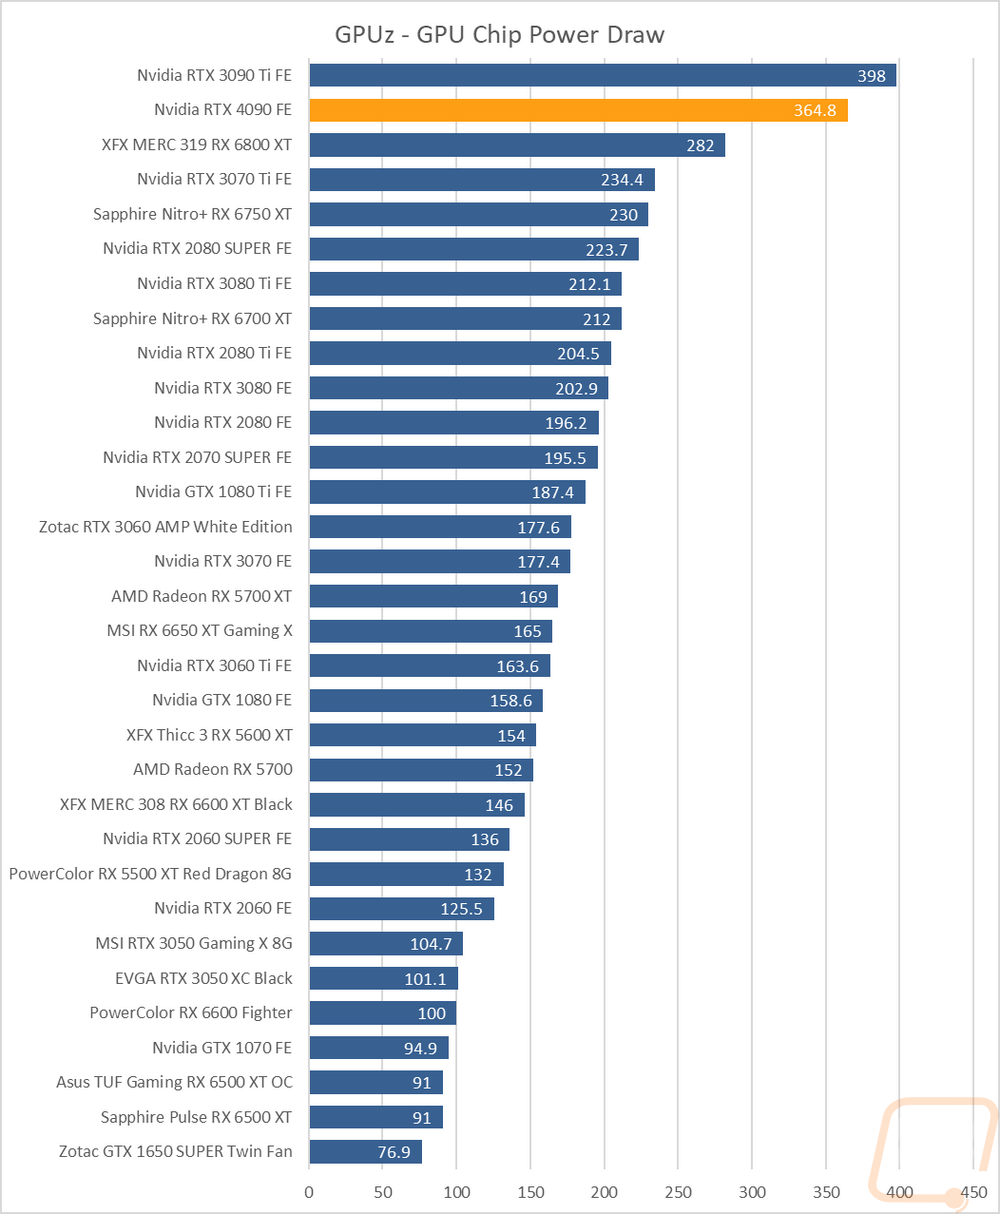
At the same time with Time Spy I also use GPUz to check out the onboard reading for GPU power draw at the chip and in that test, the RTX 4090 was out ahead of most of the other cards by a big margin, the exception to that was the RTX 3090 Ti which pulled 33 more watts at peak than the 4090. While not in the graph the RTX 4090 FE pulled 421.2 for total board power and the RTX 3080 Ti FE was once again out ahead of that by 30 watts at 451.8 watts.
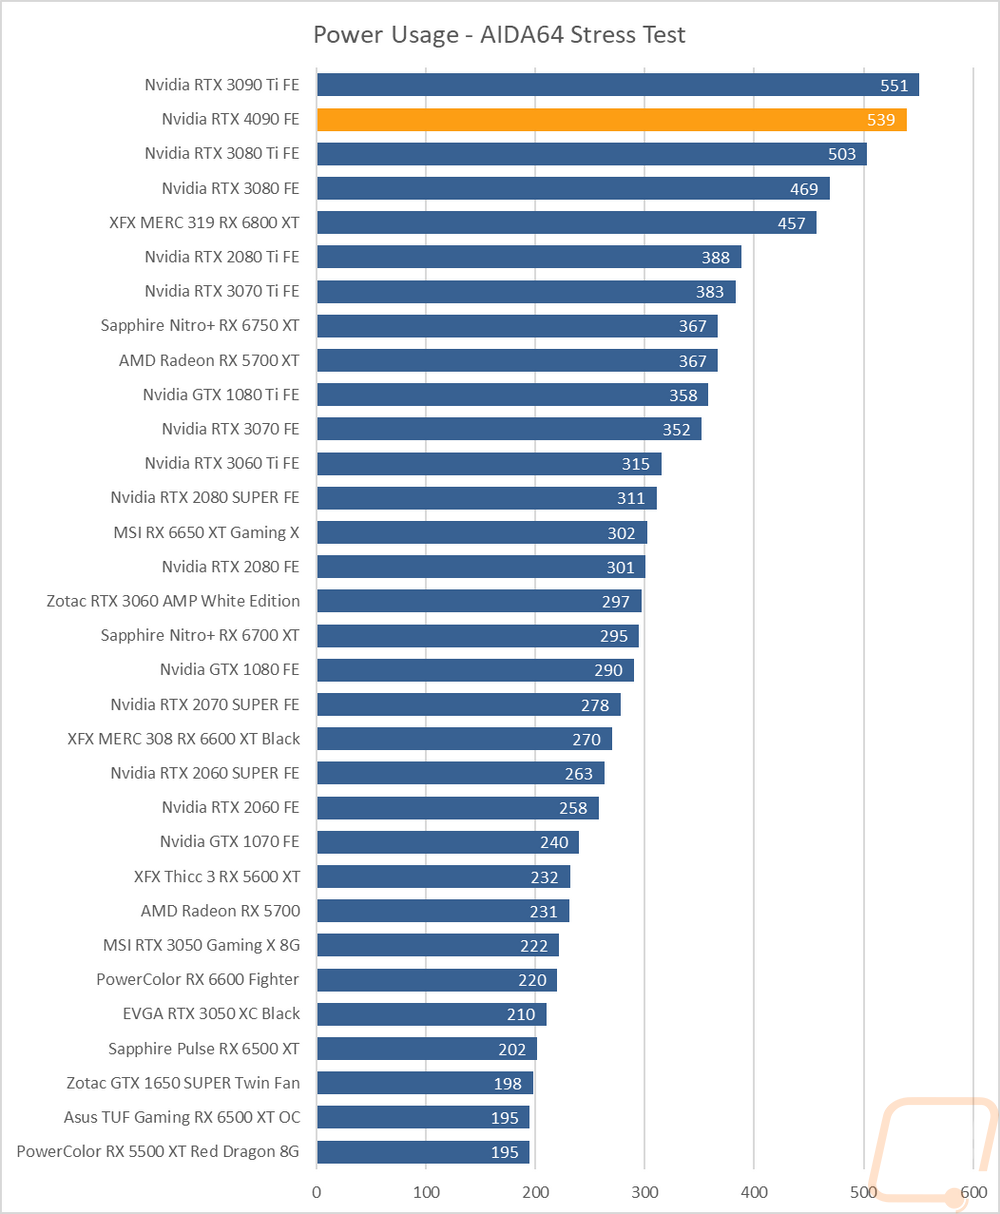
For the last power test, I ran AIDA64’s stress test on the video card to load up only the GPU and using the Kill-A-Watt on the test bench, this time the RTX 4090 Founders Edition and test bench pulled 539 watts at peak. This was higher than the RTX 3080 Ti which was 503 watts but the last generation RTX 3090 Ti FE was once again ahead of the RTX 4090 with it pulling 551 watts at peak.
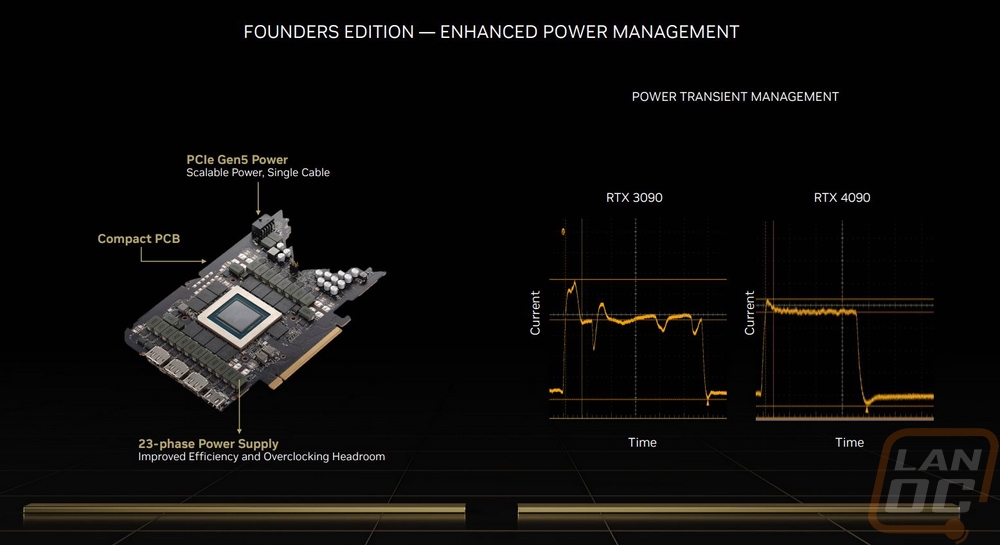
The talk about power usage leading up to this launch has become a bit of a meme, especially with the power usage of some of the aftermarket cards leaking which we don’t have here at all for testing. But I did want to talk a little more about my experience with the power usage of the RTX 4090 FE specifically because I ended up in my testing in a situation that made things painfully obvious which cards were pulling more or less power. For my testing, I have my test bench and my main computer both hooked up to the same 1500VA/1000 Watt Sinewave UPS. That 1000-watt limitation hasn’t been an issue until the RTX 3080 Ti came out where I found out that with four monitors in total and both systems hooked up I could push past that wattage when benchmarking if my PC had anything that used its GPU open like twitch or Youtube. When testing and retesting the RTX 4090, RTX 3090 Ti, and RTX 3080 Ti these are the three cards that I managed to overload the UPS. Interestingly enough though with the RTX 4090, I only managed to do this when testing World War Z Aftermath whereas with the RTX 3080 Ti and especially the RTX 3090 Ti almost all of the tests would do it if I wasn’t careful. Turning off extra monitors took care of the issue, but it was interesting to me that those same cards were only a few watts apart in our 3DMark load test and the 3080 Ti was lower than the RTX 4090 even in the AIDA64 test. But Nvidia’s Ada Lovelace presentations did mention power management on the RTX 4090 Founders Edition card and I think this explains the issue. With the FE card, they have worked on power management and while the RTX 4090 pulls a lot of current they have leveled out a lot of the peak current draw as shown in the graphs below. I now have an Nvidia PCAT for power testing and I ran out of time to be able to dive into testing with that, but what I think we are seeing is the peak power pushing the 3080 Ti and 3090 Ti to pull more but I would bet that the RTX 4090 would average a little higher over an extended period of time. All of that said, considering how impressive the overall performance of the RTX 4090 has been, I think it is crazy that it is even close to the RTX 3090 Ti in power draw.
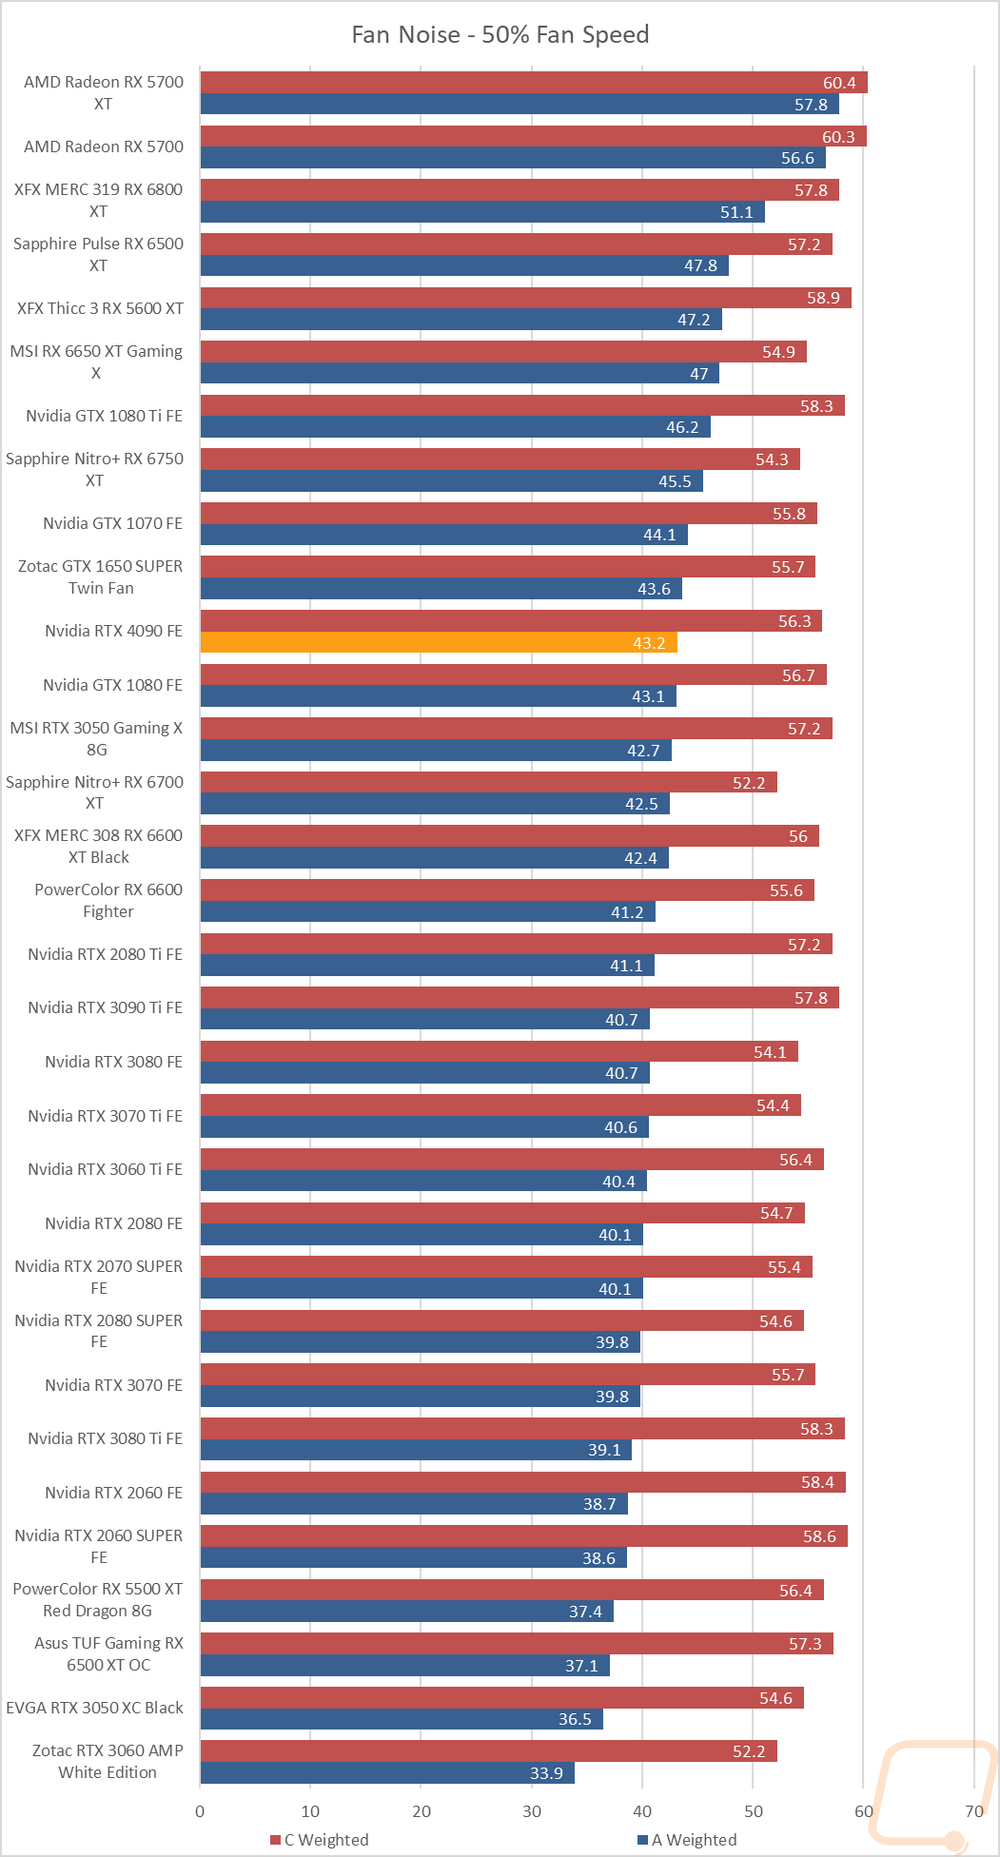
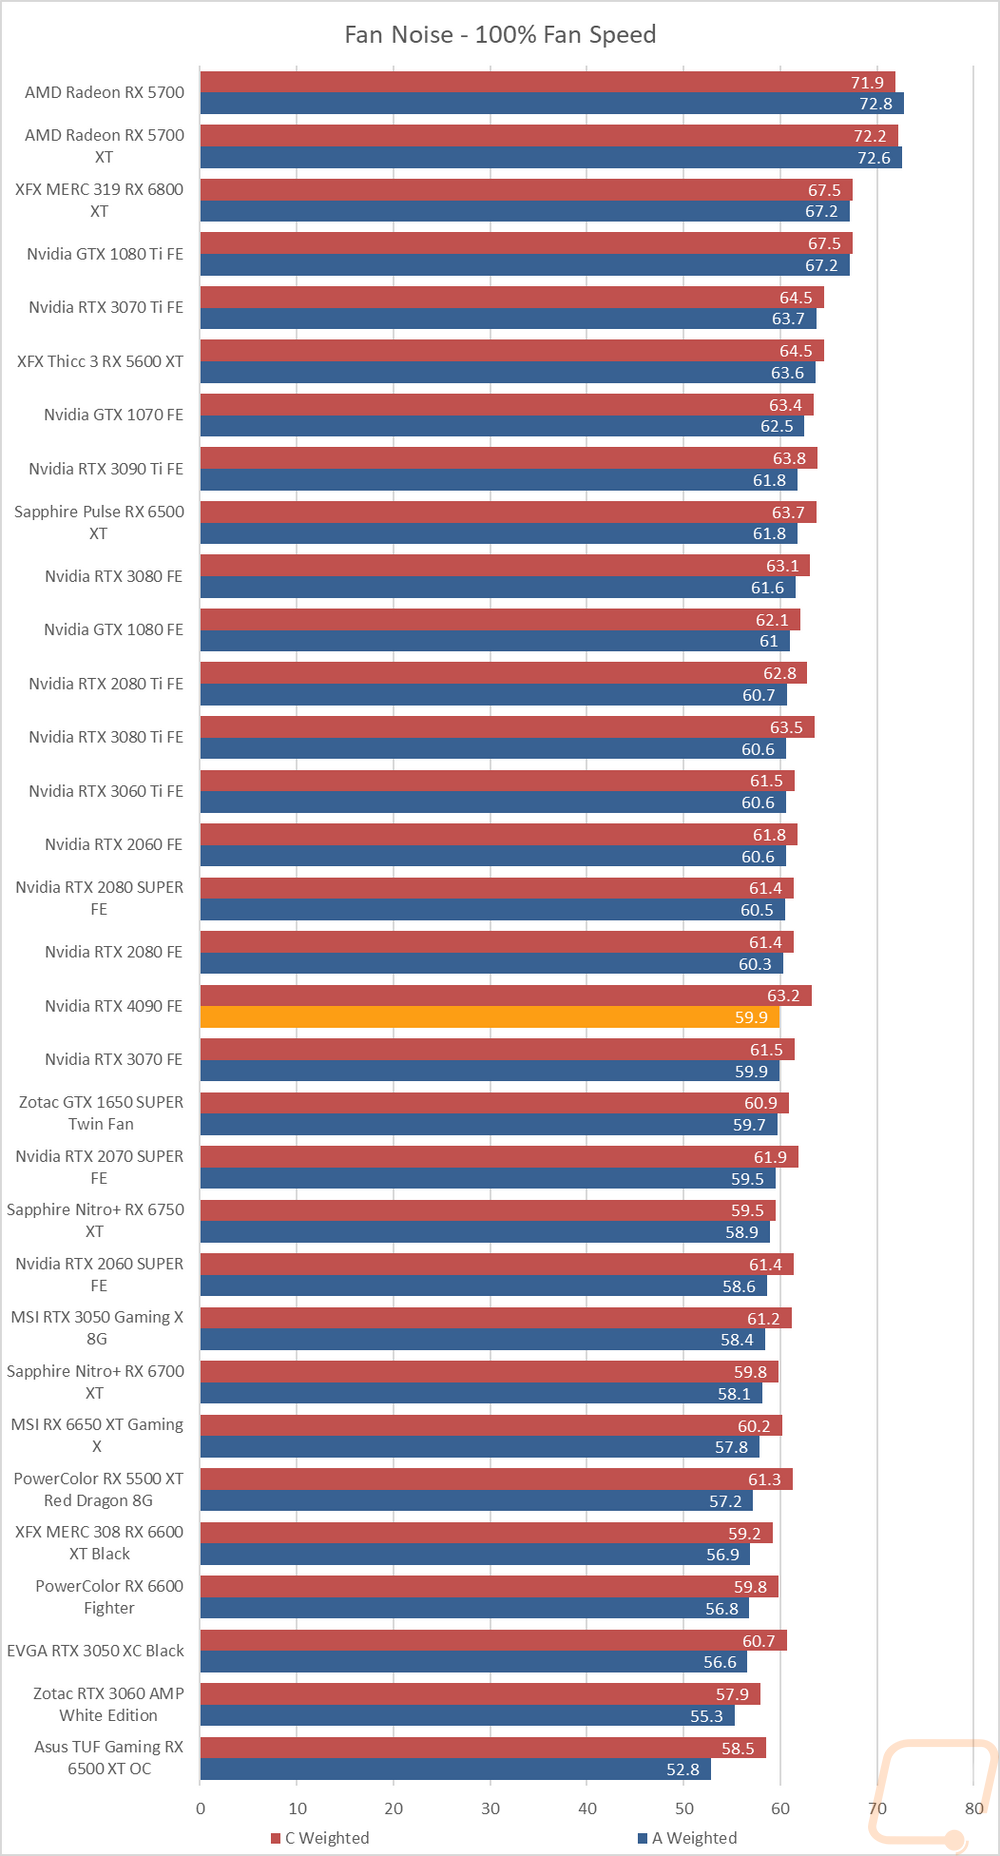
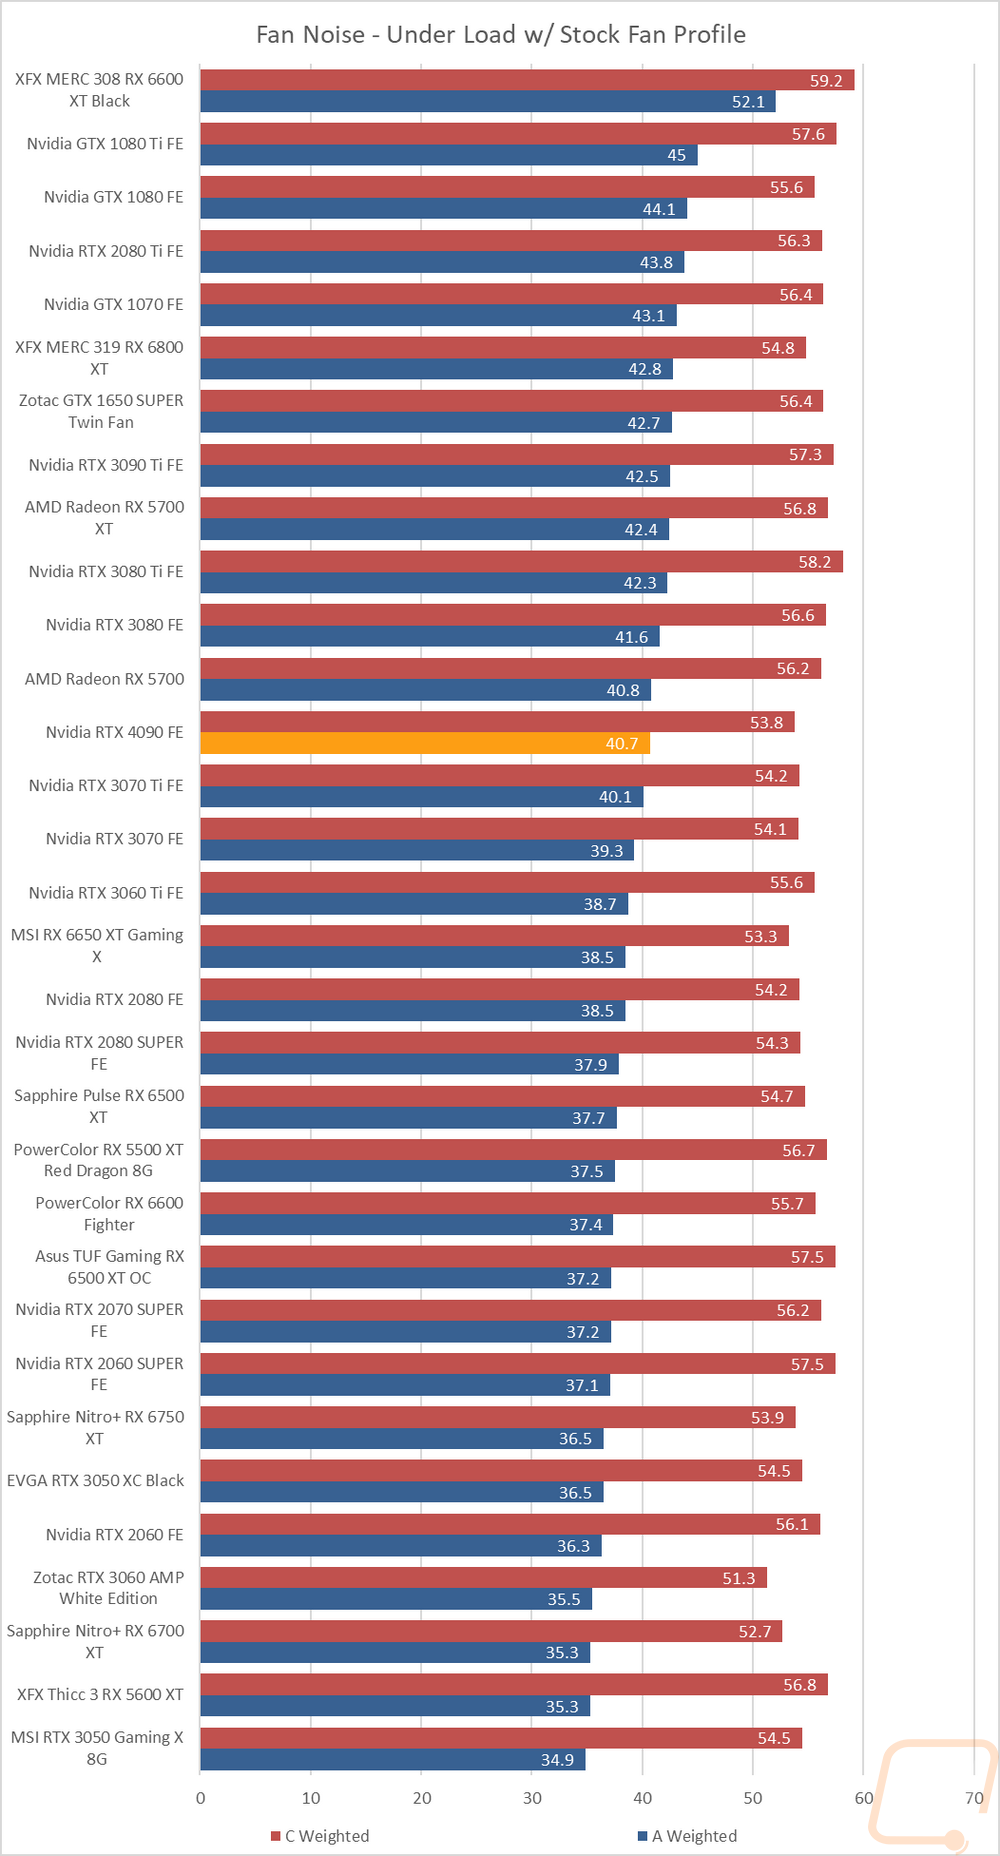
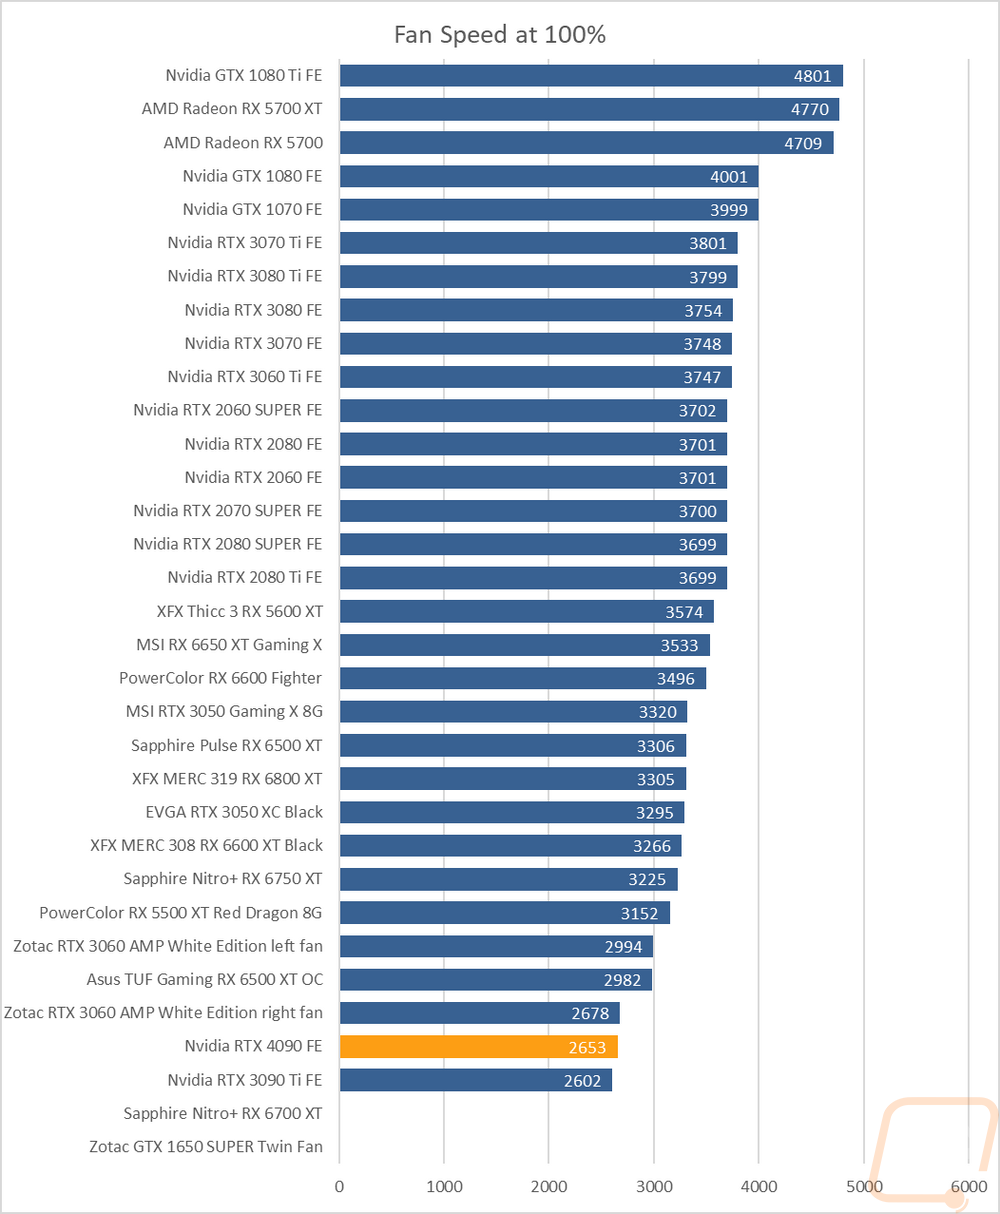
My next round of tests were looking at noise levels. These are especially important to me because I can’t stand to listen to my PC whirling. Especially when I’m not in game and other applications are using the GPU. For my testing, though I first tested with the fan cranked up to 100% to get an idea of how loud it can get, then again at 50% to get an idea of its range. I test using both A and C weighting, A is the standard way and C has a little more of the low end to check for low-level hums. The RTX 4090 Founders Edition fell in the middle of the pack in both the 50% and 100% fan speed tests with it being higher up in the 50% and lower middle in the 100%. The fan RPM graph at the end shows a little why that is the case as the 4090 FE has its two large fans spinning the slowest of any of the cards tested. That said given the total RPM it was noisier than it should have been. I also take a look at noise performance while under load. For that when running AIDA64’s stress test I wait until the temperature of the card has leveled off and then measure how loud things are when the card is at its worst-case scenario with the stock fan profile. Here the RTX 4090 Founders Edition did well for a high-end founders edition card with cards like the 3080 FE and 3080 Ti FE being 1-2 dB louder in the same situation.
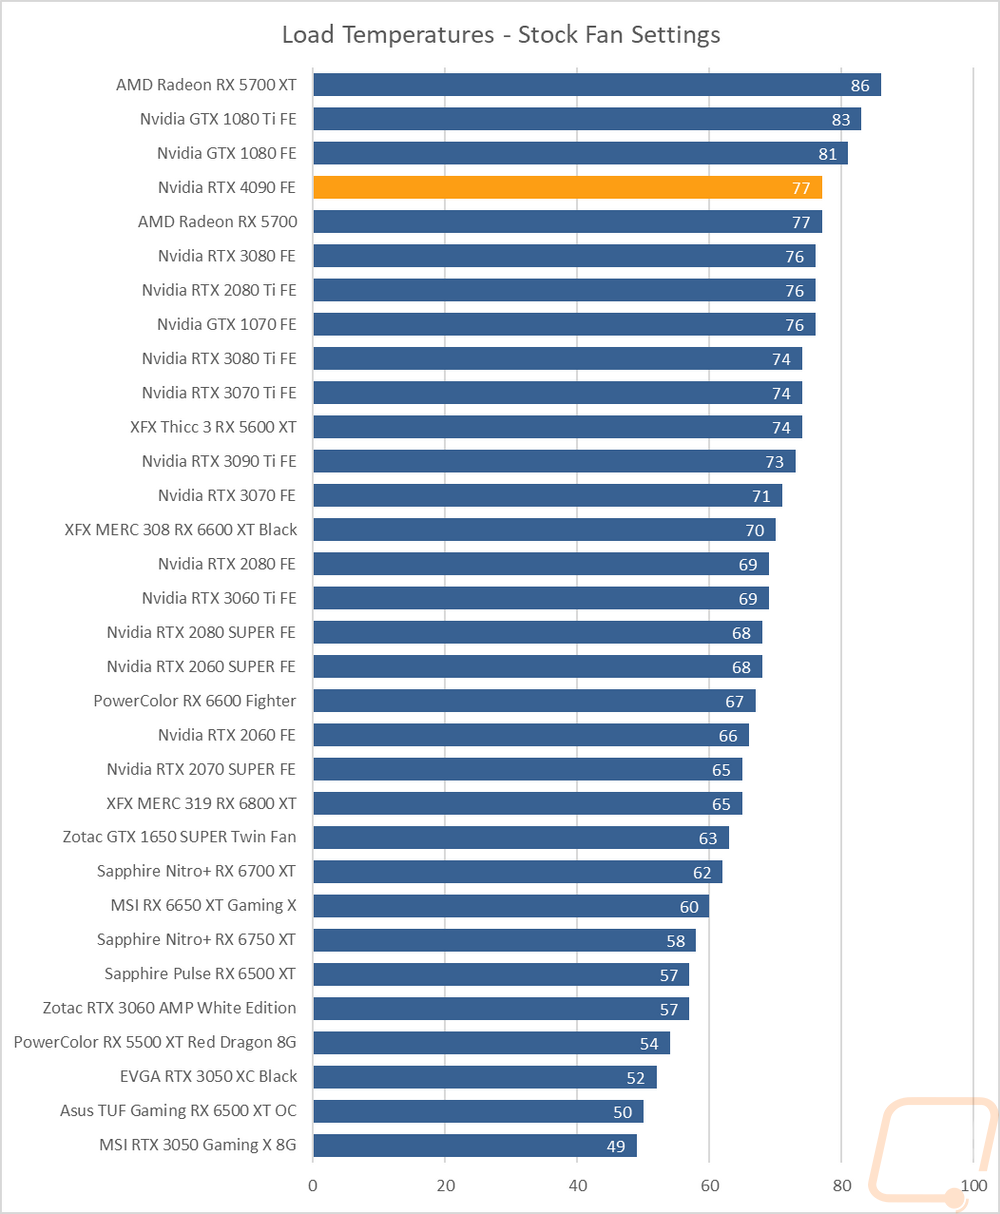
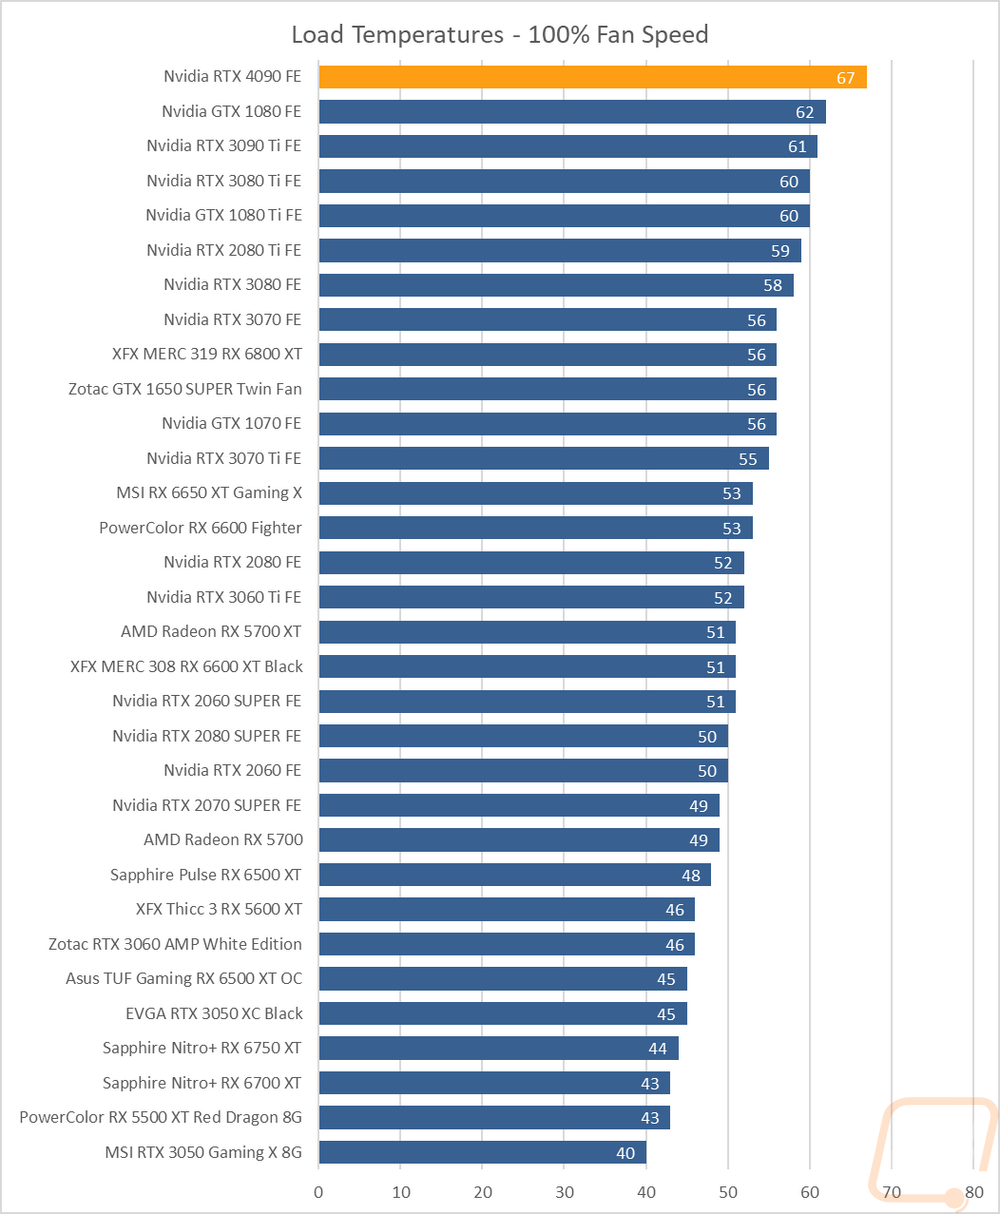
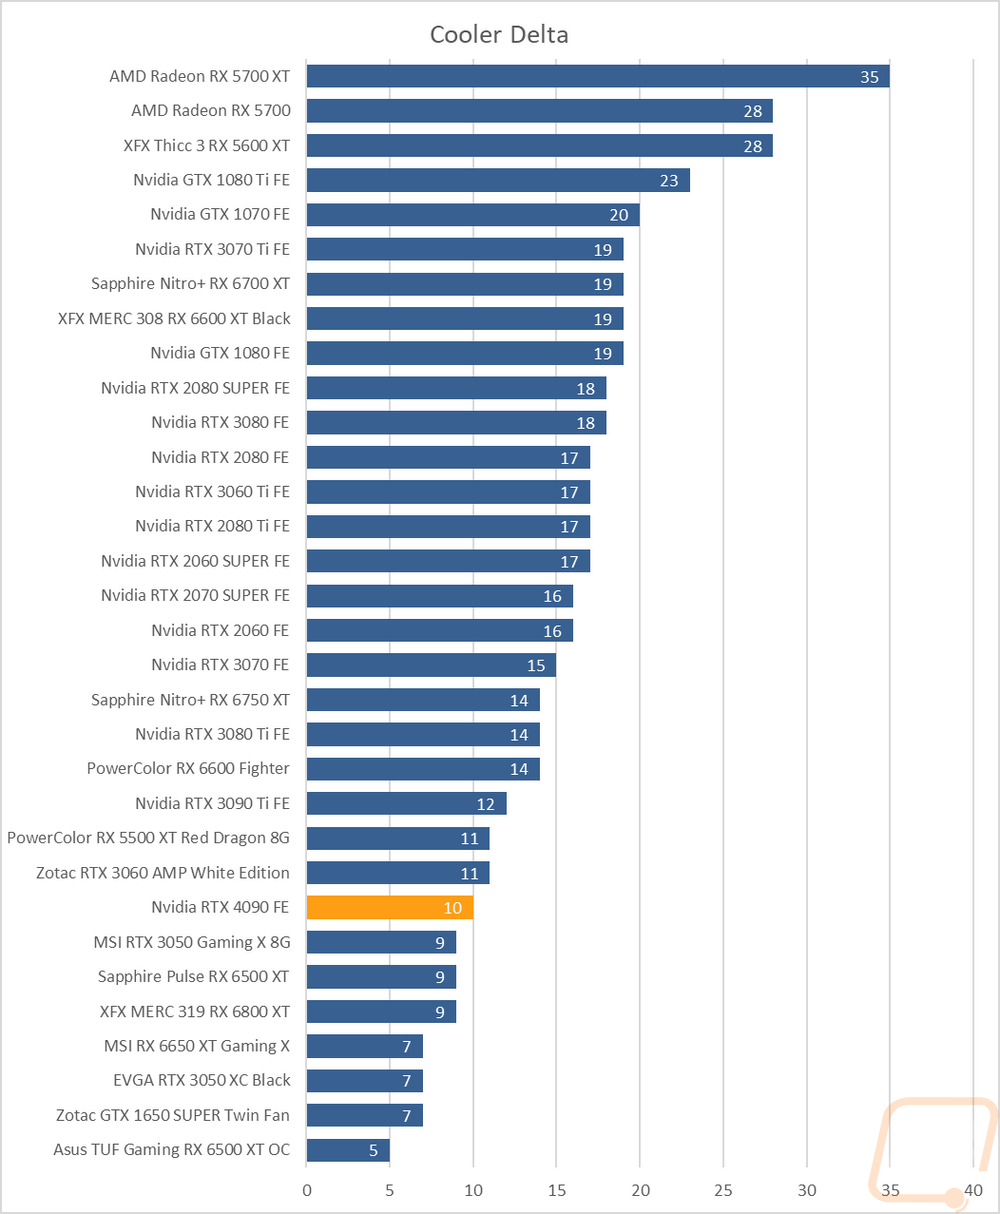
To finish up my testing I of course had to check out the cooling performance. To do this I ran two different tests. I used AIDA64’s Stress Test run for a half-hour each to warm things up. Then I documented what temperature the GPU leveled out at with the stock fan profile and then again with the fans cranked up to 100%. With the stock profile, the Nvidia RTX 4090 Founders Edition did better than I expected it to do given its power levels. I leveled off at 77c which is up in the top ¼ of our charts but is lower than cards like the GTX 1080 and 1080Ti did and just one degree above the RTX 3080. Then with the fans cranked up, the RTX 4090 Founders Edition cooled down but not nearly as much as any of the other cards I’ve tested in the past with it running 67c at full fan speed on both fans. This shows that while the cooler did great with the stock profile, there isn’t too much headroom left in it. I would say that Nvidia’s fan profile is spot on to offer good cooling while keeping the noise down relatively. Of course, if they ran the fans at similar speeds to past Founders Edition cards there would be more headroom left. The RTX 3090 Ti which is a similarly sized card was running cooler at 73c under load and 61c at 100% fan speed which means it had a little more headroom at 12c. While not on our charts I did also note the other temperatures as well with the GPU hotspot at 85c with the stock fan profile and 75c at 100% fan speed and the GPU memory at 66c with the stock fan profile and 54c with the fans cranked up.
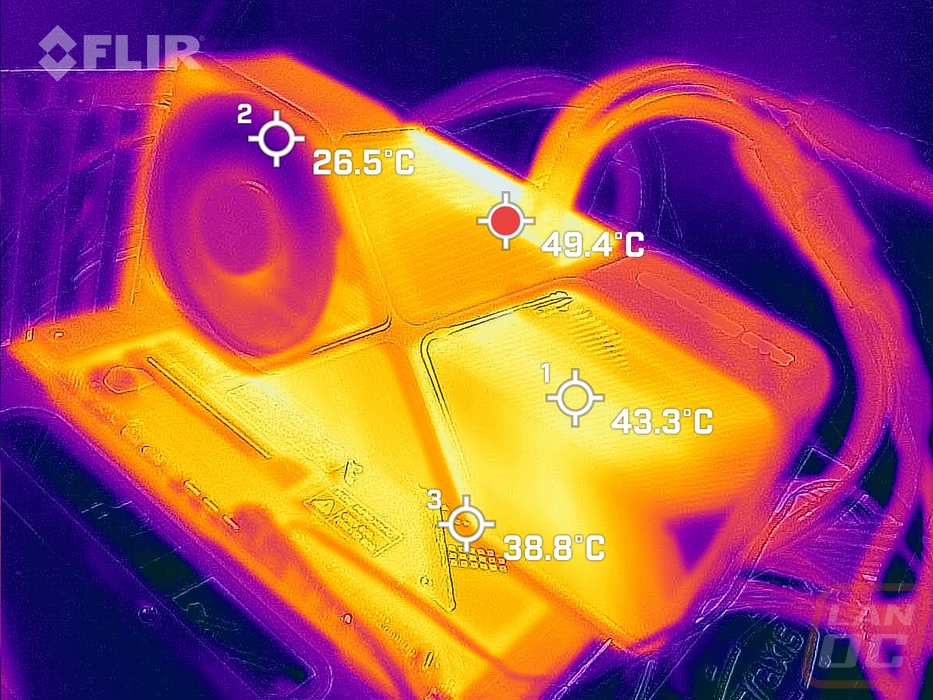
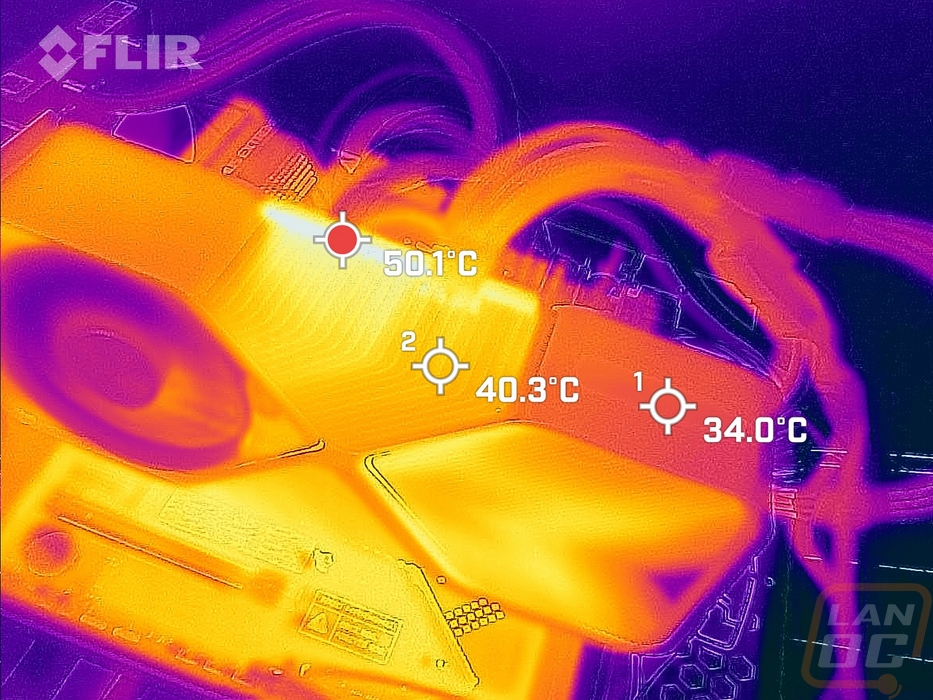
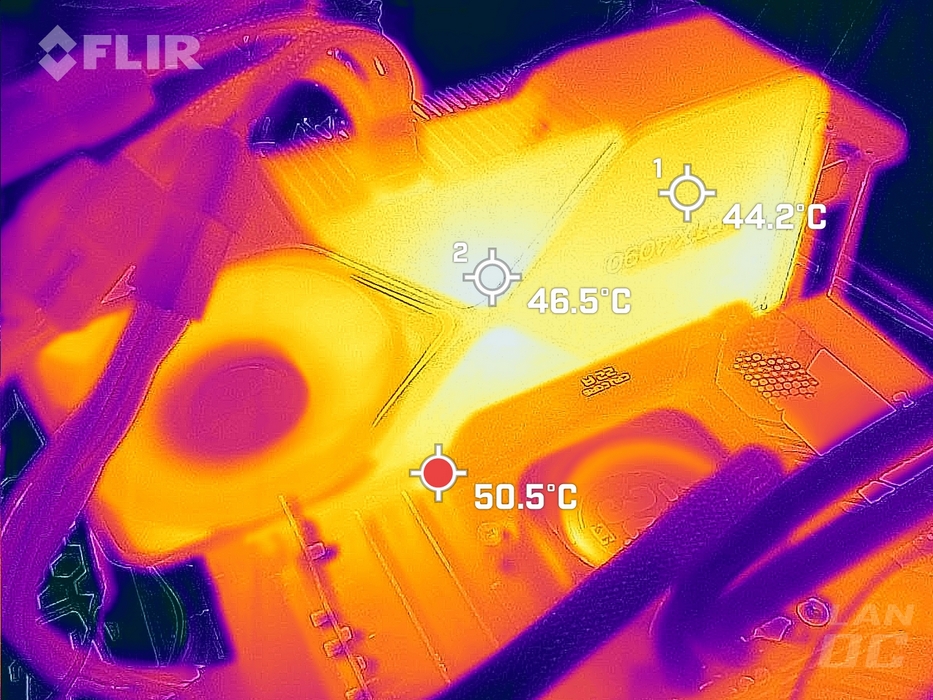
While running the stock fan profile testing I also took the time to get a few thermal images so we could see what is going on. The front side of the RTX 4090 Founders Edition has its hottest point at the top middle but the blow-through area is also warm which means that the heatpipes are doing a good job of pulling the heat out that direction. There is a small glimpse of some extra heat under the card and given its 3-slot design that wouldn’t be a big surprise but the design isn’t blowing too much down that direction to add to it so having your M.2 under the 4090 should be okay if your motherboard has a heatsink for it. The top view is the one area where we can get close to the PCB and that is the hottest area on the card. The center heatsink is getting more heat than the infinity loops on each side. Then at the back, the hottest area is off of the card on the motherboard just under the card but the center section and near the bottom of the front are the two hottest spots on the backplate.
Overall and Final Verdict
Every new generation of cards launched is exciting, but something about the launch of the Ada Lovelace-based 4000 Series from Nvidia feels different. I think it is because the 3000 series came out in the middle of the heart of the pandemic and before and after that we had card shortages that for a lot of people made the possibility of getting new cards impossible. This is the first time in a while where we have a new card coming out where it feels like if you are willing to spend the money you might be able to get a card without a fight. On top of that Nvidia has moved to the 4N manufacturing process and alongside the 4000 Series, they are also introducing DLSS 3 which has been long awaited. Now we still have a little while to wait for the new RTX 4080 cards but tomorrow the RTX 4090 becomes available so today's review has been focused on it. The RTX 4090 Founders Edition is Nvidia’s flagship card and much like with the RTX 3090 and RTX 3090 Ti the RTX 4090 Founders Edition stands out as that flagship on its size alone. Nvidia called the 3090 their BFGPU and that is the case here once again. The 4090 Founders Edition is three slots wide and is the only card that Nvidia brings out that they don’t keep restrained to a “standard” card size. The crazy thing though is that the Founders Edition card, as big as it is, is the small card compared to the aftermarket RTX 4090 lineup. So if you are hoping to run this card be sure to make sure to double check that it is going to fit in the case that you are planning.
Even with its crazy size, the RTX 4090 Founders Edition looks amazing. It shares the same styling as the previous generation of cards with the dual fan design split across two sides and a blow-through design. Nvidia has redone the cooling inside to be able to accommodate everything and the exterior does have touches here and there that are different like the slightly concaved shape around the edge and the 3090/3090 Ti were a little thinner where this card now fills out the full three slots completely. Being a Founders Edition card, the quality is still off the charts as well with everything being solid metal. The styling is still the cleanest and best-looking design out there in my opinion as well.
As far as performance goes, this is the biggest generation-to-generation jump in performance that I have ever seen. That performance jump was big enough that in a lot of our graphs, especially synthetic tests, it broke out graphs making it hard or impossible to see the performance numbers are cards on the lower end of the charts. This also lead to another issue in our in-game testing which was there somewhat on the RTX 3090 Ti as well, the RTX 4090 made everything tested at below 4k CPU limited which is impressive given the 12900K used for the CPU on our test bench. The reality is this is more video card than you need if you are gaming at 1080p or 1440p. It is just that big of a monster. But for situations like Blender, the 4090 nearly outperformed all three of the combined results of the RTX 3090 Ti with just its first render performance.
Alongside the 4000 Series, Nvidia is launching DLSS 3 and the DLSS 3 performance in all three games that I tested was impressive. DLSS Super Resolution in the past has managed to give 1440p-like frame rates or better while getting 4k detail levels but the addition of frame generation alongside it means that when running DLSS 3 the AI-focused tensor cores (which have been improved this generation even more) handle ¼ of rendering one frame and then the frame after is fully handled. In A Plague Tale, I saw the average FPS jump from 84 up to 192, and in Cyberpunk it from 93 up to 139. All of that is impressive, especially with the detail when looking frame by frame still looks great. But what I’m the most excited about is that because of frame generation, CPU-limited games see an even bigger jump which is an area in the past that no matter how powerful your video card is wont help. F1 2022 was a great example of this with it going from 92 up to 225 FPS and in Cyberpunk 2077 when I forced it to be CPU limited I saw a jump from 195 to 345. DLSS 3 will be helpful on the RTX 4090 for those CPU-limited situations and as we check out more of the 4000 Series in the future it will help even more.
Given just how impressive the performance of the RTX 4090 Founders Edition has been, its power draw does show that it is significantly more efficient than the last generation of cards. The Founders Edition also has improvements in smoothing out some of the peak power draw which put the RTX 3090 Ti at a higher peak draw but overall this thing is a monster and you are going to need a big power supply to power everything, especially once you combine it will a CPU powerful enough to keep from having everything CPU limited. Along with that, the new ATX 3 power supplies are finally coming out and they have the 12VHPWR cable needed to finally drop the dongles. Given that the RTX 4090 Founders Edition uses a four 8-pin to 12VHPWR dongle, being able to drop the dongle will mean less of a power cable mess.
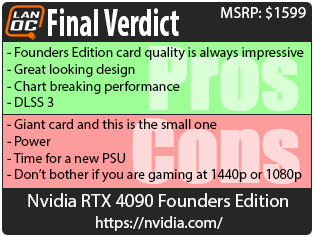
Pricing, of course, plays a big role in how we look at things, and the MSRP of the RTX 4090 Founders Edition is set to be $1599 and aftermarket cards will be higher than that. Like with the power situation, the RTX 4090 FE improves here compared to the launch MSRP of the RTX 3090 Ti which was $1999 and the original RTX 3090 was $1499 but pricing at that point was all over the place with much lower-end cards selling for those prices as well at the peak. Make no mistake, at $1599 the RTX 4090 Founders Edition is expensive and frankly more than I would most likely ever be able to afford. But I also don’t know that I would call it a bad value. That said, it makes me even more excited to see what the performance of 4000 series cards will look like as we eventually get down into the prices that the average person would be able to afford, especially once you add DLSS 3 into the mix.

Live Pricing: HERE


