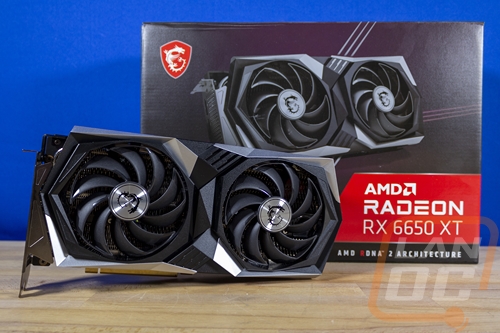
Today is the day for AMDs long rumored partial refresh of their GPU lineup. They have introduced the RX 6650 XT, RX 66750 XT, and the RX 6950 XT. This allows them to bump up their high end and bolster their competition in the mid-range. This also means loads of options in aftermarket cards. So to start off our coverage today I’m going to check out the RX 6650 XT Gaming X from MSI to check out how the new 6650 XT performs and to check out MSI’s Gaming X. Let’s put it through our test suite and see how it does!
Product Name: MSI RX 6650 XT Gaming X
Review Sample Provided by: MSI
Written by: Wes Compton
Amazon Affiliate Link: HERE
What’s the refresh all about?
Similar to the Ryzen CPU refresh that just recently happened, the Radeon refresh is taking a look at the current lineup making just a few changes. AMD is launching three cards today, the RX 6650 XT, the RX 6750 XT, and the RX6950 XT. They fill in a few gaps but it isn’t across the entire lineup. The RX 6650 XT which is what we are looking at in this review here soon sits between the 6600 XT and the 6700 XT. I’m surprised that it isn’t just the RX 6700 but the 6X50 fits with the rest of the refresh. The RX 6750 sits above the 6700 XT and below the RX 6800 and then of course the flagship RX 6900 XT now has a big brother with the RX 6950 XT.
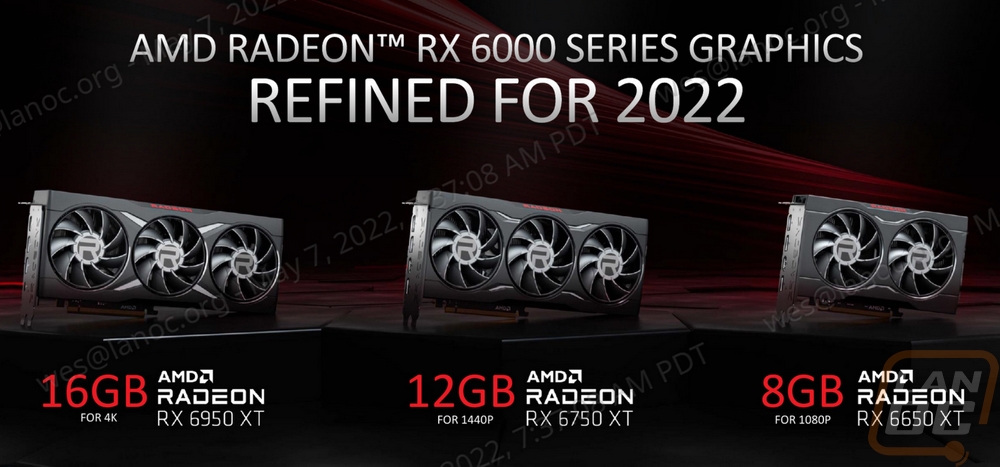
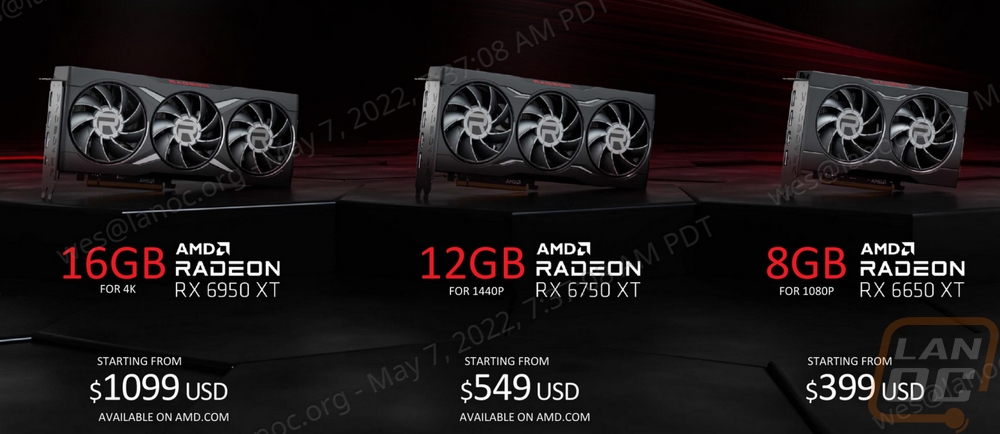
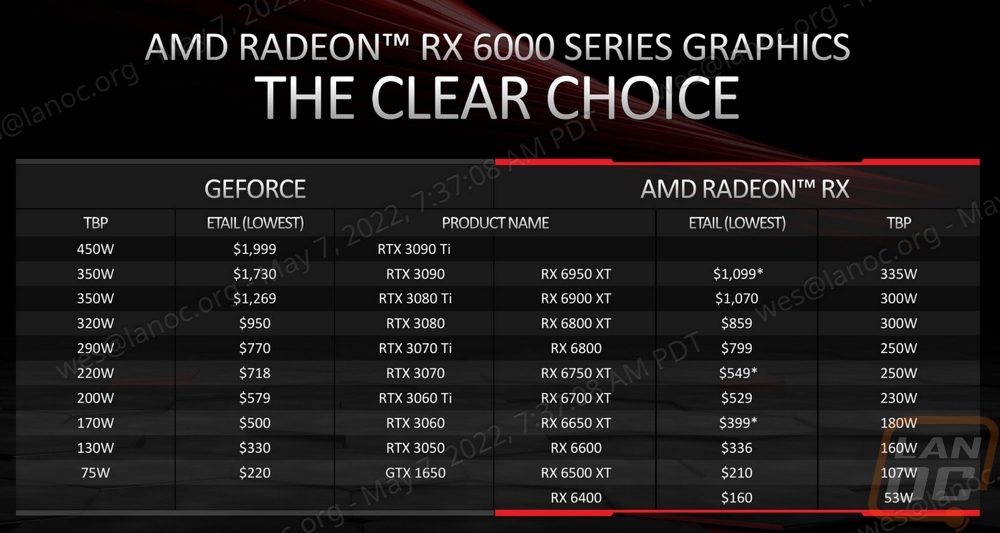
AMD also put together a nice table showing their entire lineup with the new cards. With the three new cards, only one card from the lineup has gone away. They no longer have the RX 6600 XT, it is now the RX 6600 < RX 6650 XT < RX 6700 XT. The 6650 XT has a starting price of $399, the 6750 XT starts at 549, and the 6950 XT starts at 1099.
So what has changed with the new cards? Well, all three GPUs are based on the same GPU die as the previous model which you can see in the specifications I have below. The die size and transistor count for the 6600 XT and the 6650 XT are the same, same with the 6700 XT and the 6750 XT and the 6900 XT and the 6950 XT. Compute units are the same as well as stream processors. It is the clock speeds that have changed. The 6650 XT is running at 2410 MHz vs the 2359 MHz of the 6600 XT for game clock and up to 2635 MHz vs 2589 MHz. The 6750 XT is at 2495 MHz for its game clock whereas the 6700 XT is 2424 MHz and up to 2600 MHz for the boost clock for the 66750 XT vs 2581 MHz on the 6700 XT. Same with the 6950 XT which now runs at 2100 MHz game clock vs 2015 MHz on the 6900 XT and up to 2310 MHz for the boost clock on the 6950 XT vs 2250 MHz on the 6900 XT. This does change some of the performance numbers in the specs but Infinity Cache and memory are also the same. The extra clock speed does mean that the new cards have a higher board power. The 6650 XT runs at 180W vs 160W on the 6600 XT, the 67850 XT is 250W vs 230W on the 6700 XT, and the 6950 XT is 335W vs 300W on the 6900 XT.
|
Specifications |
RX 6600 XT |
RX 6650 XT |
RX 6700 XT |
RX 6750 XT |
RX 6900 XT |
RX 6950 XT |
|
Architecture |
RDNA 2 |
RDNA 2 |
RDNA 2 |
RDNA 2 |
RDNA 2 |
RDNA 2 |
|
Manufacturing Process |
7nm |
7nm |
7nm |
7nm |
7nm |
7nm |
|
Transistor Count |
11.1 Billion |
11.1 Billion |
17.2 Billion |
17.2 Billion |
26.8 Billion |
26.8 Billion |
|
Die Size |
237 mm² |
237 mm² |
335 mm² |
335 mm² |
520 mm² |
520 mm² |
|
Compute Units |
32 |
32 |
40 |
40 |
80 |
80 |
|
Ray Accelerators |
32 |
32 |
40 |
40 |
80 |
80 |
|
Stream Processors |
2048 |
2048 |
2560 |
2560 |
5120 |
5120 |
|
Game GPU Clock |
2359 MHz |
2410 MHz |
2424 MHz |
2495 MHz |
2015 MHz |
2100 MHz |
|
Boost GPU Clock |
Up to 2589 MHz |
Up to 2635 MHz |
Up to 2581 MHz |
Up to 2600 MHz |
Up to 2250 MHz |
Up to 2310 MHz |
|
Peak Single Precision Performance |
Up to 10.6 TFLOPs |
Up to 10.79 TFLOPS |
Up to 13.21 TFLOPs |
Up to 13.31 TFLOPS |
Up to 23.04 TFLOPs |
Up to 23.65 TFLOPS |
|
Peak Half Precision Performance |
21.21 TFLOPs |
Up to 21.59 TFLOPS |
Up to 26.43 TFLOPs |
Up to 26.62 TFLOPS |
Up to 46.08 TFLOPs |
Up to 47.31 TFLOPS |
|
Peak Texture Fill-Rate |
Up to 331.4 GT/s |
Up to 337.3 GT/s |
Up to 413.00 GT/s |
Up to 416.0 GT/s |
Up to 720.00 GT/s |
Up to 739.2 GT/s |
|
ROPs |
64 |
64 |
64 |
64 |
128 |
128 |
|
Peak Pixel Fill-Rate |
Up to 165.7 GP/s |
Up to 168.6 GP/s |
Up to 165.20 GP/s |
Up to 166.4 GP/s |
Up to 288.00 GP/s |
Up to 295.7 GP/s |
|
AMD Infinity Cache |
32 MB |
32 MB |
96 MB |
96 MB |
128. MB |
128. MB |
|
Memory |
8GB GDDR6 |
8GB GDDR6 |
12GB GDDR6 |
12GB GDDR6 |
16GB GDDR6 |
16GB GDDR6 |
|
Memory Interface |
128-bit |
128-bit |
192-bit |
192-bit |
256-bit |
256-bit |
|
PCIe Interface |
PCIe 4.0 x8 |
PCIe 4.0 x8 |
PCIe 4.0 x16 |
PCIe 4.0 x16 |
PCIe 4.0 x16 |
PCIe 4.0 x16 |
|
Board Power |
160W |
180W |
230W |
250W |
300W |
335W |
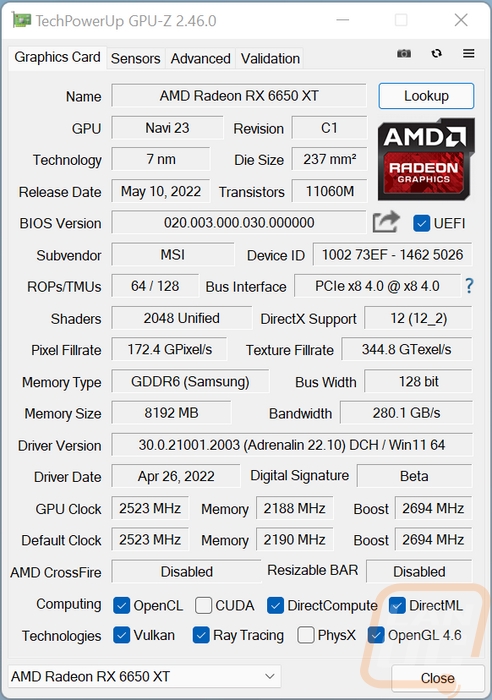
Before getting into testing I did also run GPUz to double-check that our clock speeds match up with the specifications. For the MSI 6650 XT Gaming X, it has an overclock. The stock 6650 XT boost clock was up to 2635 MHz but our card is running at 2694 MHz with the default clock at 2523 MHz vs 2410 MHz for stock. GPUz also helps document the driver I tested on which was the driver provided to press for the launch and our BIOS revision as well for future reference.
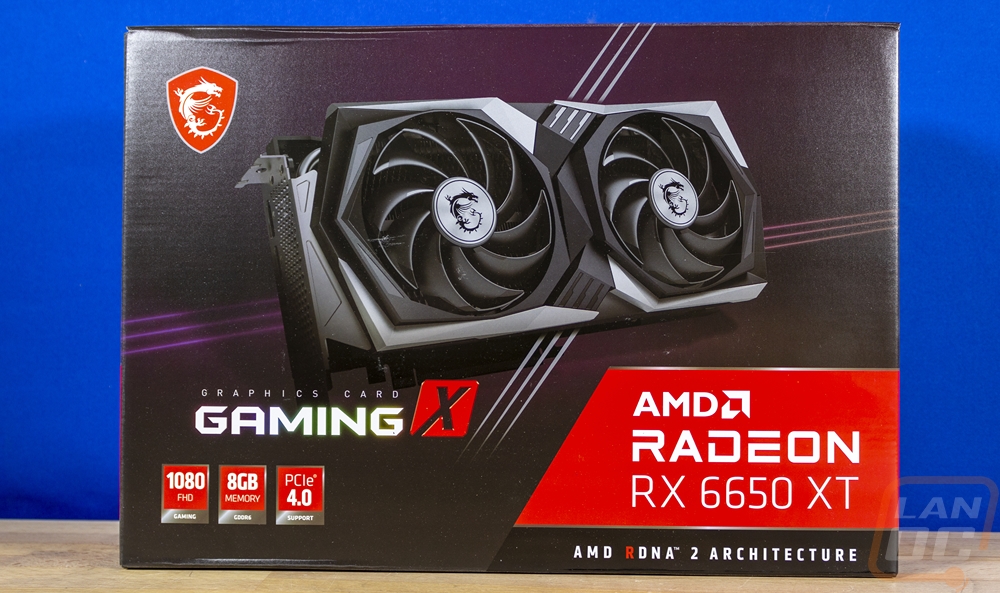
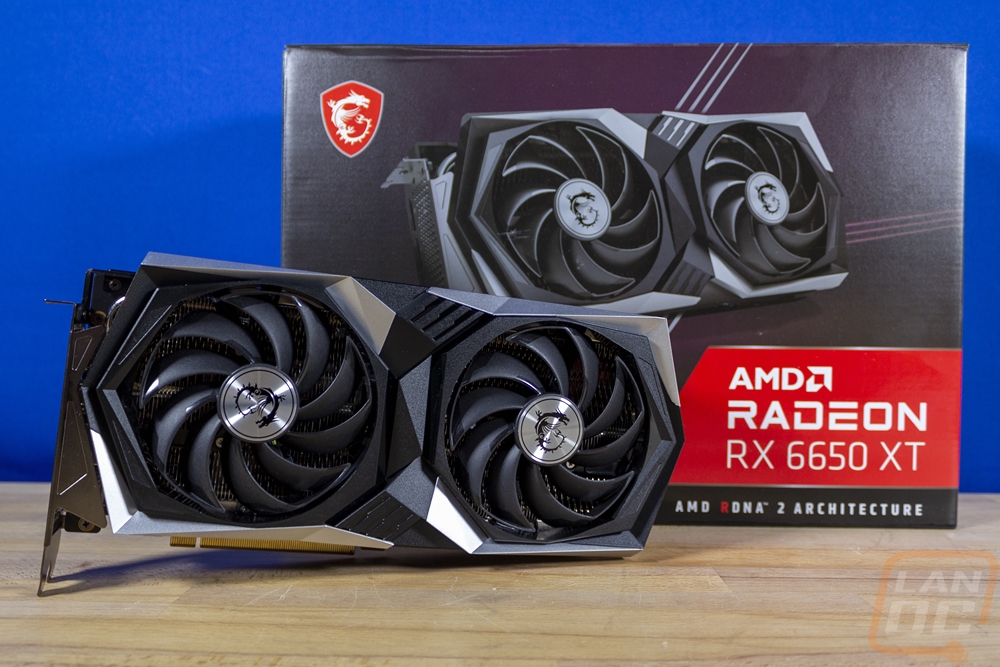
Packaging
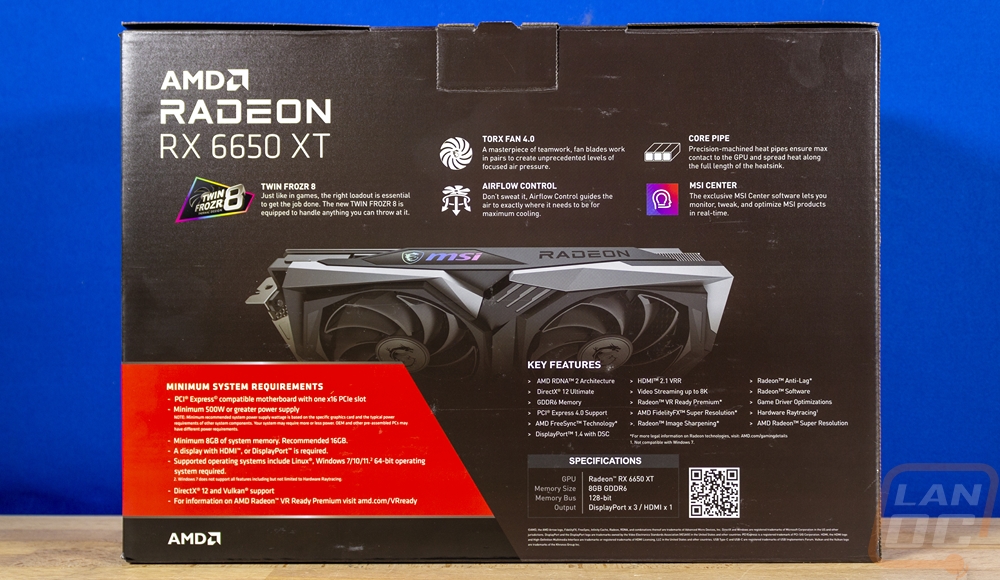
The packaging for the 6650 XT Gaming X looks the same as the last few Gaming X cards we have had come in. The background is black with a touch of pink/purple from the lines across used to line up with the accent marks on the card. Then they have a large picture of the card that takes up most of the front of the box. This is huge because when you show in retail, being able to see exactly what you are buying is helpful and a lot of video cards don’t do this. MSI’s Gaming dragon logo is in the top left and then below the card they have the Gaming X branding keeping the branding simple and without it repeating at all. The bottom right has the red wrap around which has the AMD Radeon logo as well as the RX 6650 XT model name. Around on the back of the box, MSI has used the space to include another picture of the card and in the top half, they try to talk about a few of their features like their twin frozr 8 cooler, the torx fan 4.0, core pipe heatpipes, and how they control the airflow. The bottom half of the back just continues AMDs wrap around with the basic system requirements and AMD’s features along with an extremely basic specification listing. I would love to see these specs expanded on a little to include the card's clock speed and the card dimensions because those are two things if shopping in retail that would be important to be able to check.
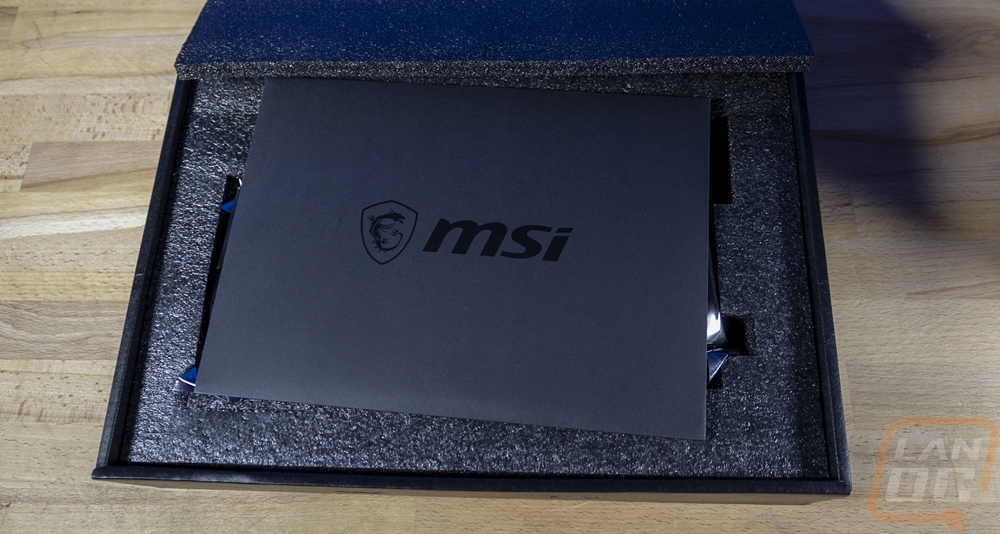
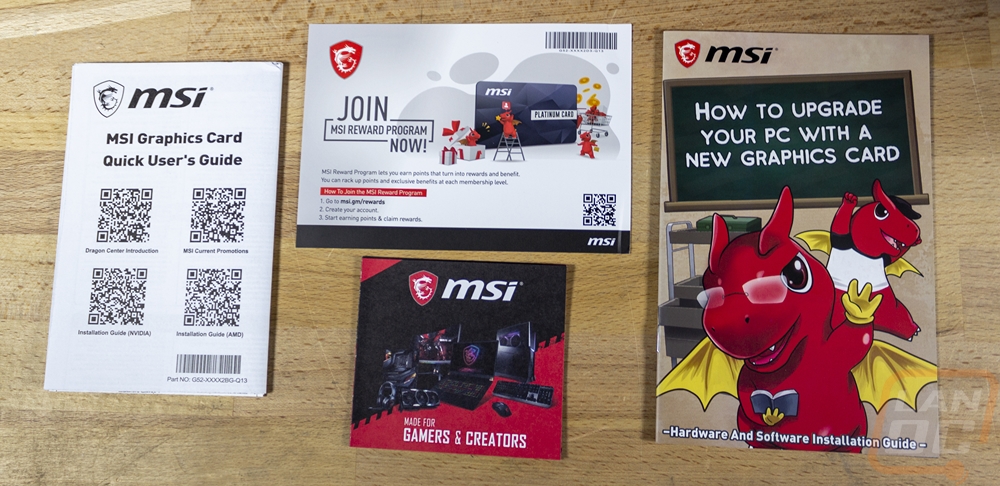
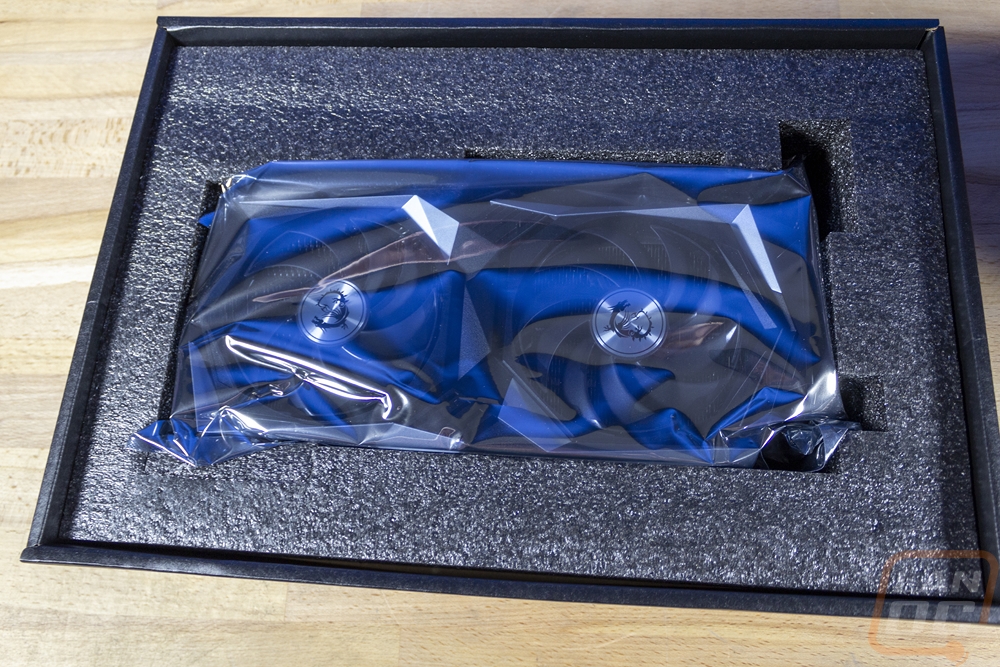
Inside the box, MSI has a thick cardboard tray filled with foam. This has the 6650 XT Gaming X wrapped in its static protective bag inside the foam. Then with a layer of foam above that as well. MSI has all of the documentation inside the MSI branded envelope. None of that is specific to this card. You get a user guide as well as a comic that shows how to install your video card using the MSI dragon. Then they have a rewards program card and a small card that shows MSI’s wide range of products.
Card Layout and Photos
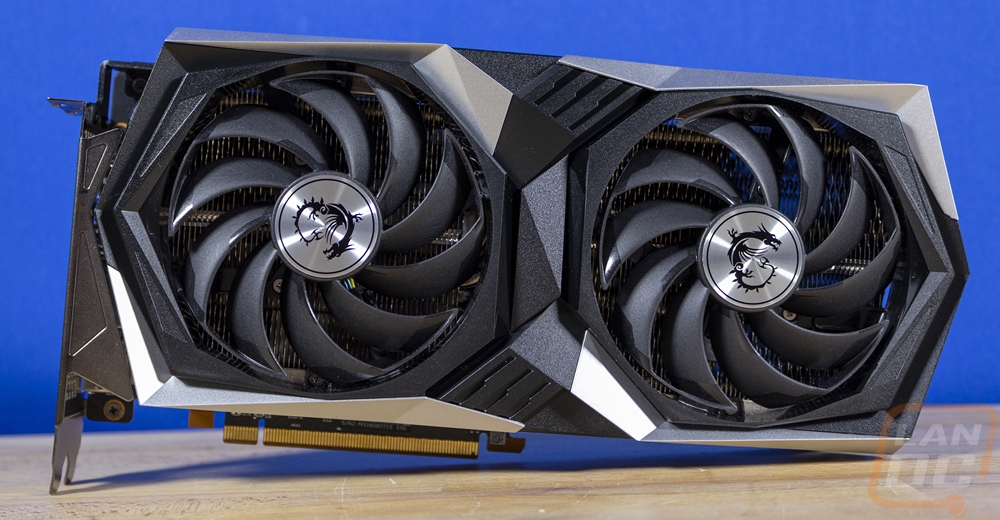
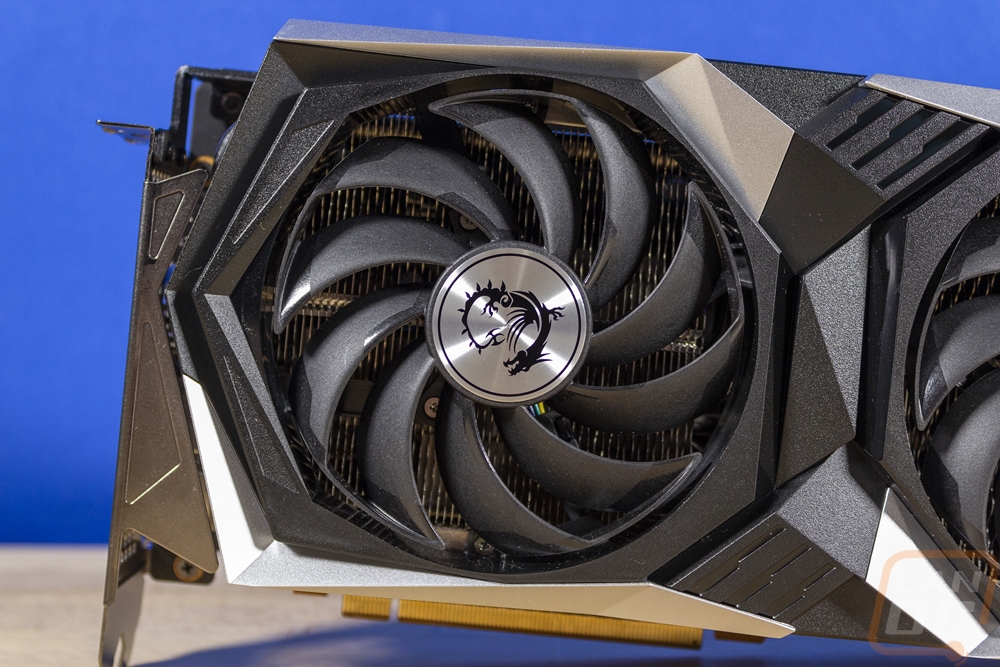
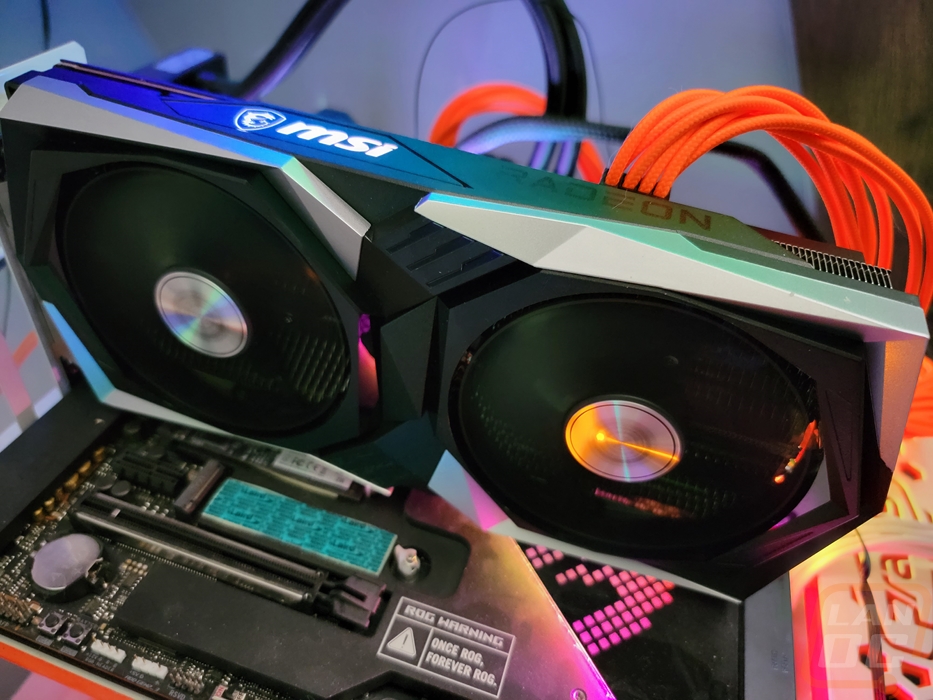
MSI’s 6650 XT Gaming X hasn’t changed anything up styling-wise for the refresh. So, much like the 6600 XT Gaming X, it has a dual fan configuration and the plastic fan shroud around the fans that is loaded up with angles and shapes. Around each fan rather than a round hole the shroud has an angular shape at least on the side facing out, the hole is round on the sides towards the other fan. Beyond that the same angular design wraps around the fan with another layer, it’s a lot like the roof of Mercedes-Benz Stadium in Atlanta where it opens up. MSI has a mix of black and silver to give more contrast as well then in the center between the fans, the shapes are stacked on each other with groves cut in at the top and bottom. Some of the higher-end Gaming X cards have those groves backlit, but for the 6650 XT Gaming X, there isn’t any RGB lighting on this side of the card.
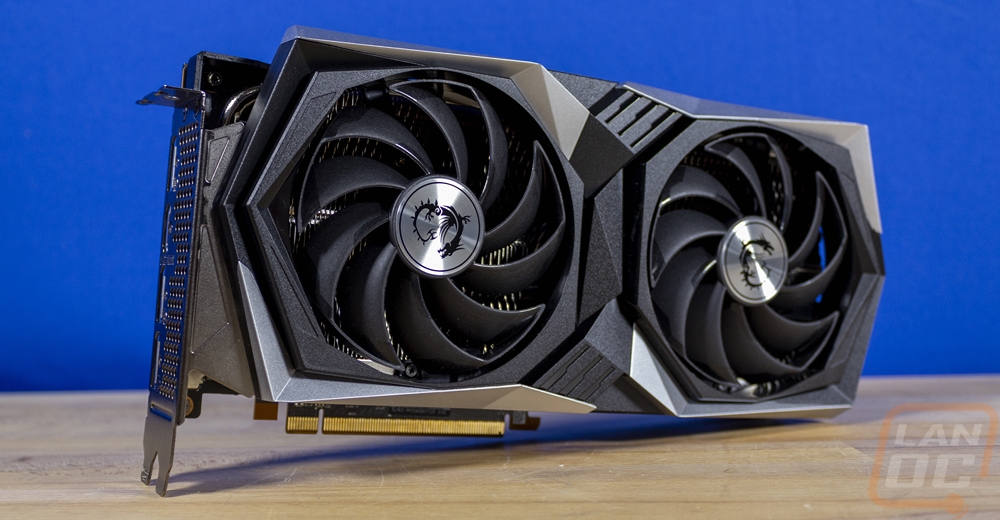
Both fans at 95mm wide and the Torx 4.0 fans have 10 blades with every other blade paired up together at the end. It gives a similar look at performance to a fan design with a full ring on the outside, but with less material used which means less weight. The fans blow down into the heatsink which when we look through the fans we can see that the Twin Frozr 8 design has ripples along the top of each heatsink blade. MSI says that these help unwanted airflow harmonics to cut down noise, they also grab air and pull it down into the heatsink. The heatsink layout is vertical so air blowing down into it will be going out of the top and bottom of the card.
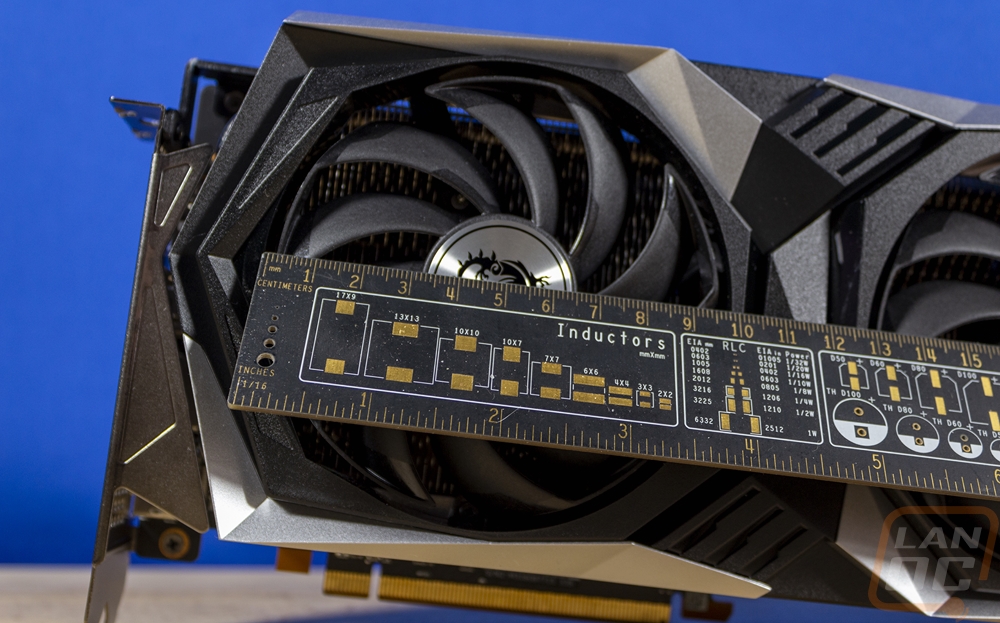
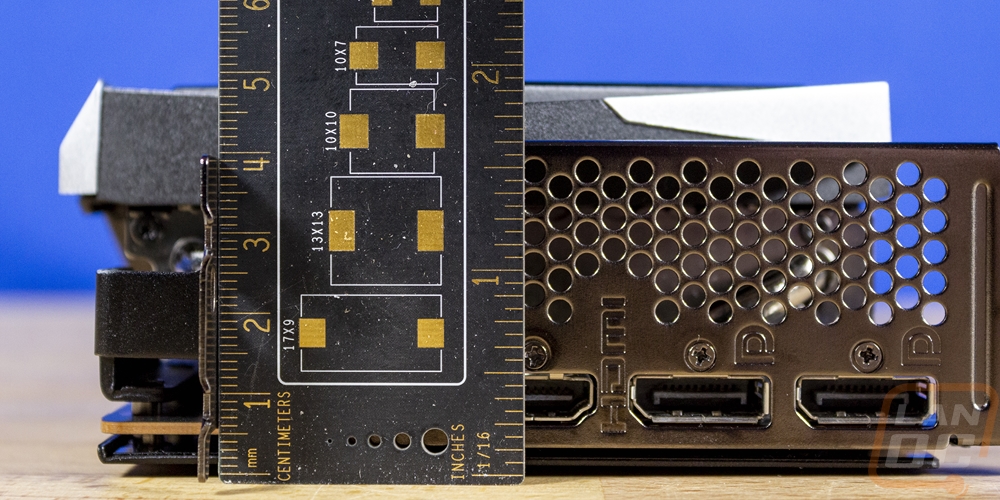
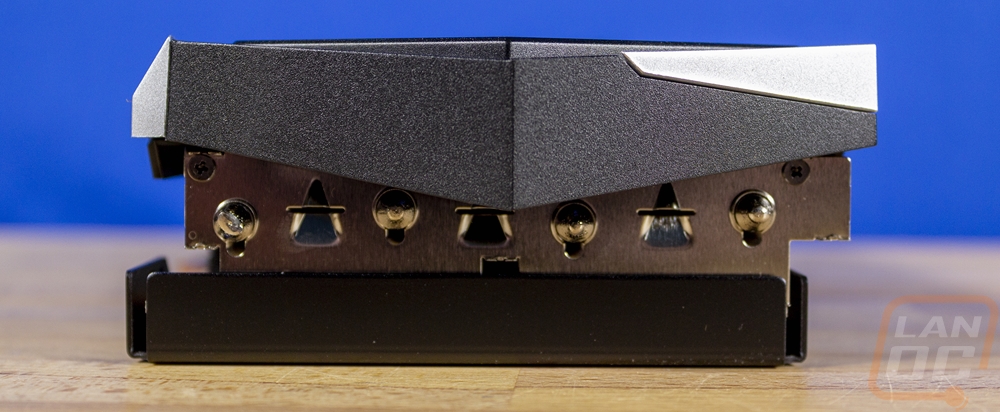
The 6650 XT Gaming X isn’t a huge card, but it does come in over the “standard” sized PCI card. For slots its PCI bracket is a dual slot bracket but as you can see the cooler itself sticks out past that for a 2.5-3 slot configuration. The height of the card is also past the top of the PCI bracket as well by 24mm when you include the fan shroud that sticks up past the support bracket in the picture below. The overall length of the 6650 XT Gaming X is 277mm as well.
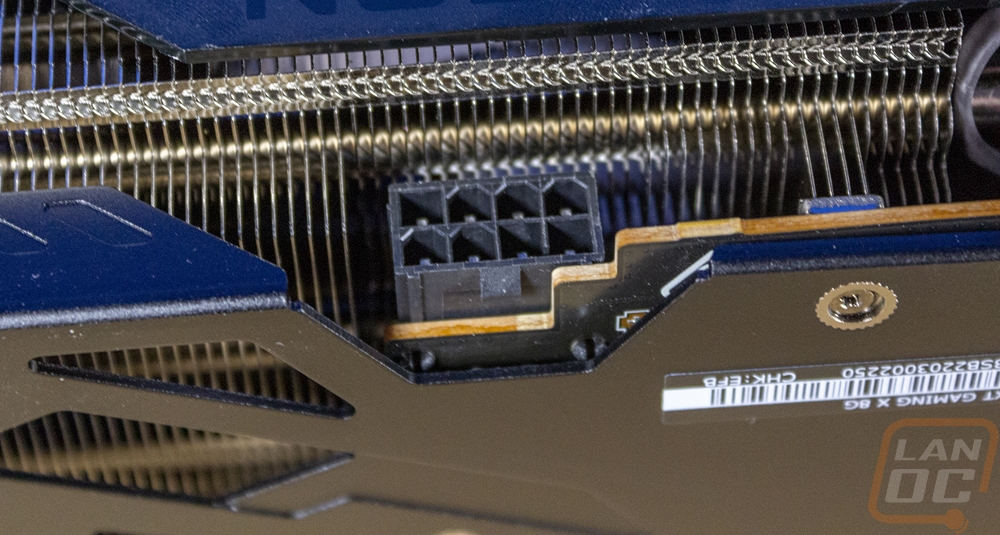
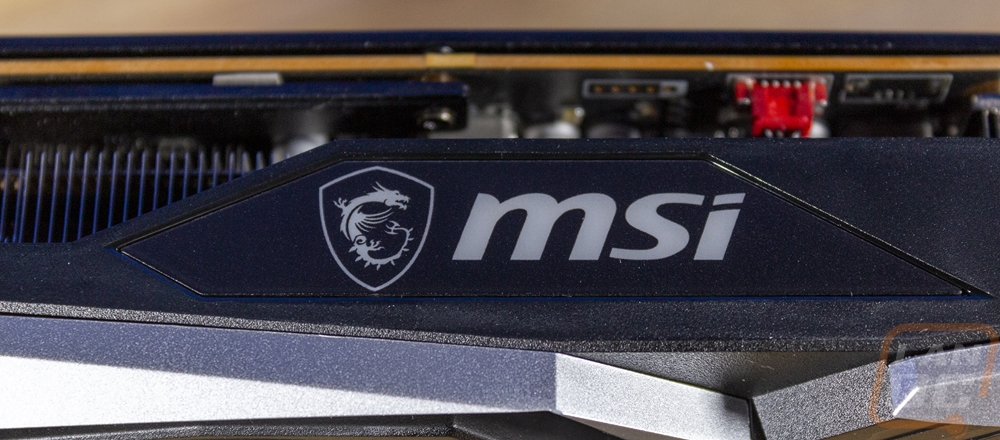
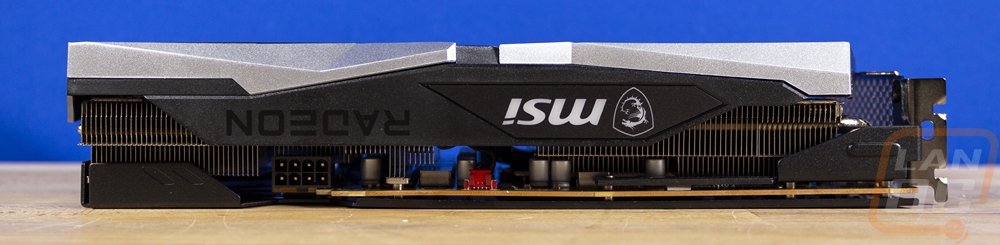
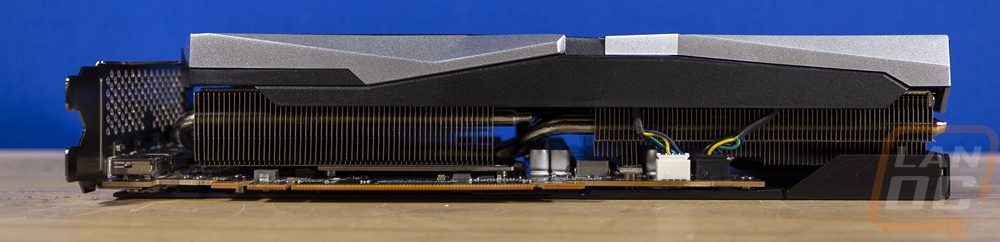
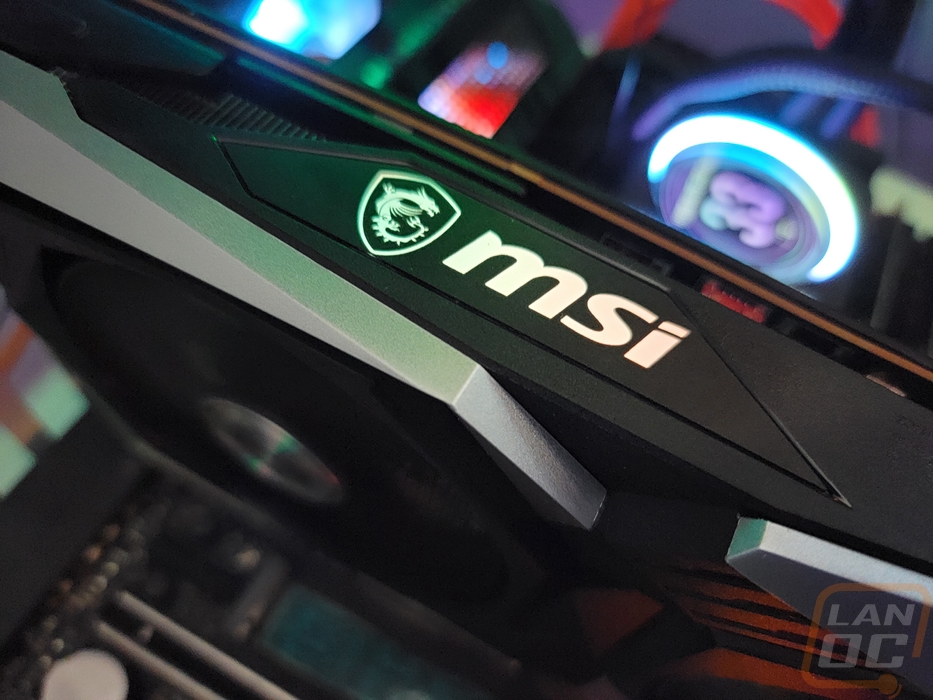
The top edge of the 6650 XT Gaming X has the power connection which is down at the end of the shorter PCB. The 6650 XT Gaming X has an 8-pin power and the connection is flipped around with the clip on the PCB side with the PCB notched to fit it, this allows the heatsink to sit tighter up against this area without getting in the way of removing or plugging the cable in. Also on the top edge, the plastic fan shroud wraps around in the center area to partially cover up the heatsink and MSI has included a backlit RGB MSI logo. Even with the shroud wrapped around here, you can see that there is still a big gap for airflow to come out as well.
Looking around at the edges of the 6650 XT Gaming X we can better see how the fan shroud wraps around the top and bottom of the card but still has a large gap to allow the airflow of the vertical heatsink layout to blow air out of the top and bottom. We can also see that the heatsink fits tight up against most of the PCB and down at the end where the PCB ends the heatsink is packed into that area to take advantage of the extra airflow that it provides. The end of the 6650 XT Gaming X gives us a peek at the four heatpipes as does the bottom view which lets us see how MSI has the heatpipes doubled up on the left side of the card. The heatpipes drop down with their core-pipe design that squares the pipes off on the GPU to get the best contact surface. They go to the left and have a 180 to run through that same section again up near the top of the heatsink.
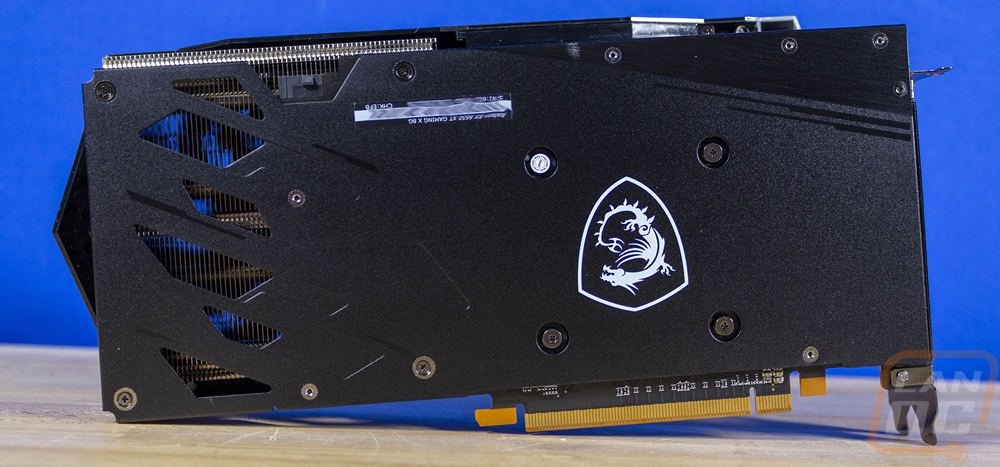
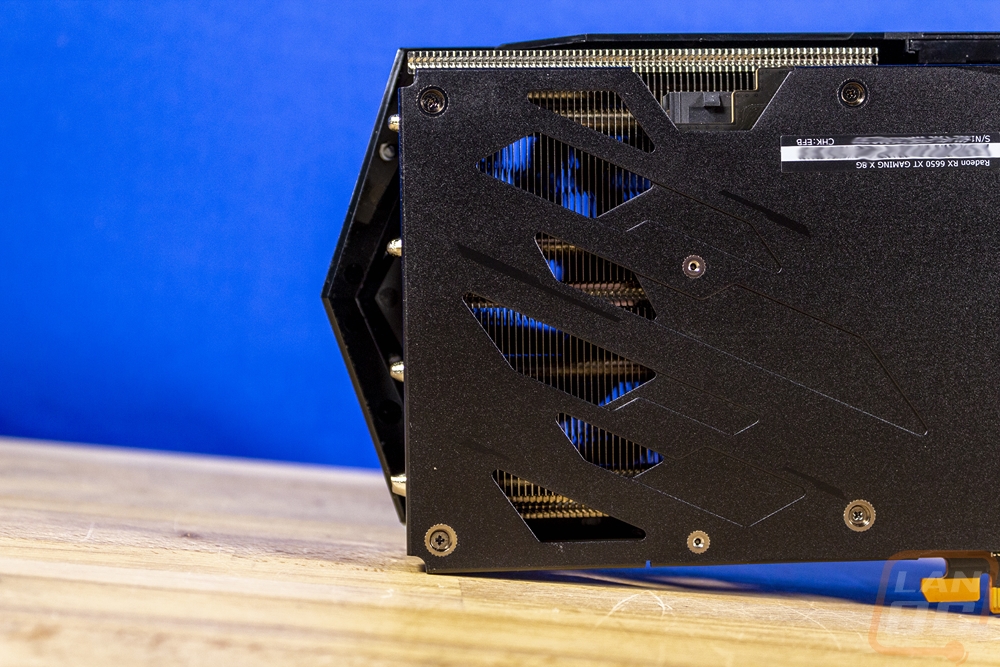
The 6650 XT Gaming X has a full-length metal back plate to give the card extra strength and prevent sag. It also helps keep the card itself protected when being handled as well. The backplate is black with a textured finish except for the top right corner which has a brushed finish and the black looks even darker. They have the MSI Gaming dragon logo sitting on the back of the GPU in a bright white and upside down so it is visible when installed in a PC and the back of the card is also where you will find your serial number on a sticker along with the model info as well. The backplate is notched down where the power plug is and because the card's PCB ends before the cooler there are angular holes cut in the backplate as well for airflow allowing some of the end fan's airflow to blow through the cooler and right out the back.
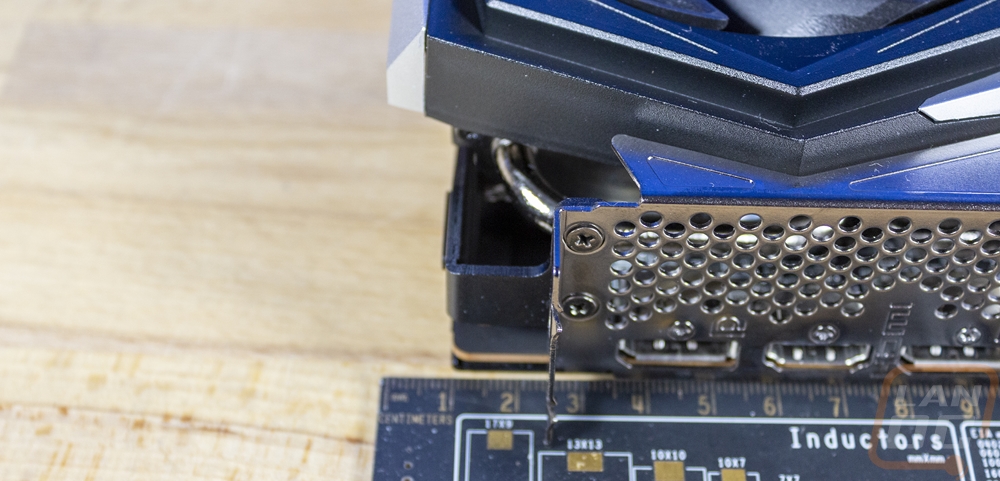
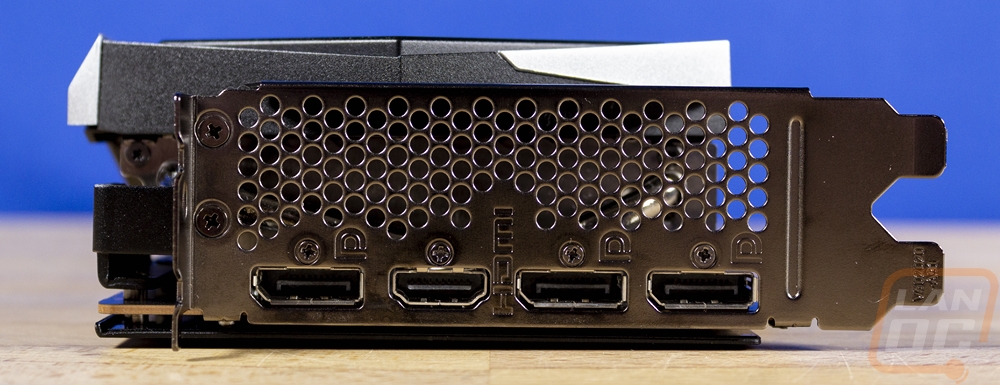
On the PCI bracket end of the 6650 XT Gaming X, the card's PCI bracket has the standard chromed finish. 2/3 of the bracket is filled with small ventilation holes which aren’t too needed with the cooling layout. Then for display connections, the card has the standard three DisplayPort and one HDMI layout with the HDMI sitting in the second position down from the top.
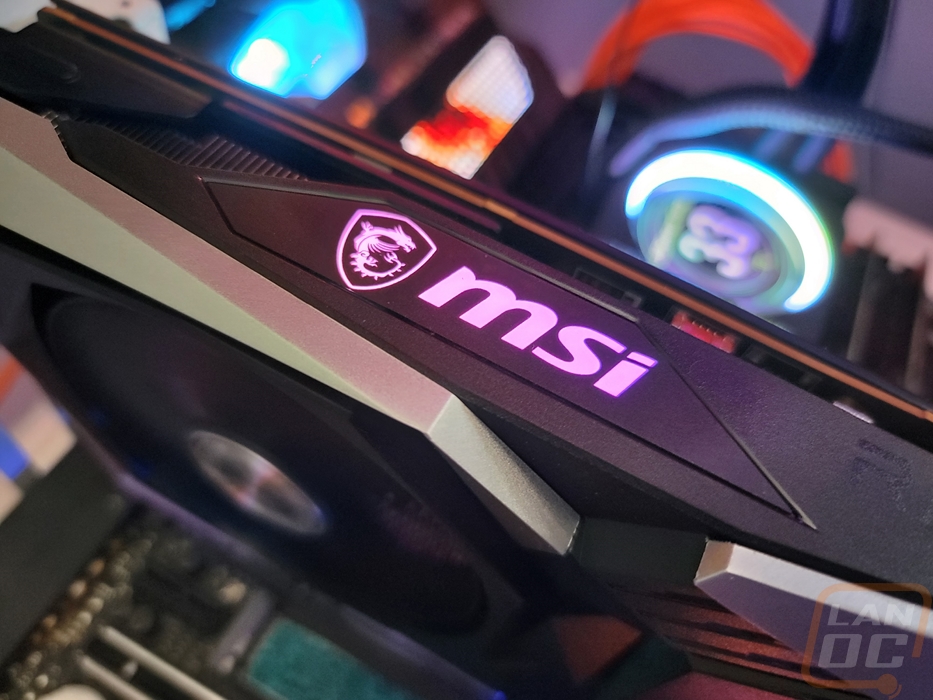
MSI kept the RGB lighting for the 6650 XT Gaming X extremely simple this time around with just the MSI logo on top being backlit. By default, it rotates through colors but you can control it using MSIs software as well.
Test Rig and Procedures
Test System
CPU: Intel Core-i9 12900K – Live Pricing
Motherboard: Asus ROG Maximus Z690 Extreme – Live Pricing
Cooling: Corsair H100i Elite LCD Display - Live Pricing
Noctua NT-H1 Thermal Paste - Live Pricing
Memory: Micron Pre Launch DDR5 2x32GB – Live Pricing
Storage: Sabrent Rocket Q4 2TB – Live Pricing
Power Supply: Corsair AX1200 - Live Pricing
Case: Primochill Wetbench - Live Pricing
OS: Windows 11 Pro 64-bit - Live Pricing
|
Our Testing Procedures |
|
|
3DMark |
All 3DMark based tests are done using the most recent version. We test using all three versions of Fire Strike and both Time Spy and Time Spy Extreme. Tests to look at ray tracing performance is done with Port Royal when supported and for Nvidia cards that support DLSS, the DLSS subtest is also done at 1440p with the performance setting and DLSS 2.0. |
|
Unigine Superposition |
1080p Extreme and 4k Optimized benchmarks along with the VR Future test are done. The VR test is done at the Oculus resolution |
|
VRMark |
Only the Blue room test is run |
|
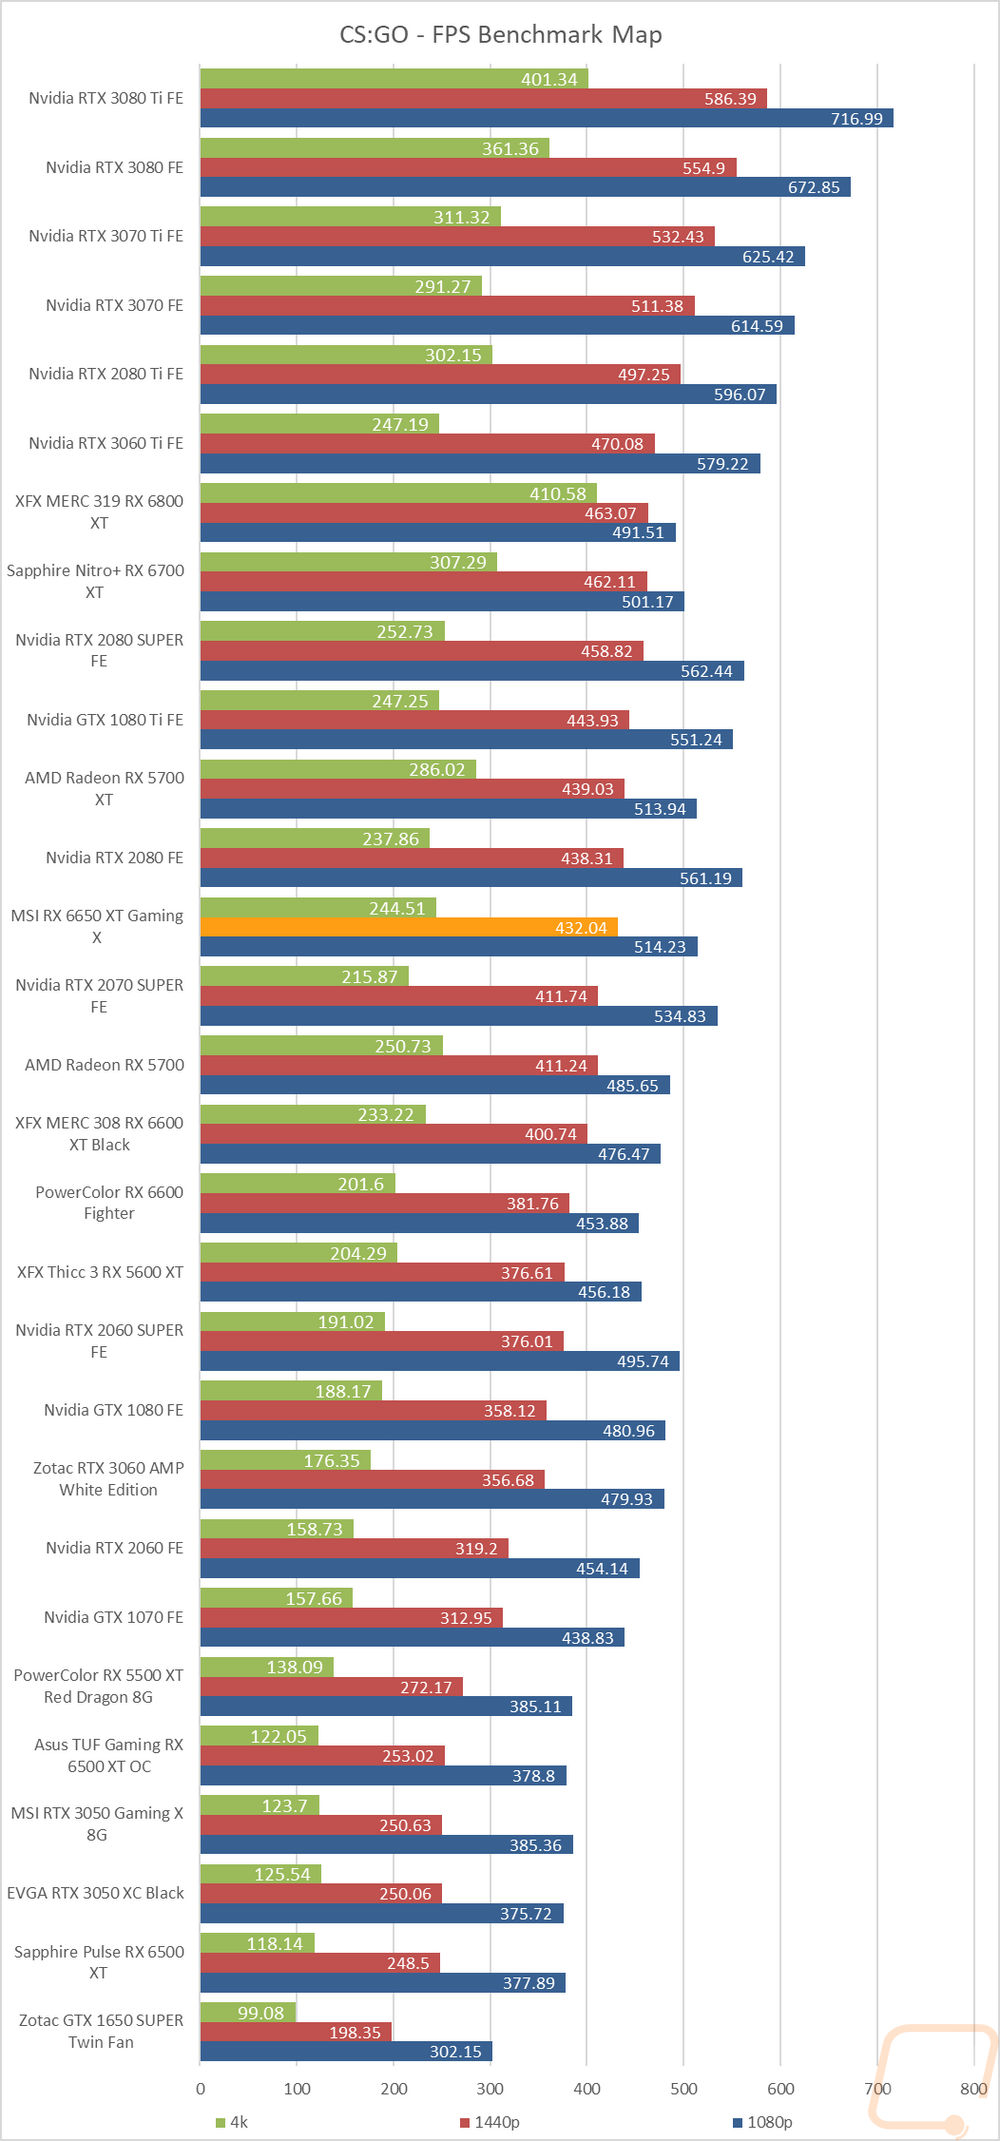
CS:GO |
This test is done using the workshop map called CS:GO Benchmark. You can find more information at this link. https://www.gamingpcbuilder.com/how-to-install-csgo-fps-benchmark-map/ I test at 1080p, 1440p, and 4K resolutions. All auto settings are turned off and detail is set to their highest settings. shadow quality high, model texture detail high, shader detail very high, AA set to 16x, uber shaders enabled |
|
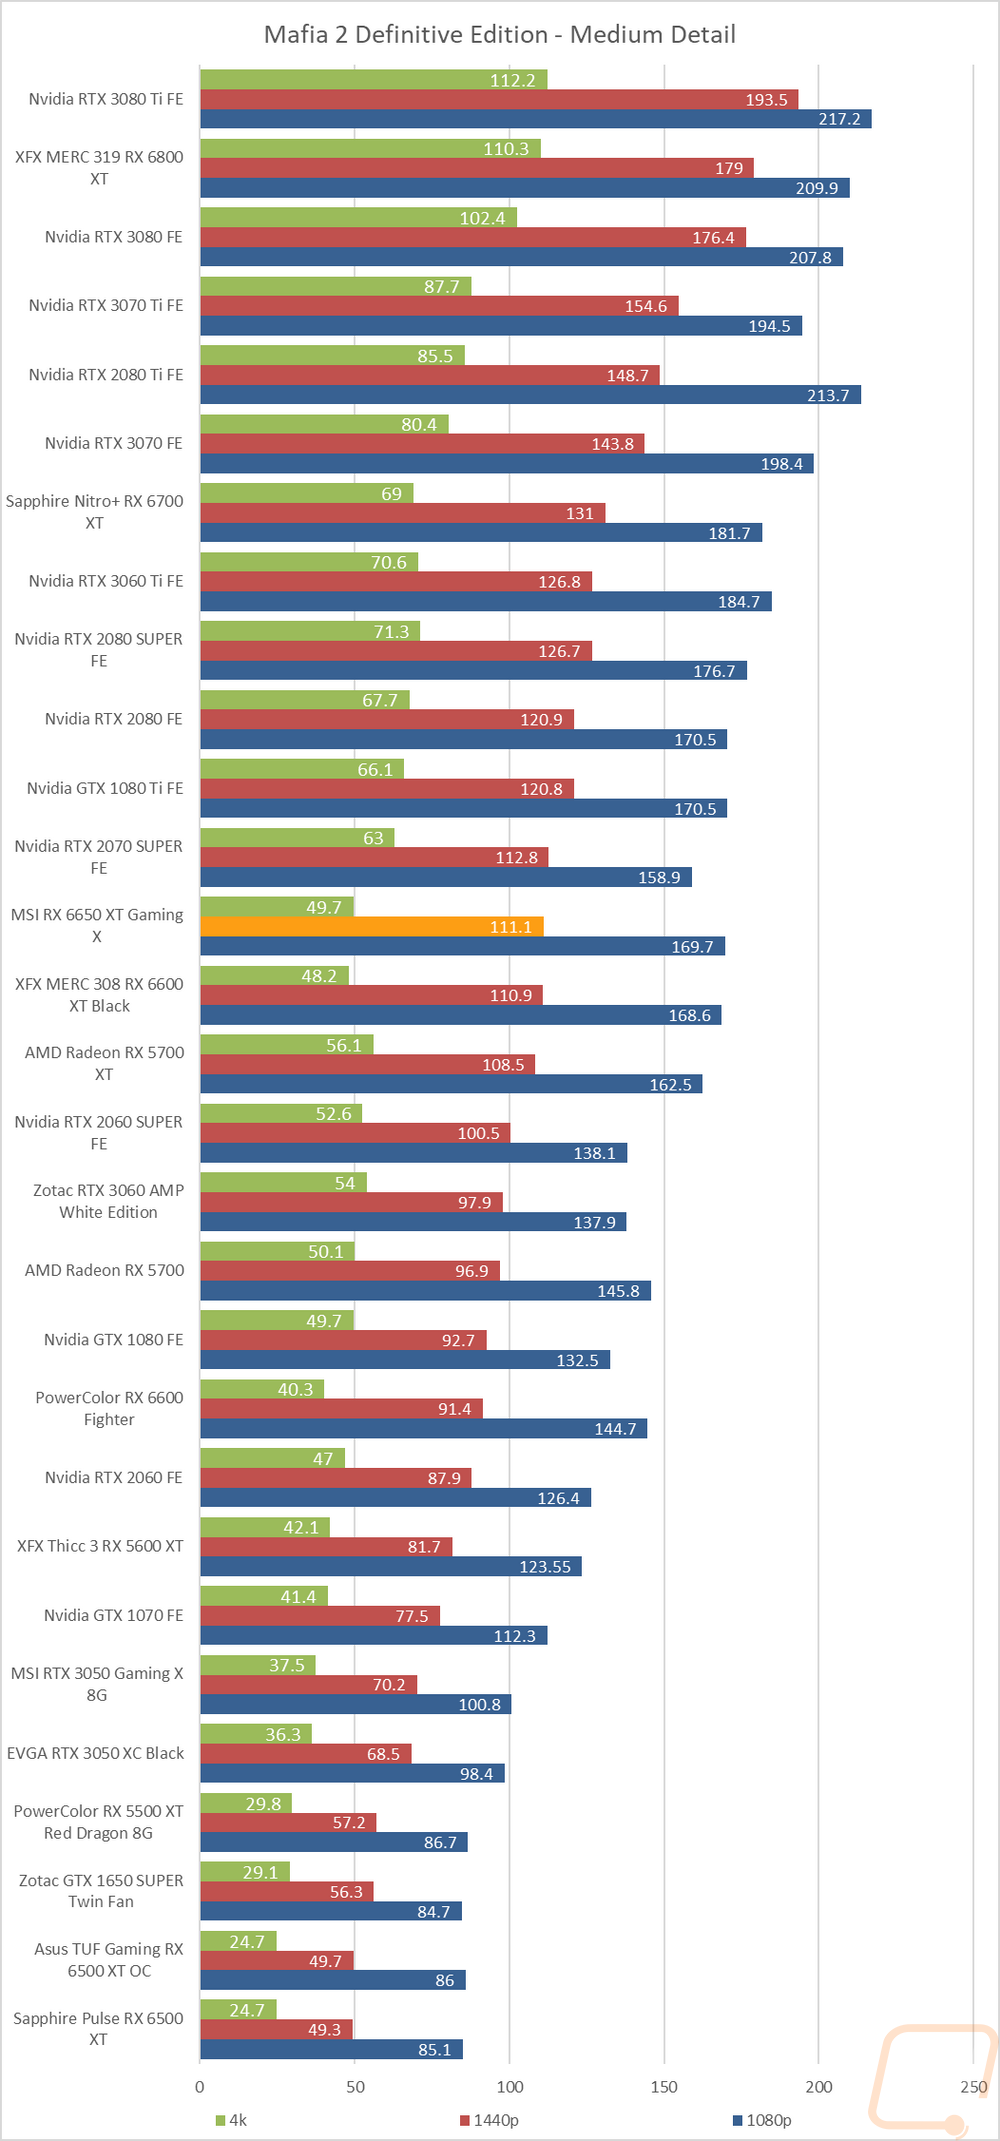
Mafia 2 Definitive Edition |
This uses the built-in benchmark to test at High and Medium detail presets at 1080p, 1440p, and 4K resolutions |
|
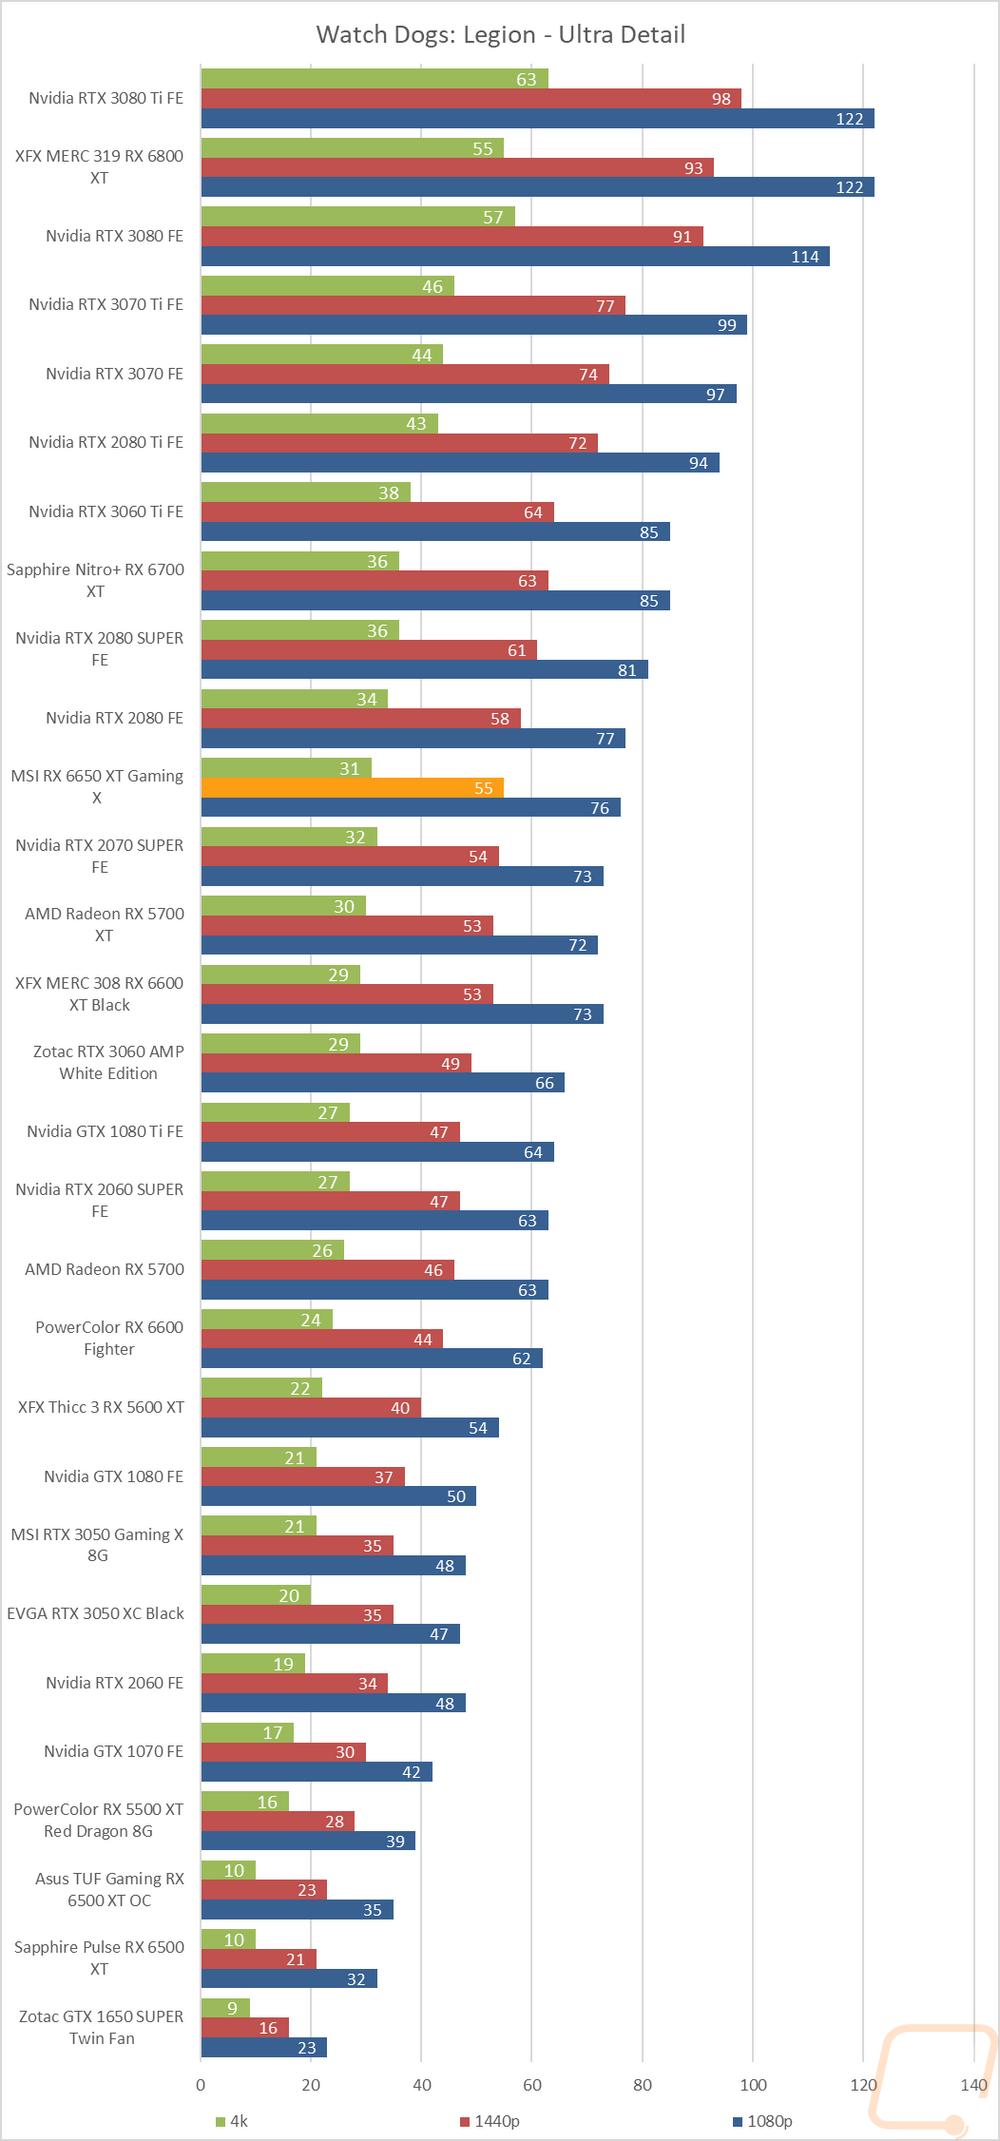
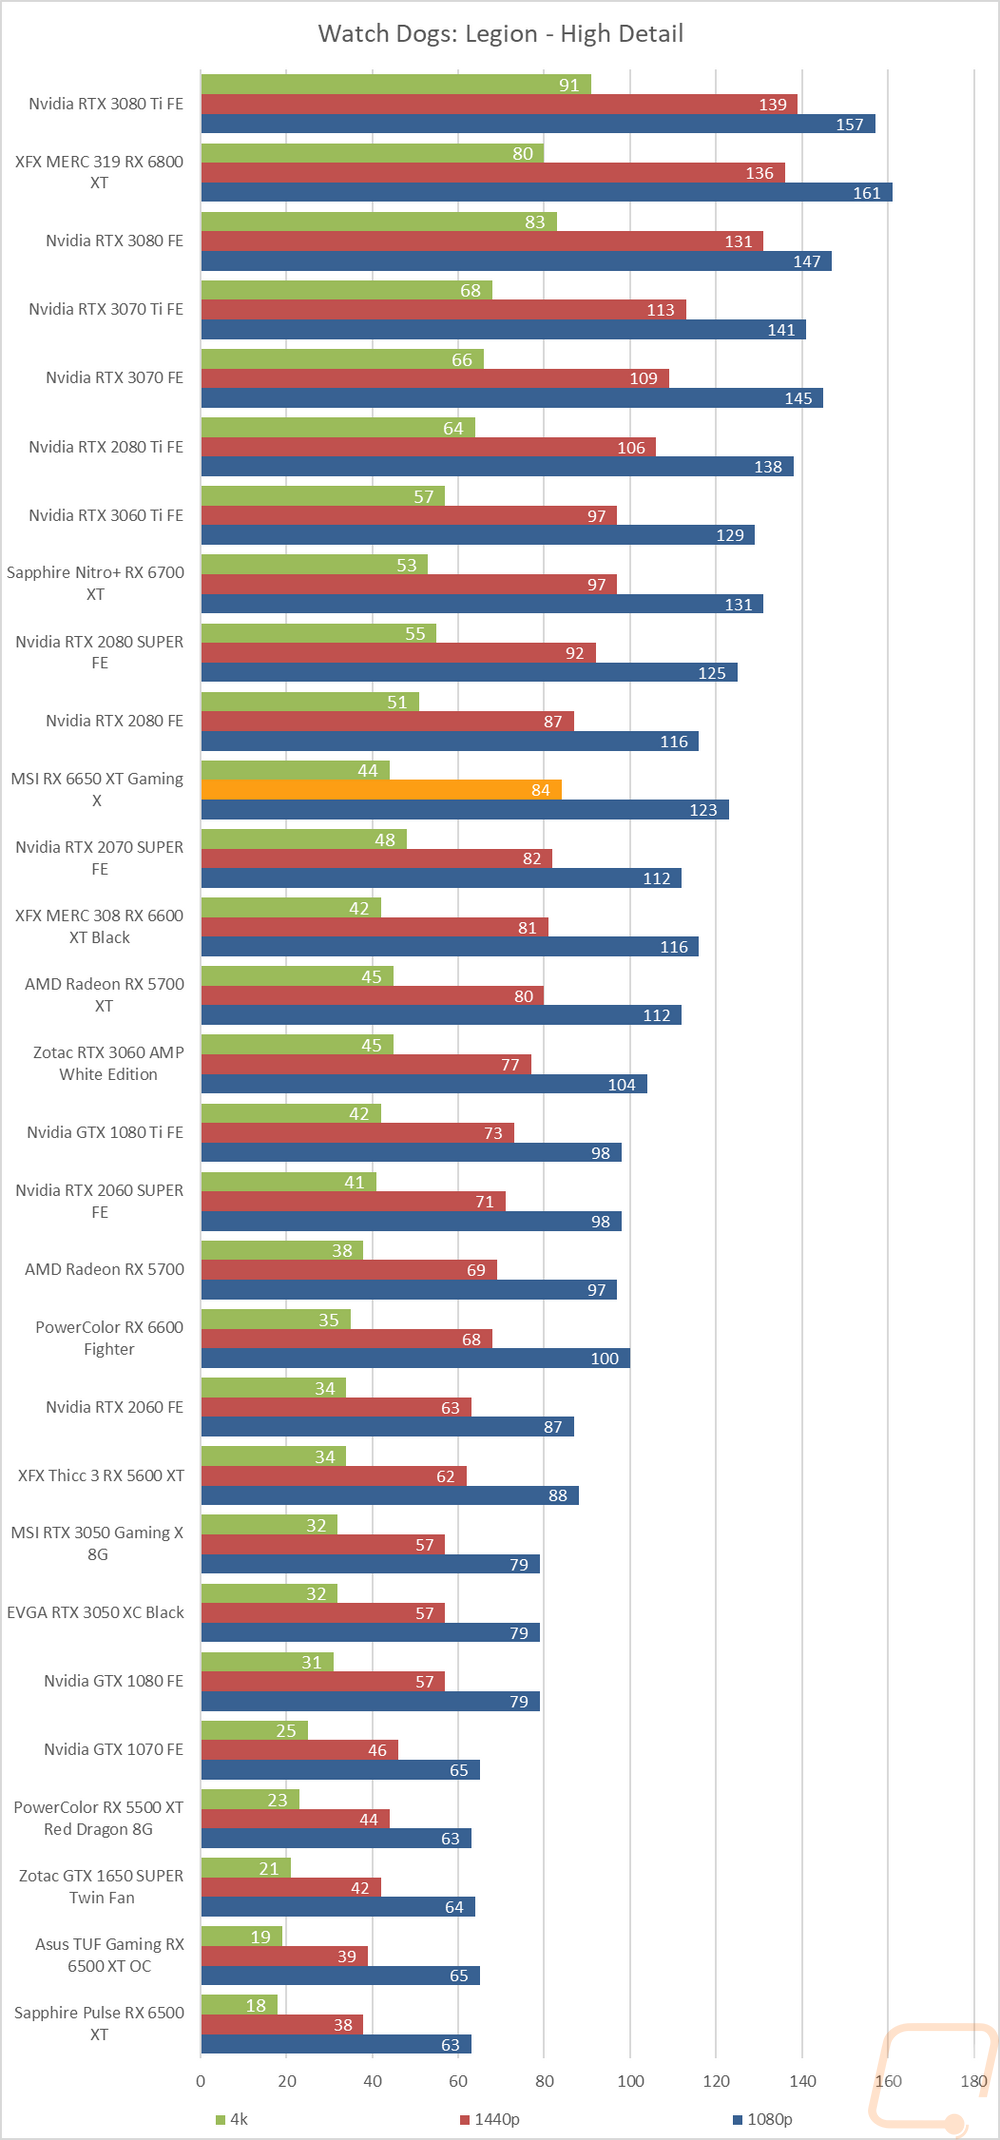
Watch Dogs: Legion |
Built-in benchmark testing at ultra and high details. Tested at 1080p, 1440p, and 4k. I also do RTX and DLSS testing on Nvidia cards at 4K using the Ultra detail settings as a base as well. |
|
Borderlands 3 |
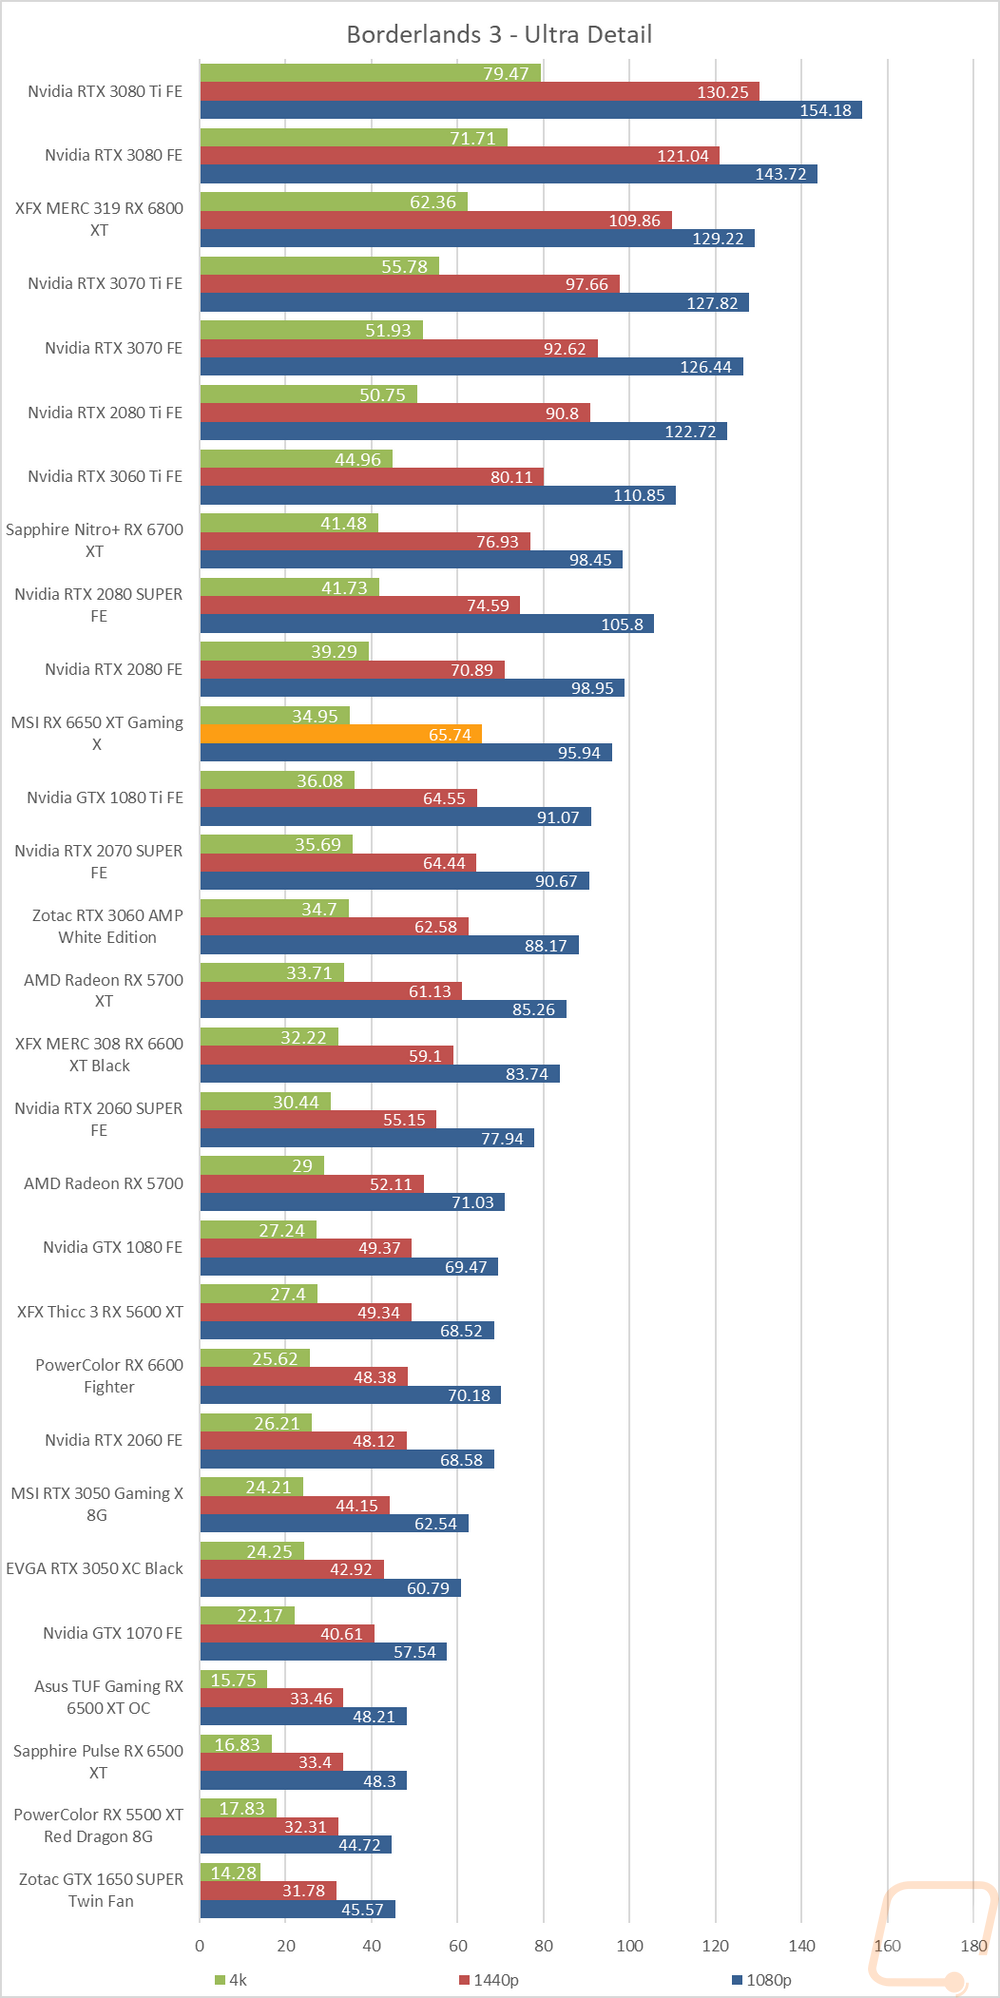
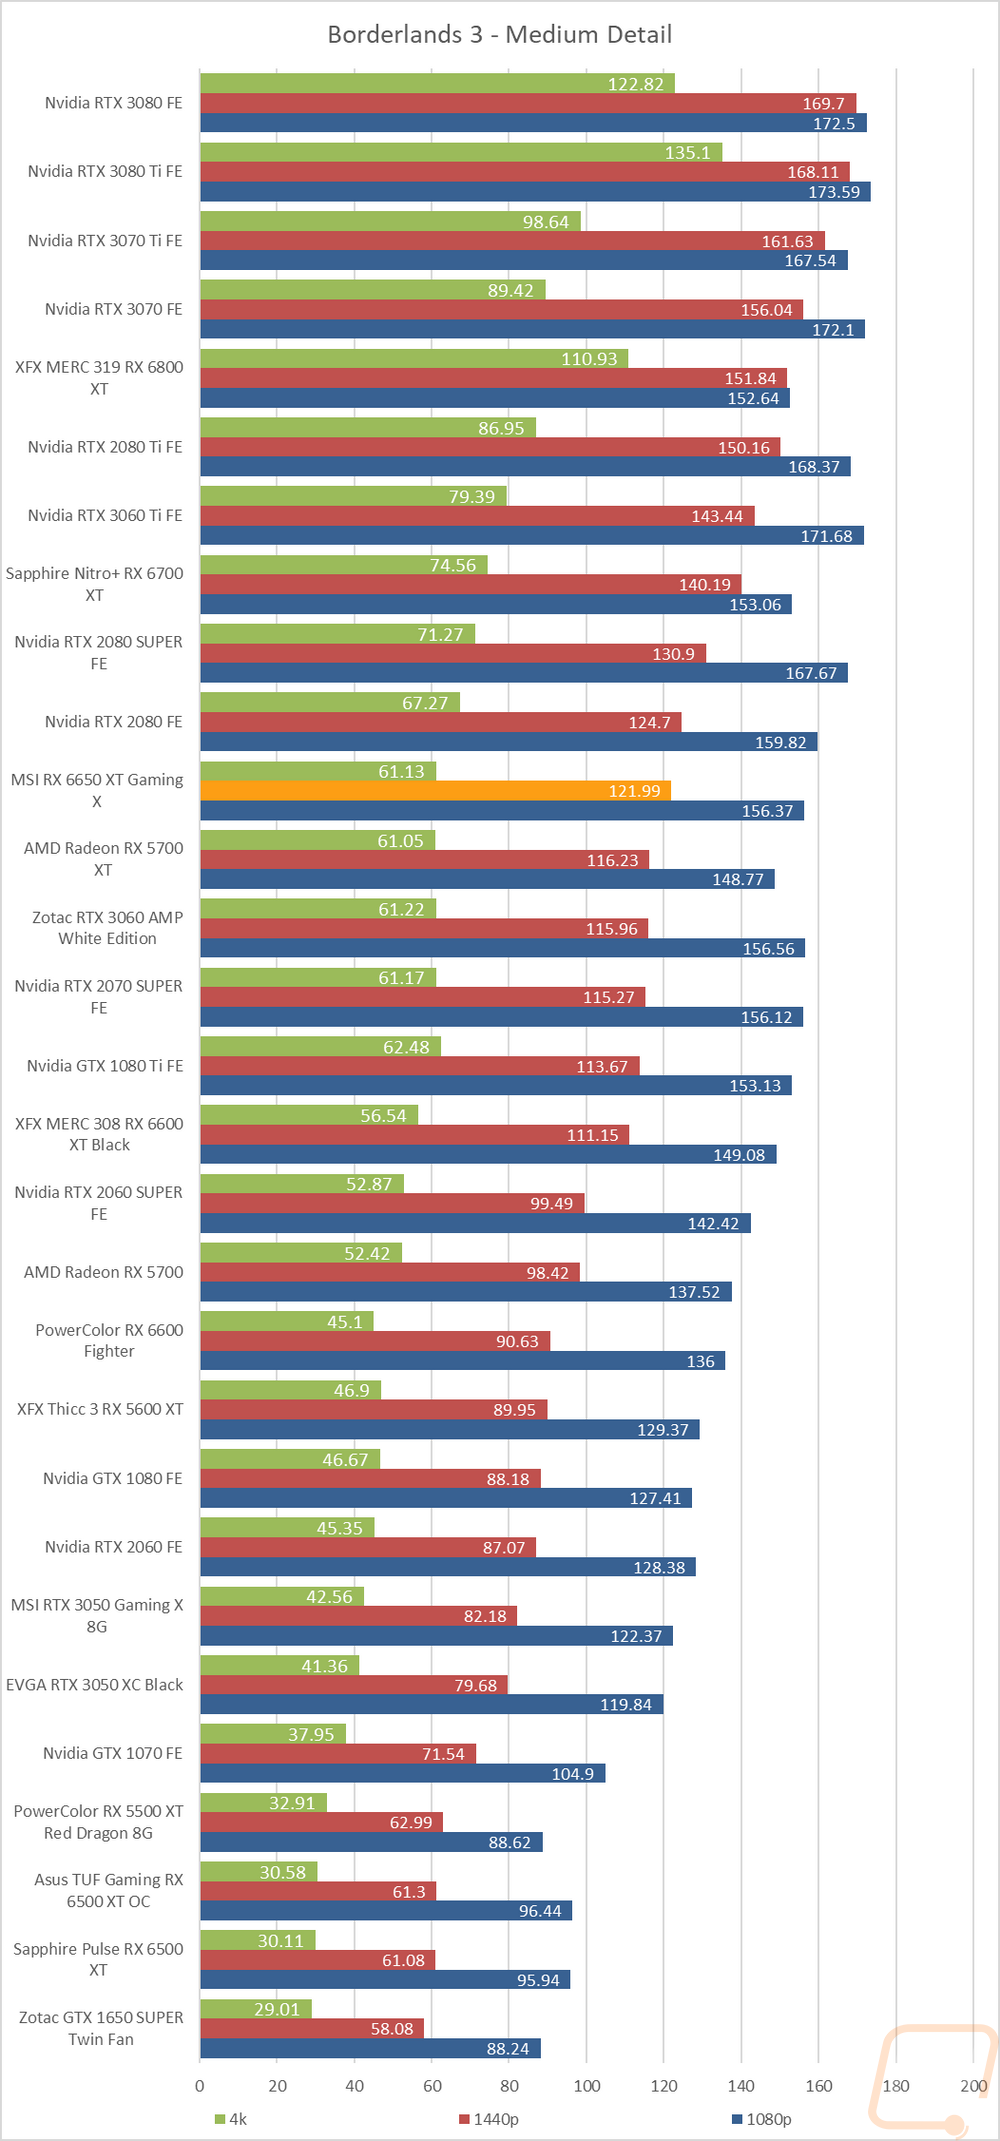
Built-in benchmark testing with the ultra detail setting and medium detail setting, done at full screen with default settings at 1080p, 1440p, and 4k on DX11 |
|
Metro Exodus |
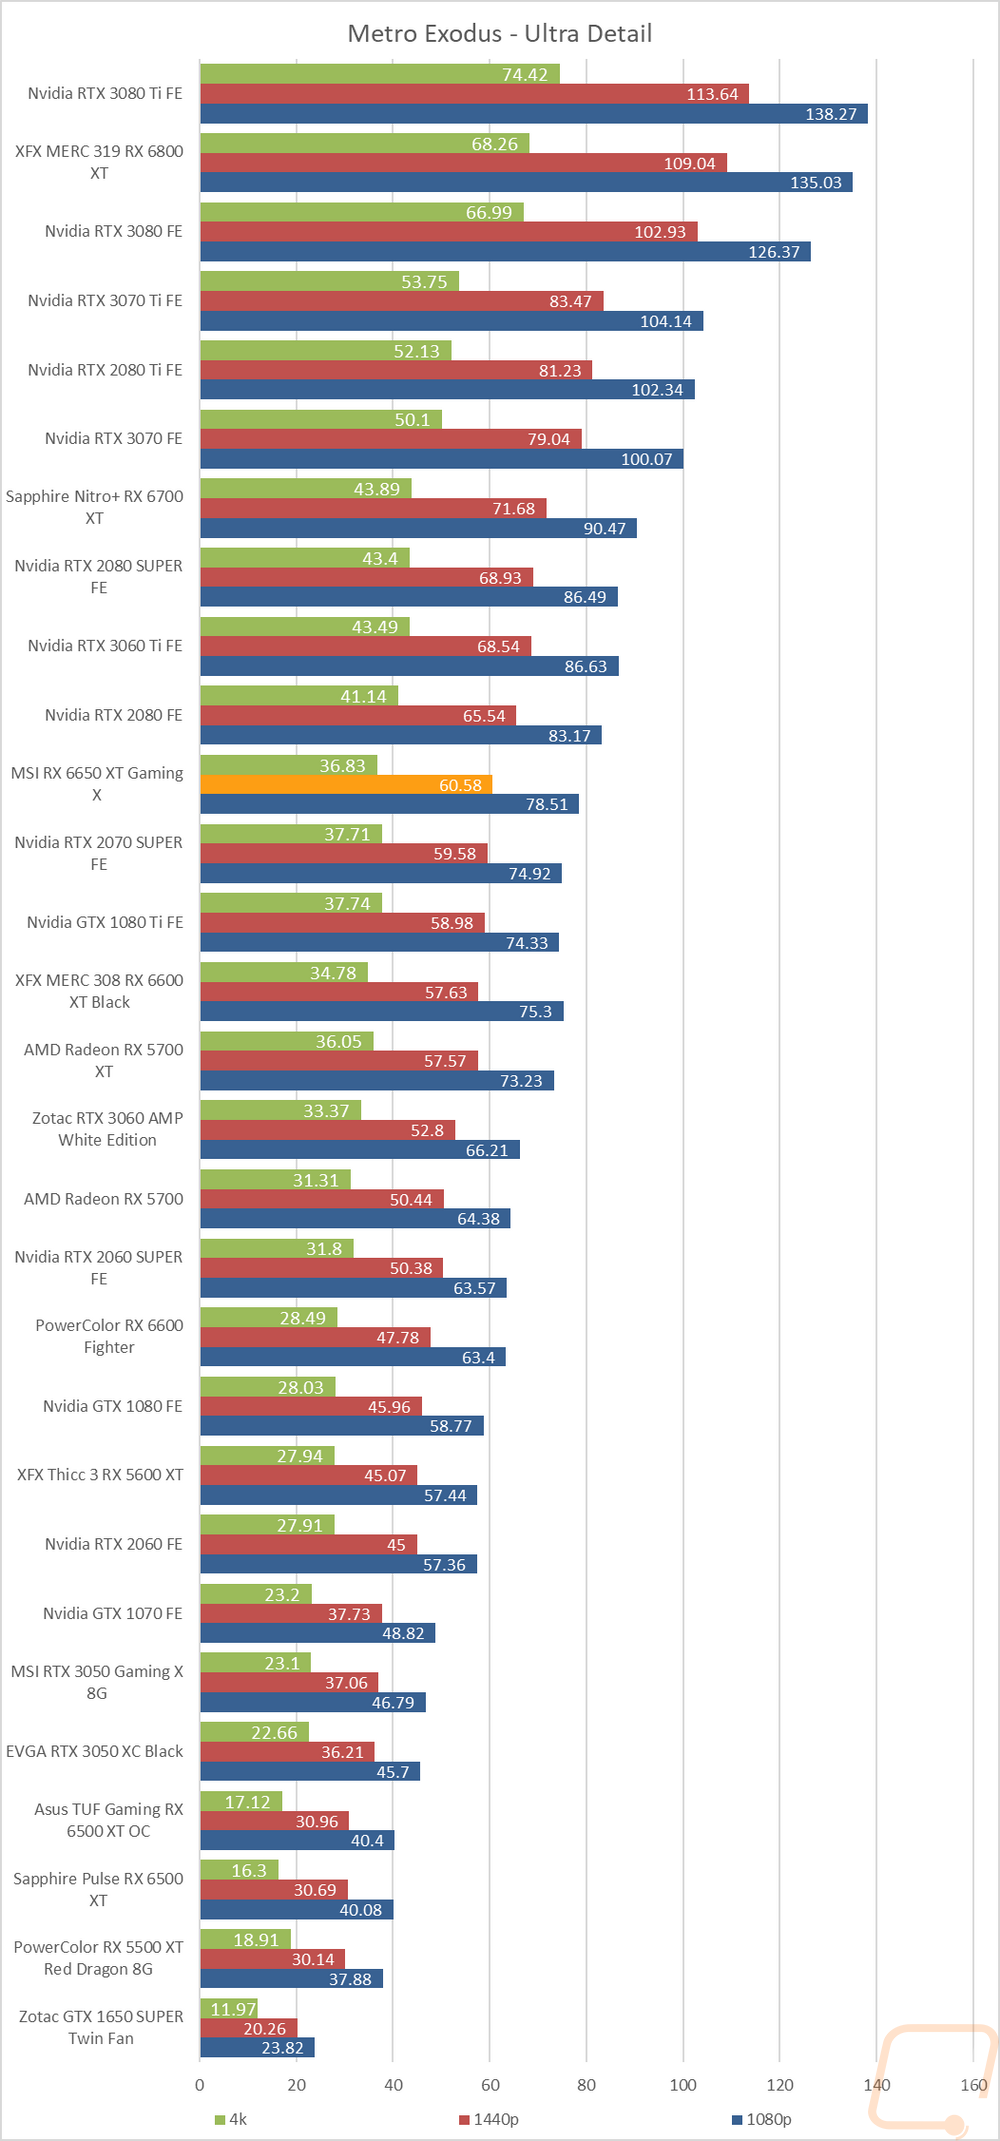
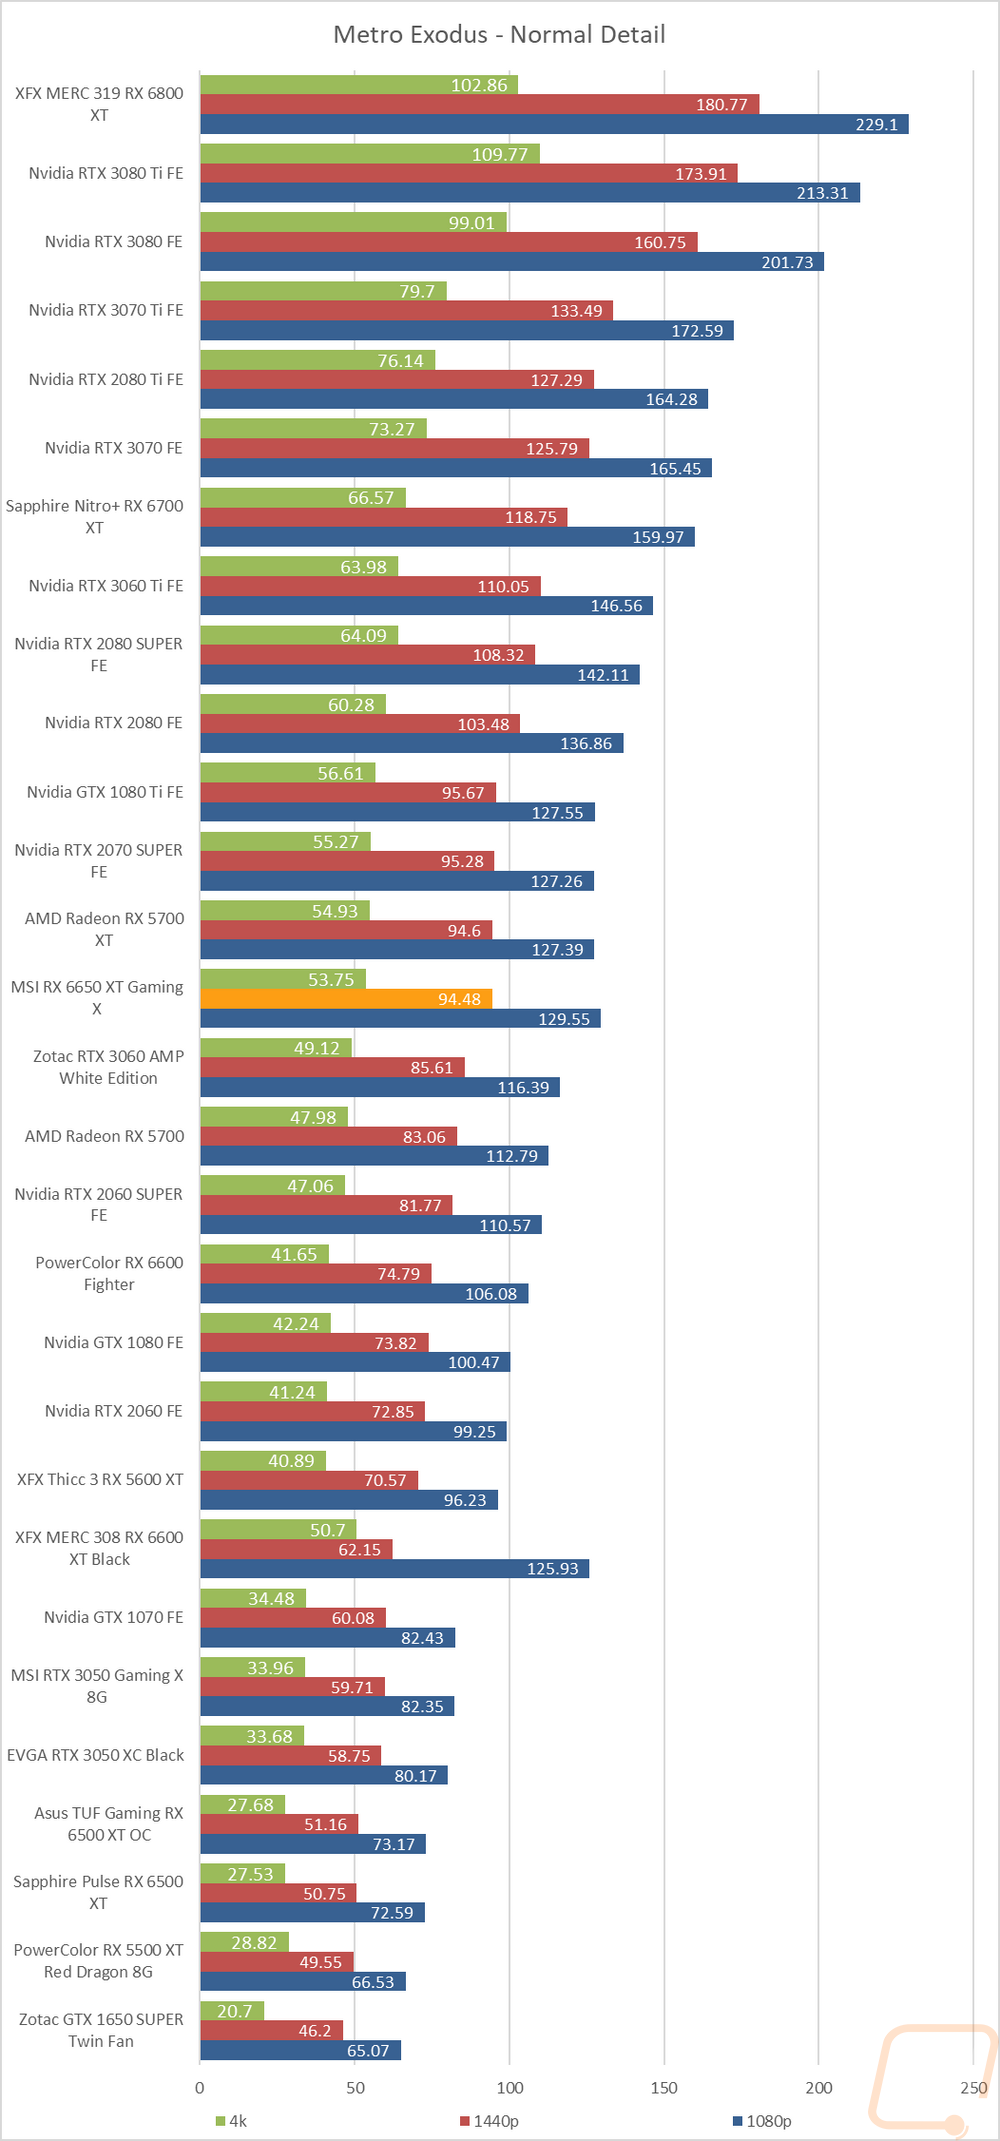
Using built-in benchmark, testing at ultra and normal details at 1080p, 1440p, and 4k. I also do RTX and DLSS testing at 4K with the ultra detail base settings for Nvidia cards as well. |
|
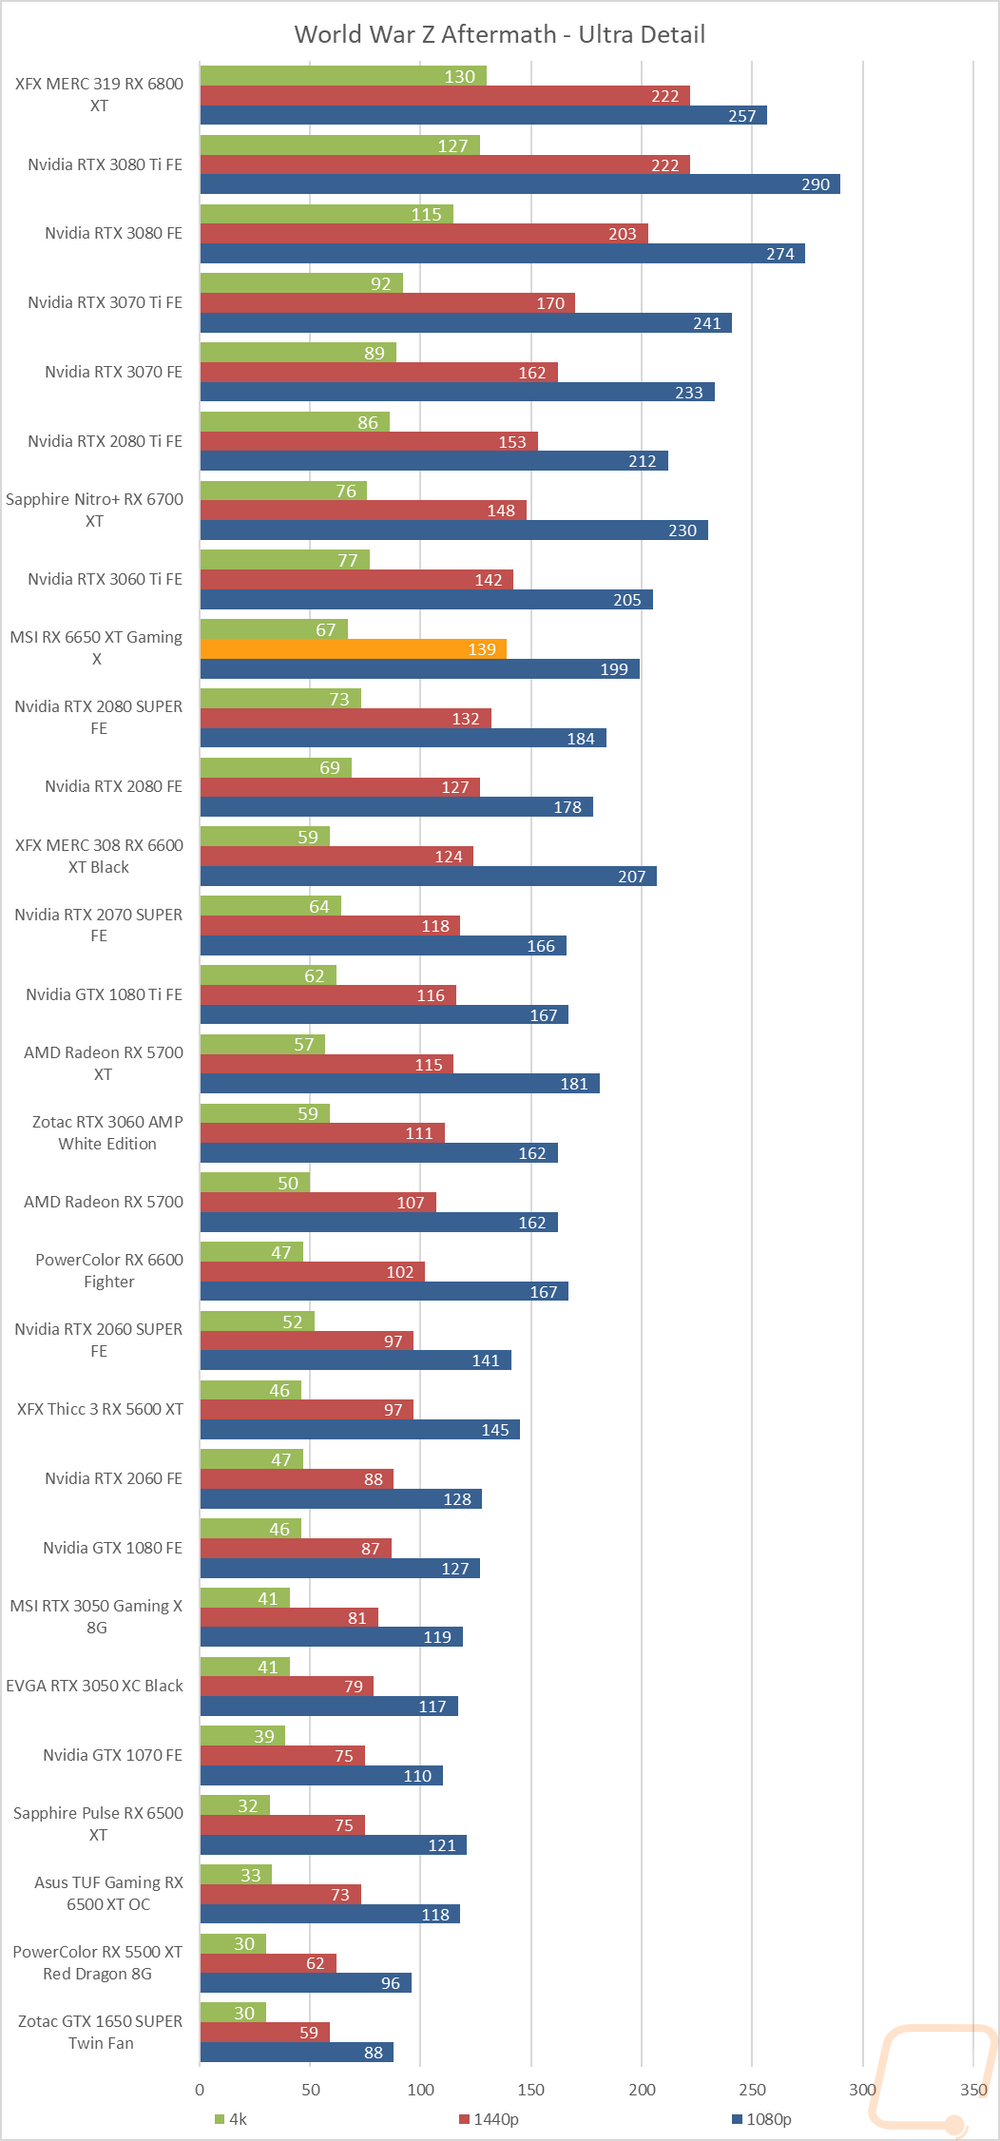
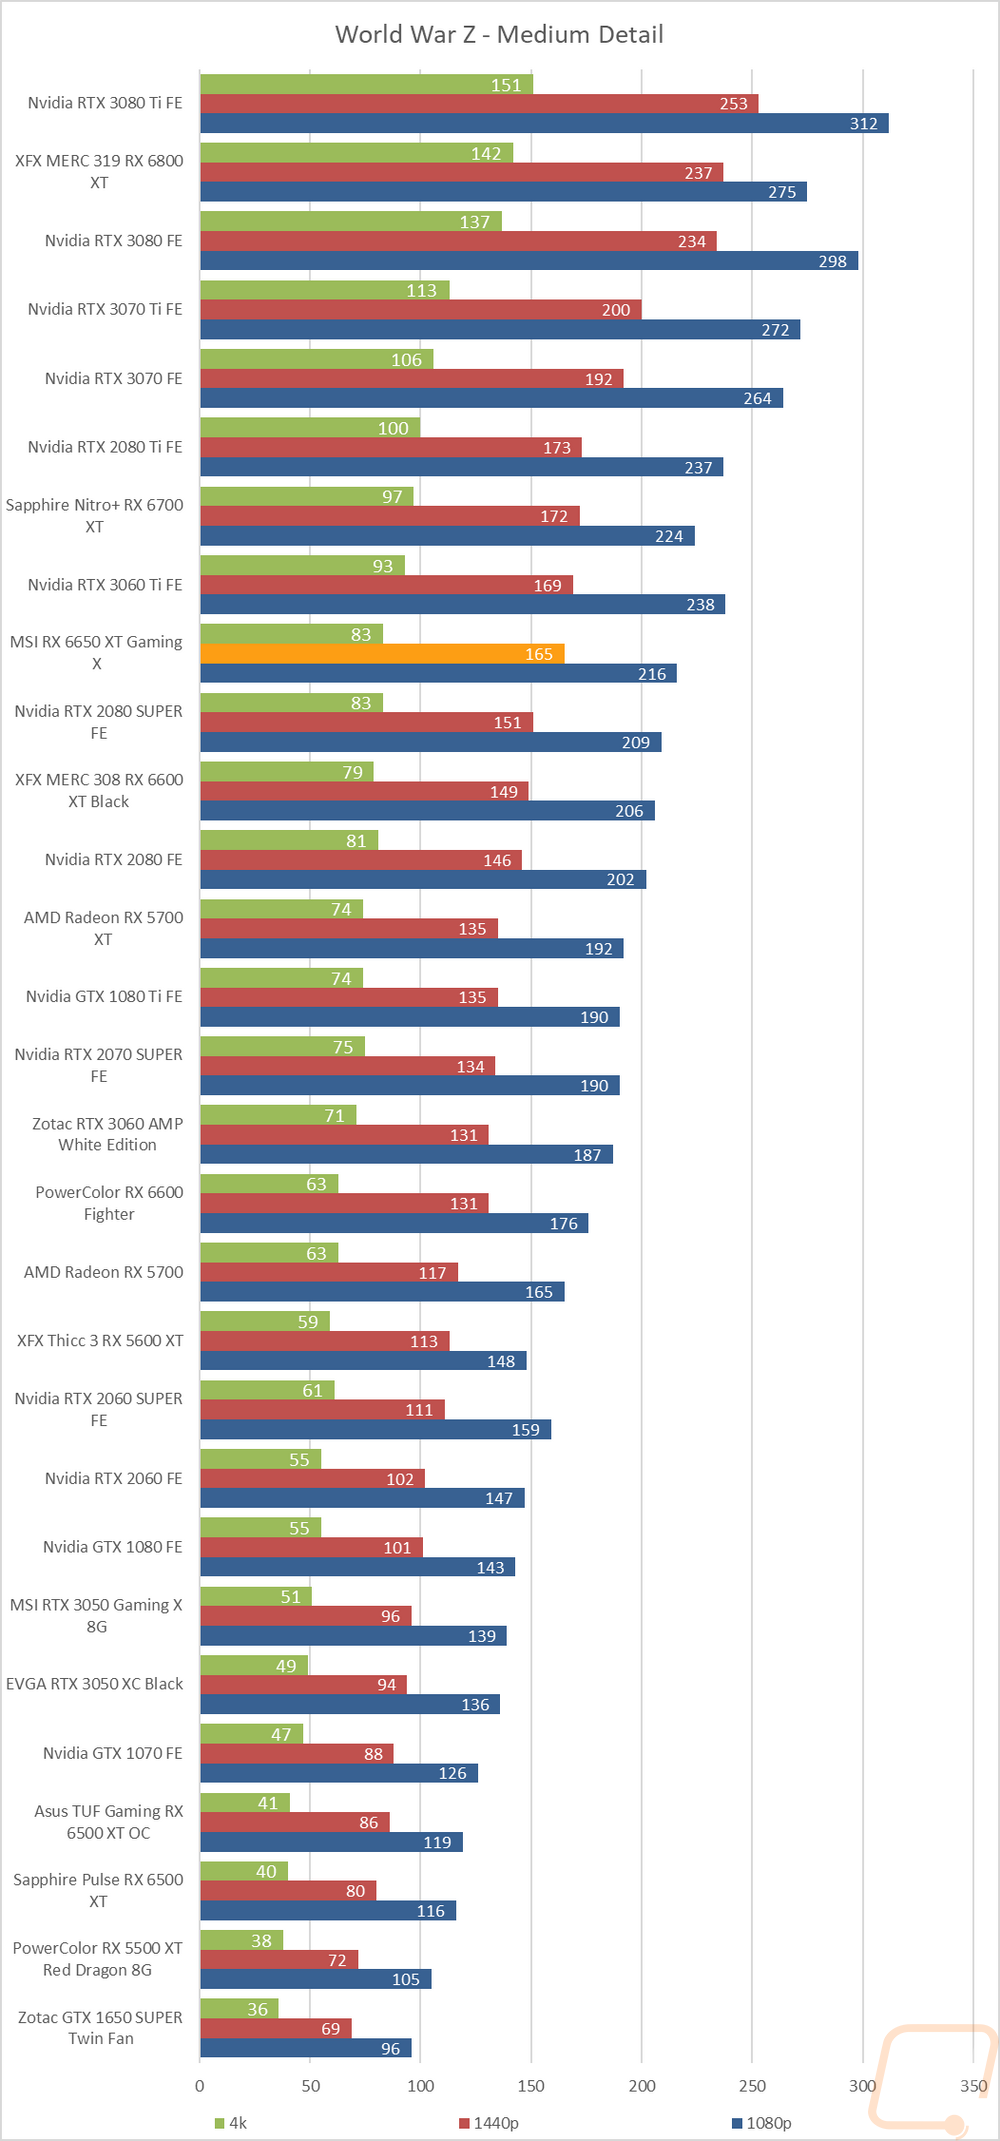
World War Z Aftermath |
Built-in benchmark in DX11 testing both the Ultra detail and Medium detail levels at 1080p, 1440p, and 4K resolutions |
|
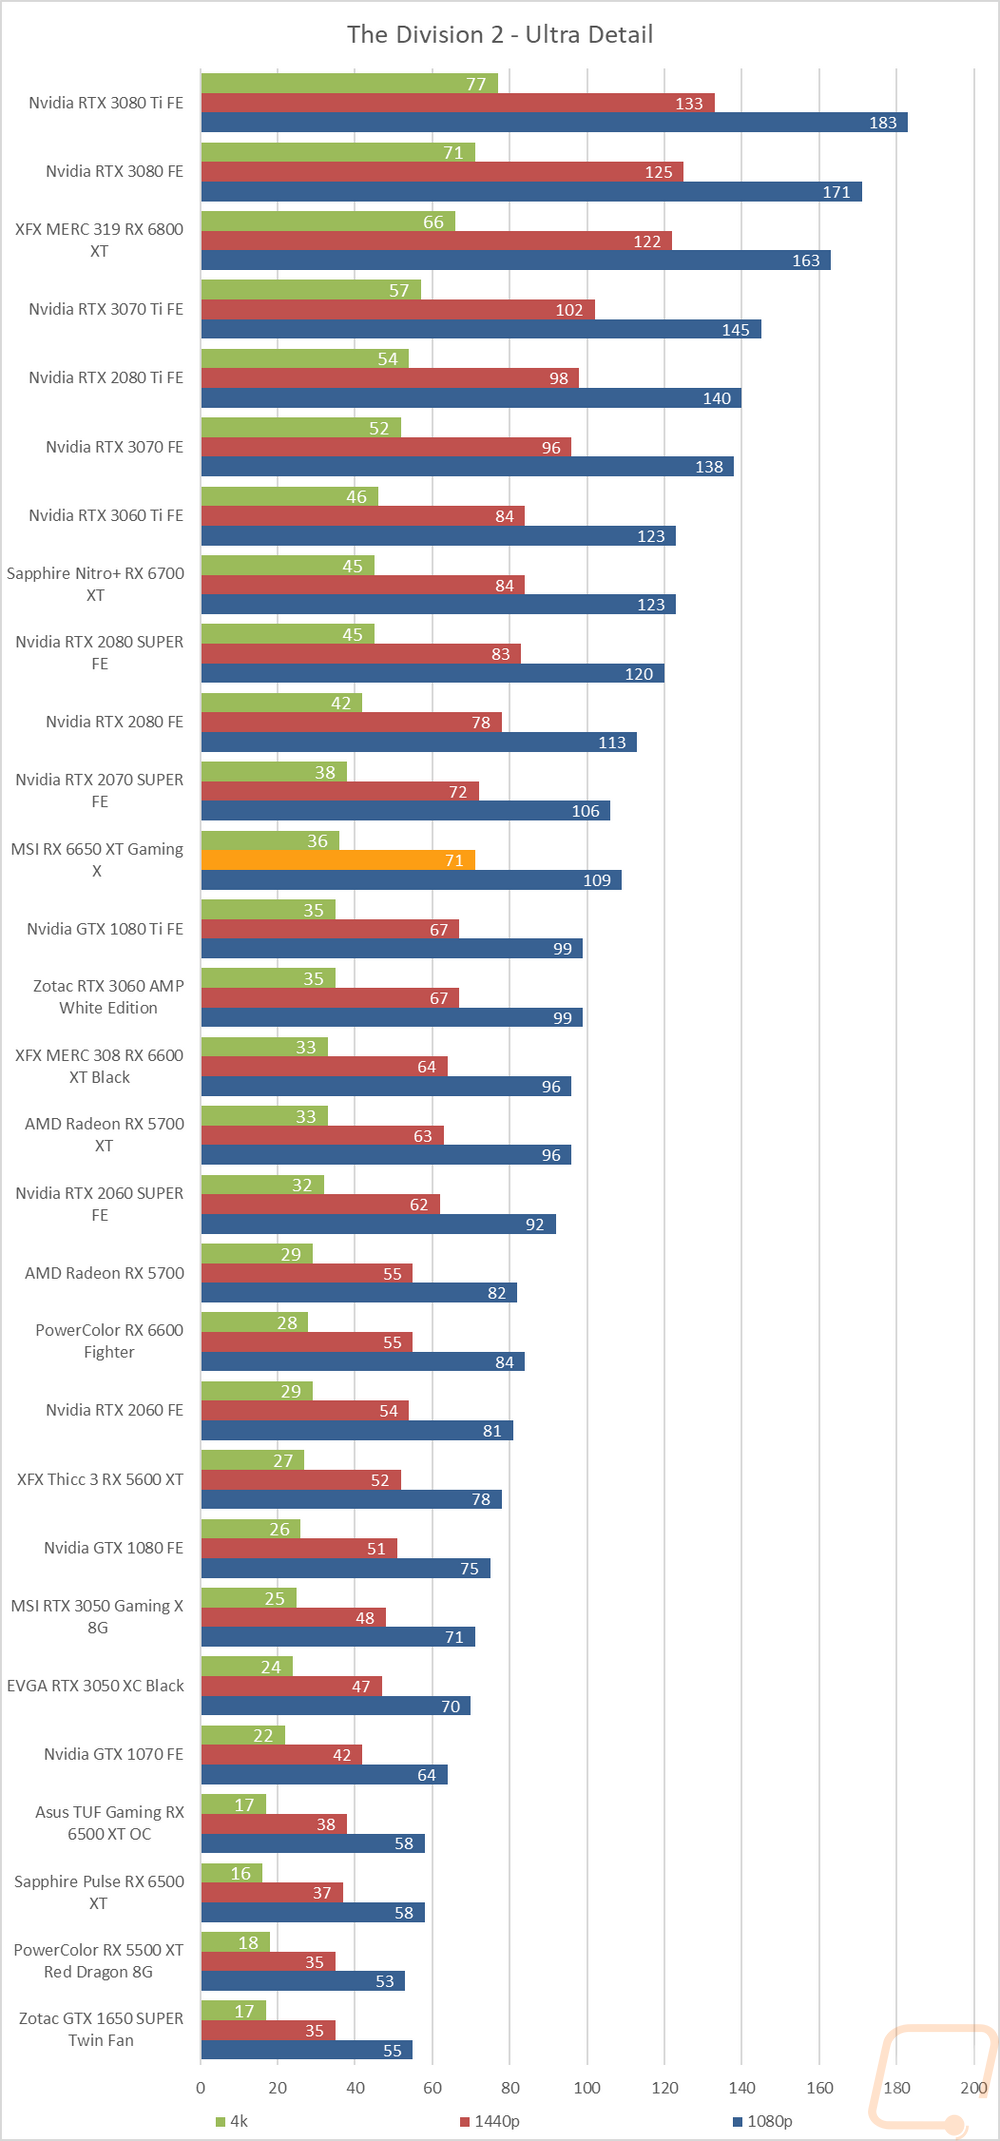
The Division 2 |
Built-in benchmark at Ultra detail with V-Sync turned off at 1080p, 1440p, and 4k resolutions. |
|
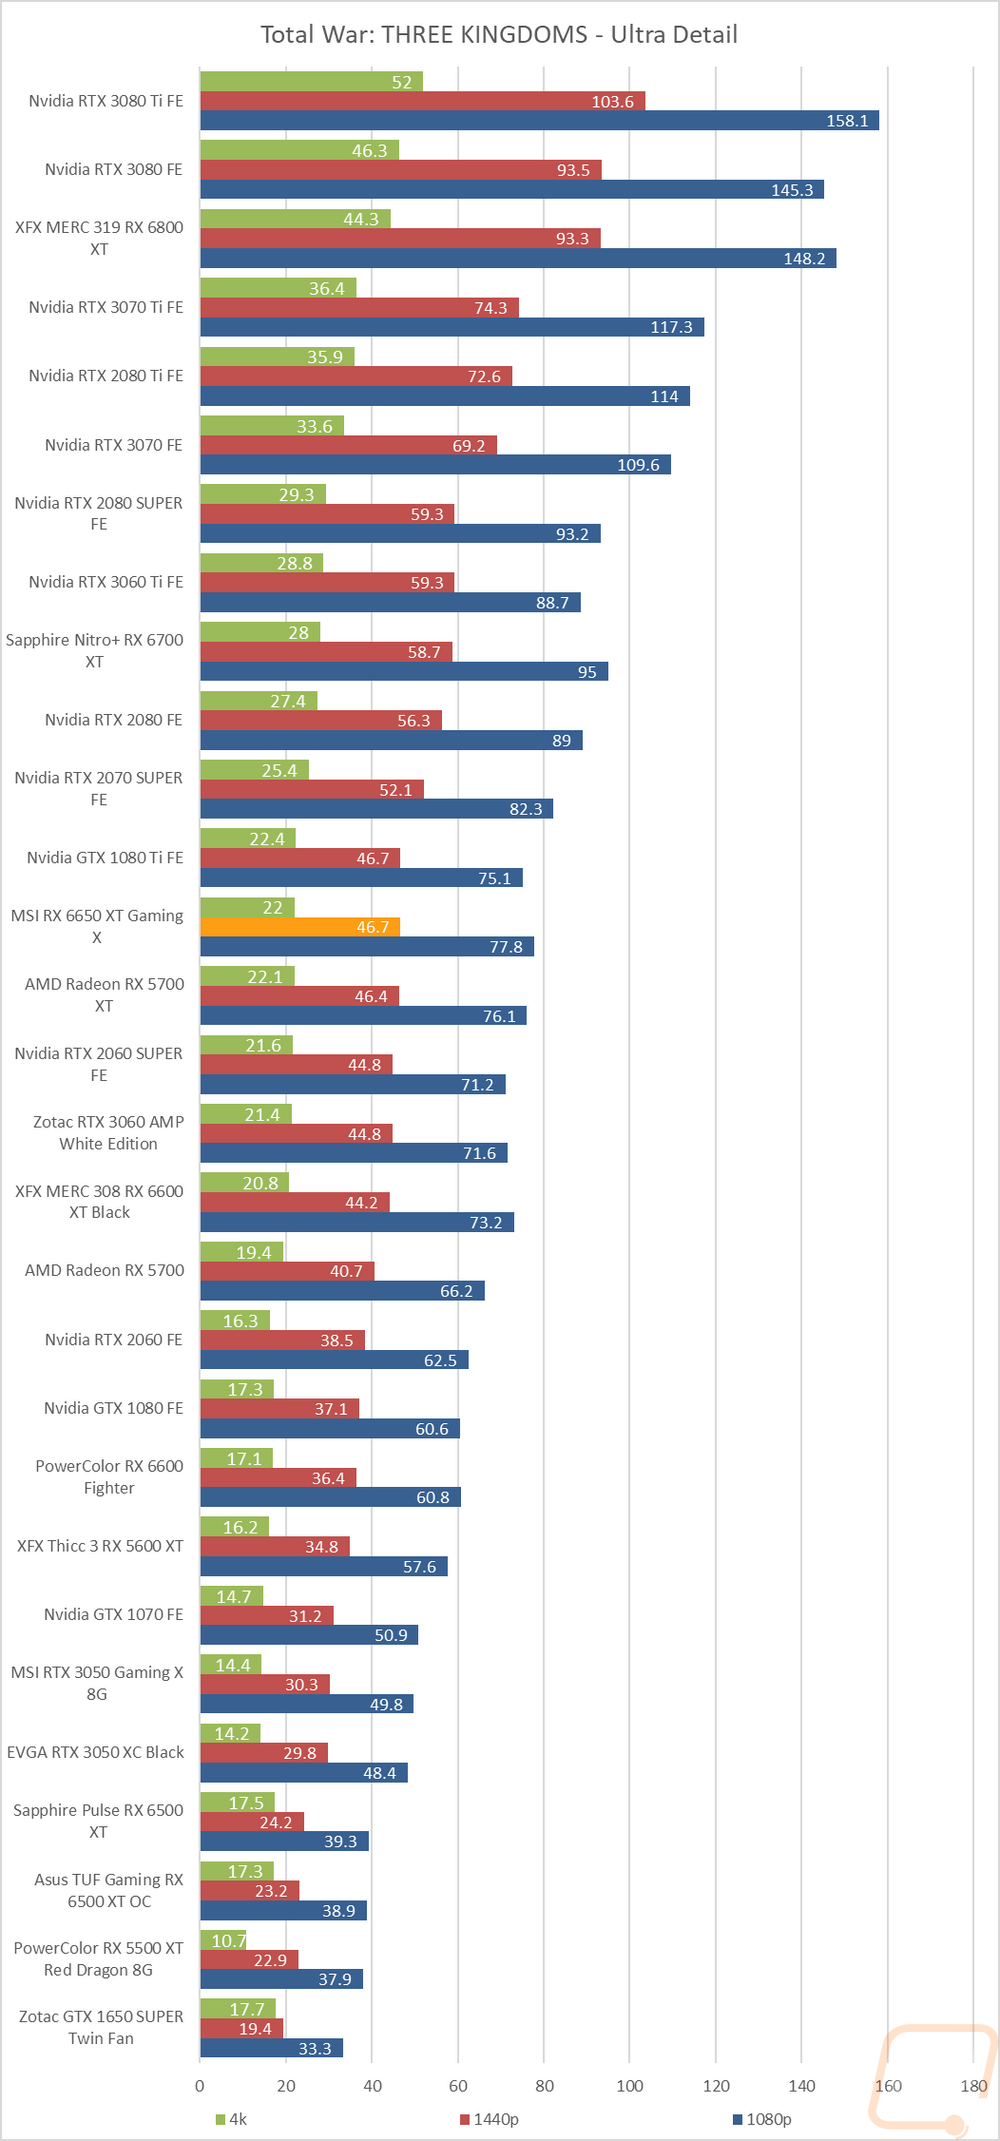
Total War: Three Kingdoms |
Built-in benchmark using the Battle Benchmark setting. Tested at 1080p, 1440p, and 4k at both high and ultra detail settings |
|
Far Cry 6 |
Built-in benchmark, tested at 1080p, 1440p, and 4k with the Ultra and Medium detail settings |
|
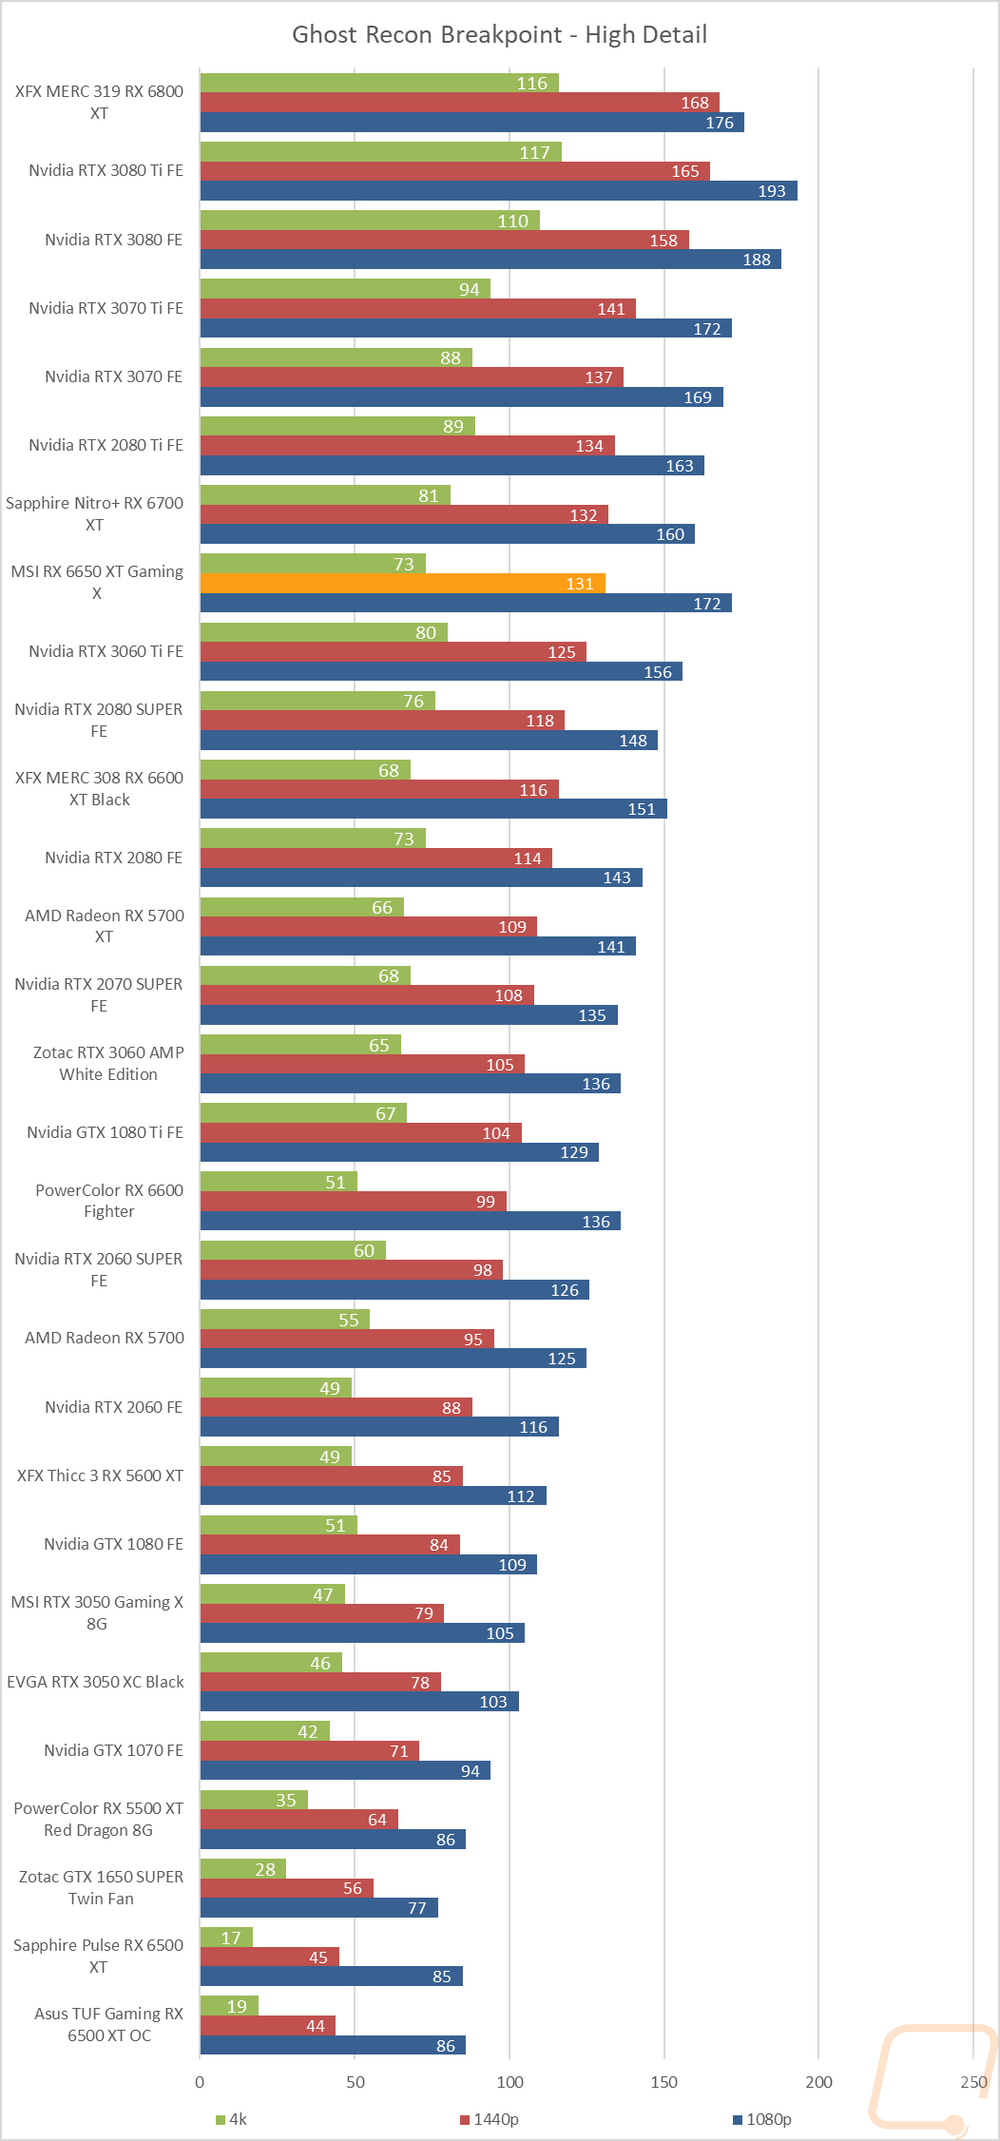
Ghost Recon Breakpoint |
Built-in benchmark, tested at 1080p, 1440p, and 4k with the Ultra and Medium detail settings |
|
Boundary Benchmark |
Testing different DLSS detail levels on cards that support it. All testing is done at 4k with RTX on |
|
Bright Memory Infinite RTX Benchmark |
Benchmark all of the different RTX detail levels. Resolution at 4k and DLSS on balanced for each test |
|
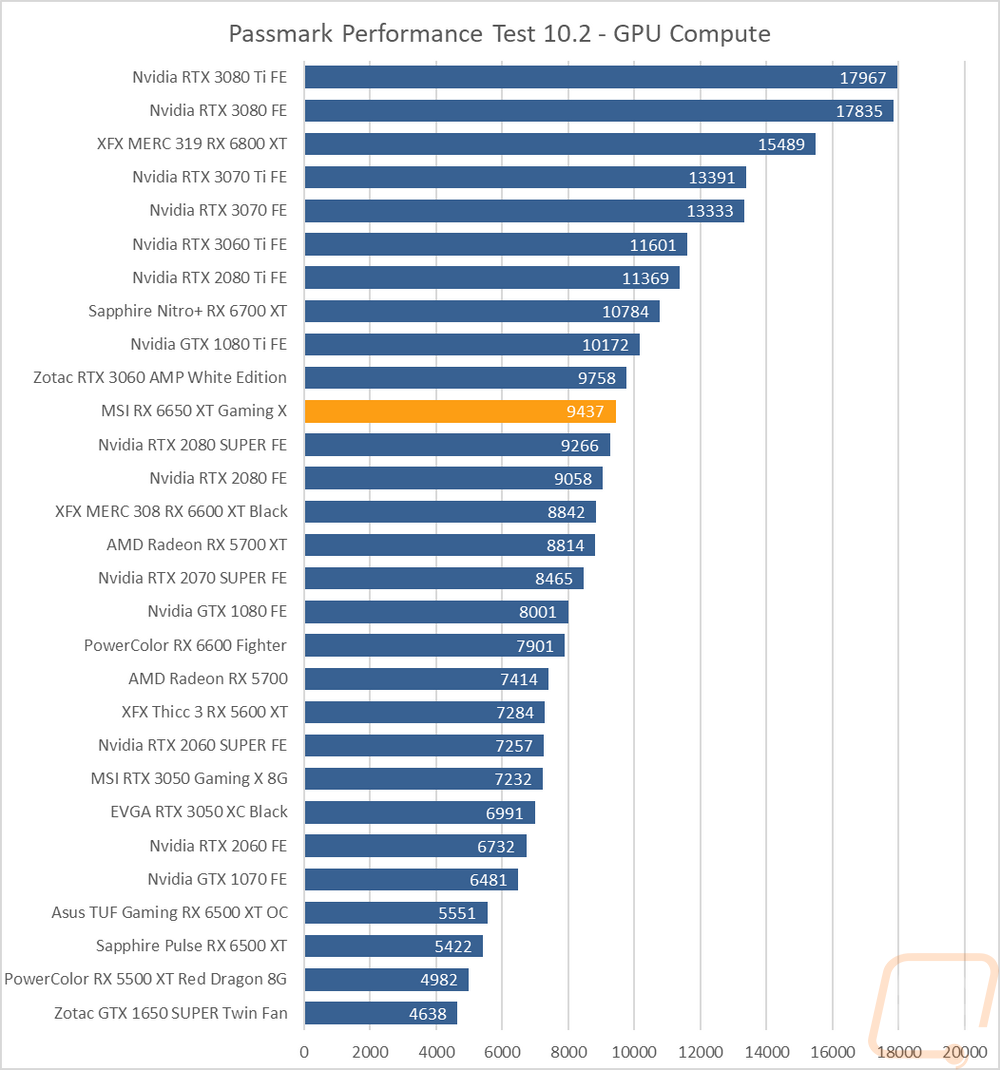
Passmark Performance Test 10.2 |
Test using the GPU Compute Score inside of Passmark’s Performance Test 10.2 |
|
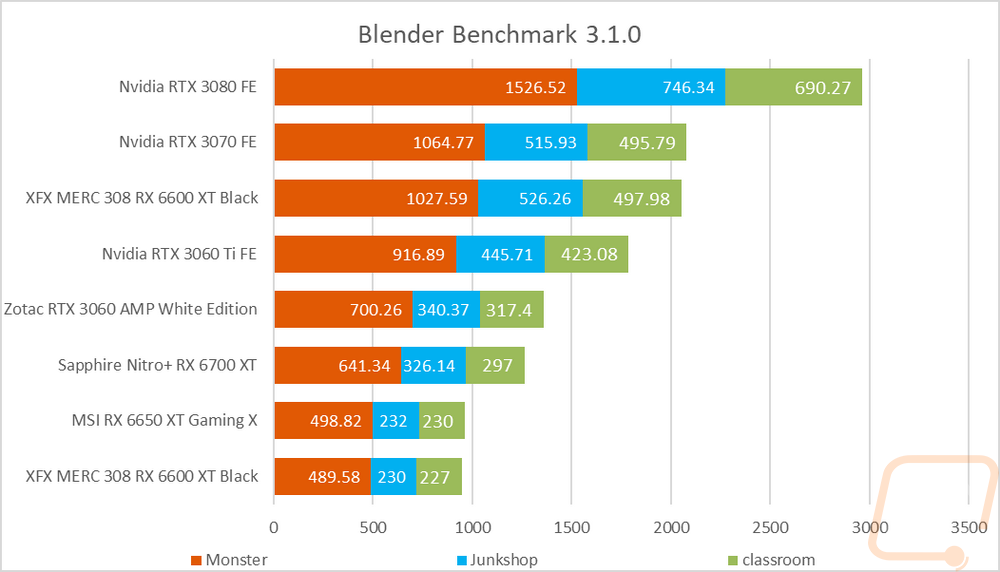
Blender |
Using the new Blender Benchmark with the Quick Benchmark setting set to use the GPU, not the CPU. Nvidia cards are tested twice, once with CUDA and the other with Optix, and AMD cards are run on OpenGL. The result is in total seconds the test took, lower is better. The 2.93.1 build is used and I run all six tests, BMW27, Koro, Classroom, Pavillon, Fishy cat (my favorite), and Victor |
|
OctaneBench 2020.1 |
OctaneBench is designed to test rendering in OctaneRender. RTX and non-RTX are both run. This is a CUDA only test so only Nvidia cards are tested |
|
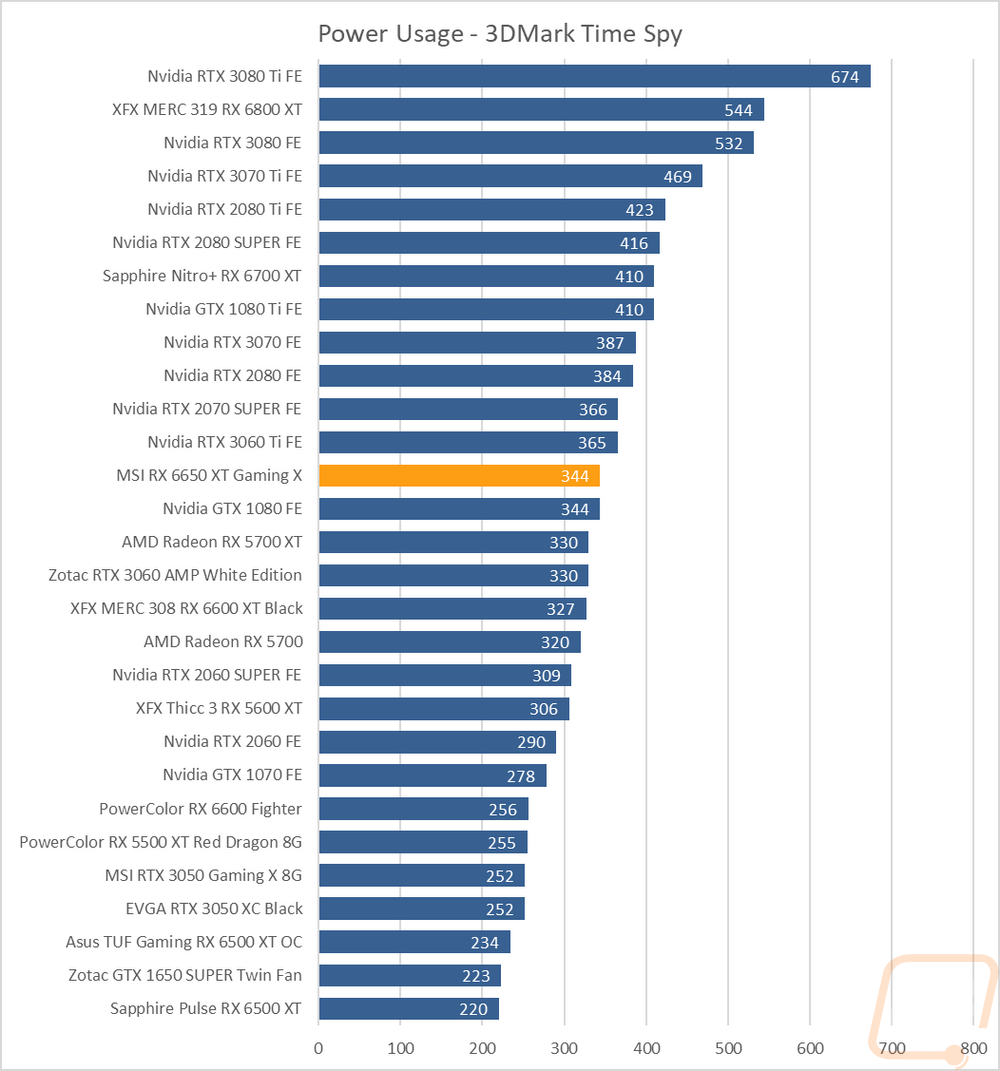
Power Testing |
I run three power tests. Two I use a Kill-A-Watt hooked up in line with the power cord for the test rig. Two tests are done, one using the AIDA64 Stress Test and the second uses the 3DMark Time Spy benchmark on the second test. I also use GPUz to document the GPU only reading off the card itself for wattage when doing the Time Spy test. The Time Spy test uses only the second test here because the3rd test is the combined test that loads the CPU as well. |
|
Noise Testing |
Our Noise testing is done using a decibel meter 18 inches away from the video card on the bottom/fan side of the card. We test at 50% and 100% fan speeds as well as a third test while under load using AIDA64's stress test. This is done using a Protmex PT02 Sound Meter that is rated IEC651 type 2 and ANSI S1.4 type 2. Tests are done set weighted to A and set to a slow response using the max function and tested a second time with C weighting as well. The ambient noise level in the testing area is 33.3 decibels using A weight and 50.0 using C weight. |
|
Temperature Testing |
Using AIDA64, the GPU stress test is run for 30 minutes or until the result has leveled off. The test is run twice, once with the stock fan profile and a second time with 100% fan speed. During this, I also document the 100% fan speed RPM and document the delta between the fan profile and 100% fan speed as well. |
Synthetic Benchmarks
As always I like to start my testing with a few synthetic benchmarks. 3DMark especially is one of my favorites because it is very optimized in both Nvidia and AMD drivers. It's nice to not have to worry about it being favored too much either way and the repeatability of the results makes it a nice chance to compare from card to card, especially when comparing with the same GPU. For this time around, I’m especially curious how the 6650 XT Gaming X performs compared to the 6600 XT and the 6700 XT, and the RTX 3060 from Nvidia.
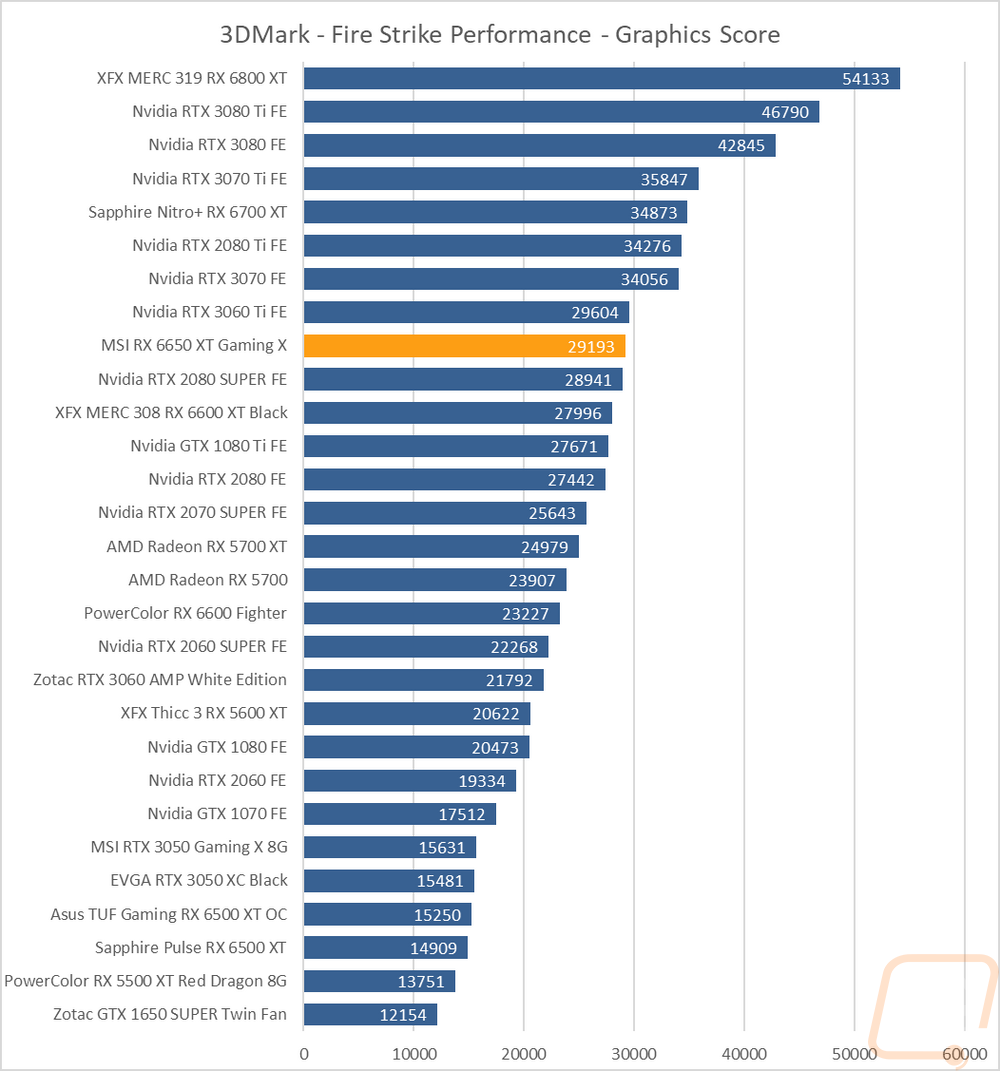
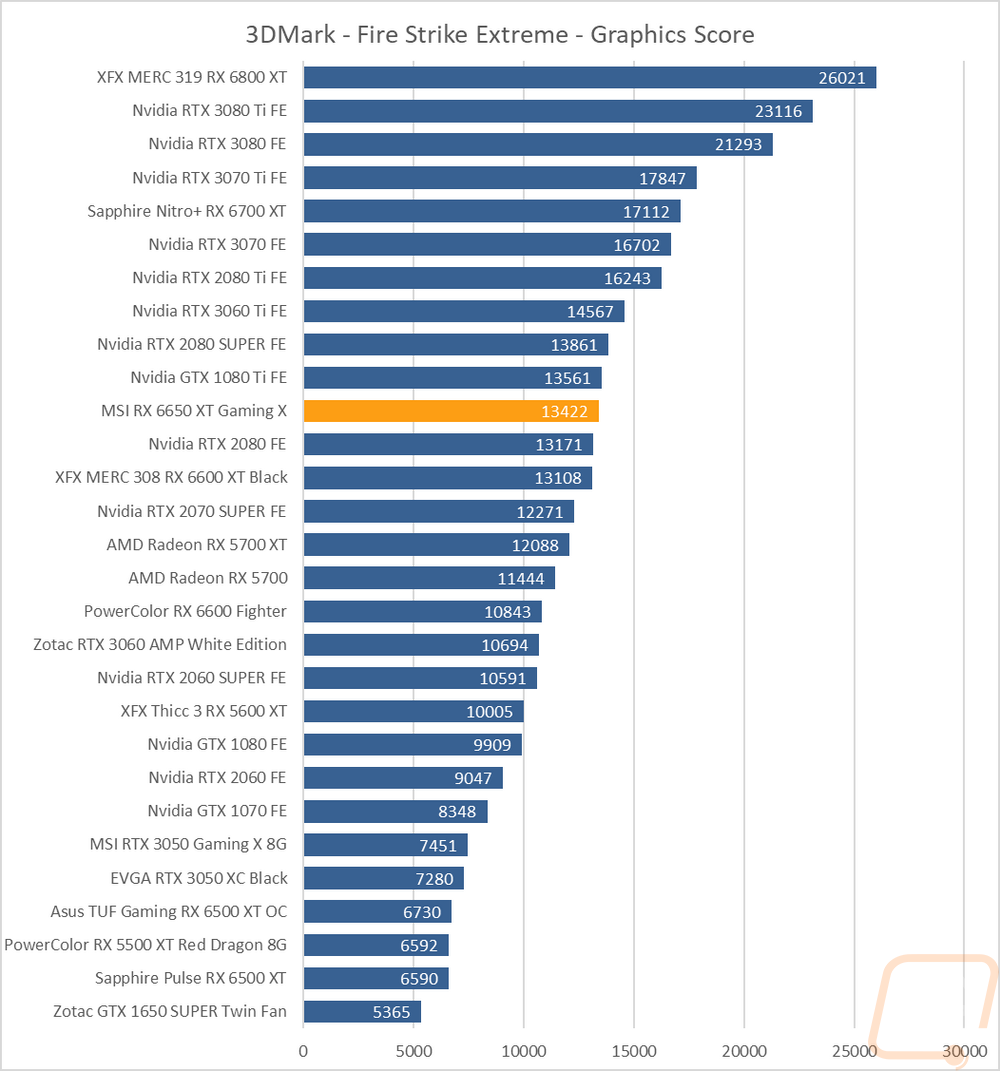
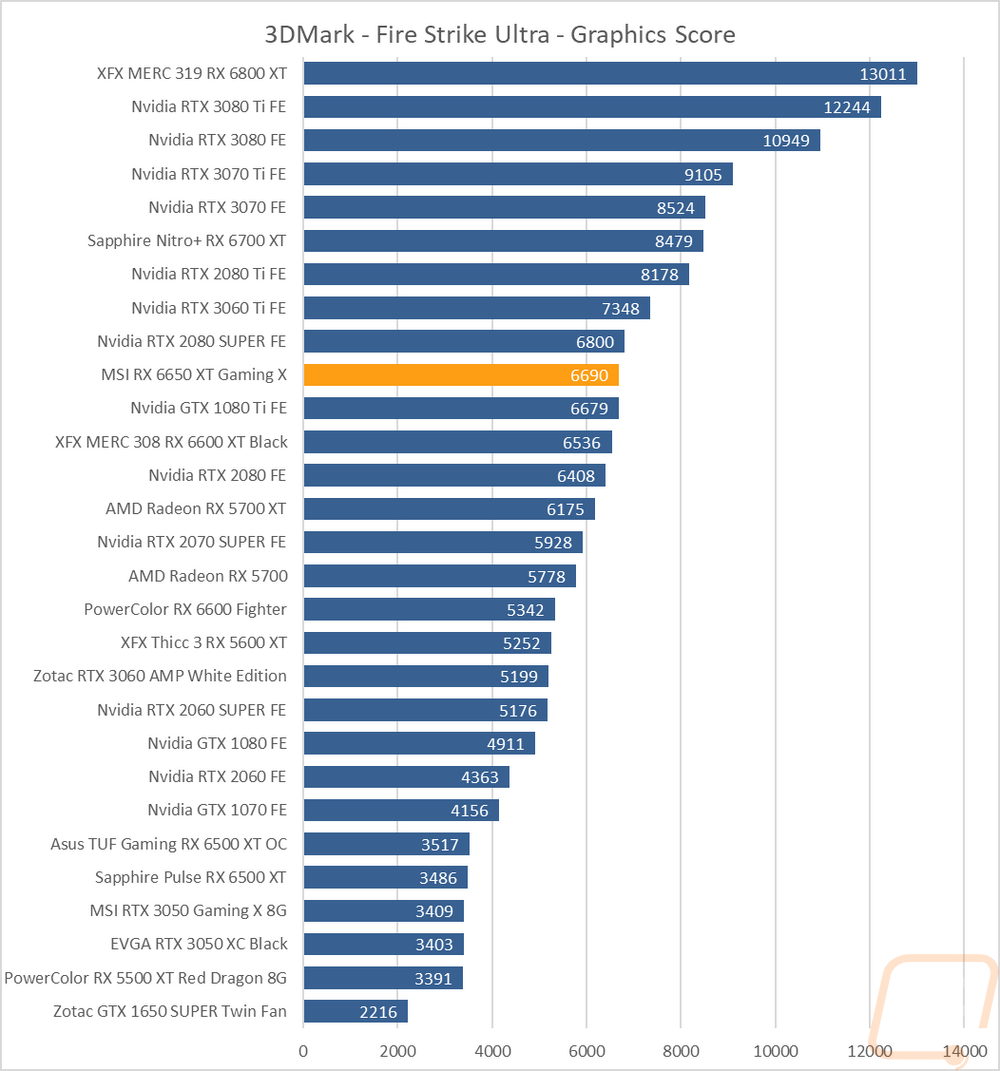
The first round of tests were done in the older Fire Strike benchmark which is a DX11 test. There are three detail levels, performance, extreme, and ultra. The 6650 XT Gaming X did very well in the base test coming in just behind the RTX 3060 Ti and ahead of the RTX 2080 SUPER. This was 1197 points above the 6600 XT as well. Going up into the Extreme and Ultra tests the 6650 XT Gaming X dropped behind the 2080 SUPER but is still in front of the original 2080 as well as the 6600 XT of course.
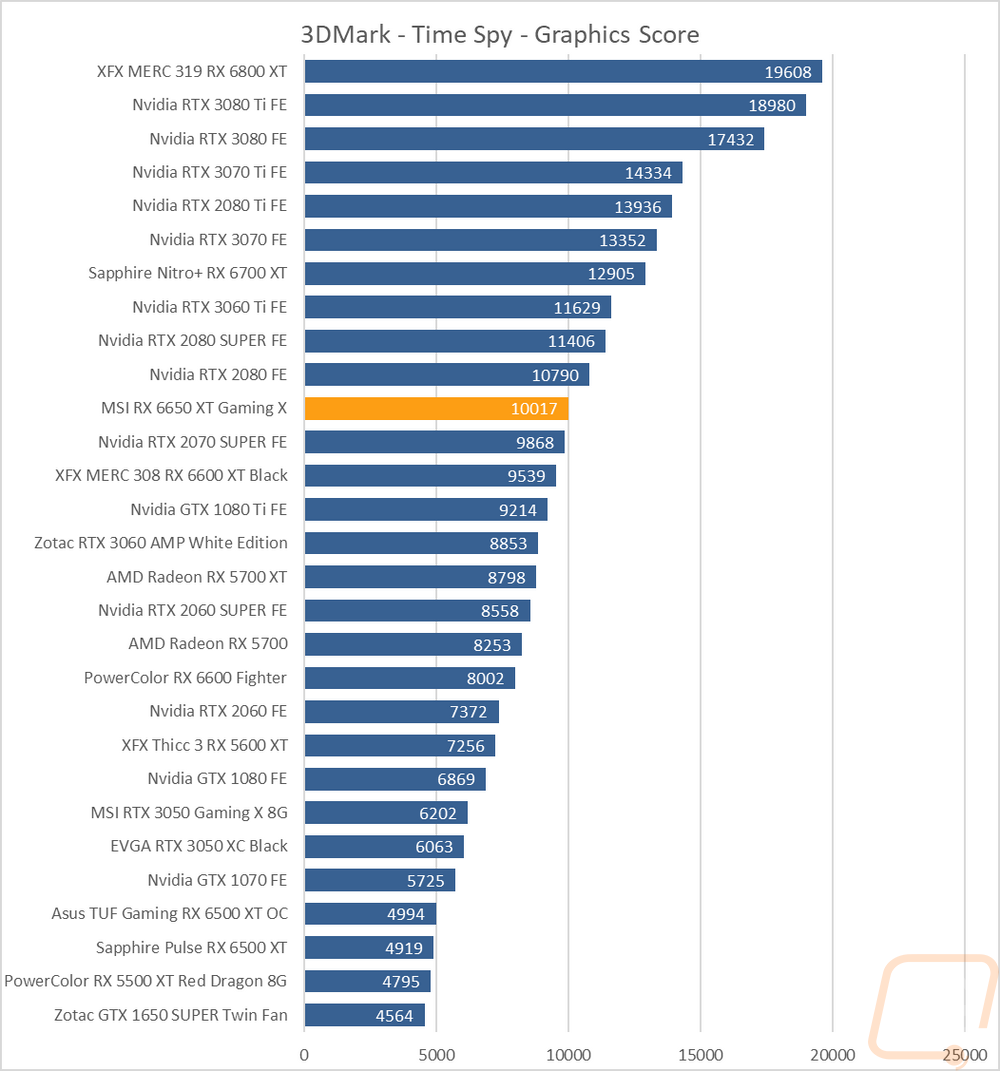
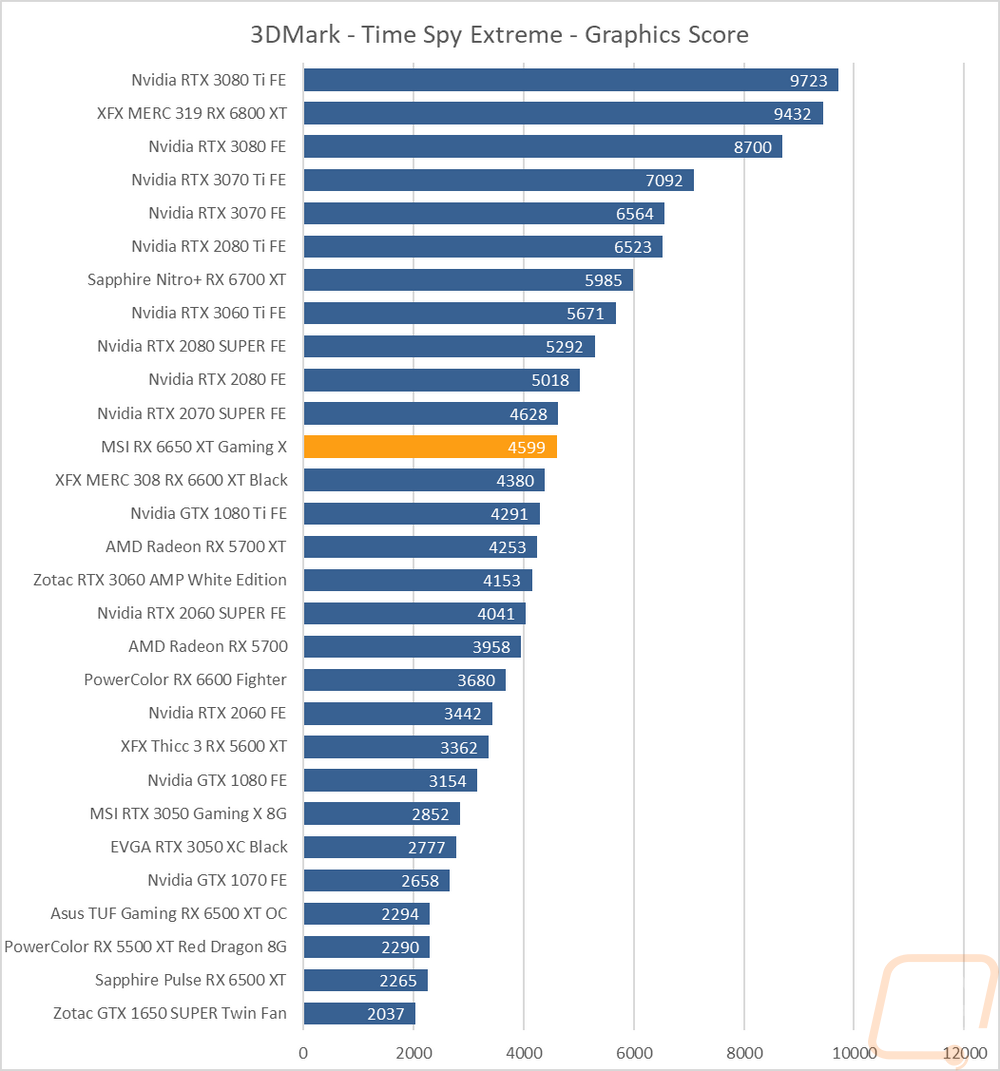
The next two were both based on the Time Spy benchmark. One is the standard test and then there is the extreme detail level. These tests are DX12-based and more in line with what you will see with modern games. The 6650 XT Gaming X is right with the 2070 SUPER in both tests with the SUPER behind it in the base Time Spy and the SUPER ahead in the Extreme test. Both are way out ahead of the RTX 3060 and especially in the extreme test I was surprised at the gap between the 6650 XT Gaming X and the 6600 XT.
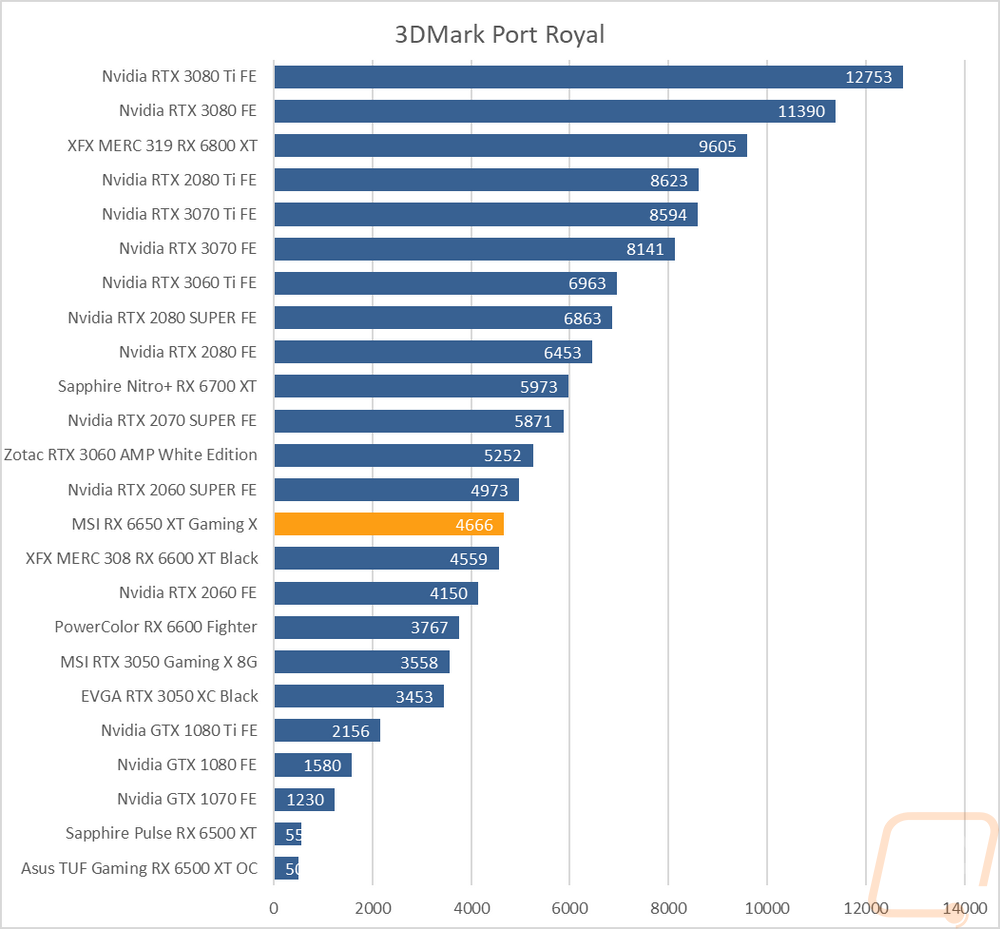
I did also check out ray tracking performance while doing my testing using the 3DMark Port Royal benchmark. The 6650 XT Gaming X did better than the 6600 XT but overall they both came in between the older RTX 2060 and the 2060 SUPER with the RTX 3060 way out ahead here.
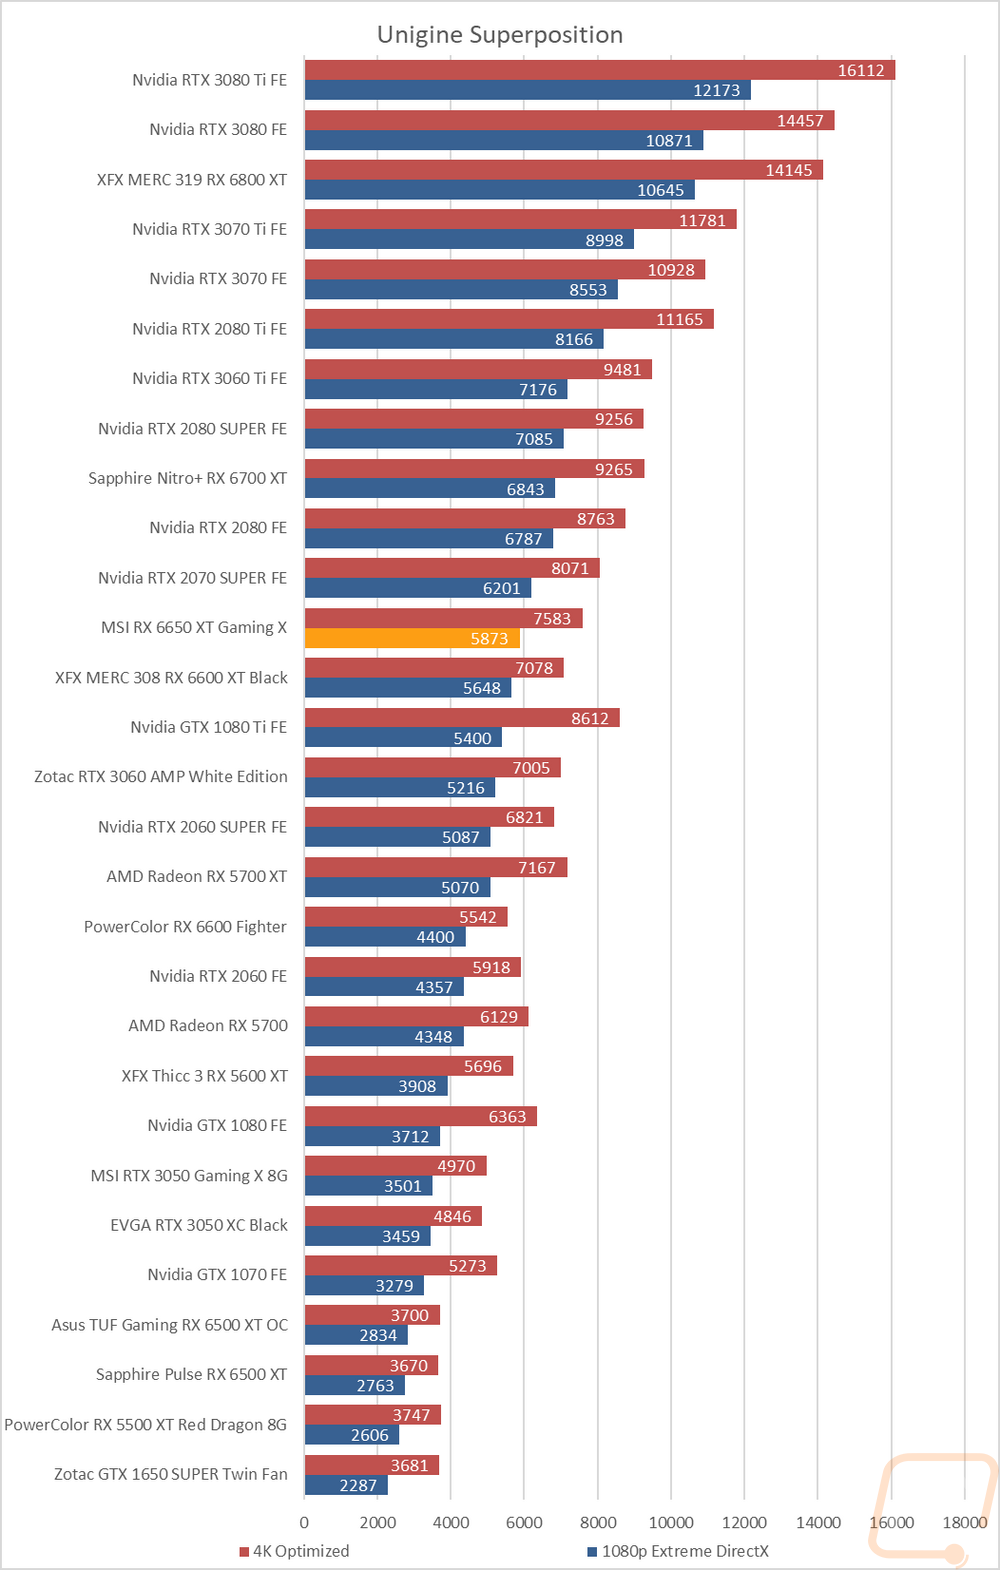
The last test was using the Unigine-based Superposition benchmark and I tested at 1080p with the extreme detail setting as well as the 4K optimized setting. In the extreme detail setting the 6650 XT Gaming X did well compared to the 6600 XT, especially at 4k. Both were also ahead of the RTX 3060 as well in both tests.
VR Benchmarks
As for Virtual Reality, I love it but it is more demanding than traditional gaming. This is partially because of the resolutions needed to render for two eyes and because they render more than what is immediately visible. But also because of post effects to get the proper “fisheye” effect for it to look proper in your eyes with the HMD. You also have to have much higher expectations for frame rates in VR, skipping frames or lower FPS can cause motion sickness in VR. Because of that, I ran a few tests.
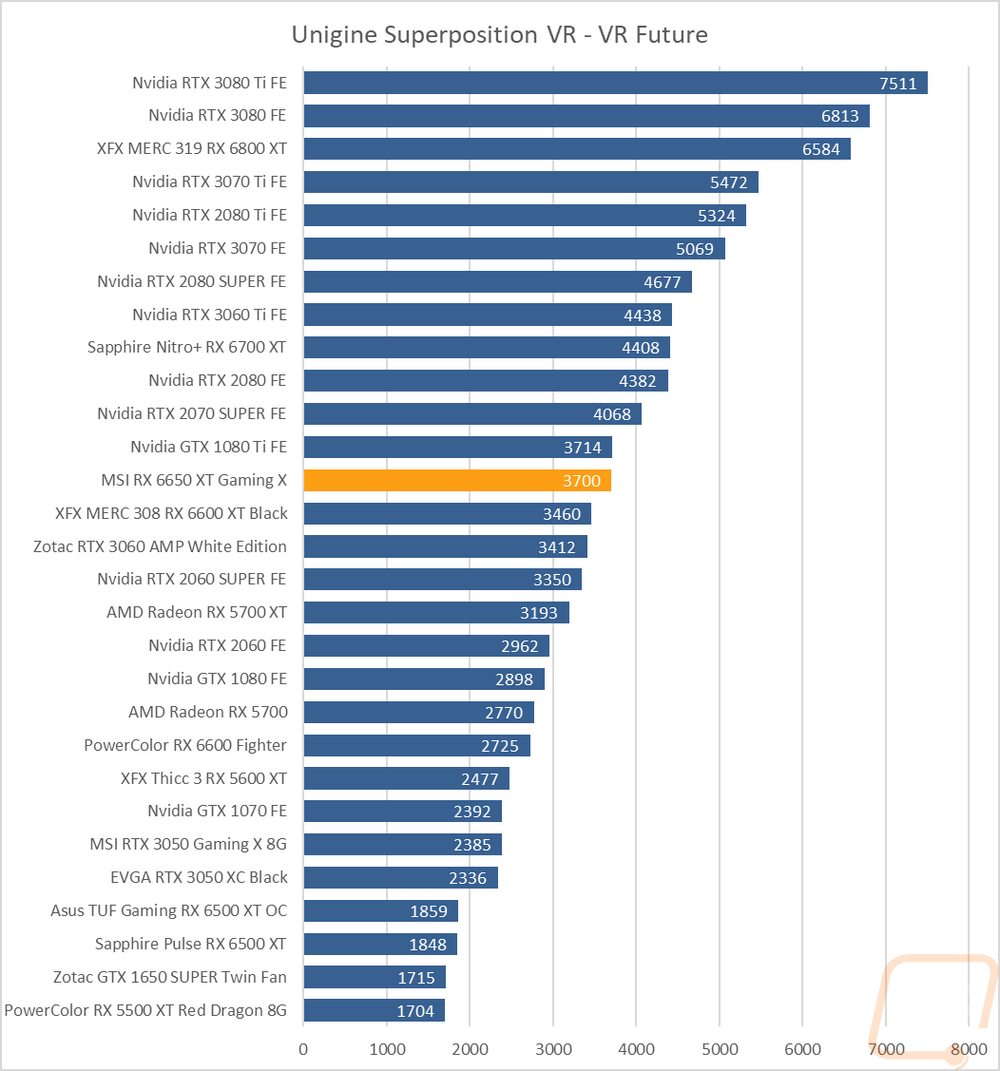
My first test was again in Superposition. This time I tested the VR Future test using the Oculus resolution. Here the 6650 XT Gaming X jumped out a lot past the 6600 XT which is closer to the 3060.
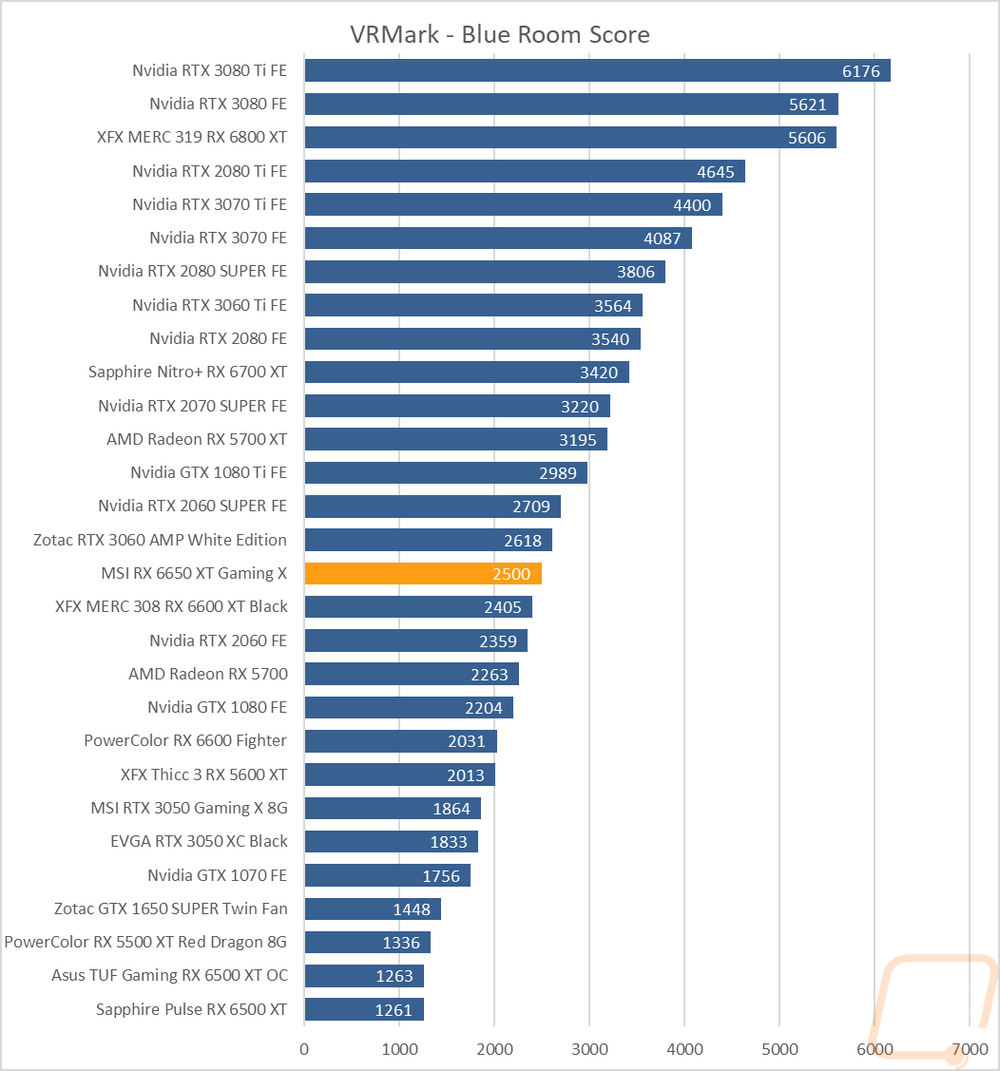
My second round of VR testing was in VRMark which has three tests that are similar to the VR tests in Superposition. I only focused on just the most demanding test called Blue Room that is looking more at future VR performance. The 6650 XT Gaming X didn’t do as well here with it coming in behind the RTX 3060 by a good amount but it does perform noticeably better than the 6600 XT with 95 more points.
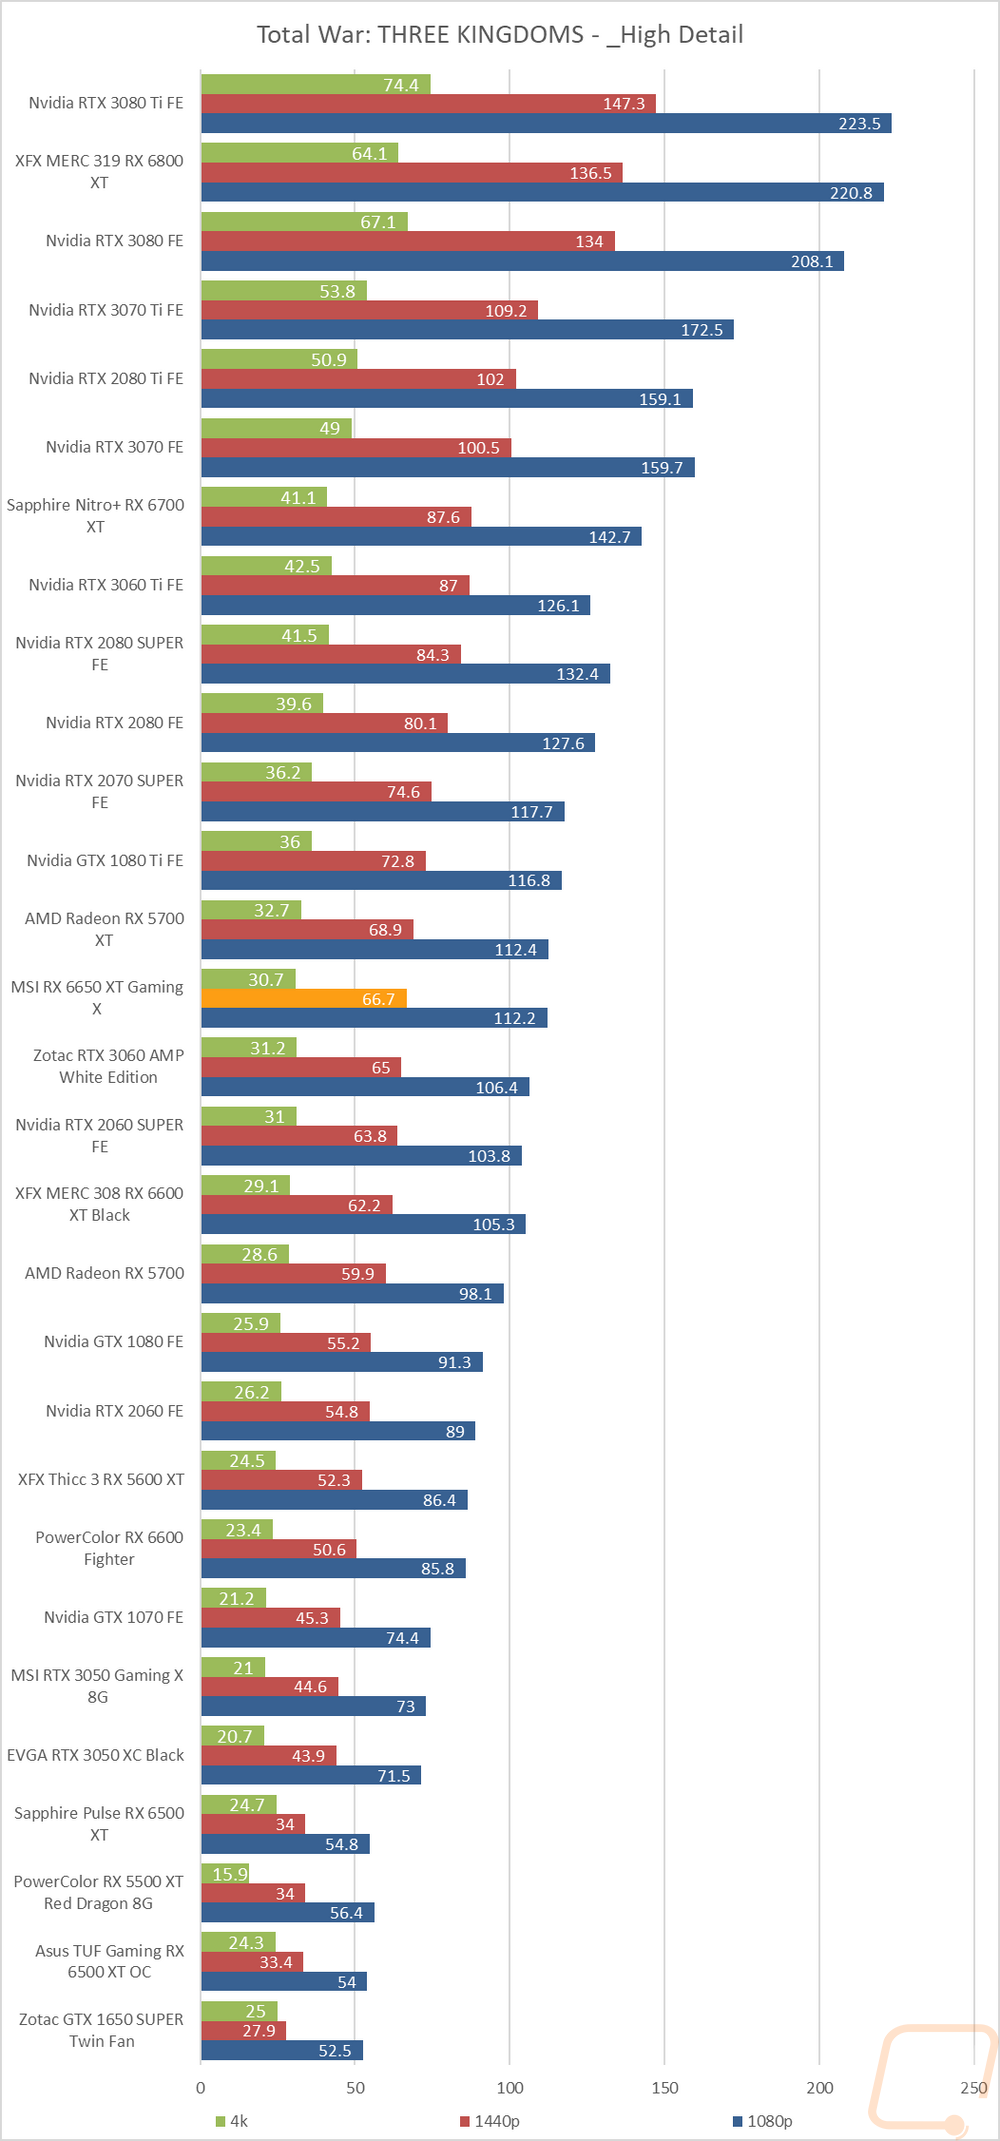
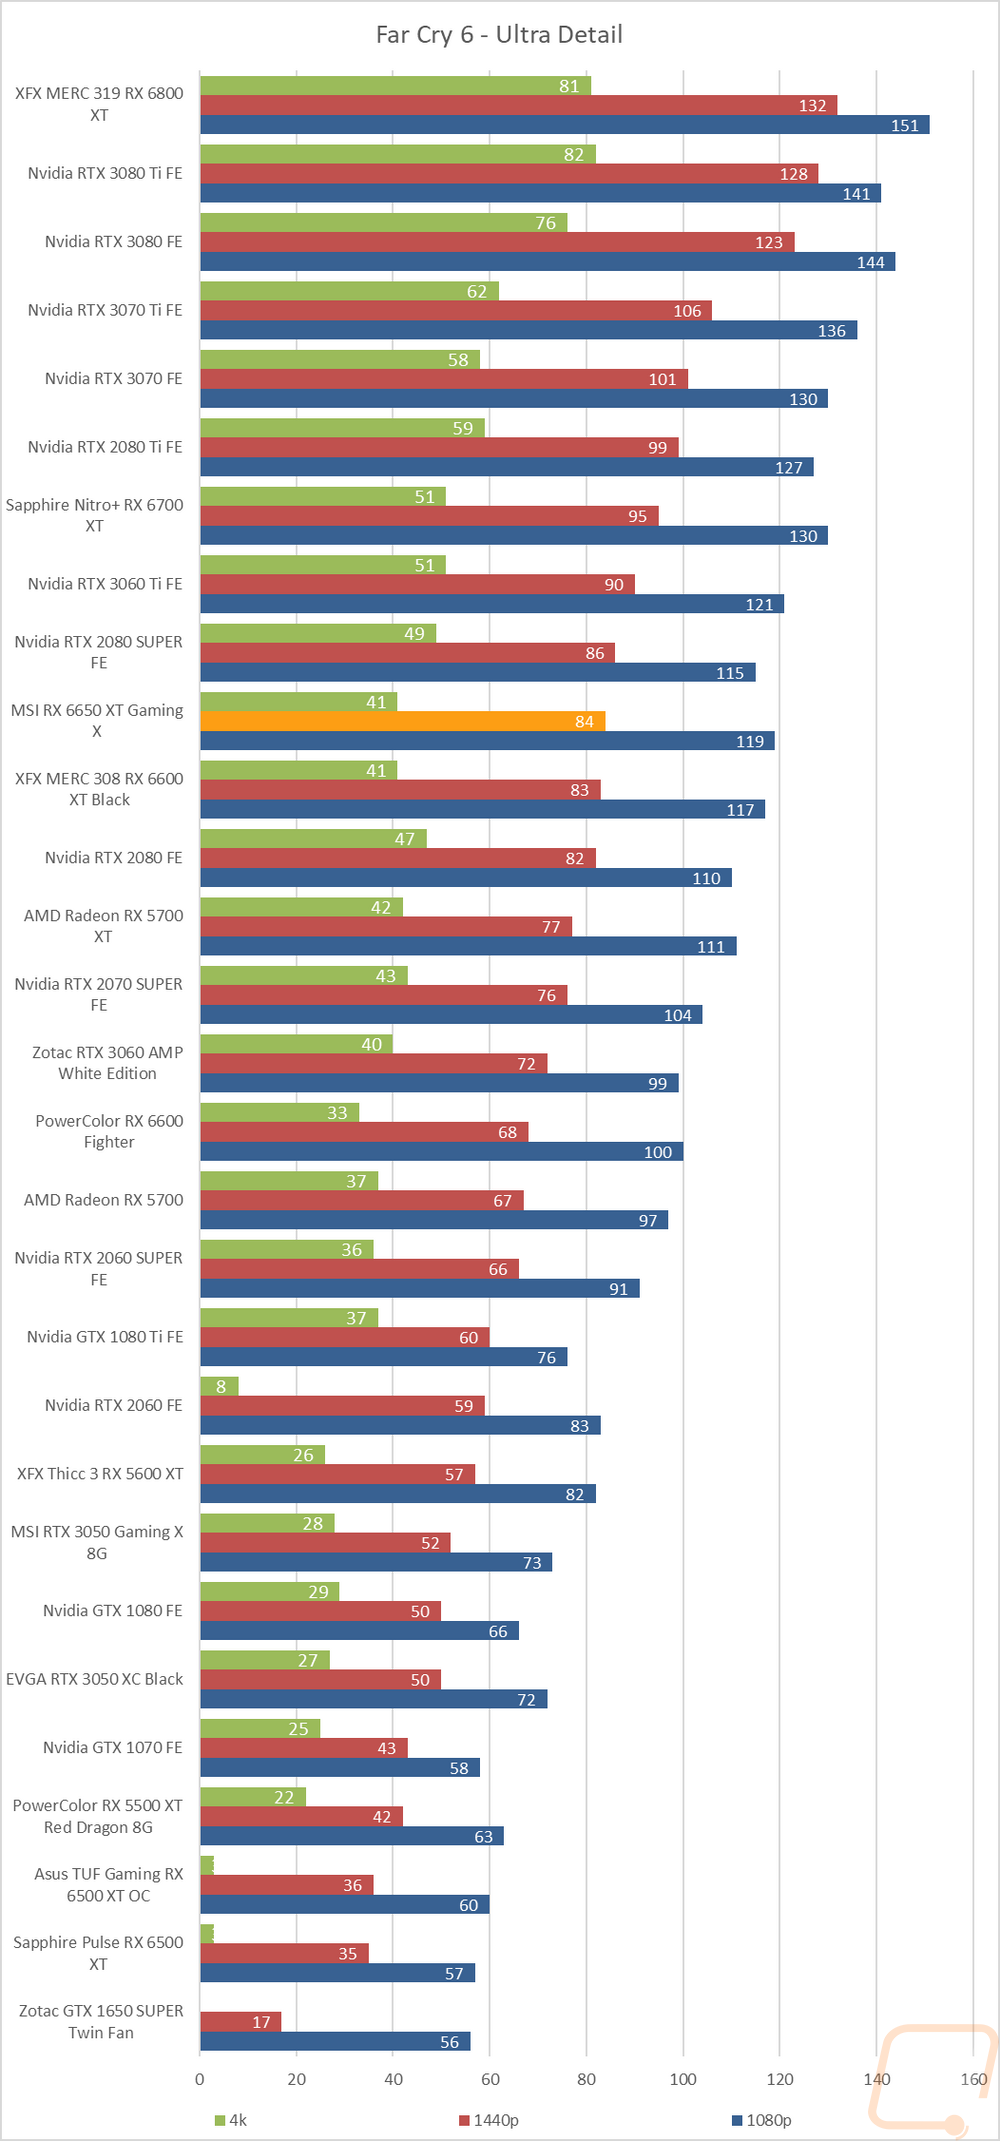
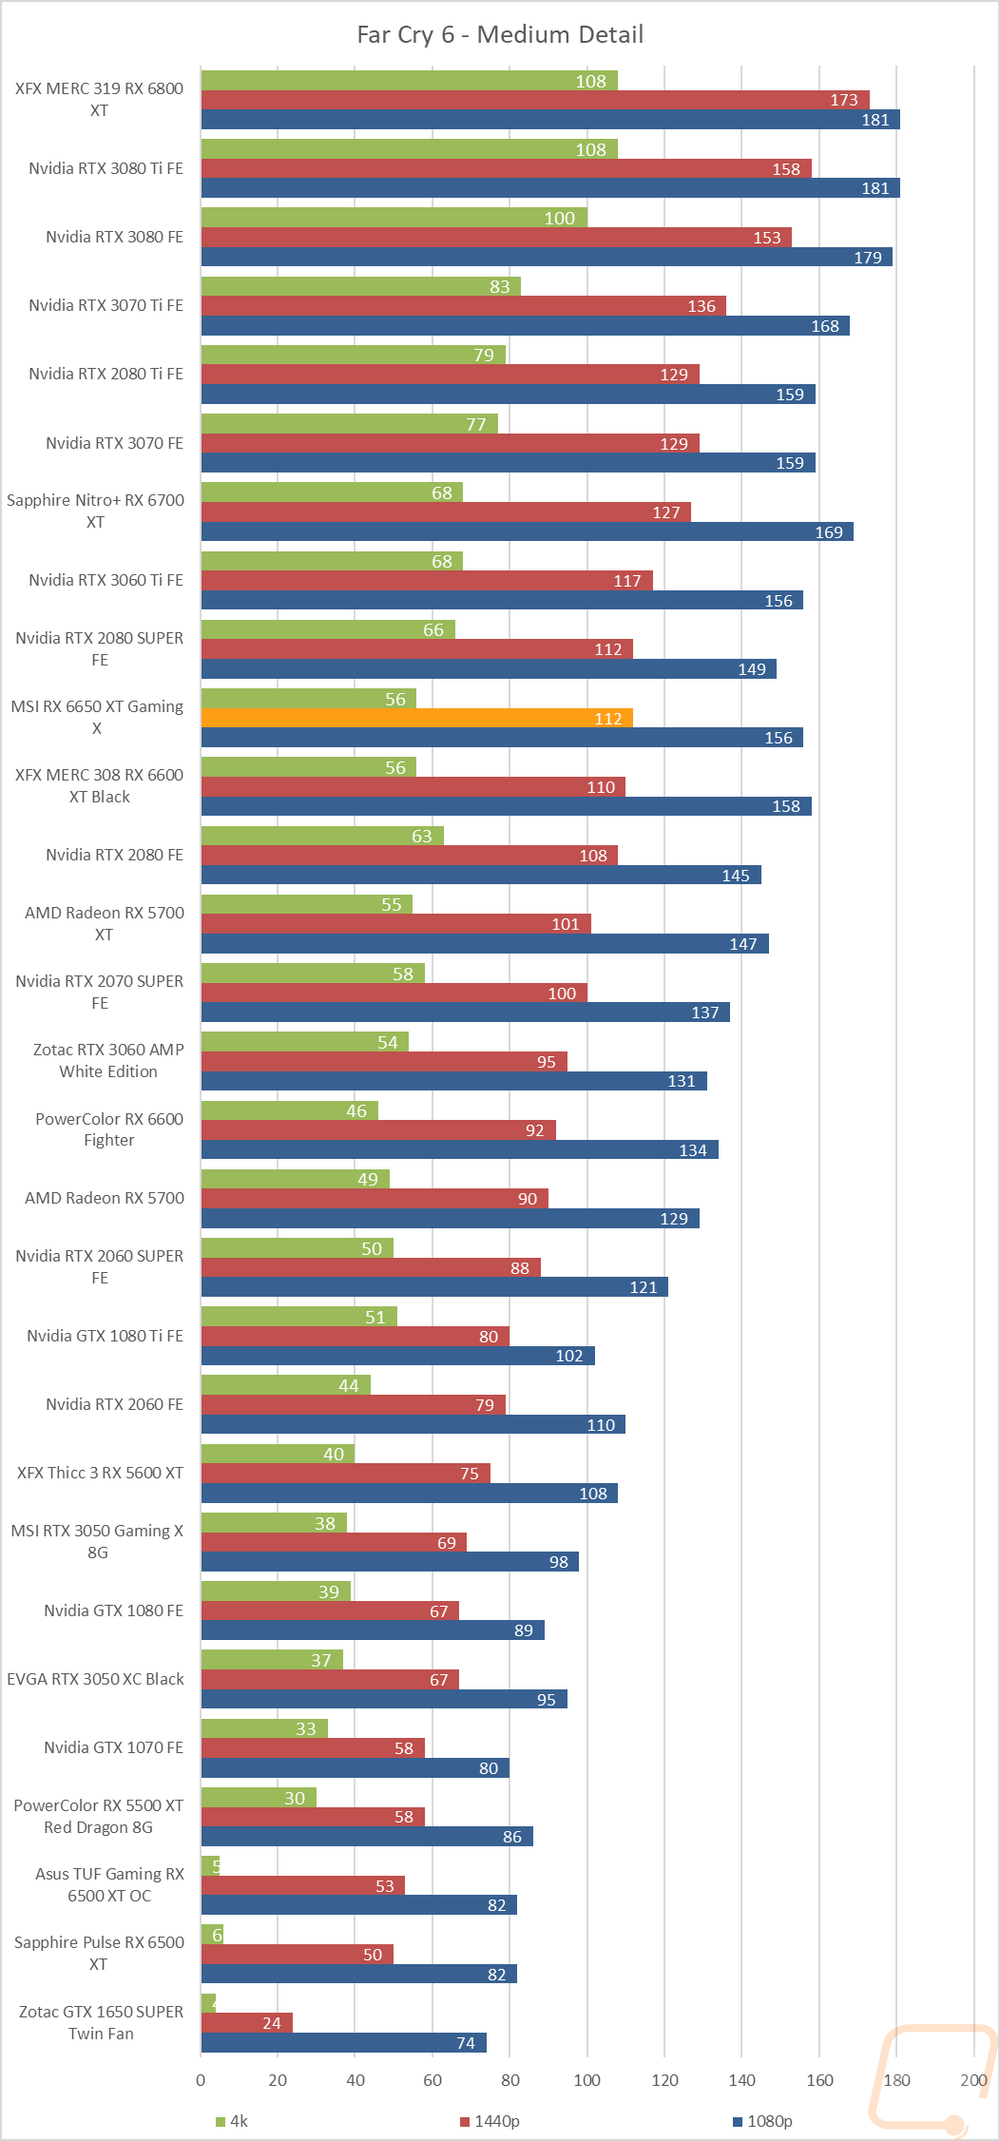
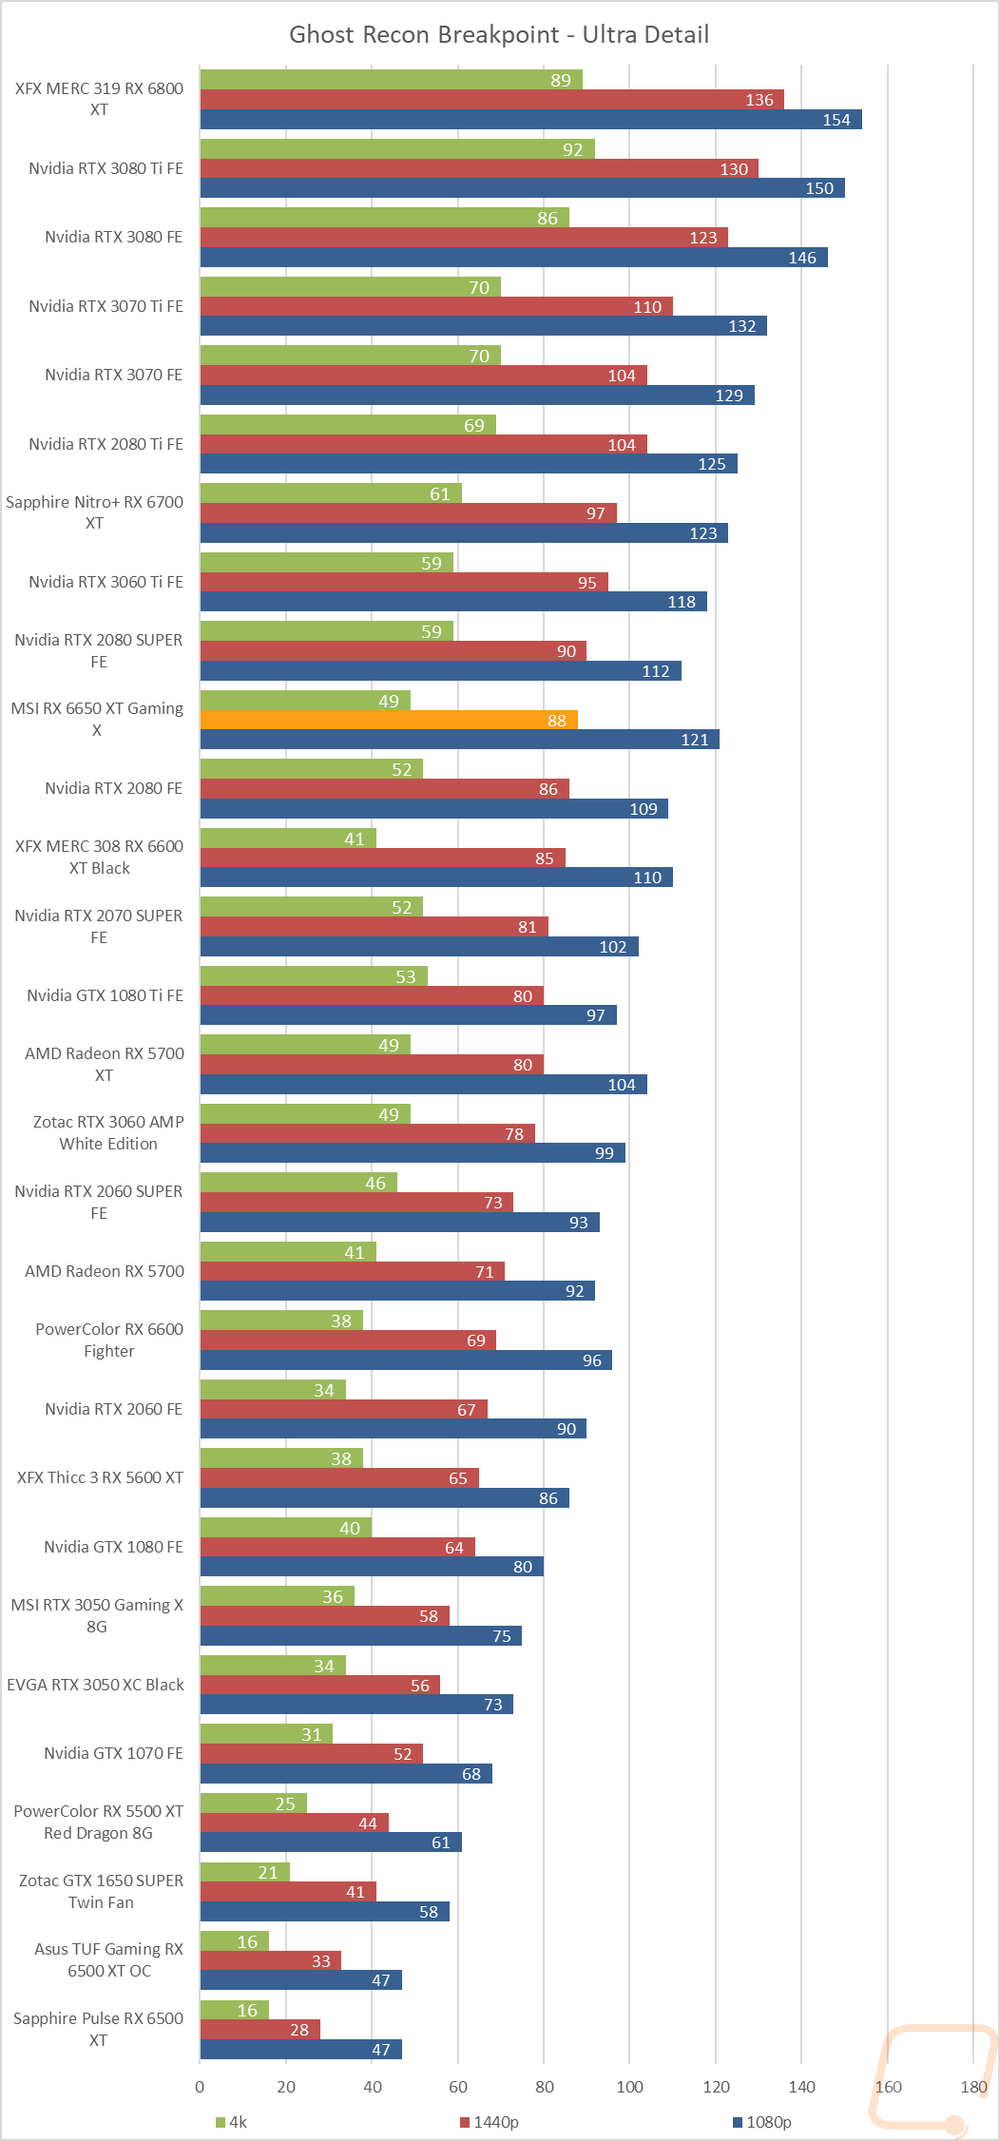
In-Game Benchmarks
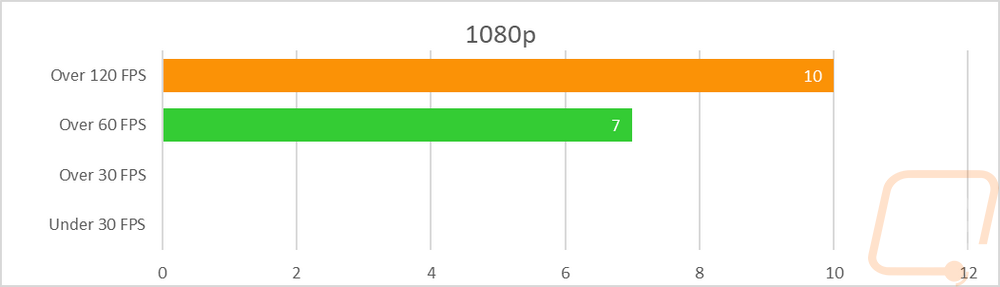
Now we finally get into the in game performance and that is the main reason people pick up a new video card. To test things out I ran through our new benchmark suite that tests 10 games at three different resolutions (1080p, 1440p, and 4k). Most of the games tested have been run at the highest detail setting and a mid-range detail setting to get a look at how turning things up hurts performance and to give an idea of if turning detail down from max will be beneficial for frame rates. In total, each video card is tested 54 times and that makes for a huge mess of results when you put them all together. To help with that I like to start with these overall playability graphs that take all of the results and give an easier-to-read result. I have one for each of the three resolutions and each is broken up into four FPS ranges. Under 30 FPS is considered unplayable, over 30 is playable but not ideal, over 60 is the sweet spot, and then over 120 FPS is for high refresh rate monitors.
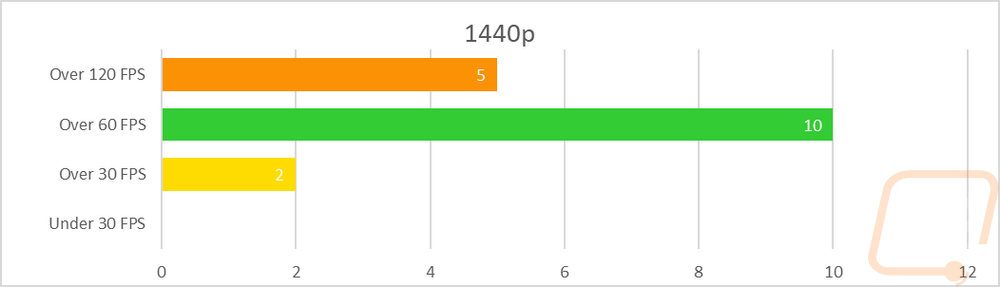
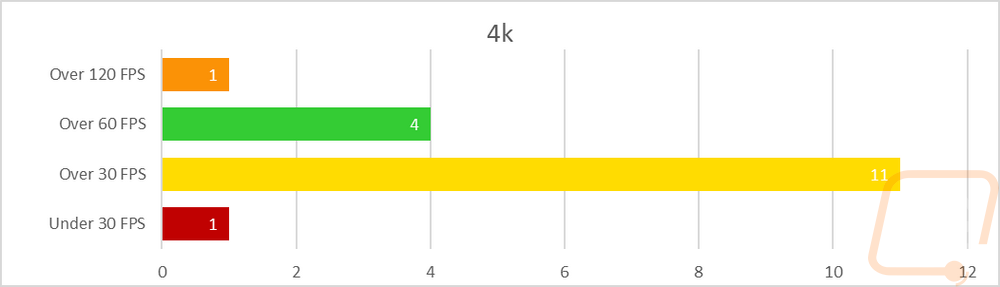
So how did the 6650 XT Gaming X do? Well in our AMD call they were showing the 6650 XT to be a 1080p focused card with the 6750 XT as a 1440 and the new 6950 XT as a 4K card. At 1080p the 6650 XT Gaming X ran into no troubles at all, 100 of the results were over 120 FPS with the other 7 running smooth at over 60 as well. Honestly, even at 1440p it is capable, 5 results were over 120 FPS at 1440p and 10 were over 60 FPS with just two in the playable but not smooth 30-59 FPS range. Then of course at 4K the 6650 XT Gaming X drops on its face with a majority of the results under 60 FPS and one even under 30 FPS. There were still a few games at 60 FPS with 4 over 60 and 1 over 120 FPS but I wouldn’t recommend it. Overall the 6650 XT Gaming X will handle anything at 1080p and will struggle a little more but can handle 1440p in some situations as well.
Of course, I have all of the actual in game results as well for anyone who wants to sort through the wall of graphs below. Looking through them the 6650 XT Gaming X is of course consistently faster than its predecessor the 6600 XT. But did that improvement help in comparison with any other cards? Well, when averaged out we can see that the 6650 XT Gaming X jumped out ahead of the RTX 3060 by a clear margin where before with the 6600 XT sometimes the 3060 would be faster.
|
|
1080p |
1440p |
4k |
|
RTX 3060 |
135.66 |
98.02 |
55.2 |
|
RX 6600 XT |
146.57 |
104.3 |
56.09 |
|
RX 6650 XT |
154.43 |
113.43 |
59.62 |
Compute Benchmarks
Now some people don’t need a video card for gaming, they need the processing power for rendering or 2D/3D production, or in some cases people who game also do work on the side. So it is also important to check out the compute performance on all of the video cards that come in. That includes doing a few different tests. My first test was a simple GPU Compute benchmark using Passmark’s Performance Test 10 and the 6650 XT Gaming X came in ahead of the RTX 2080 SUPER but still behind the RTX 3060 here. Comparing it to the 6600 XT it did gain 595 points which isn’t bad as well.
Blender is always my favorite compute benchmark because the open-source 3D rendering software is very popular and it isn’t a synthetic benchmark. With the latest version of Blender, they redid the benchmark so we now have a new test that runs three different renderings and gives each a score. I have all three stacked together so we can see the overall performance. The 6650 XT Gaming X and the older 6600 XT perform similarly here with just a few points difference in each of the tests but the 6650 XT Gaming X does edge out when it is all combined together.
Cooling Noise and Power
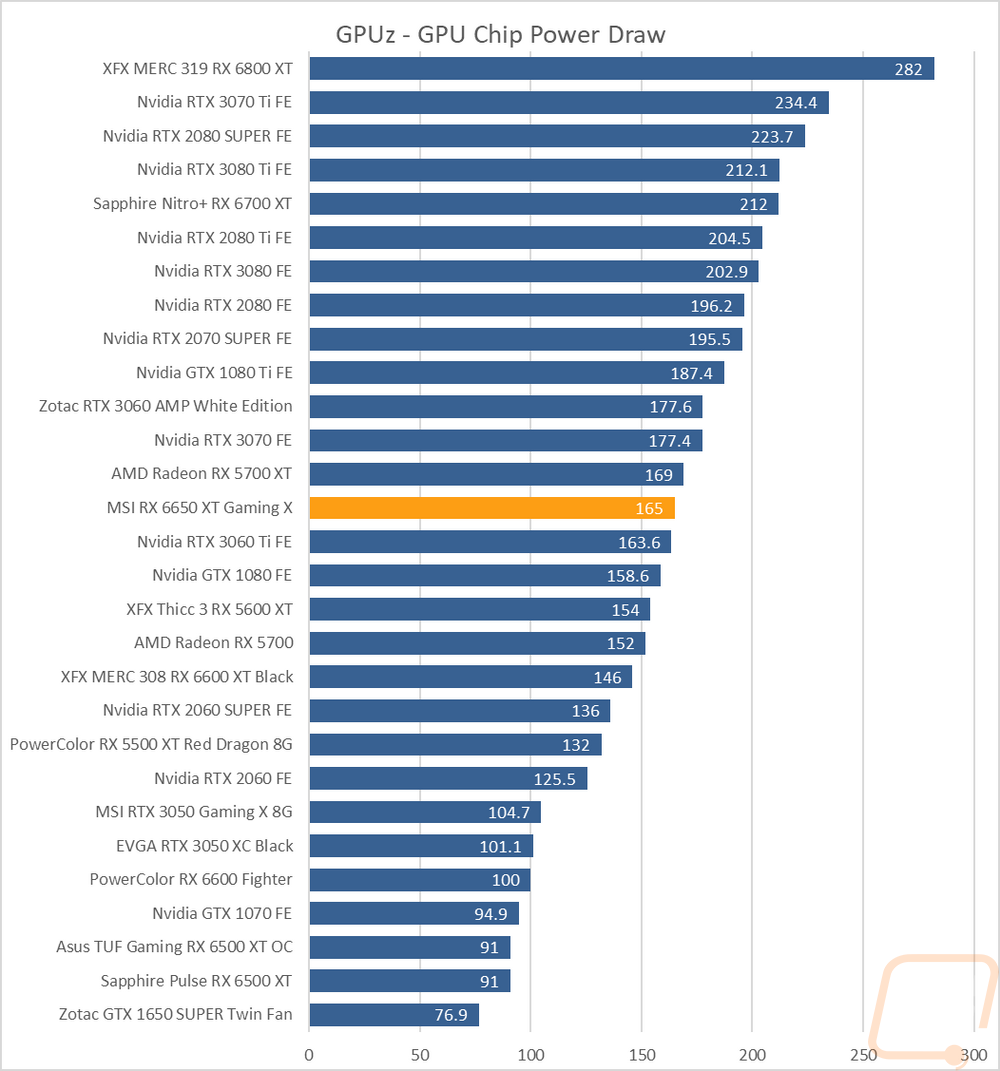
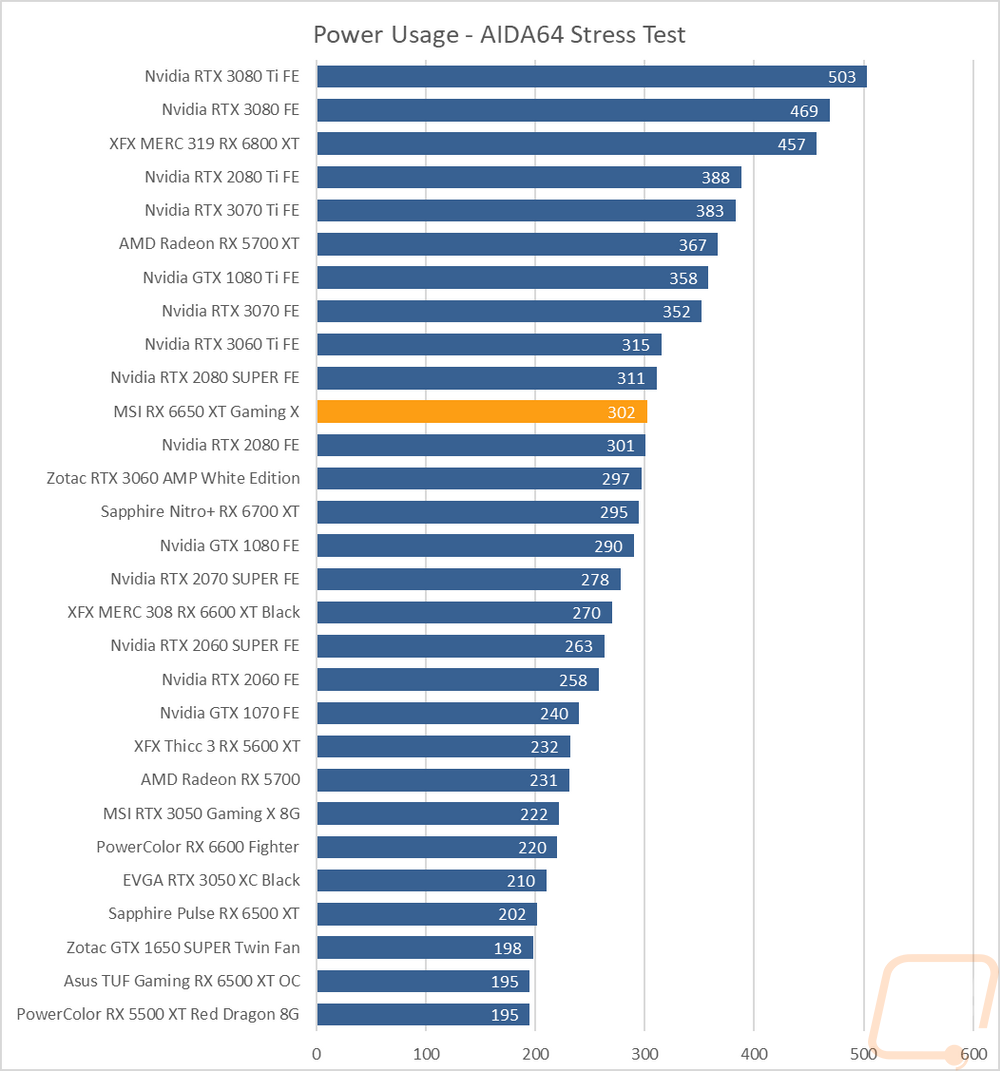
For my last few tests, rather than focusing on in game performance, I like to check out other aspects of video card performance. These are also the most important ways to differentiate the performance between cards that have the same GPU. To start things off I took a look at power usage. For this, I use our Kill-A-Watt hooked up to the test bench to record the total wattage of the system. I ran two tests with the first using 3DMark Time Spy to put the system under a load similar to normal in game performance. Here our test system with the 6650 XT Gaming X pulled 344 watts in total putting it right with the stock GTX 1080 FE as an example of how things have changed over the last few generations. For comparison, the overclocked 6600 XT was lower at 327 watts and the 6650 XT Gaming X sits in between the 3060 Ti and the 3060 which is similar to how it performed in Time Spy as well. At the same time with Time Spy I also use GPUz to check out the onboard reading for GPU power draw at the chip. Our 6650 XT Gaming X pulled 165 watts and for comparison, the 6600 XT did 146. Lastly, I run AIDA64’s stress test on the video card to load up only the GPU, and using the Kill-A-Watt the test bench with the 6650 XT Gaming X pulled 302 watts here running right in the middle of the RTX 2080s, 32 watts higher than the 6600 XT.
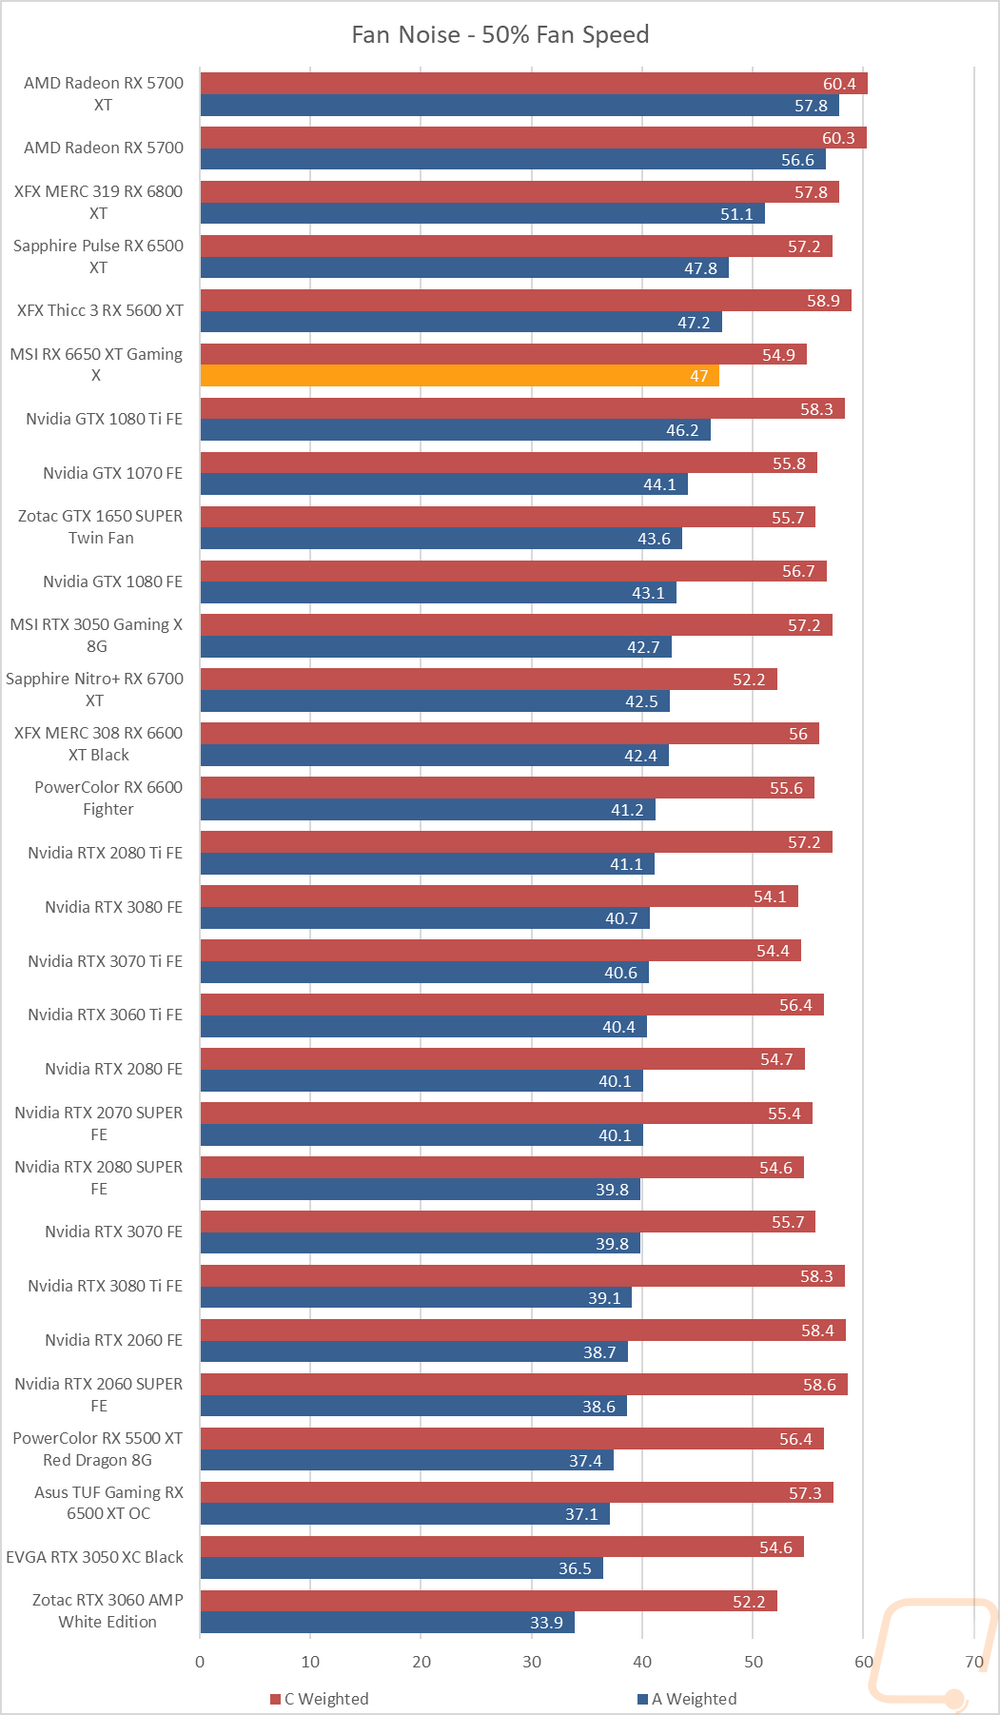
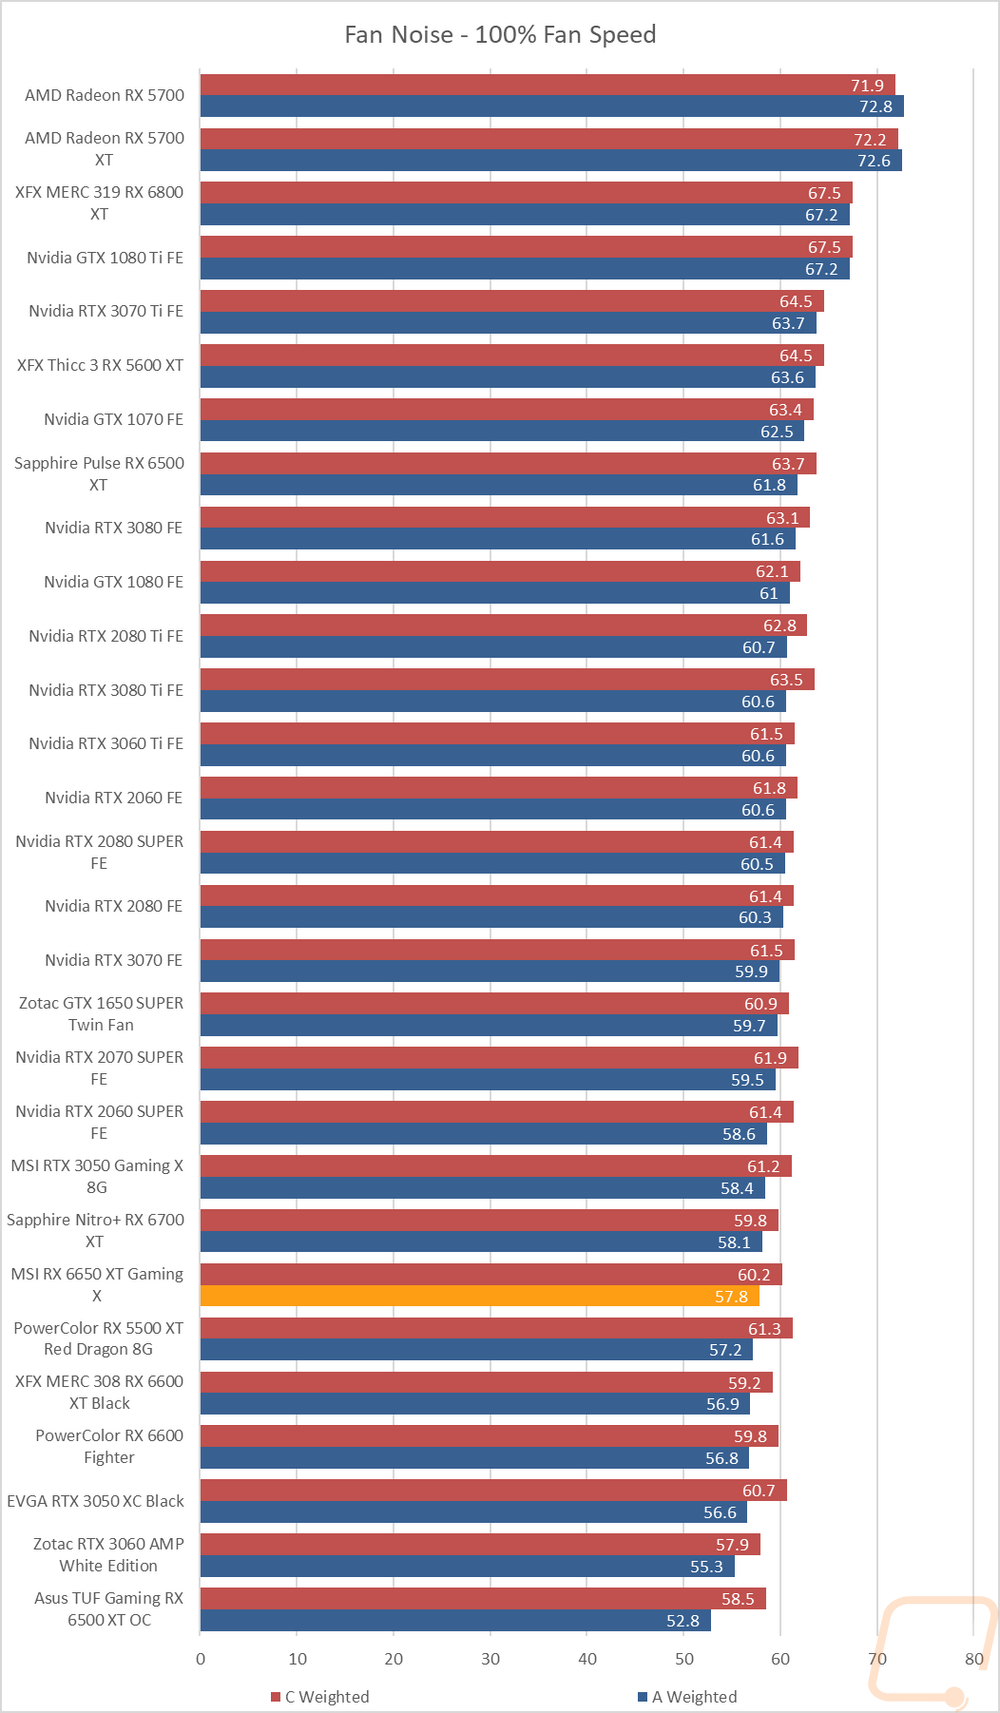
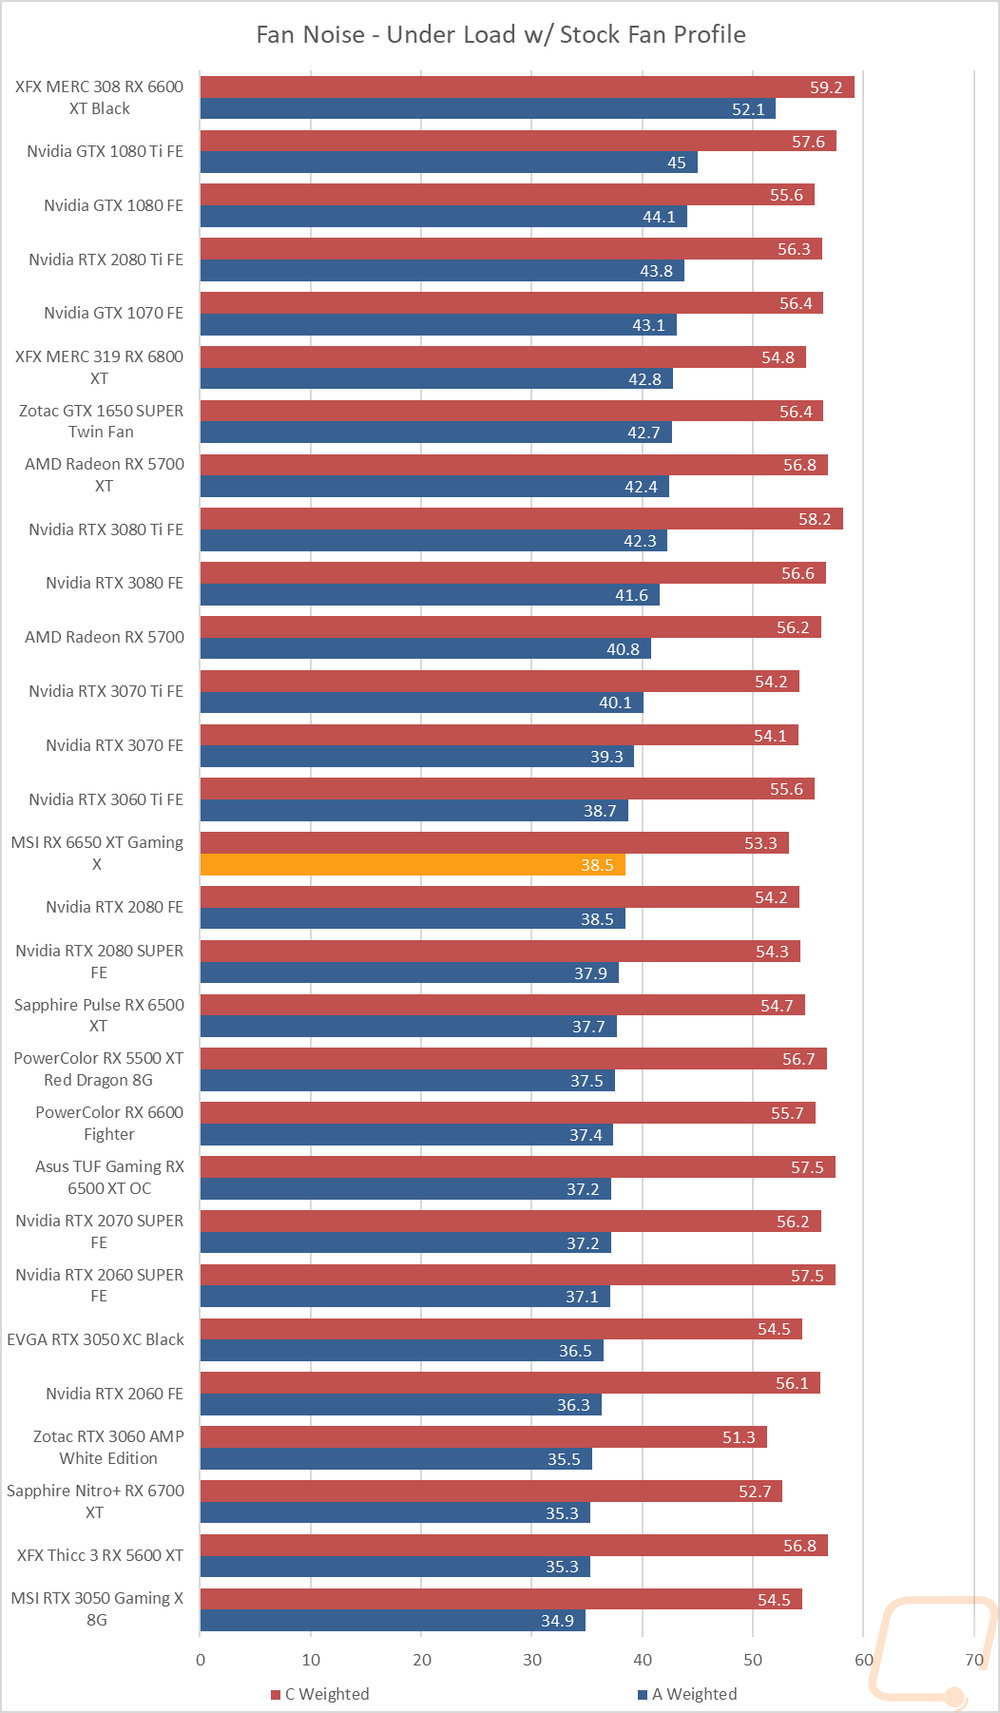
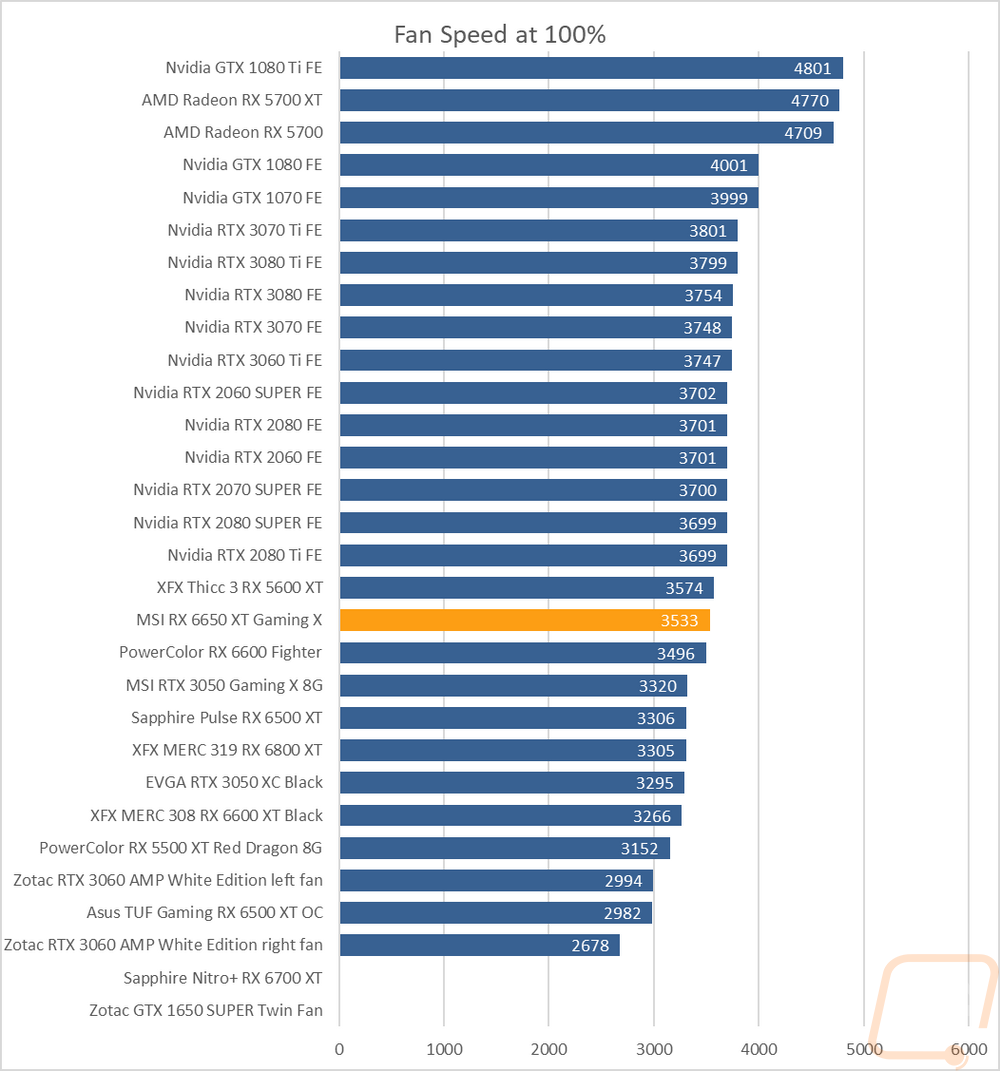
My next round of tests were looking at noise levels. These are especially important to me because I can’t stand to listen to my PC whirling. Especially when I’m not in game and other applications are using the GPU. For my testing, though I first tested with the fan cranked up to 100% to get an idea of how loud it can get, then again at 50% to get an idea of its range. I test using both A and C weighting, A is the standard way and C has a little more of the low end to check for low-level hums. The 6650 XT Gaming X did surprisingly well when running at 100% fan speed but at 50% fan speed was noisier than it should be. I also take a look at noise performance while under load. For that when running AIDA64’s stress test I wait until the temperature of the card has leveled off and then measure how loud things are when the card is at its worst-case scenario with the stock fan profile. Under load, the 6650 XT Gaming X came in right in the middle of the charts at 38.5 decibels.
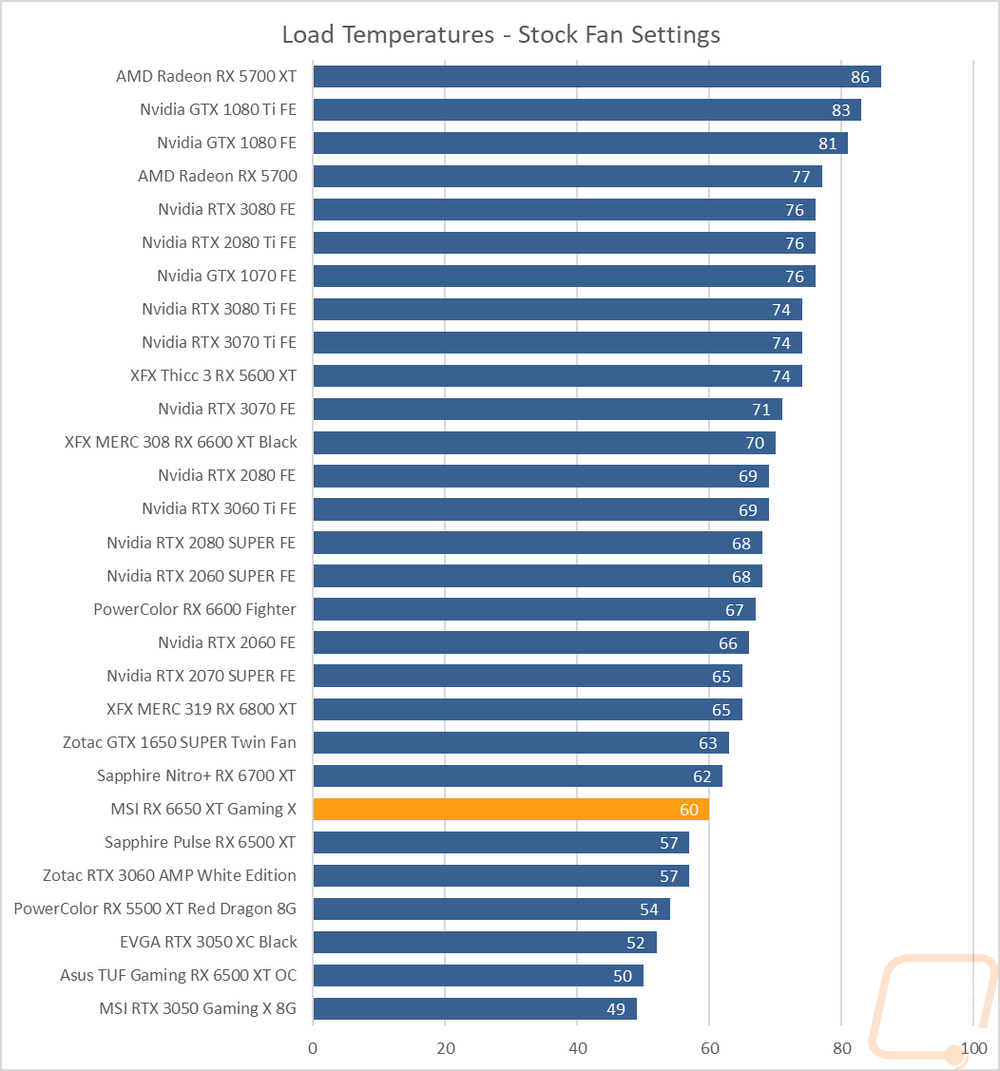
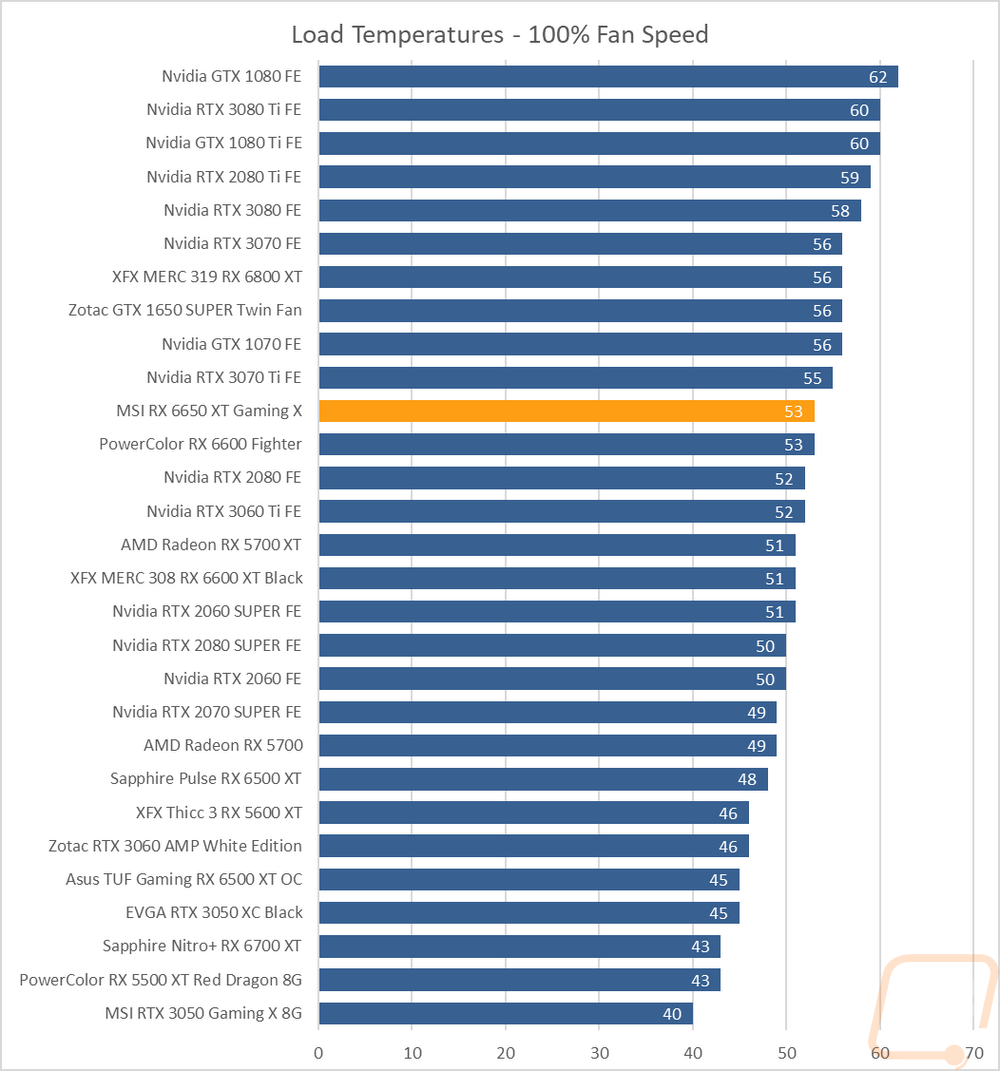
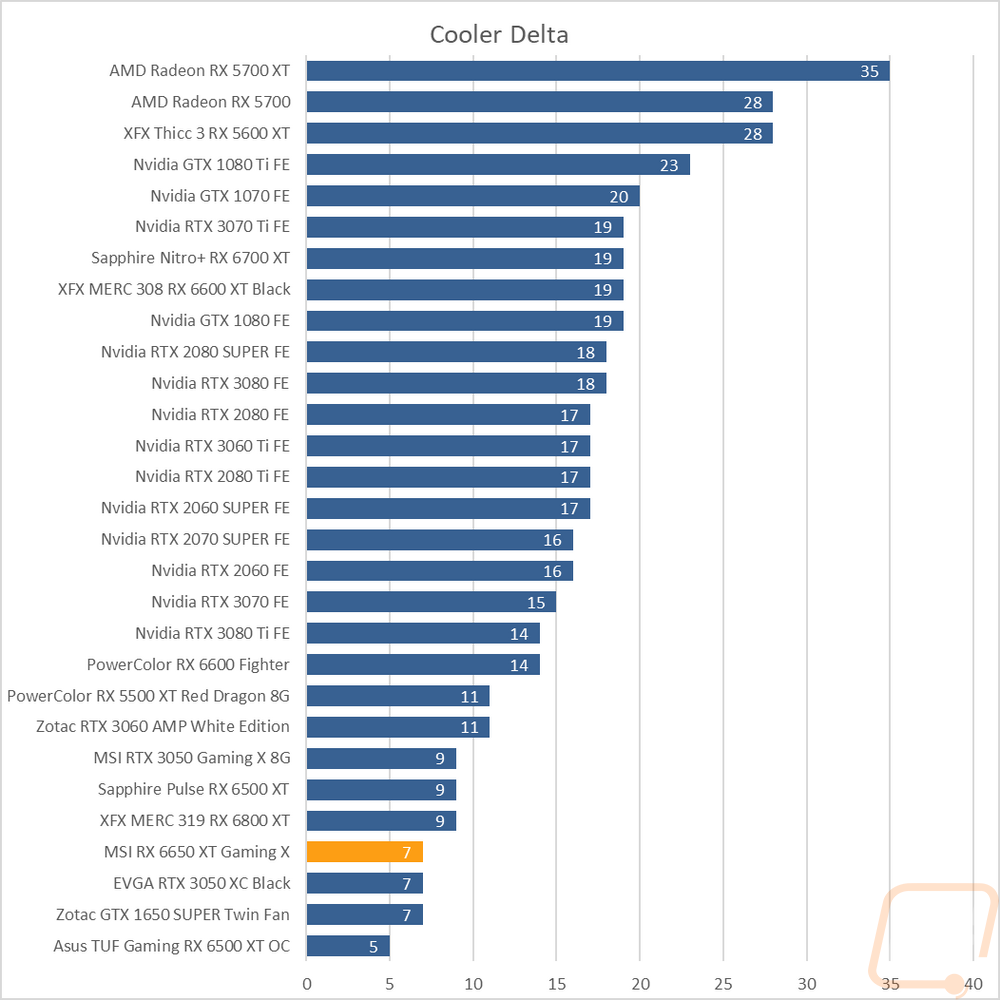
To finish up my testing I of course had to check out the cooling performance. To do this I ran two different tests. I used AIDA64’s Stress Test run for a half-hour each to warm things up. Then I documented what temperature the GPU leveled out at with the stock fan profile and then again with the fans cranked up to 100%. With the stock profile, the 6650 XT Gaming X leveled off at 60 degrees which was really good and well below the XFX 6600 XT in the same situation. Then with the fans cranked up, the 6650 XT Gaming X ran at 53 degrees which was higher up in the charts. The difference between the two was a delta of 7 degrees which is low showing that while the cooling on the 6650 XT Gaming X is solid there isn’t a ton of headroom. MSI has the stock fan profile tuned perfectly though as far as cooling goes.
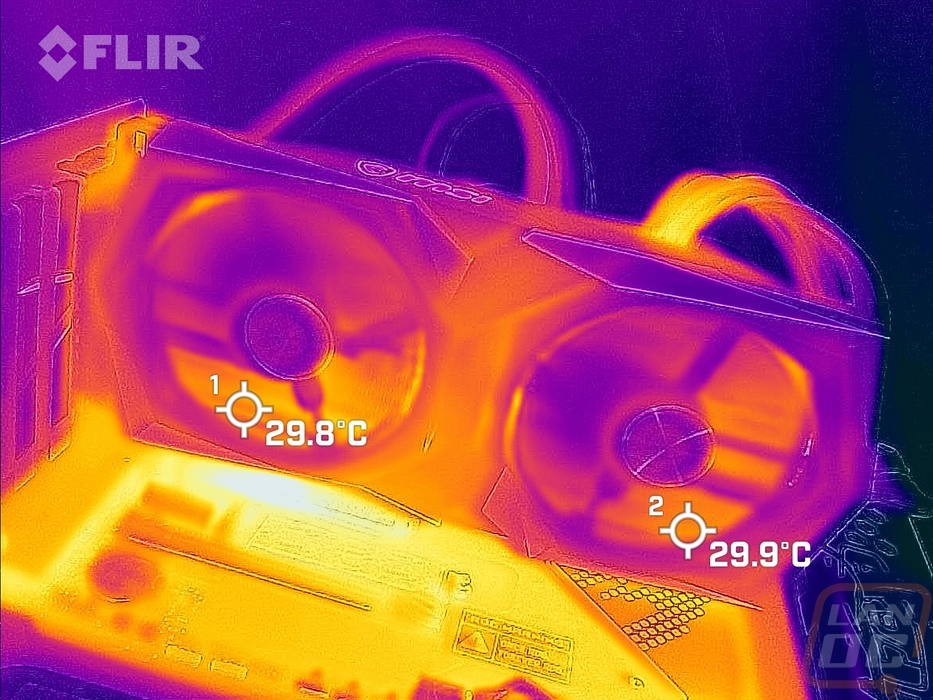
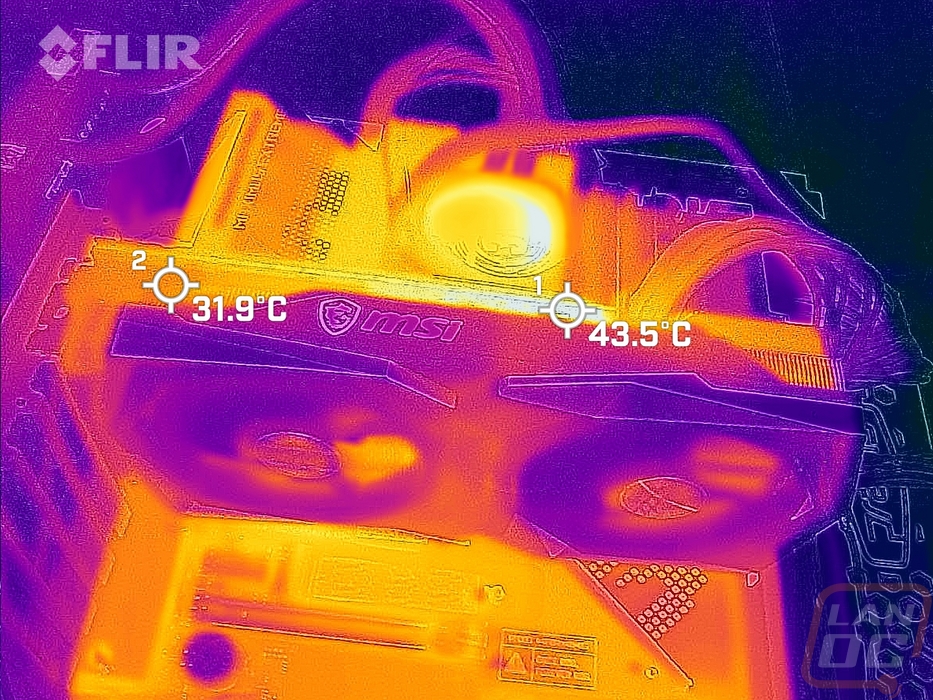
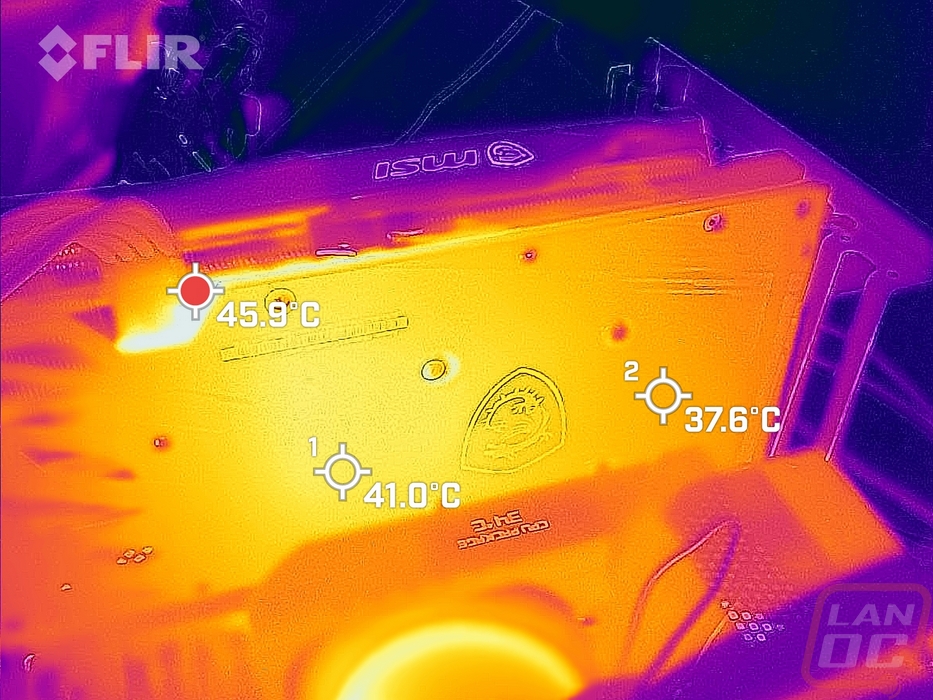
While running the stock fan profile testing I also took the time to get a few thermal images so we could see what is going on. On the fan side of the 6650 XT Gaming X, we can see how the heat blowing out of the bottom of the card collects up against the motherboard. This is an issue with most aftermarket cards and can heat up your M.2 drive if you have it installed there. Beyond that, though this side is running cool. On the top edge, we can see how the heat is blowing out of the top, especially with the power cord showing the heat up a few inches. Then for the backplate, The hottest area is actually to the left of the GPU here, not directly behind the GPU like we would normally see. Then down at the end where the vents are cut into the backplate things are running cool.
Overall and Final Verdict
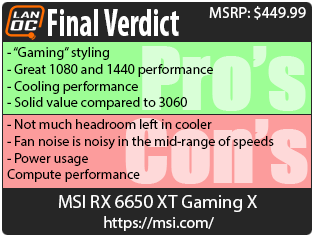
While AMD's new refresh isn’t any new silicon, the bump in clock speeds especially with our overclocked MSI RX 6650 XT Gaming X was enough to show a big performance improvement when compared to the original RX 6600 XT that we took a look at. That difference was especially noticeable in our game benchmarks where the 6600 XT and the RTX 3060 used to trade blows the 6650 XT is out ahead consistently. This translates to 1080p performance that should handle anything you throw at it and even at 1440p, the 6650 XT didn’t do too bad as long as you are a little careful with settings on the most demanding games. The performance improvement didn’t make much of a difference when we got into the compute tests.
As far as the MSI RX 6650 XT Gaming X goes, MSI didn’t change anything up with the design so if you love the gamer-focused angular designs you will love the styling on the RX 6650 XT Gaming X. I wish that some of the RGB accents from the higher end Gaming X cards were on the RX 6650 XT Gaming X, it only has the backlit logo up on top. For cooling the RX 6650 XT Gaming X did well, especially when testing with the stock fan profile which was right on point. The cooler being the same as the RX 6600 XT before does mean there wasn’t much headroom left when I turned the fan speeds up. But given how cool it was running overall you could still edge a little more performance out with an overclock without any worries. With the cooler working a little harder than normal the RX 6650 XT Gaming X didn’t top the charts for noise and was a little loud when I tested in the 50% fan speed range which is unusual for the Gaming X cards. The higher clock speed and the overclock on our card also didn’t help things when it came to power usage which were relatively high.
For the last few years, GPU pricing has been just all over the place with relatively exciting MSRPs combined with out of this world pricing in the real world. That pricing has started to come down and with the 6650 XT launch, AMD is suggesting that the cards will start at $399. The MSI RX 6650 XT Gaming X on the other hand is listed at the launch today at $449.99 so you are paying a little bit of a premium for the small overclock and the cooling performance. But at least we are back to real-world pricing. For comparison, the RTX 3060’s are starting at $429.99 on Newegg right now, and given what we have seen for performance this makes the RX 6650 XT a solid deal. AMD has also announced their “Raise the Game” bundle which should add a free game into the mix as well.

Live Pricing: HERE


