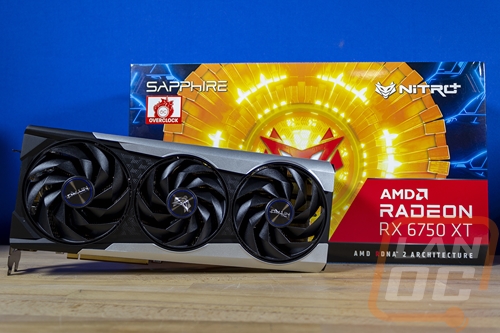
With today's launch of AMD’s 6X50 XT refresh AMD have introduced three new video card options into their lineup. I’ve already taken a look at the new RX 6650 XT with the MSI RX 6650 Gaming X which competed well against the RTX 3060. Now I’m excited to see what the RX 6750 XT is all about which falls into AMDs 1440p focused cards and is targeted in between the RTX 3070 and the RTX 3060 Ti along with some aggressive pricing as well. I’ve got the Sapphire Nitro+ RX 6750 XT which is exciting not just because their Nitro+ cards normally perform well, but because we also have the Nitro+ RX 6700 XT on hand to really get a good look at how the increased clock speed of the 6750 XT effects things. So let’s jump in and see how it does!
Product Name: Sapphire Nitro+ RX 6750 XT
Review Sample Provided by: Sapphire
Written by: Wes Compton
Amazon Affiliate Link: HERE
|
Specifications |
RX 6600 XT |
RX 6650 XT |
RX 6700 XT |
RX 6750 XT |
RX 6900 XT |
RX 6950 XT |
|
Architecture |
RDNA 2 |
RDNA 2 |
RDNA 2 |
RDNA 2 |
RDNA 2 |
RDNA 2 |
|
Manufacturing Process |
7nm |
7nm |
7nm |
7nm |
7nm |
7nm |
|
Transistor Count |
11.1 Billion |
11.1 Billion |
17.2 Billion |
17.2 Billion |
26.8 Billion |
26.8 Billion |
|
Die Size |
237 mm² |
237 mm² |
335 mm² |
335 mm² |
520 mm² |
520 mm² |
|
Compute Units |
32 |
32 |
40 |
40 |
80 |
80 |
|
Ray Accelerators |
32 |
32 |
40 |
40 |
80 |
80 |
|
Stream Processors |
2048 |
2048 |
2560 |
2560 |
5120 |
5120 |
|
Game GPU Clock |
2359 MHz |
2410 MHz |
2424 MHz |
2495 MHz |
2015 MHz |
2100 MHz |
|
Boost GPU Clock |
Up to 2589 MHz |
Up to 2635 MHz |
Up to 2581 MHz |
Up to 2600 MHz |
Up to 2250 MHz |
Up to 2310 MHz |
|
Peak Single Precision Performance |
Up to 10.6 TFLOPs |
Up to 10.79 TFLOPS |
Up to 13.21 TFLOPs |
Up to 13.31 TFLOPS |
Up to 23.04 TFLOPs |
Up to 23.65 TFLOPS |
|
Peak Half Precision Performance |
21.21 TFLOPs |
Up to 21.59 TFLOPS |
Up to 26.43 TFLOPs |
Up to 26.62 TFLOPS |
Up to 46.08 TFLOPs |
Up to 47.31 TFLOPS |
|
Peak Texture Fill-Rate |
Up to 331.4 GT/s |
Up to 337.3 GT/s |
Up to 413.00 GT/s |
Up to 416.0 GT/s |
Up to 720.00 GT/s |
Up to 739.2 GT/s |
|
ROPs |
64 |
64 |
64 |
64 |
128 |
128 |
|
Peak Pixel Fill-Rate |
Up to 165.7 GP/s |
Up to 168.6 GP/s |
Up to 165.20 GP/s |
Up to 166.4 GP/s |
Up to 288.00 GP/s |
Up to 295.7 GP/s |
|
AMD Infinity Cache |
32 MB |
32 MB |
96 MB |
96 MB |
128. MB |
128. MB |
|
Memory |
8GB GDDR6 |
8GB GDDR6 |
12GB GDDR6 |
12GB GDDR6 |
16GB GDDR6 |
16GB GDDR6 |
|
Memory Interface |
128-bit |
128-bit |
192-bit |
192-bit |
256-bit |
256-bit |
|
PCIe Interface |
PCIe 4.0 x8 |
PCIe 4.0 x8 |
PCIe 4.0 x16 |
PCIe 4.0 x16 |
PCIe 4.0 x16 |
PCIe 4.0 x16 |
|
Board Power |
160W |
180W |
230W |
250W |
300W |
335W |
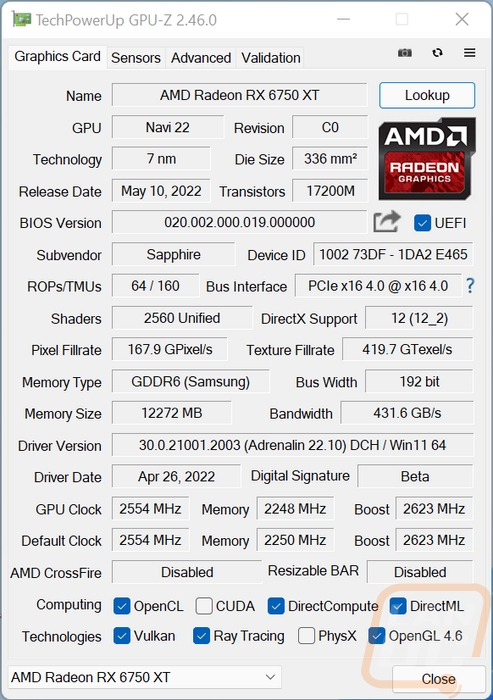
Before getting into testing I did also run GPUz to double-check that our clock speeds match up with the specifications. The Sapphire Nitro+ RX 6750 XT comes in clocked at 2554 MHz with a boost clock of up to 2623 MHz which matches Sapphires specifications. For comparison, the stock clock for the RX 6750 XT is 2495 MHz so the Nitro+ has an overclock of 59 MHz and the stock boost clock goes up to 2600 MHz so it has an overclock of 23 MHz which isn’t too much of an overclock. GPUz also documents the driver that I tested with which was the 22.10 press beta driver and the BIOS revision in case we need to know that in the future.
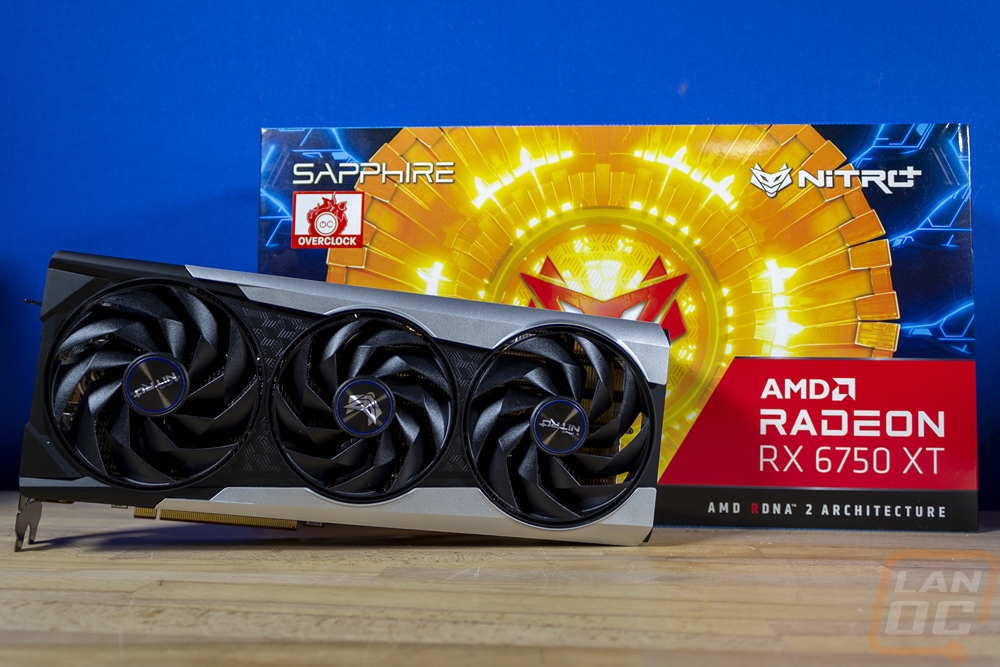
Packaging
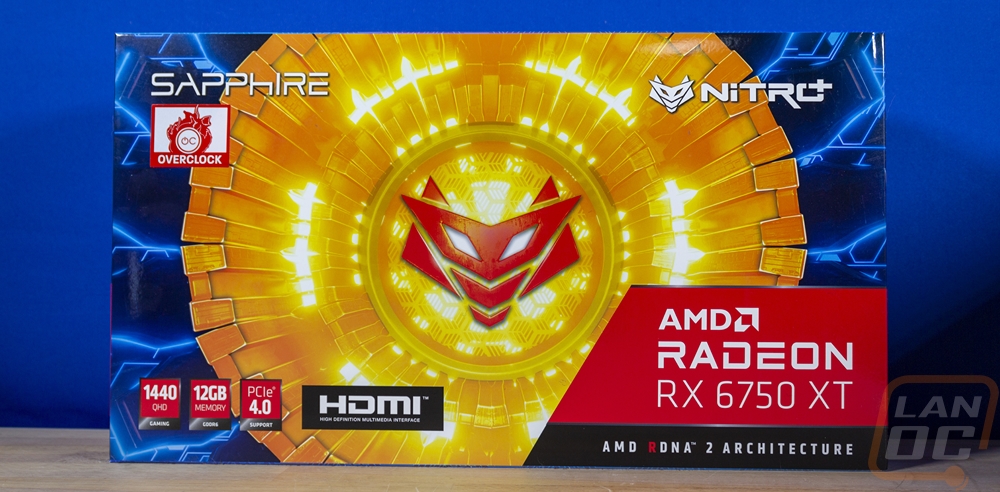
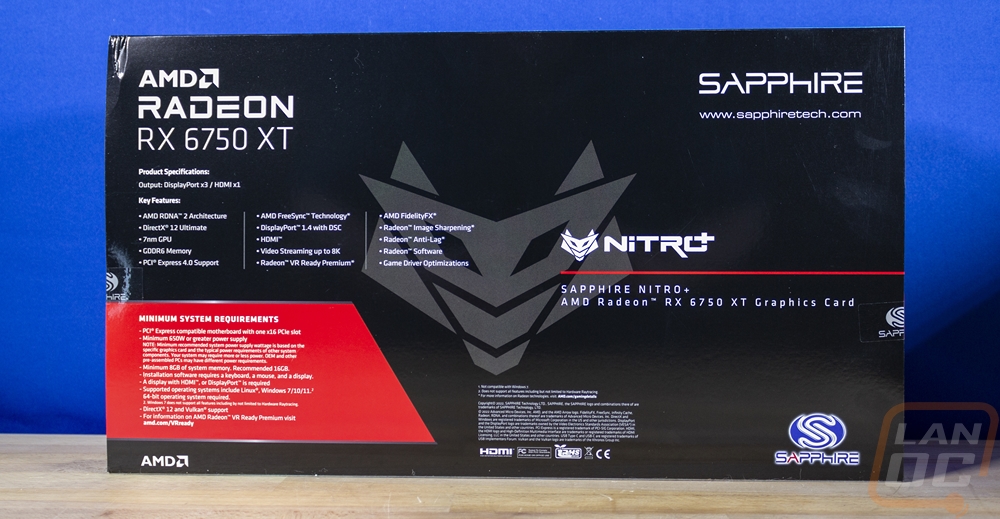
The box for the Sapphire Nitro+ RX 6750 XT is changed up from the design of the Sapphire Nitro+ RX 6700 XT in fact it is an interesting combination of the Nitro+ 6700 XT and the Nitro+ 6800 XT. The 6700 XT Nitro+ has the orange and yellow design on the front but the 6800 XT has the black and black design. The Sapphire Nitro+ RX 6750 XT has the orange and black in the center and then the blue and black on the outside. In the center is a large version of the Nitro logo then Sapphire’s logo is in the top left and the full Nitro+ logo is in the top right. The AMD red wrap starts in the bottom right and has the actual model of the GPU and also from AMD in the left corner they show that this is a 1440p focused card with 12GB of VRAM and supports PCIe 4.0. Around back the red wrap wraps around and has the minimum specifications from AMD. Beyond that above that there are key features listed but nothing specific to the Nitro+ itself. Sadly there aren’t any pictures of what the card looks like, card dimensions, or the clock speeds so shopping in retail may be a little more difficult. Online shopping of course shows you all of that information at least.
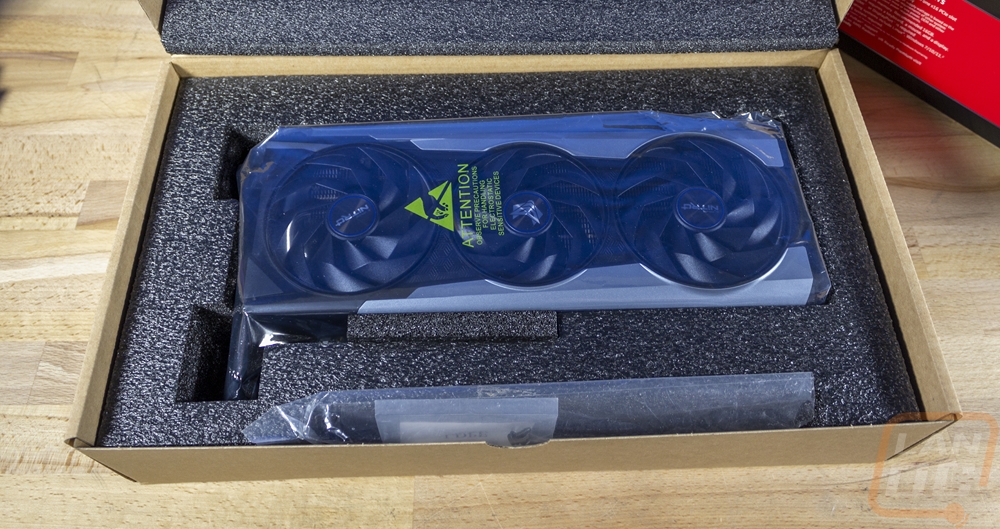
Sapphire has a second box inside of the main packaging. This is a standard cardboard box and inside when you open it up there is a layer of foam you need to pull off to get to everything inside. The Sapphire Nitro+ RX 6750 XT comes wrapped in its static protective bag and sitting in the thick foam tray that is cut to fit the card.
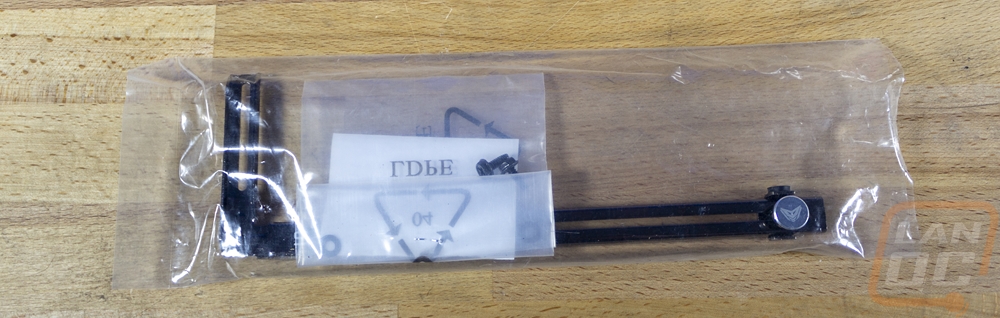
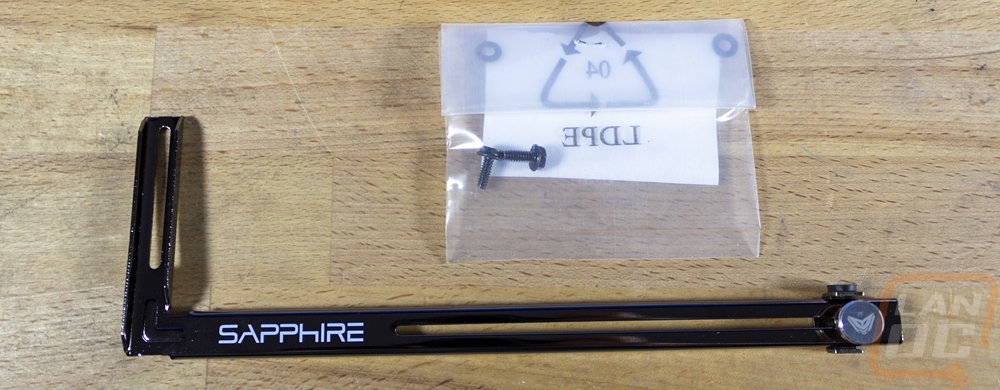
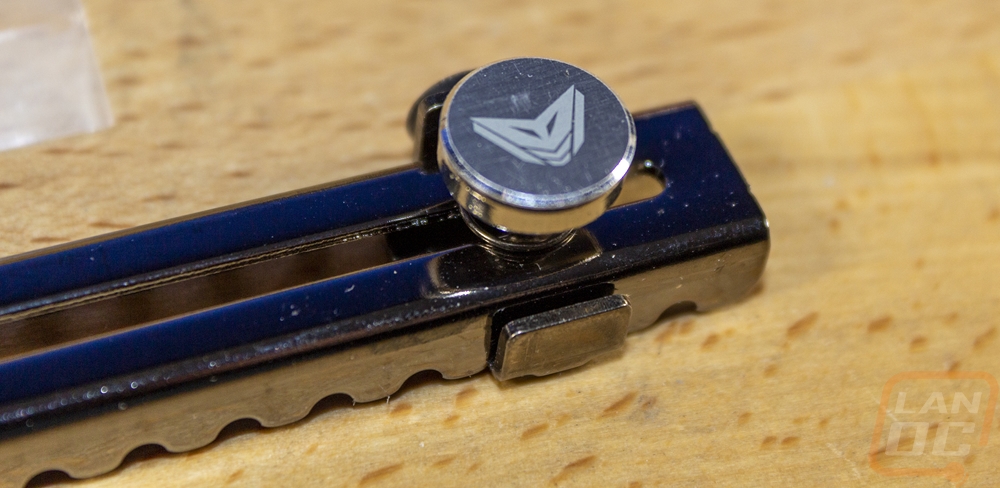
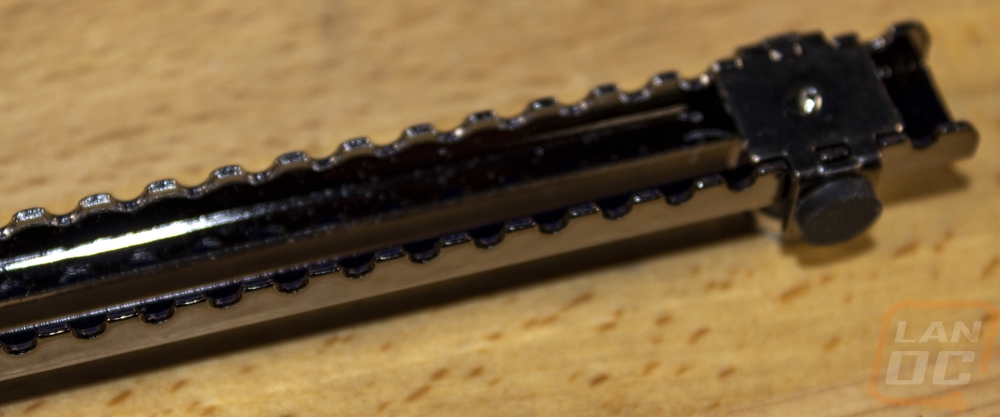
The Sapphire Nitro+ RX 6750 XT is a large card and Sapphire has included along with it an anti-sag support as well. This screws in on the PCI bracket mounts and runs along the bottom of the card. It has the Sapphire logo printed in white and a tinted chrome finish. It also has the Nitro+ logo on the silver screw which is the mounting pad. This is adjustable up and down most of the support and has a small rubber pad on top where it will touch your video card.
For documentation the Sapphire Nitro+ RX 6750 XT just comes with a generic quick installation guide and a small paper with Sapphire's address.
Card Layout and Photos
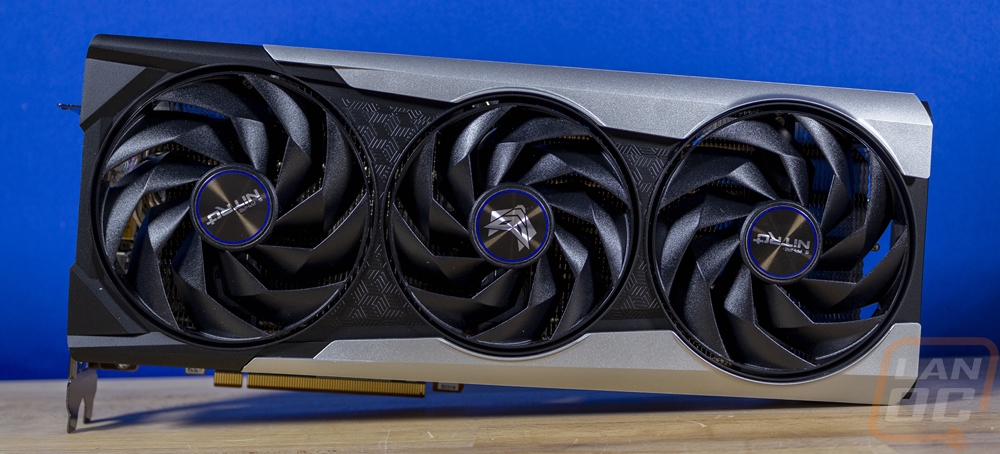
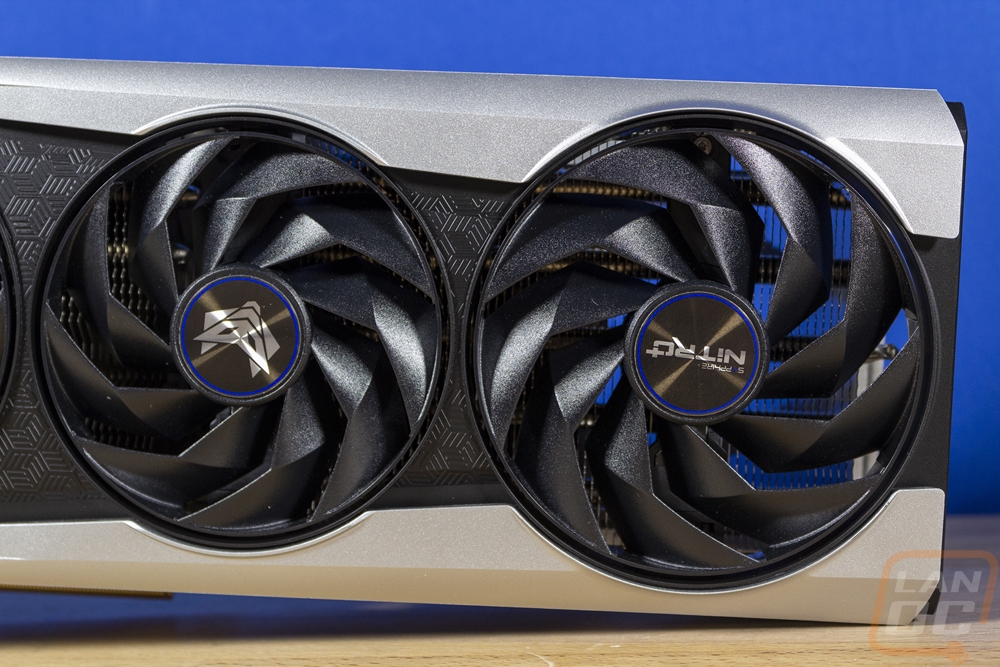
The Nitro+ RX 6750 XT shares a lot of its staying with the Nitro+ RX 6700 XT but it isn’t exactly the same. It has the same combination of black down the center which gets smaller as you go right and silver accents, but the angle of the change is different. This is once again a three fan card with the center fan being smaller. The shroud has a cool 3d box shape repeating over most of the black area in between the fans and overall the Nitro+ design is simpler and less “gamer” than some other card designs.
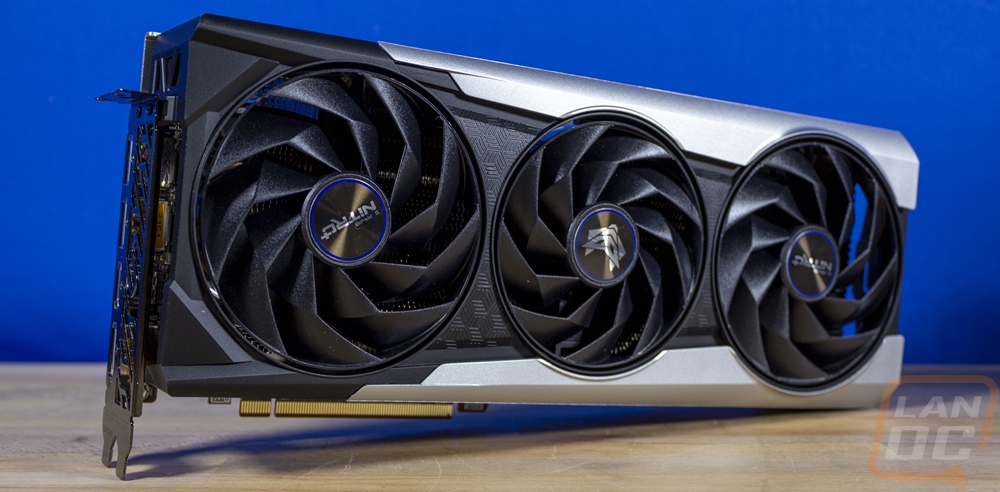
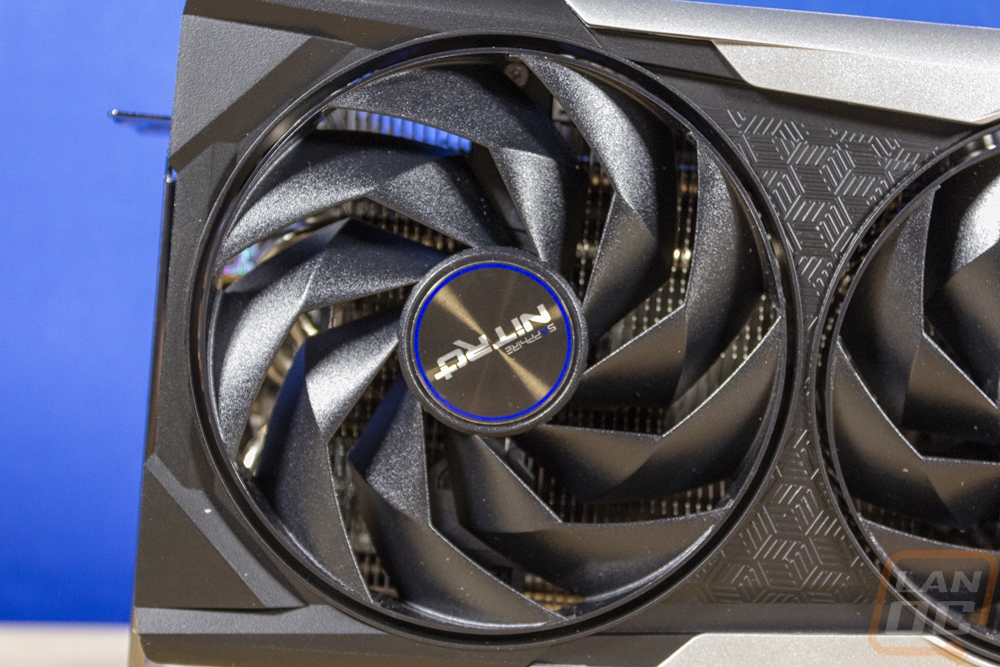
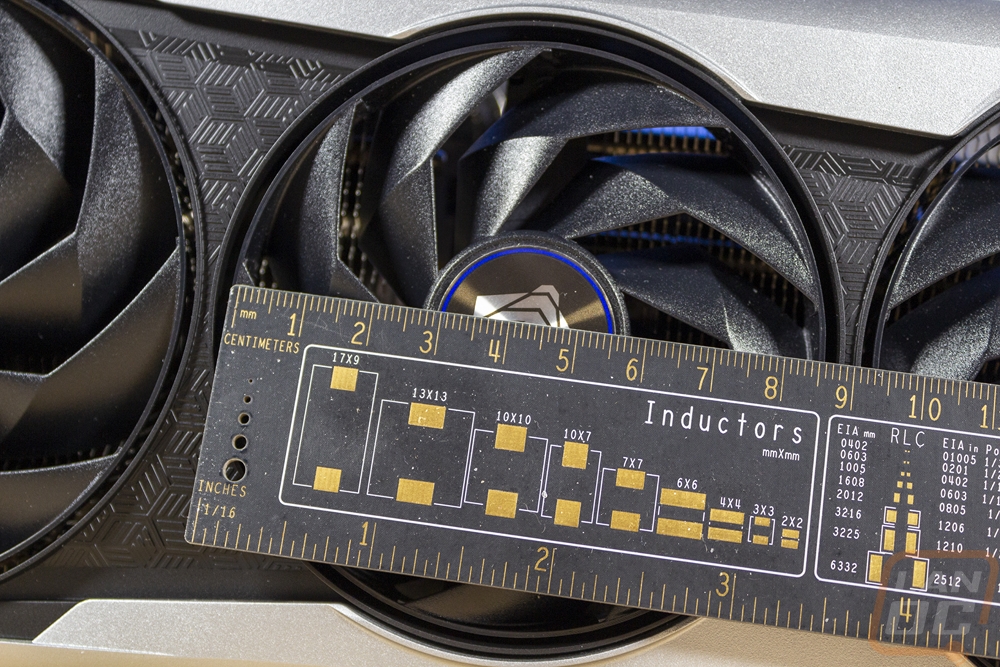
The triple fan layout has completely new fans which Sapphire calls their angular velocity hybrid fans. Most GPU fans have a spiral shape to the fan blades to give them a more aggressive angle on the inside of the fan while on the outside being a little less aggressive for noise. This takes that idea to another level for more air pressure and to a lesser extent more air volume as well. Sapphire's documentation shows that this design has 144% more air pressure at a 30 dB level and 119% more airflow. The new fans have the Nitro+ logo in the center with a blue ring but are otherwise black to match the fan shroud. The larger outside fans are 95mm wide and the inner fan is 85mm wide. The two outer fans spin counterclockwise and the inner fan spins clockwise. These are also quick connect fans that can be removed with one screw, something Sapphire started back in the 400 series of cards and frankly I had no idea that they still did but I’m glad they do because it can make home fan replacement easy and with that prevent people from having to send out a whole card for a dead fan RMA which saves you shipping and time and Sapphire money as well. Everyone wins.
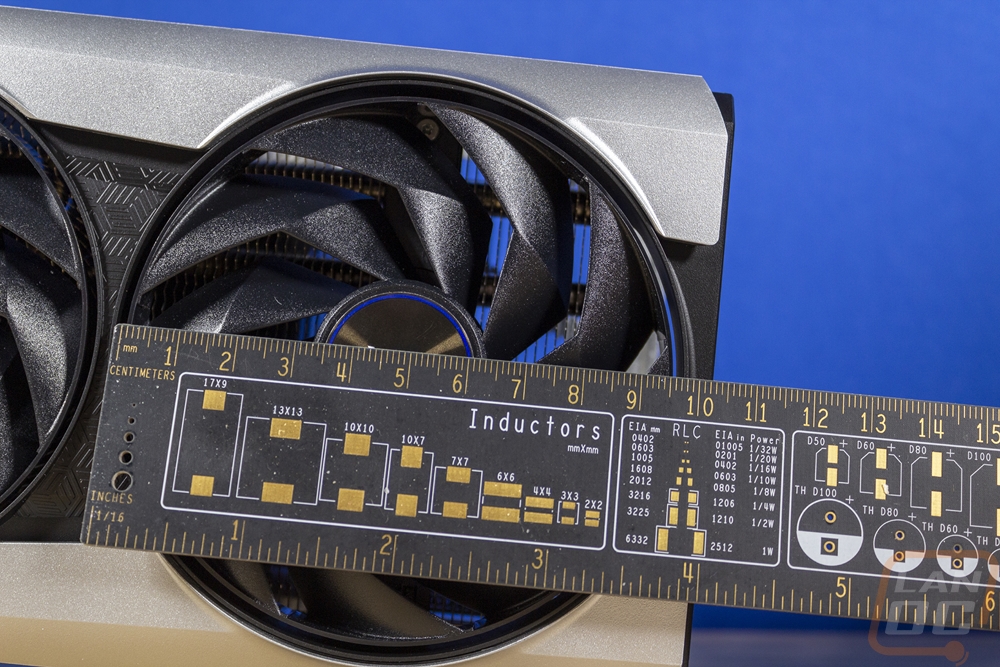
The Nitro+ RX 6750 XT has the same 310mm length as its Nitro+ RX 6700 XT brother and it even has the same 130mm height which is still very tall. But it is thicker with a full 18mm of fan shroud from the top of the PCI bracket. While the bracket is only a 2 slot bracket, this is a full 3 slot card and even more if you want to leave a little room for the fans to get air.
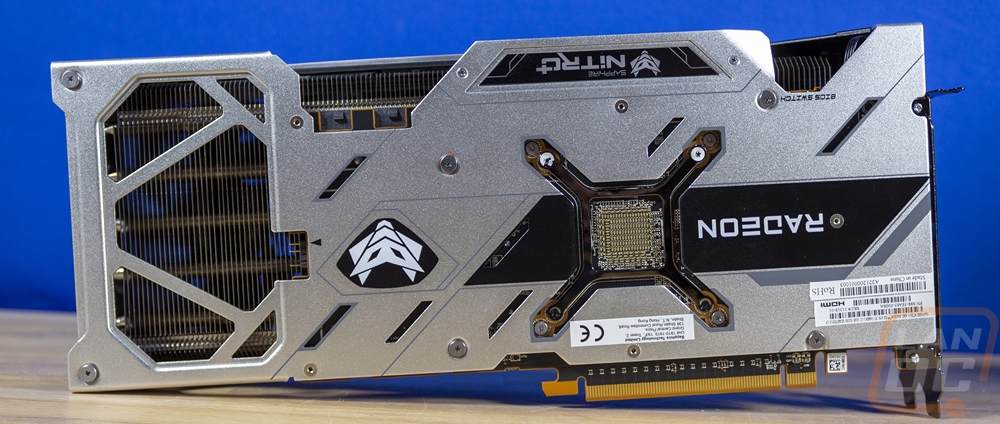
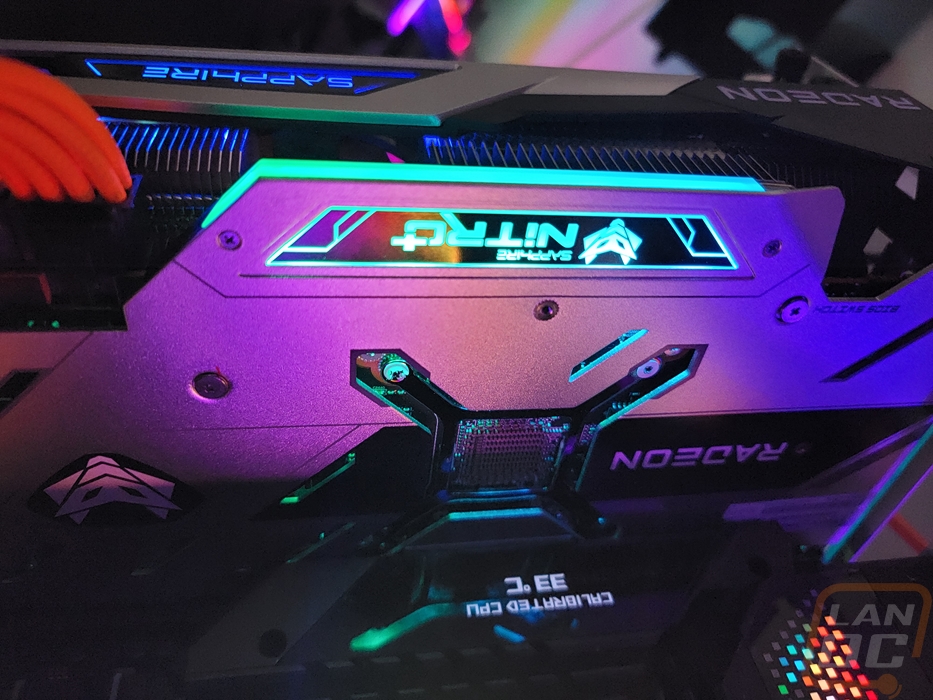
The Nitro+ RX 6750 XT has a full metal backplate that runs the length of the card. It has a silver finish to go with the rest of the card along with a black stripe and a few small grey accents as well. In the black stripe it has the Radeon branding and to the side of that the Nitro+ logo as well which both are upside down so they are visible when installed in a case. Up near the top, they have the Sapphire and Nitro+ branding as well. The backplate uses small slits cut out for accents and then along the top they have large openings cut out for the power plug and the BIOS switch. Then the entire end of the card is open for blow-through ventilation past the end of the PCB. Also in this end, Sapphire has included an addressable RGB header where you can hook up addressable RGB lighting to be controlled using the Sapphire software. This is a nice addition for anyone who doesn’t have addressable RGB control on their motherboard or is already out of headers.
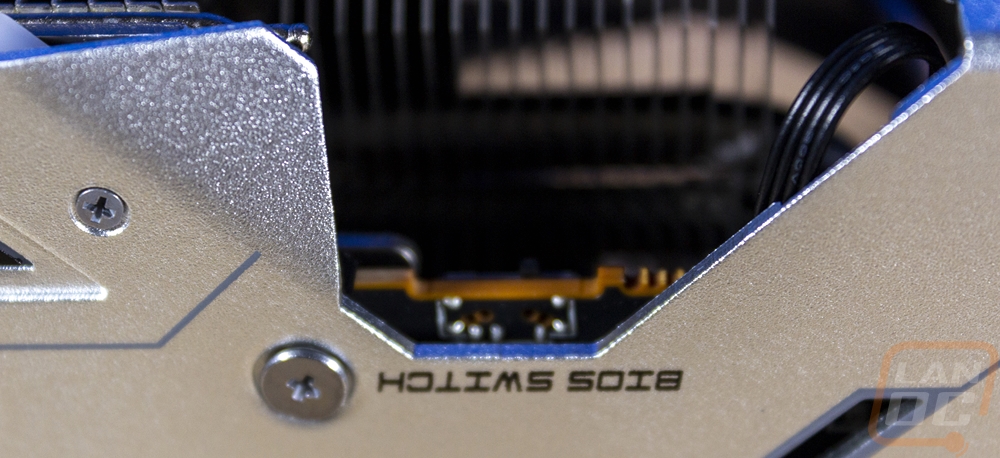
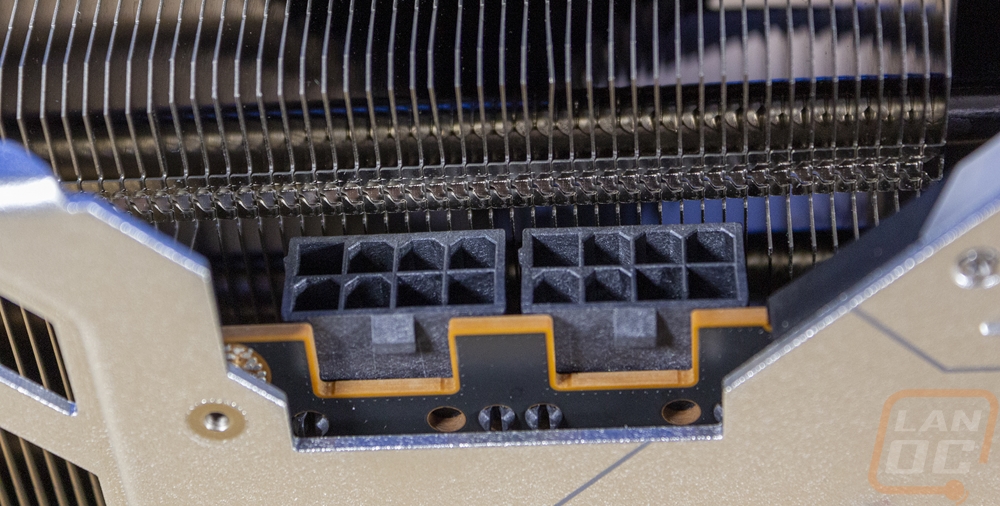
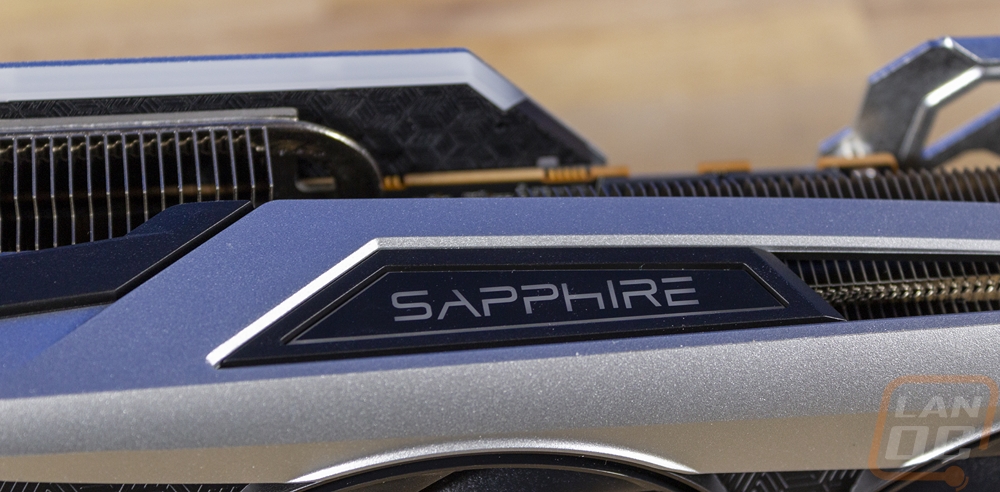
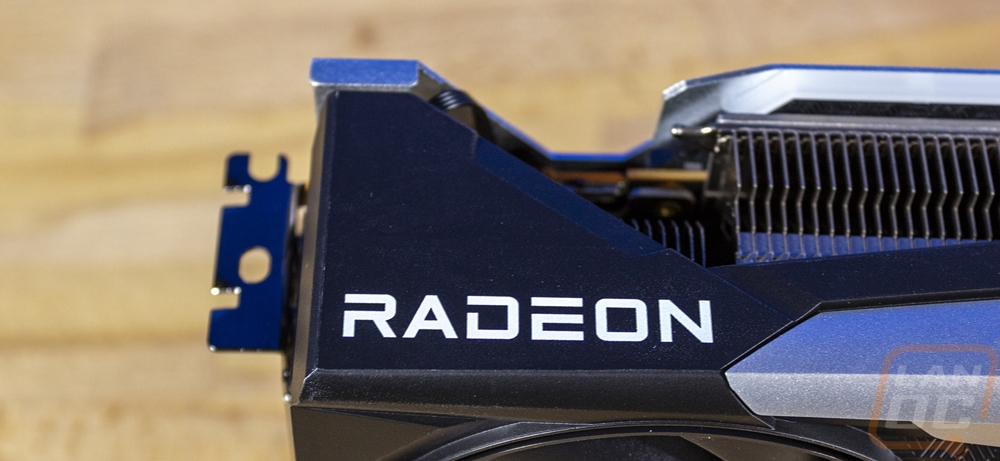
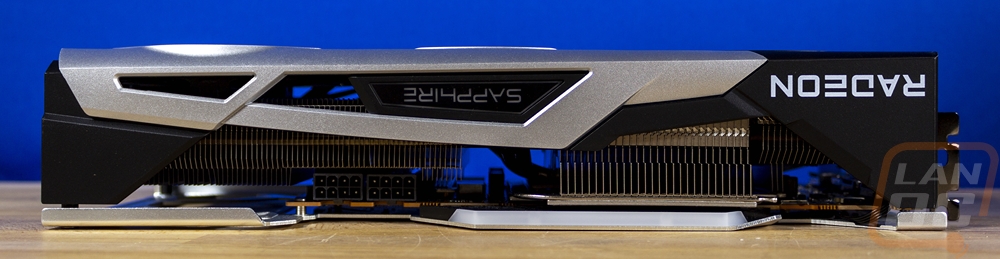
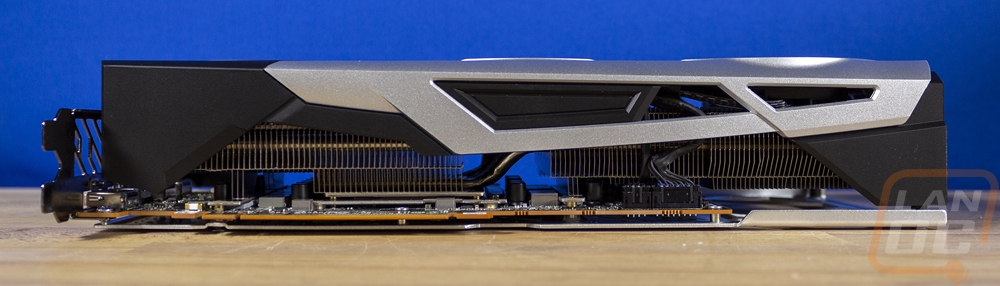
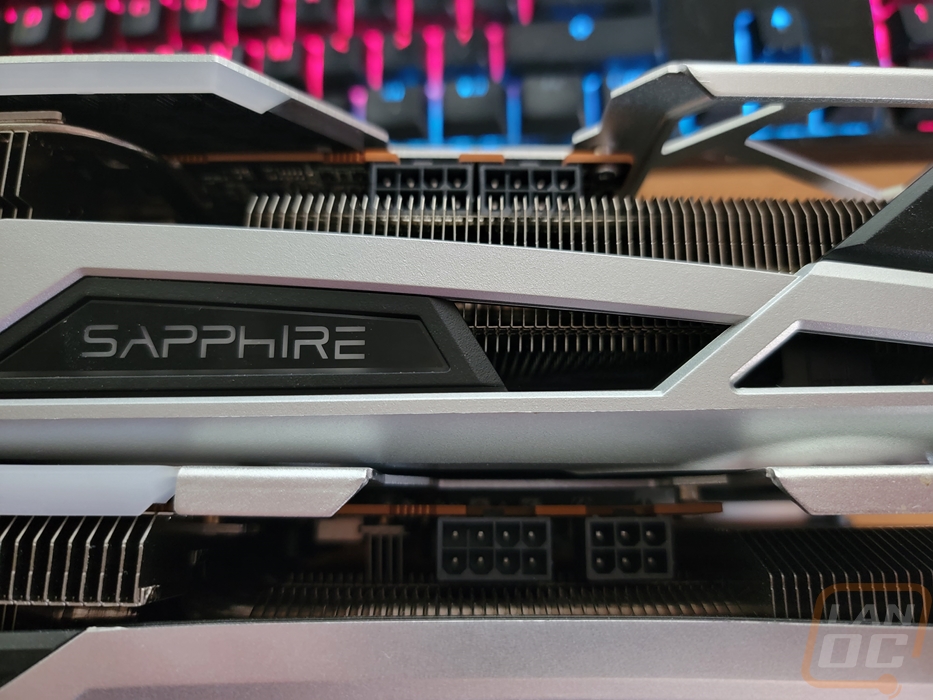
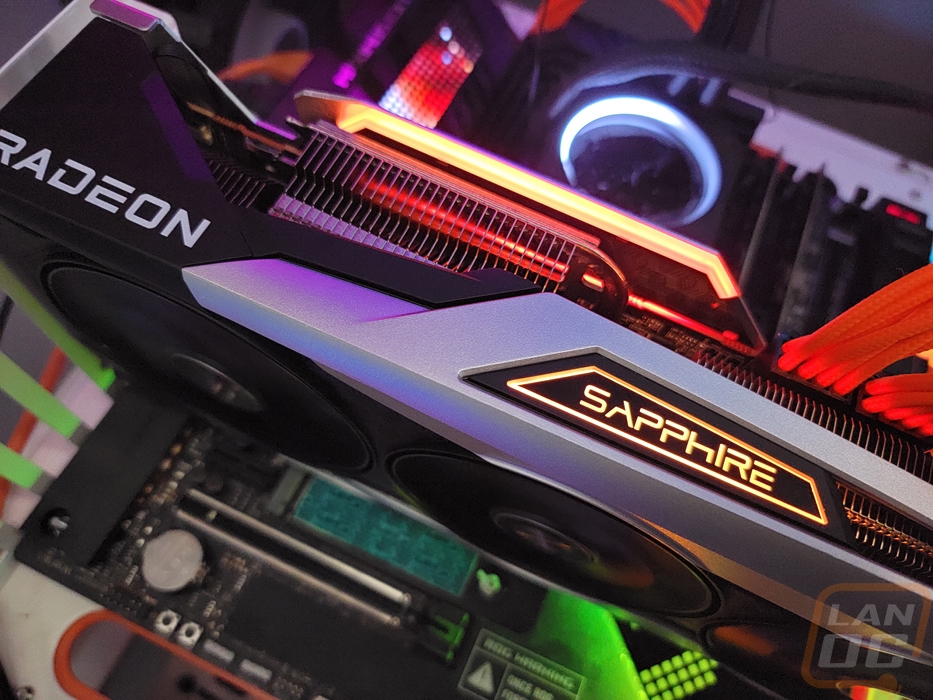
Along the top edge of the Nitro+ RX 6750 XT, the backplate opens up for access to the power connections and the BIOS switch. For the power connections, the Nitro+ RX 6750 XT has two 8-pin connections whereas the Nitro+ RX 6700 XT had an 8-pin and a 6-pin. The BIOS switch lets you switch between the standard BIOS and a secondary BIOS has a silent focus with a 200-watt TGP (vs 230 Watt) and its clock speeds are the stock AMD specs for the 6750 XT at 2600 MHz for the Boost clock and 2495 MHz for game clock. Also up on the top edge, Sapphire has their logo which is backlit in RGB, and the Radeon logo which is just printed on in white. If you look closely you can also see a small diffuser bar behind the logo that lights up the edge of the backplate as well.
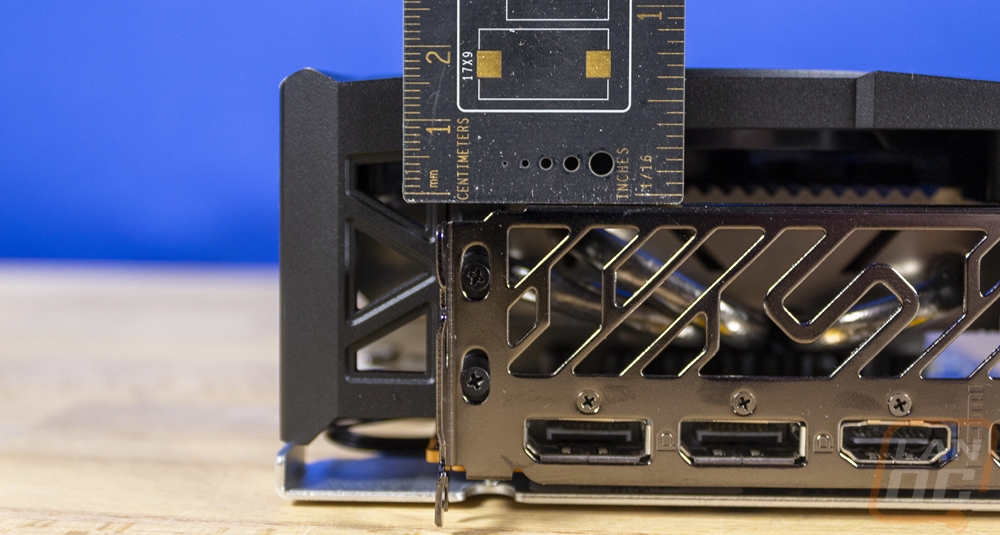
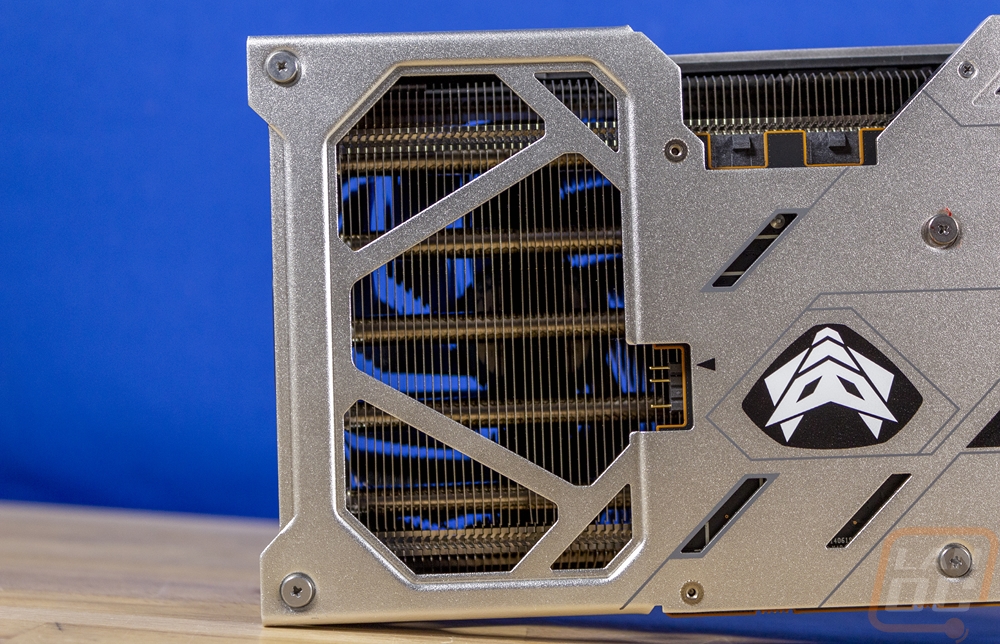
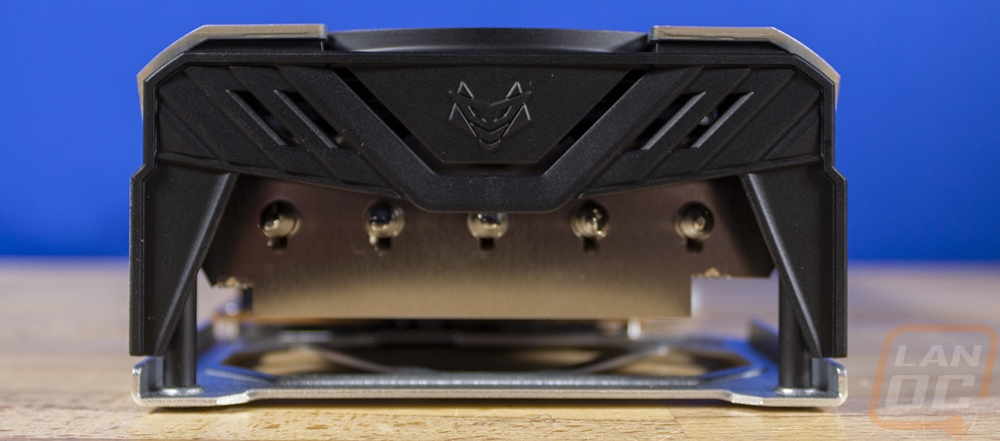
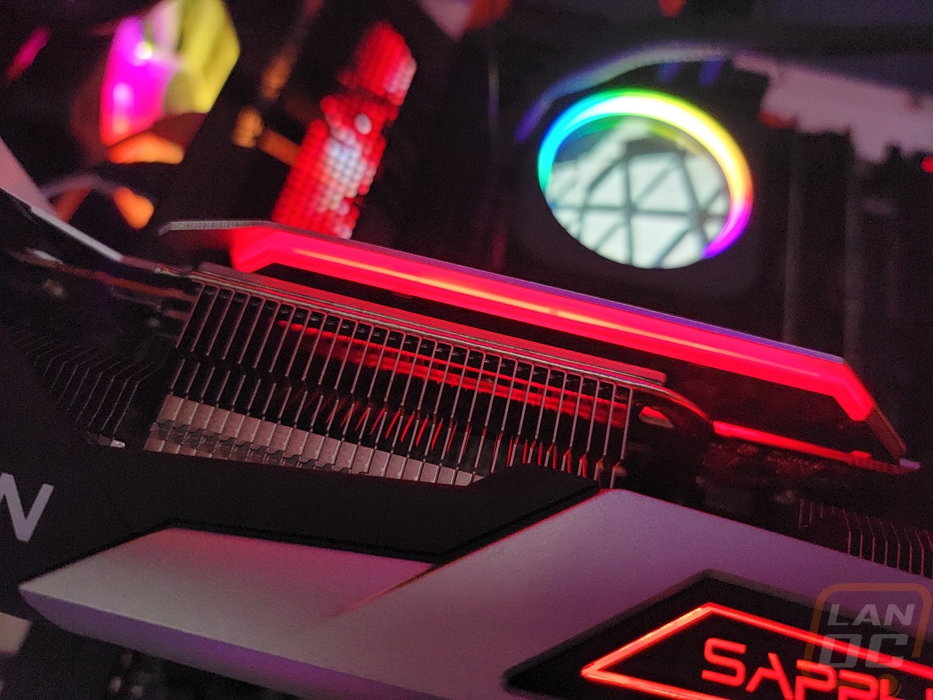
Looking around the edges of the Nitro+ RX 6750 XT we can see that the heatsink has a vertical layout that will blow the air out the top and bottom of the card. The heatsink is tight up against the PCB but I was surprised that once it gets past the PCB that they didn’t take advantage of that extra space as well. The end of the card gives us a peek at the 5 large heatpipes and Sapphire has also snuck in the Nitro+ logo on this end of the fan shroud. Then on the bottom, we can see where the heatpipes transition down up against the GPU and the thermal plate around the GPU for the memory.
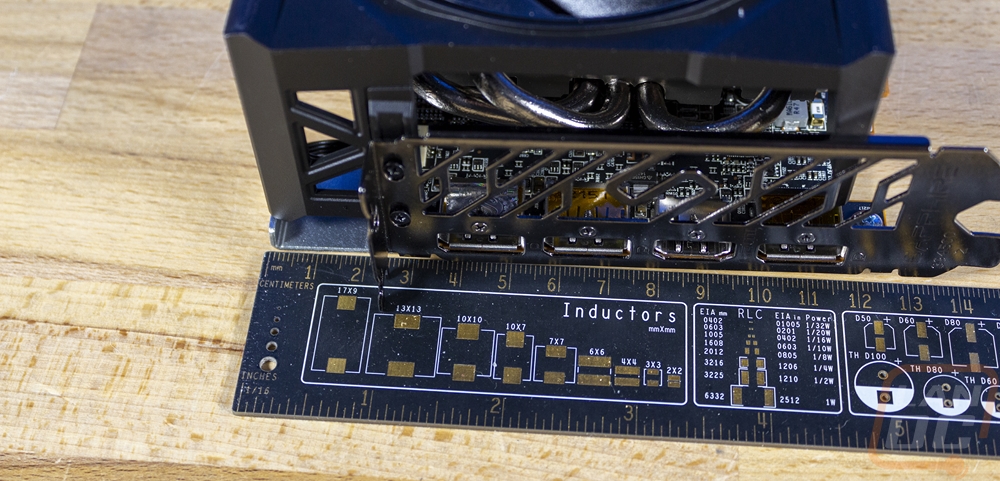
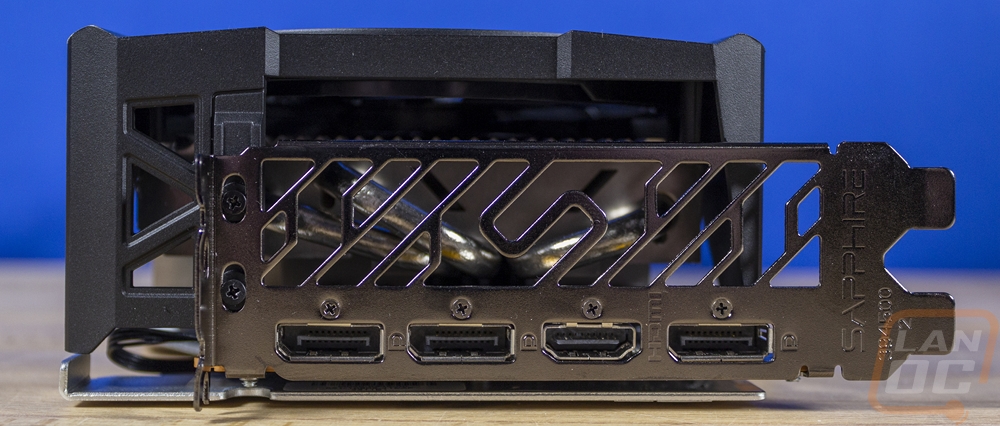
For the PCI bracket, the Nitro+ RX 6750 XT has a chromed finish and the ventilation holes that take up most of the bracket have the Sapphire S in the middle as well as the Sapphire logo down at the bottom edge. For connection options, it has the standard 3 DisplayPort and 1 HDMI layout with the HDMI labeled and the second from the bottom.
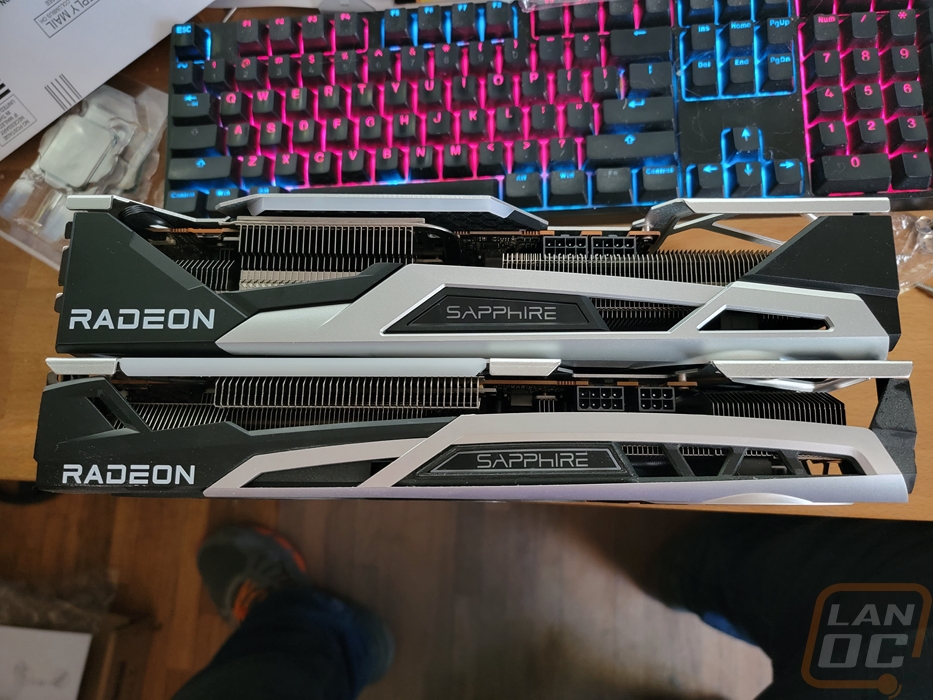
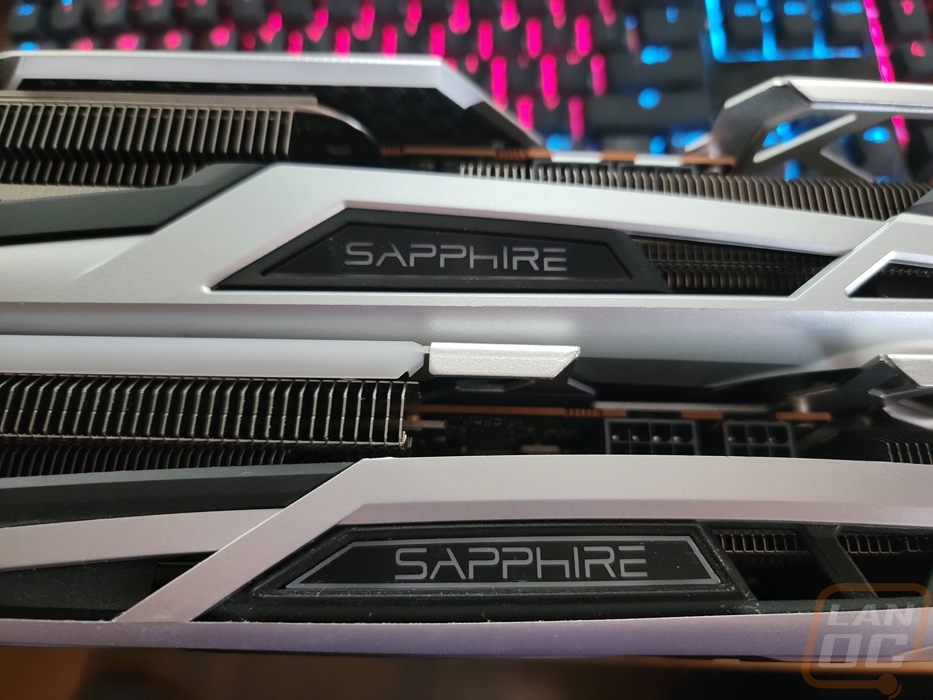
Having reviewed the Nitro+ RX 6700 XT previously I didn’t initially think that the Nitro+ RX 6750 XT was much different. But once you get them next to each other the size difference is apparent and you can spot a few smaller differences as well. For example, the Sapphire logo on the Nitro+ RX 6750 XT doesn’t have the line around it and the backplate diffuser on the Nitro+ RX 6700 XT was longer as was the PCB. The Nitro+ RX 6750 XT has the dual 8-pin power connections which I mentioned earlier but the biggest difference is in the thickness of the card which is the difference between a 2.2 slot and a full 3 slot card.
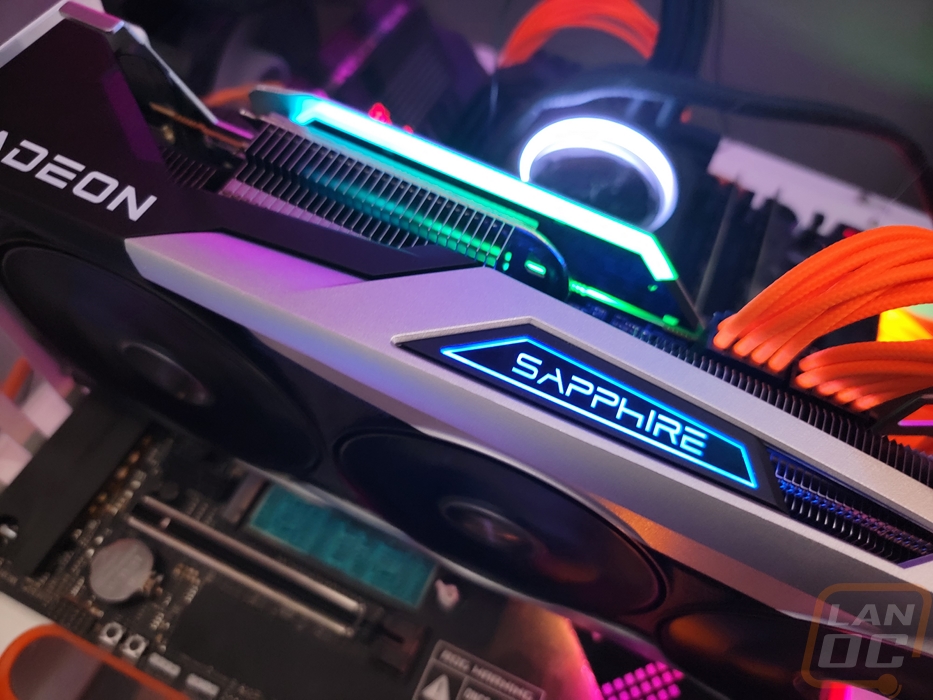
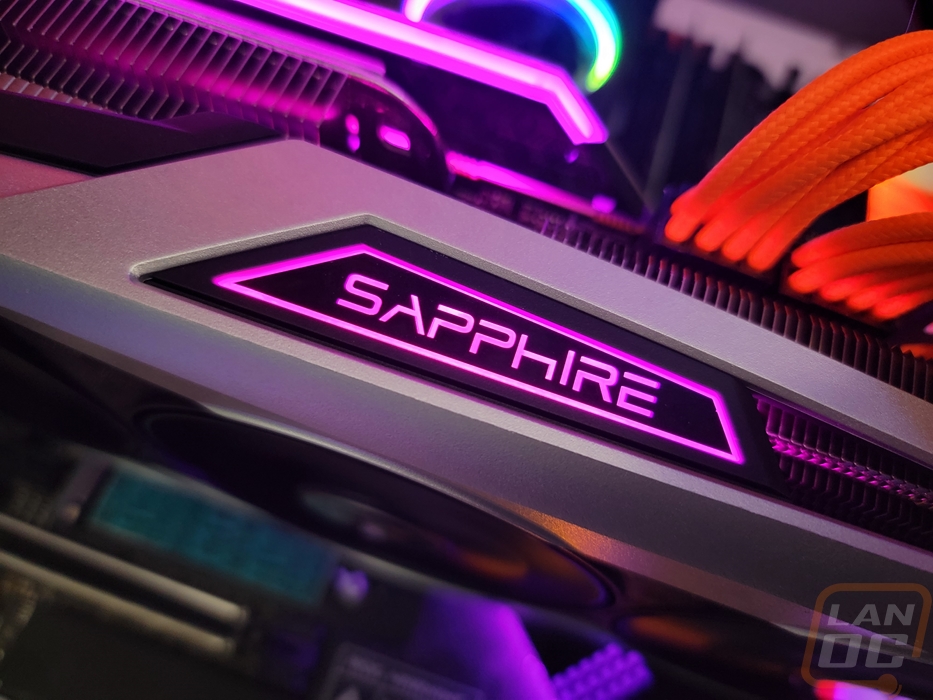
The RGB lighting on the Nitro+ RX 6750 XT is bright and lights up the Sapphire logo on the top edge as well as the Nitro+ logo on the backplate. They also have the diffuser in that same area that runs along the edge of the backplate. I like that on the backplate that the lighting does also come out some of the accent slots in the backplate for a nice effect though overall I wish there was more accent lighting and fewer backlit logos.
Test Rig and Procedures
Test System
CPU: Intel Core-i9 12900K – Live Pricing
Motherboard: Asus ROG Maximus Z690 Extreme – Live Pricing
Cooling: Corsair H100i Elite LCD Display - Live Pricing
Noctua NT-H1 Thermal Paste - Live Pricing
Memory: Micron Pre Launch DDR5 2x32GB – Live Pricing
Storage: Sabrent Rocket Q4 2TB – Live Pricing
Power Supply: Corsair AX1200 - Live Pricing
Case: Primochill Wetbench - Live Pricing
OS: Windows 11 Pro 64-bit - Live Pricing
|
Our Testing Procedures |
|
|
3DMark |
All 3DMark based tests are done using the most recent version. We test using all three versions of Fire Strike and both Time Spy and Time Spy Extreme. Tests to look at ray tracing performance is done with Port Royal when supported and for Nvidia cards that support DLSS, the DLSS subtest is also done at 1440p with the performance setting and DLSS 2.0. |
|
Unigine Superposition |
1080p Extreme and 4k Optimized benchmarks along with the VR Future test are done. The VR test is done at the Oculus resolution |
|
VRMark |
Only the Blue room test is run |
|
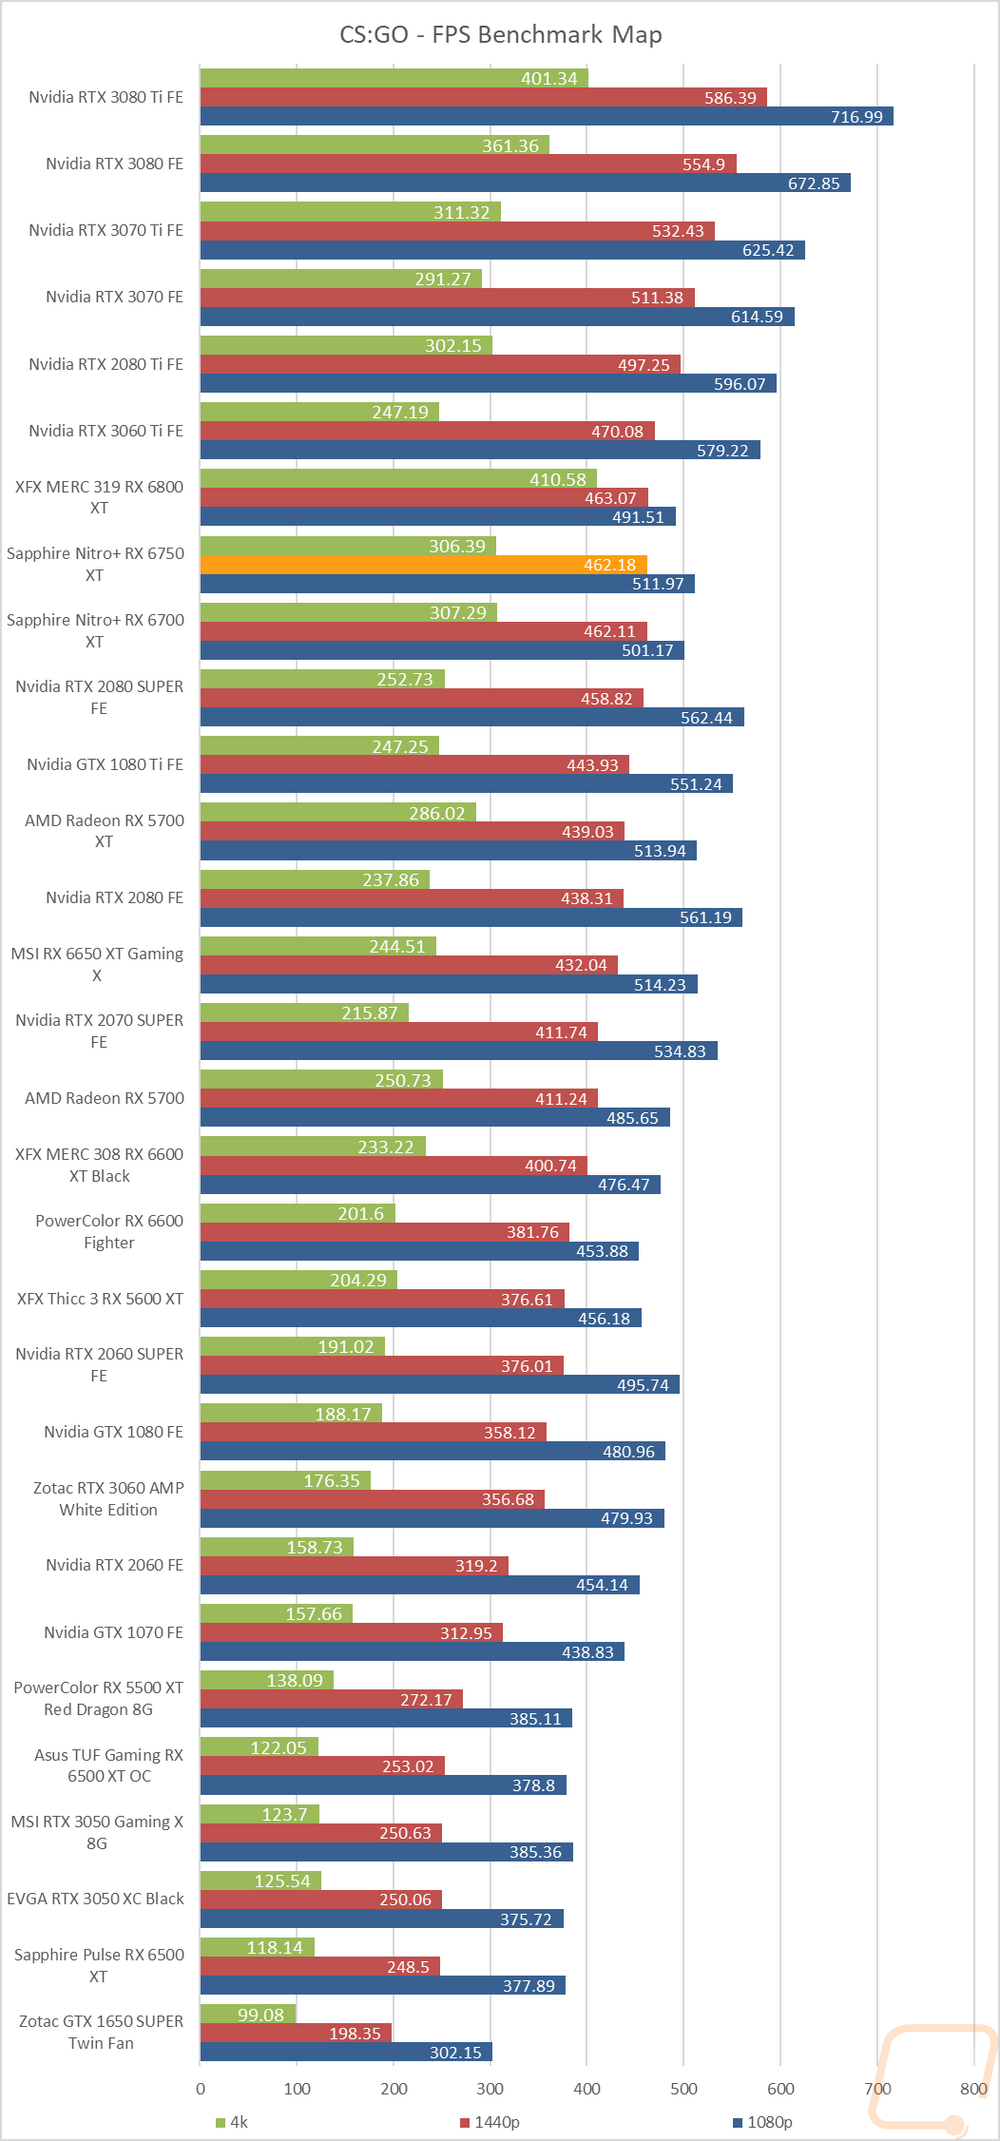
CS:GO |
This test is done using the workshop map called CS:GO Benchmark. You can find more information at this link. https://www.gamingpcbuilder.com/how-to-install-csgo-fps-benchmark-map/ I test at 1080p, 1440p, and 4K resolutions. All auto settings are turned off and detail is set to their highest settings. shadow quality high, model texture detail high, shader detail very high, AA set to 16x, uber shaders enabled |
|
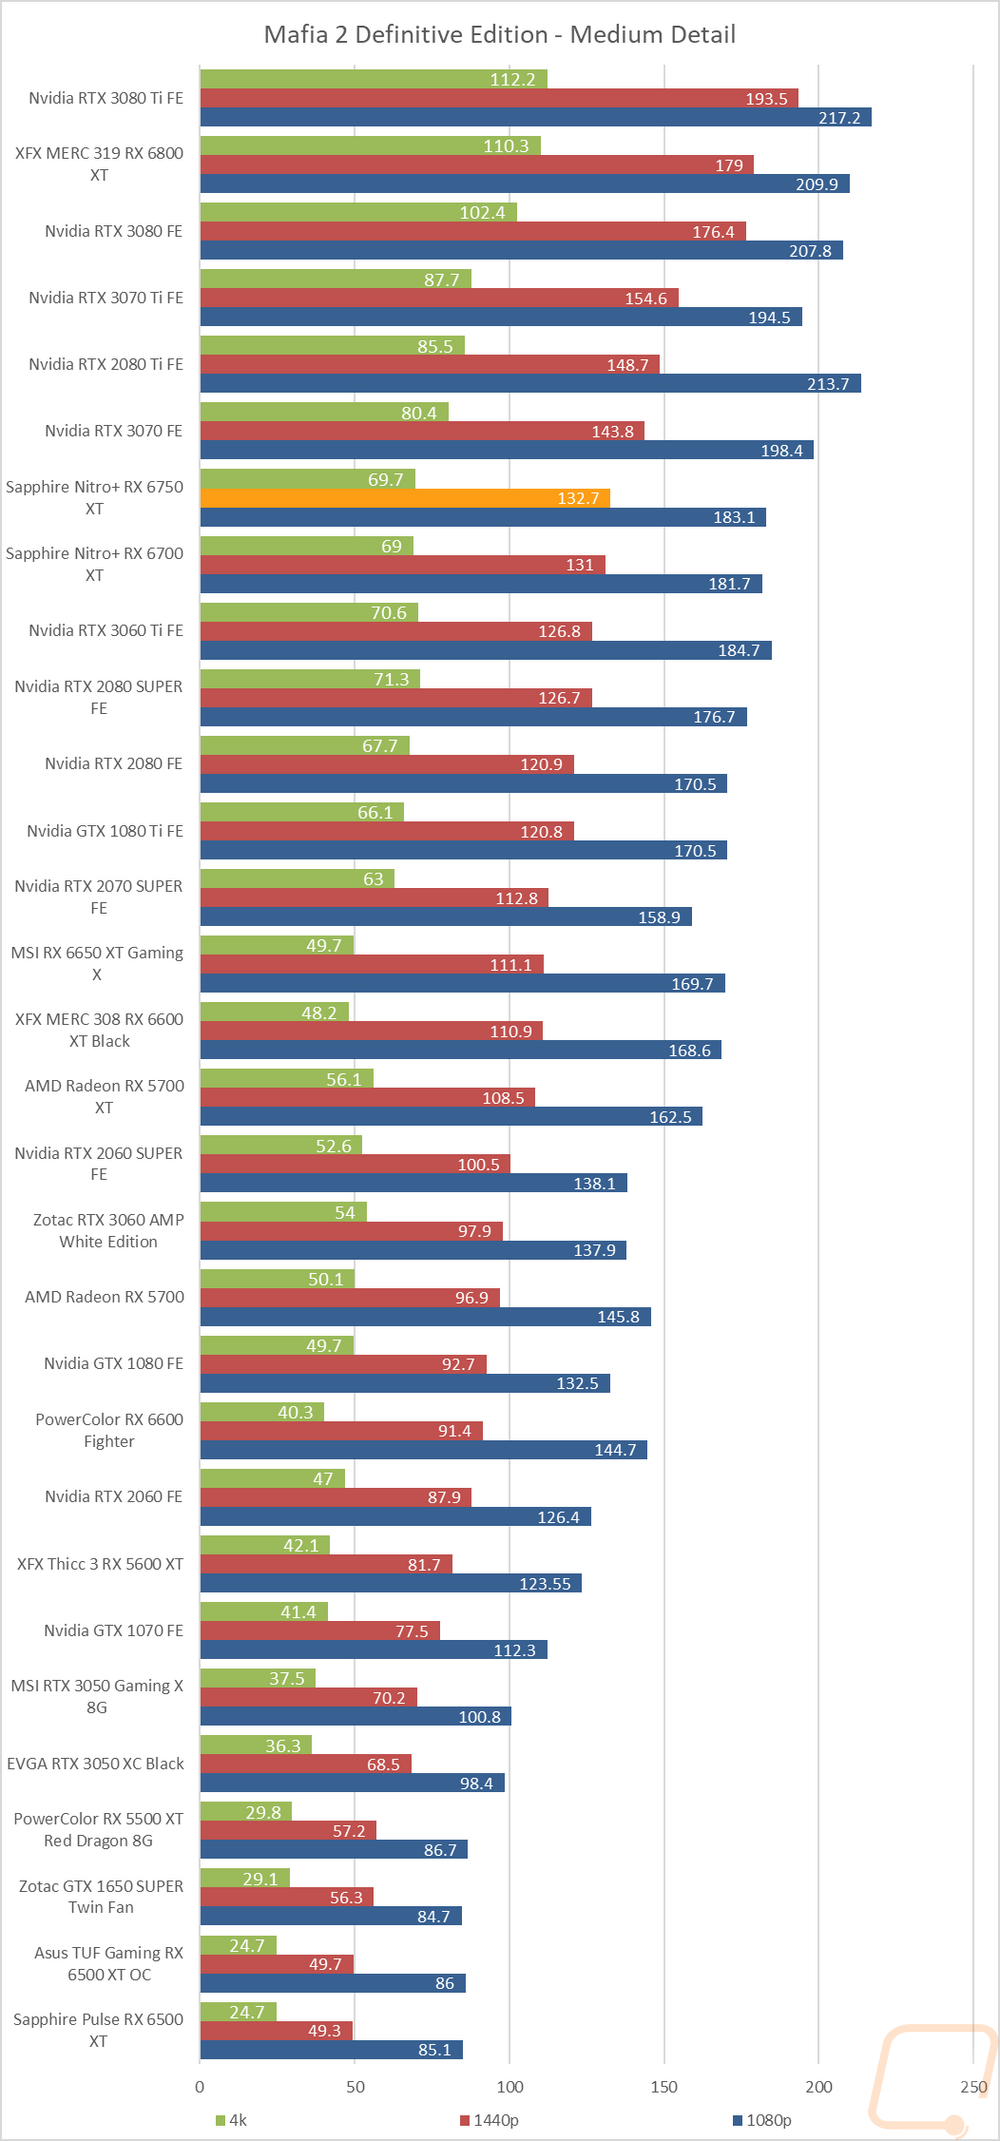
Mafia 2 Definitive Edition |
This uses the built-in benchmark to test at High and Medium detail presets at 1080p, 1440p, and 4K resolutions |
|
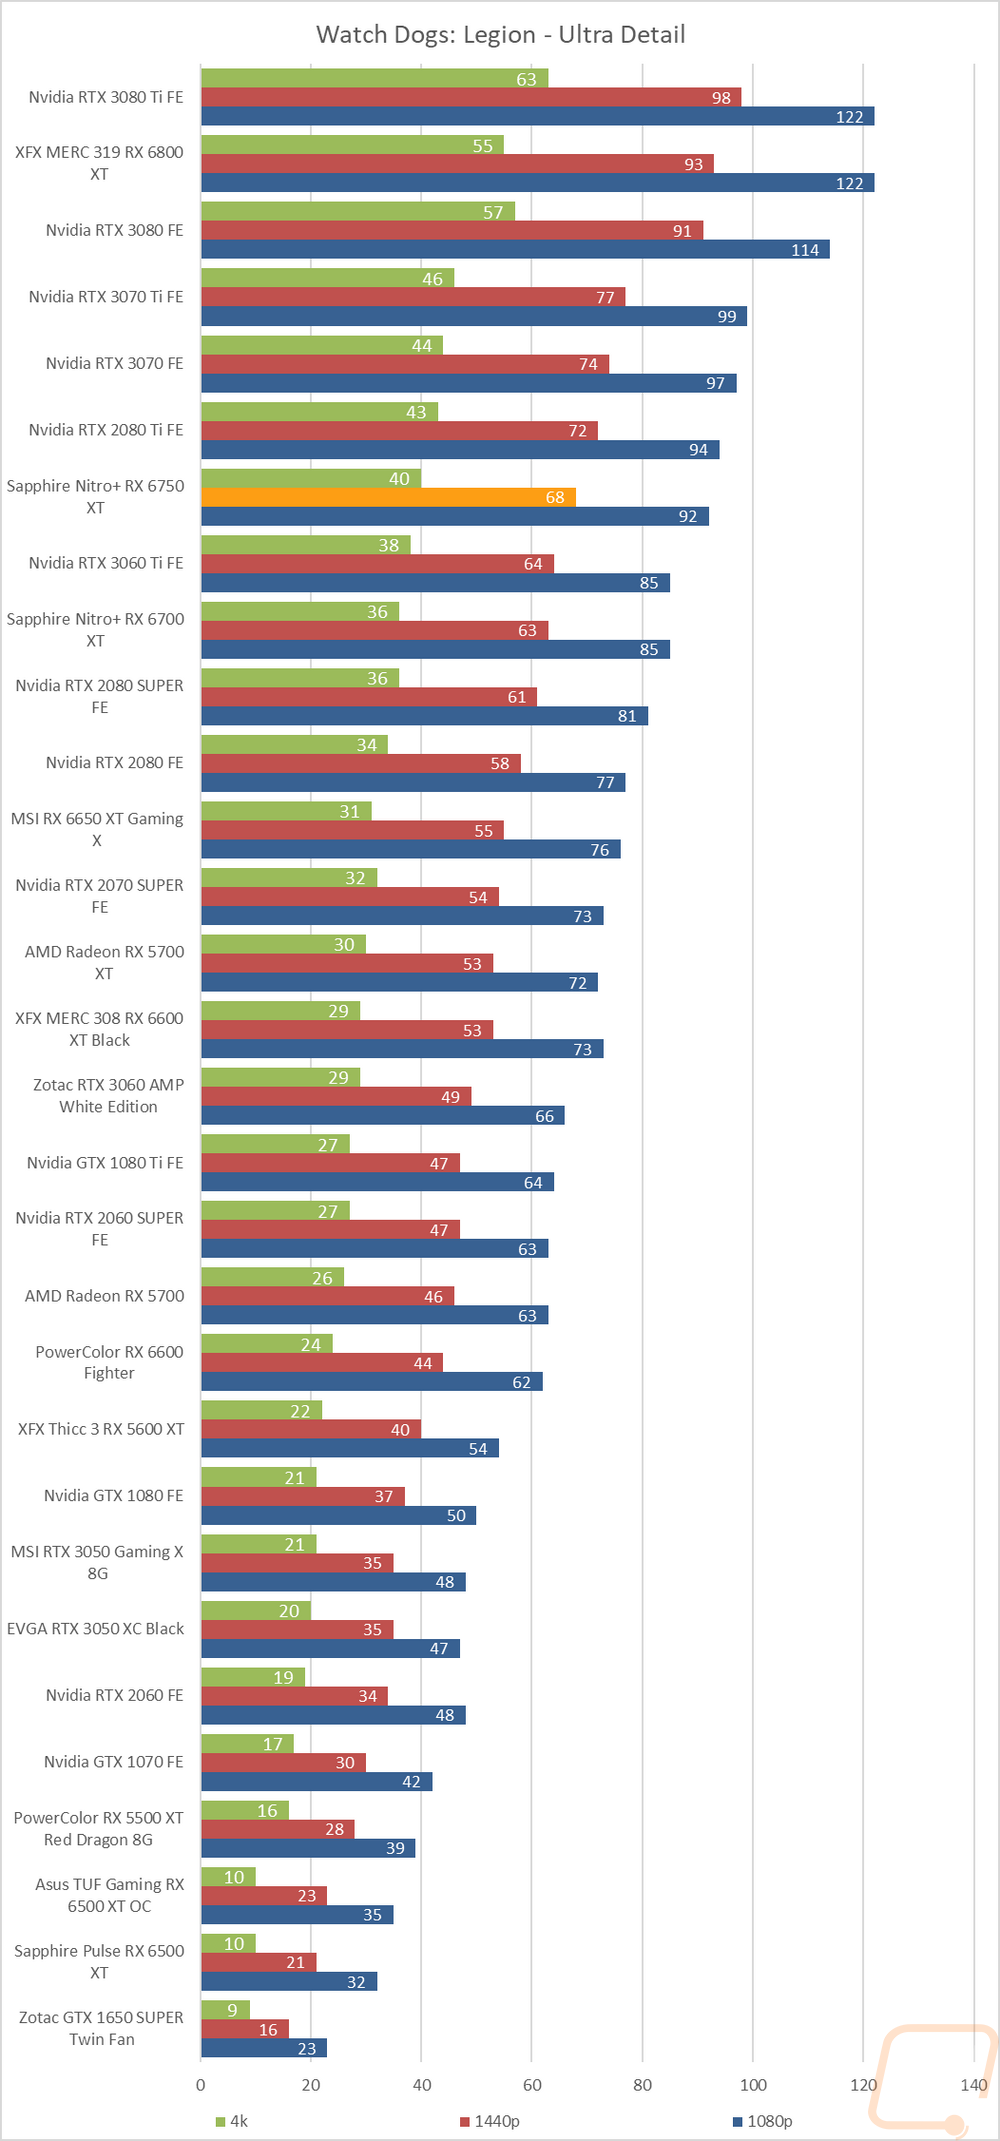
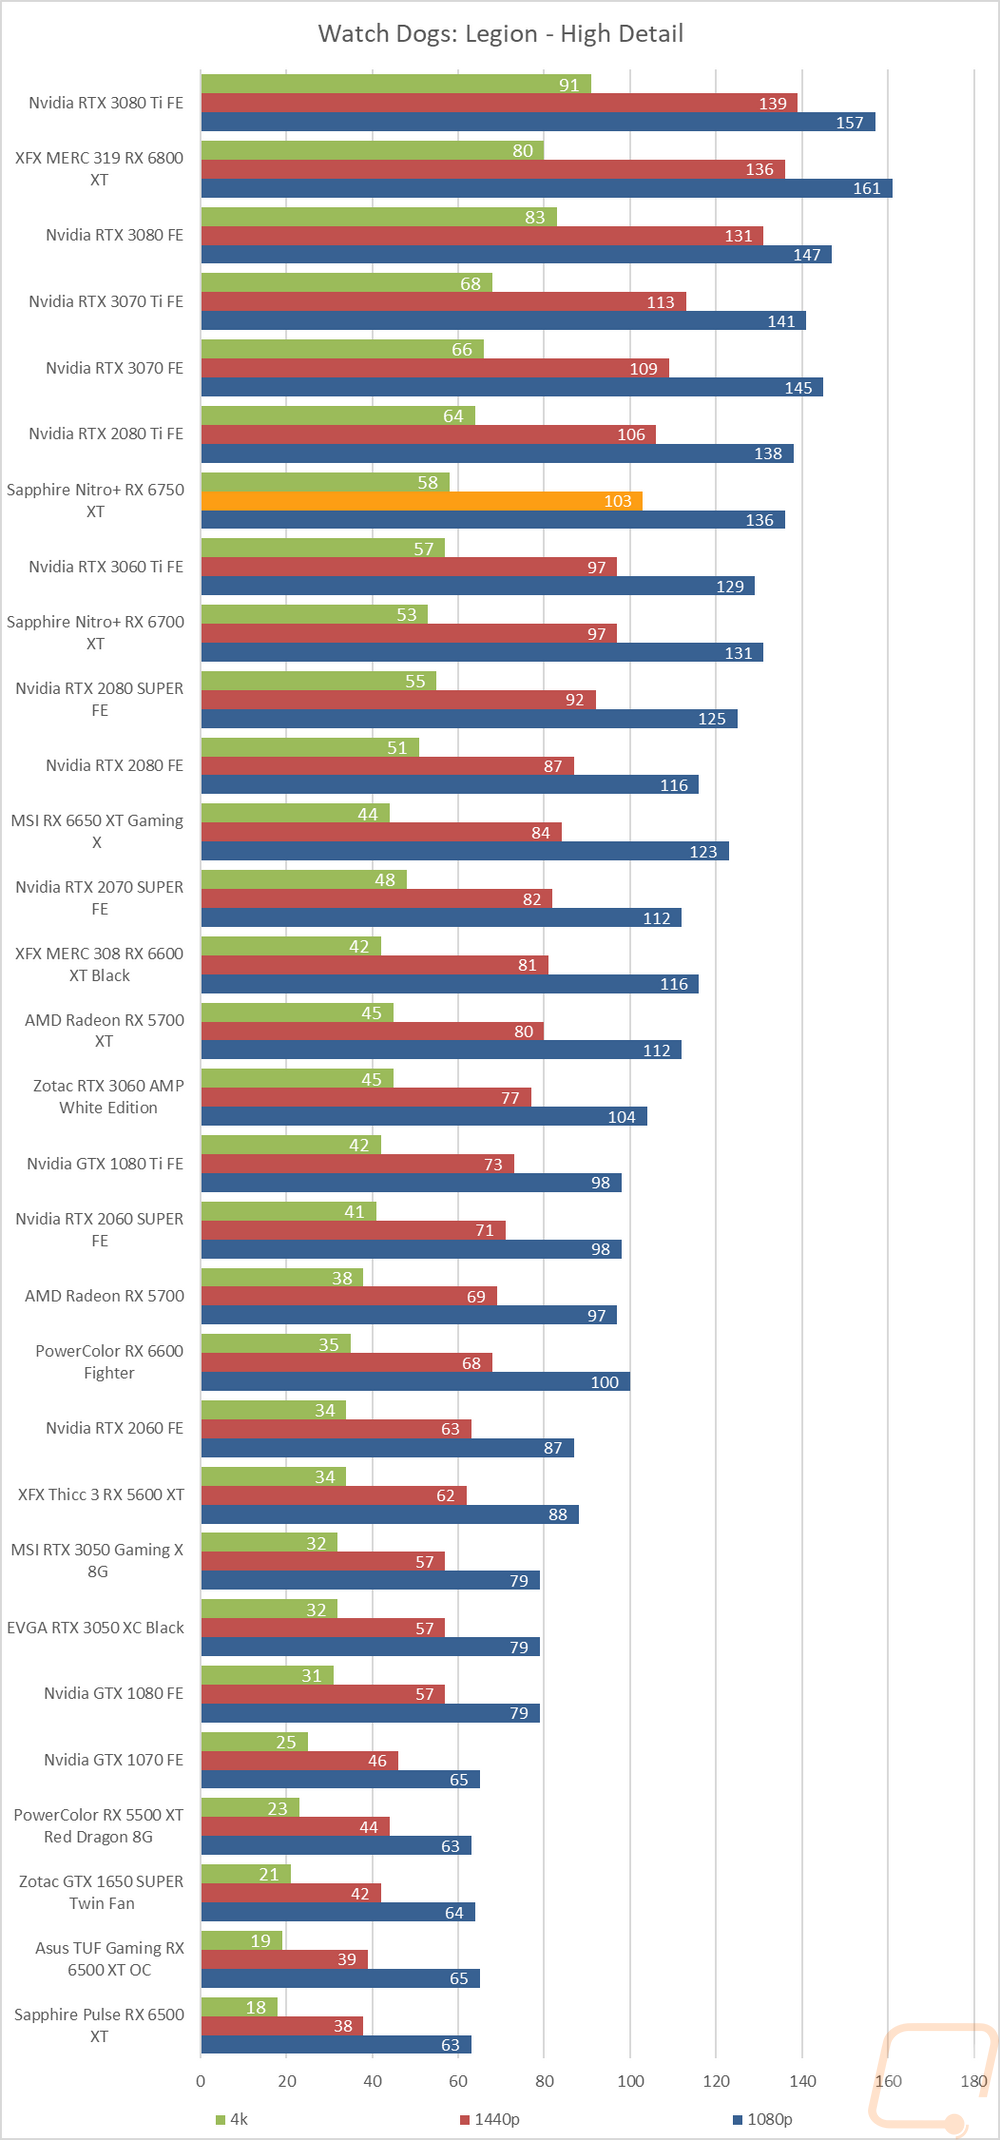
Watch Dogs: Legion |
Built-in benchmark testing at ultra and high details. Tested at 1080p, 1440p, and 4k. I also do RTX and DLSS testing on Nvidia cards at 4K using the Ultra detail settings as a base as well. |
|
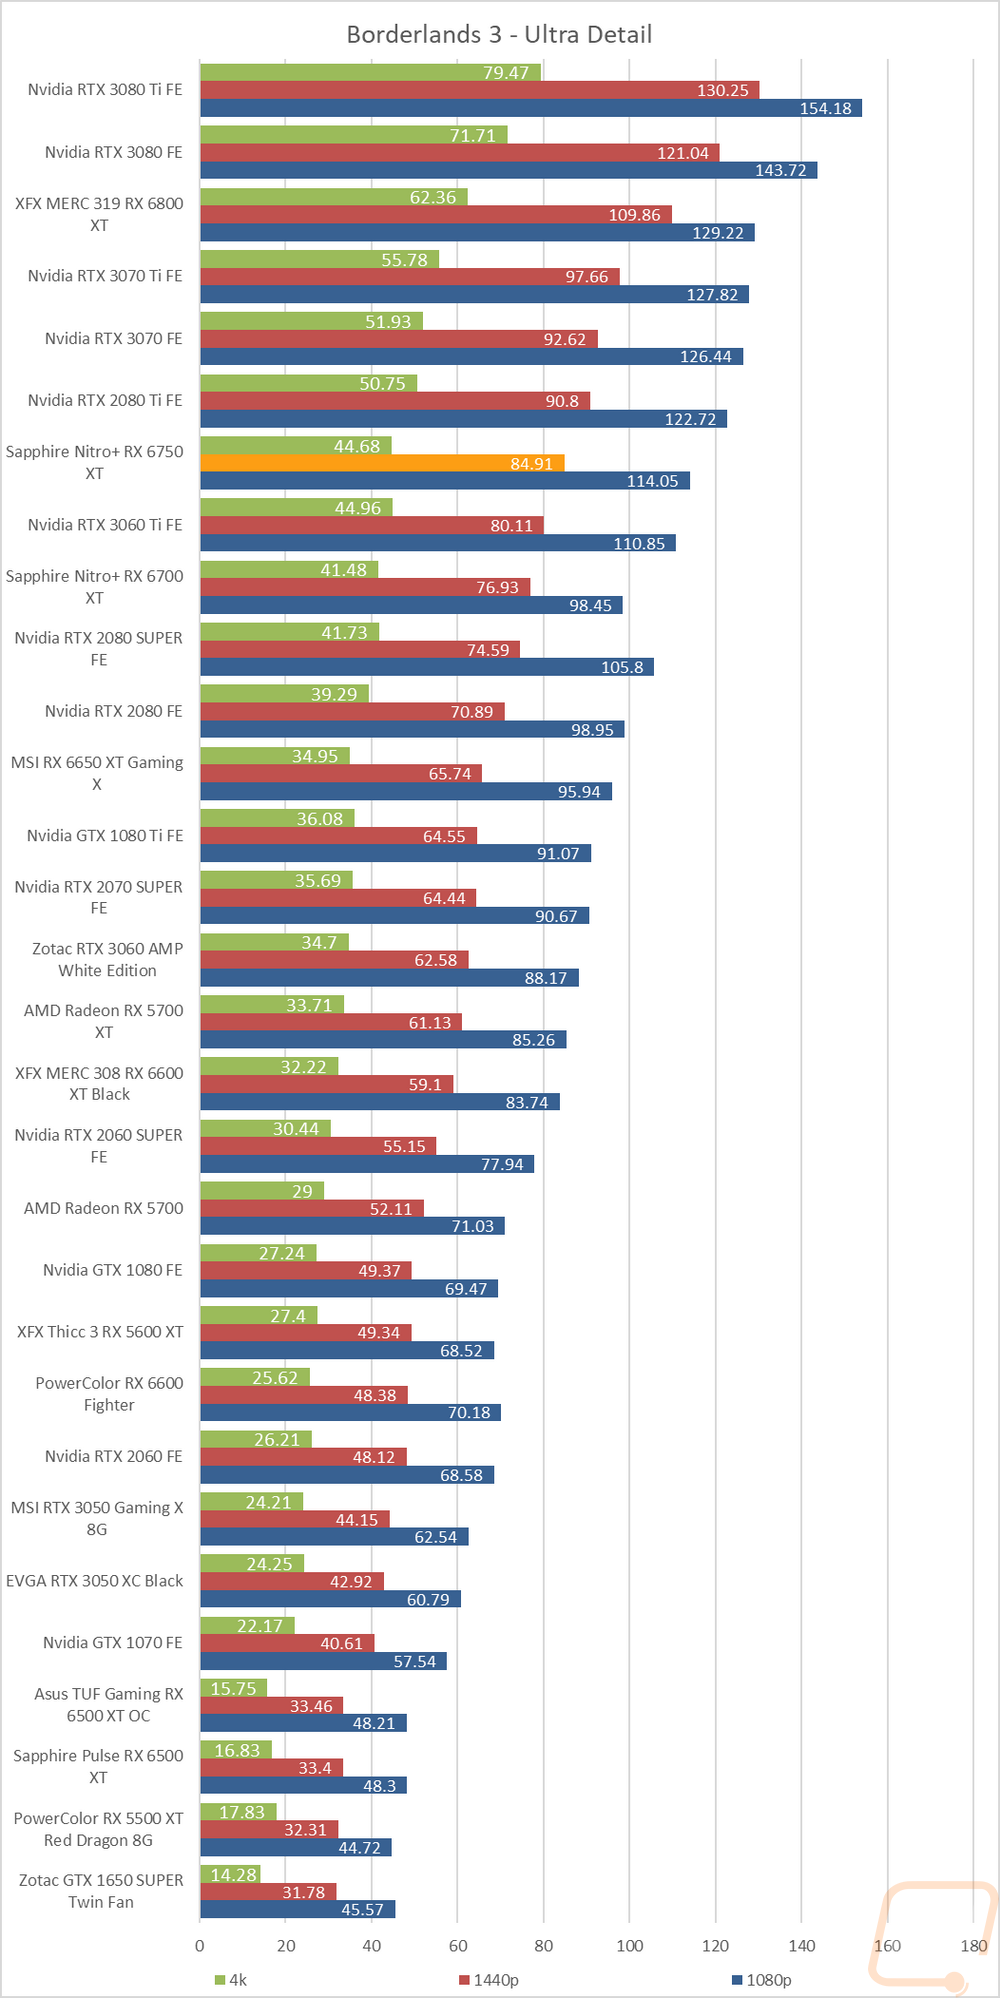
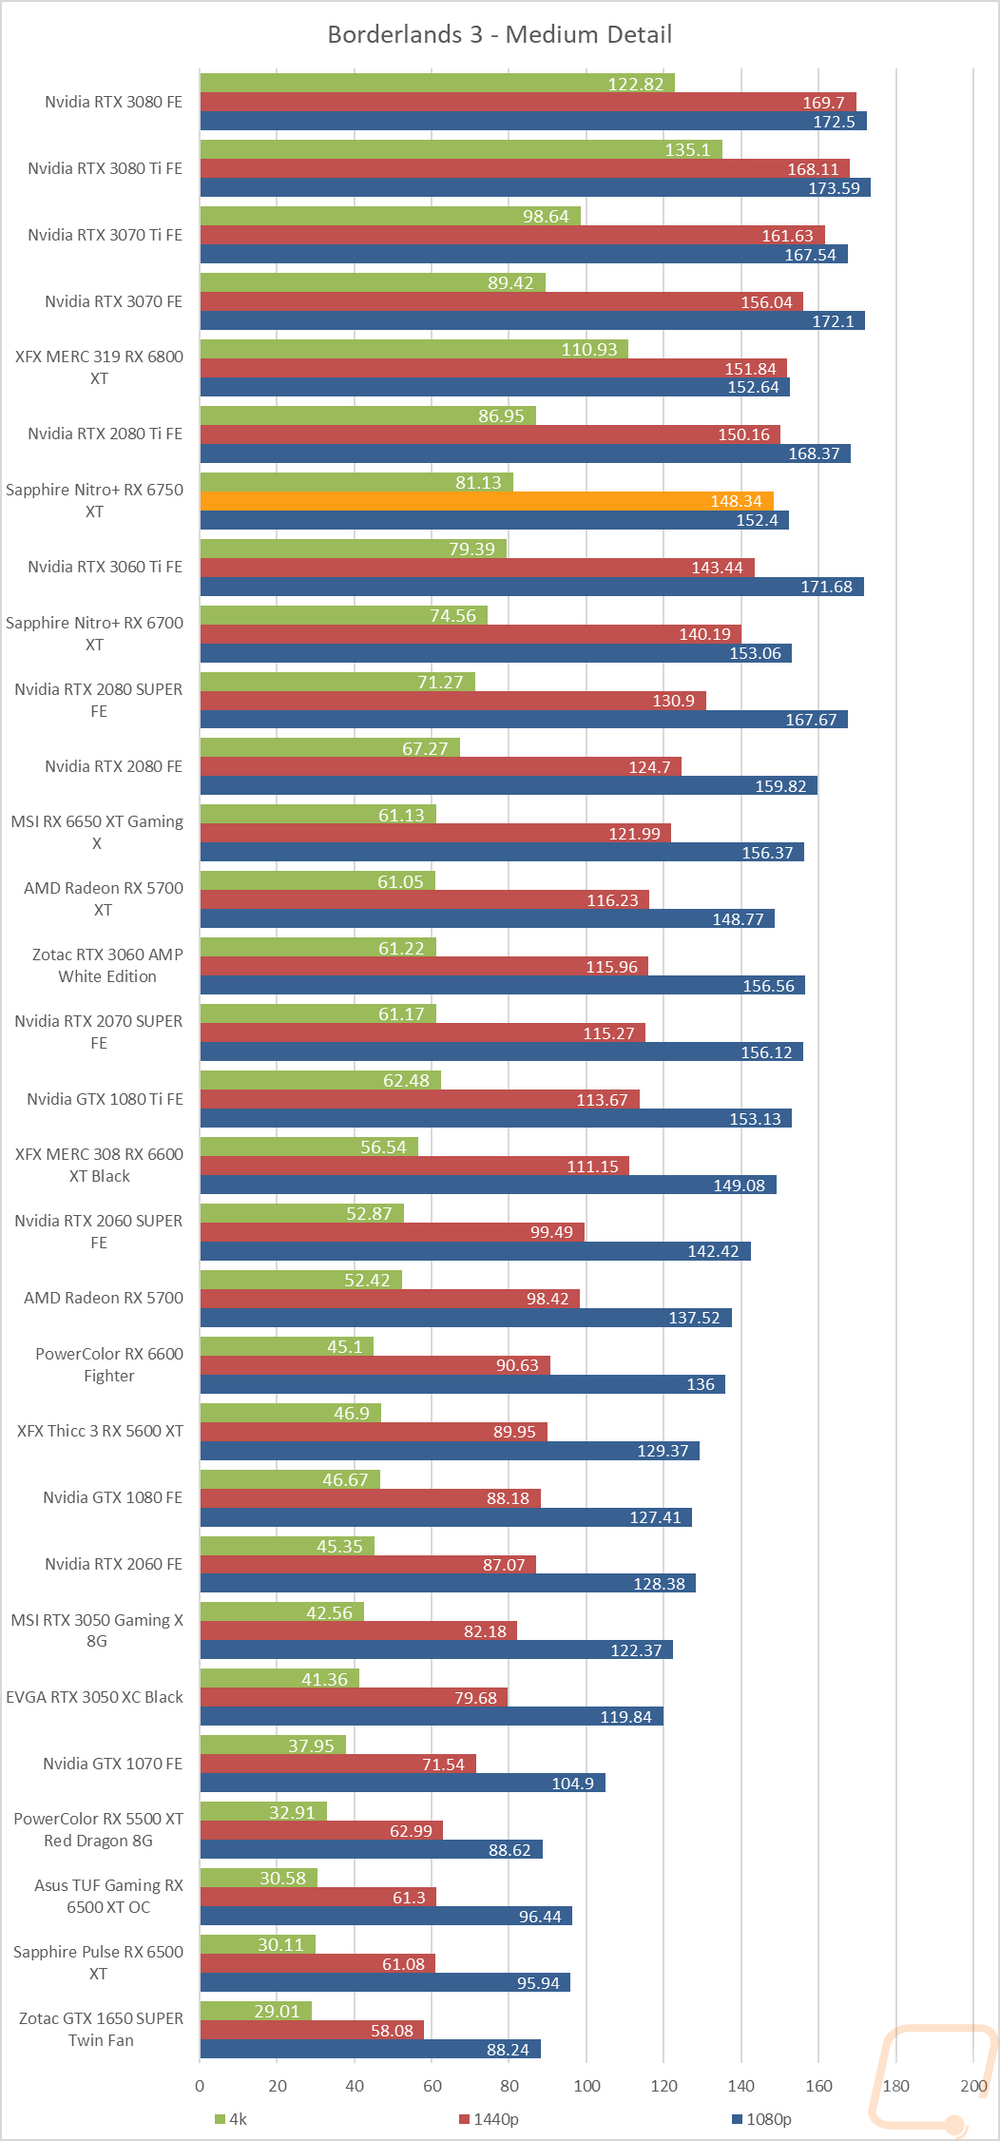
Borderlands 3 |
Built-in benchmark testing with the ultra detail setting and medium detail setting, done at full screen with default settings at 1080p, 1440p, and 4k on DX11 |
|
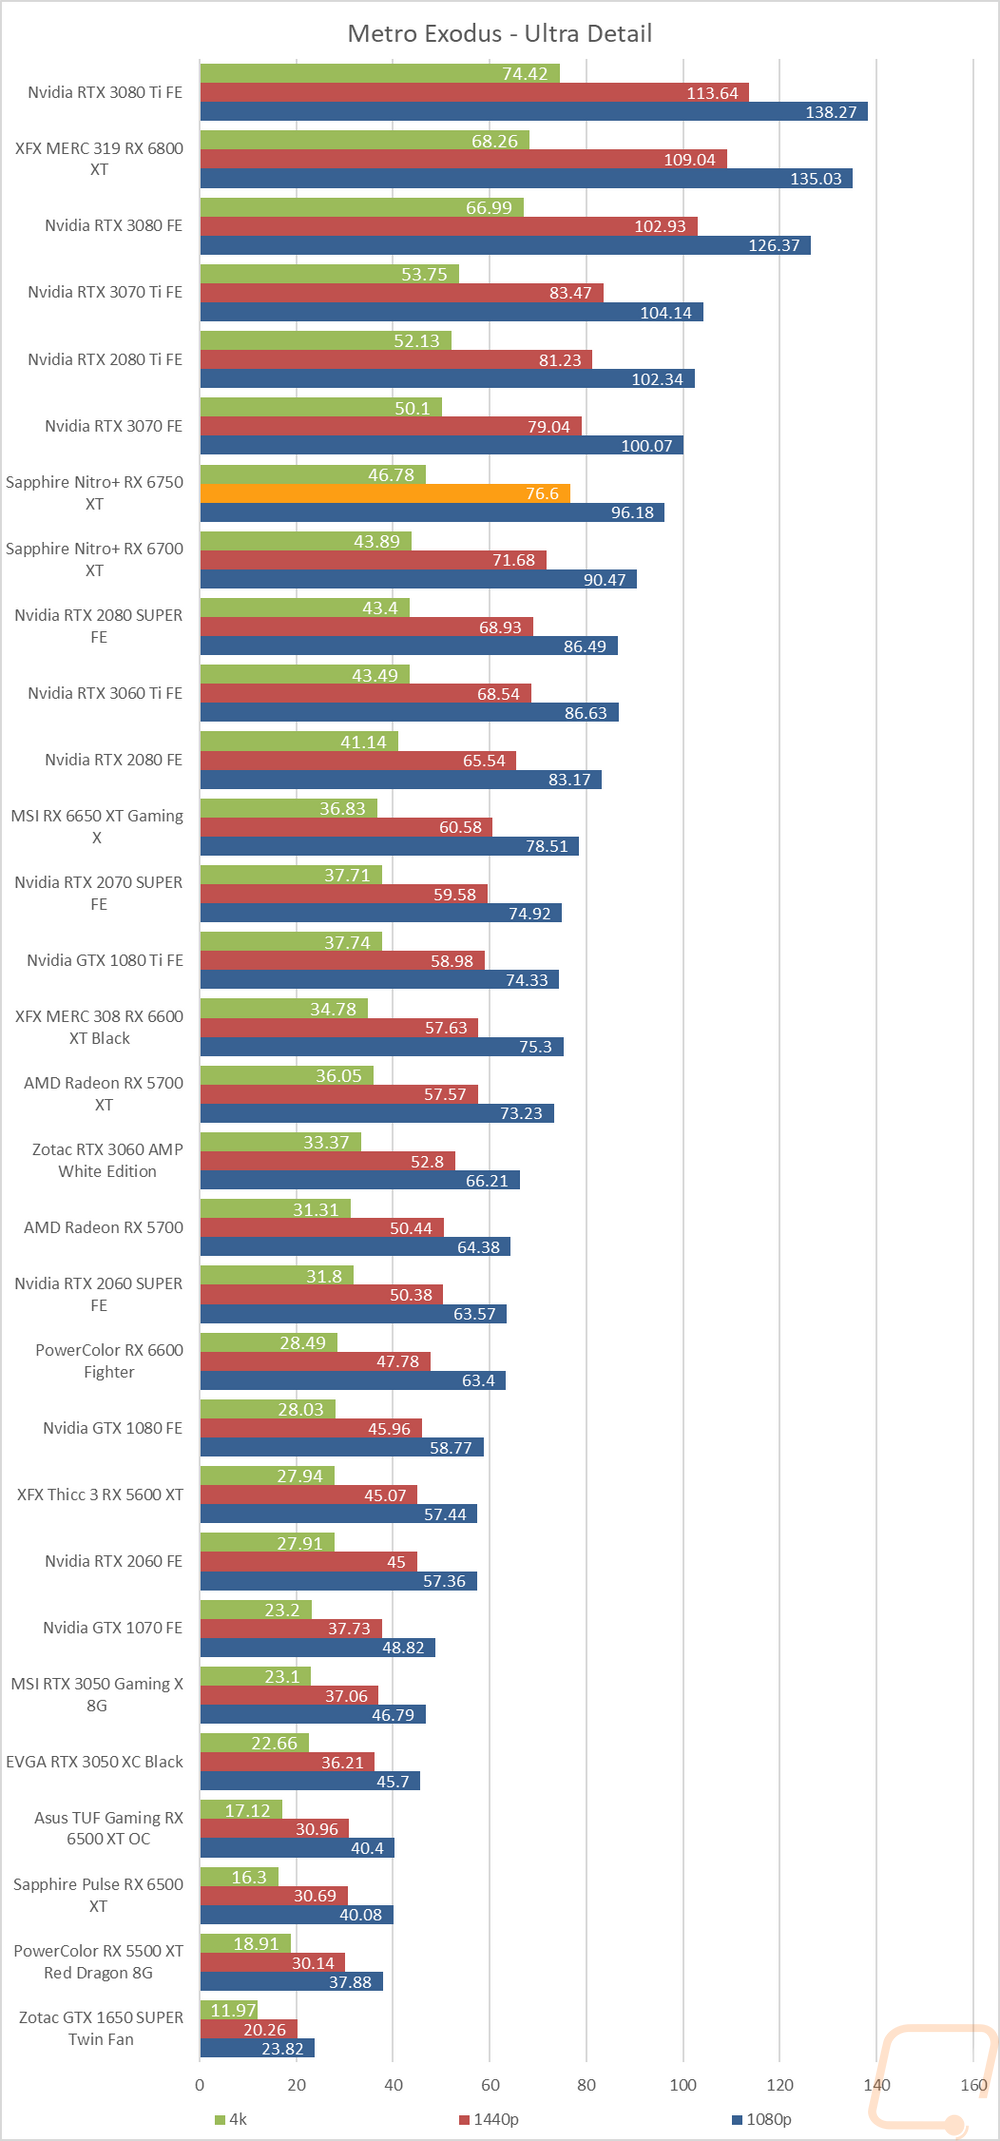
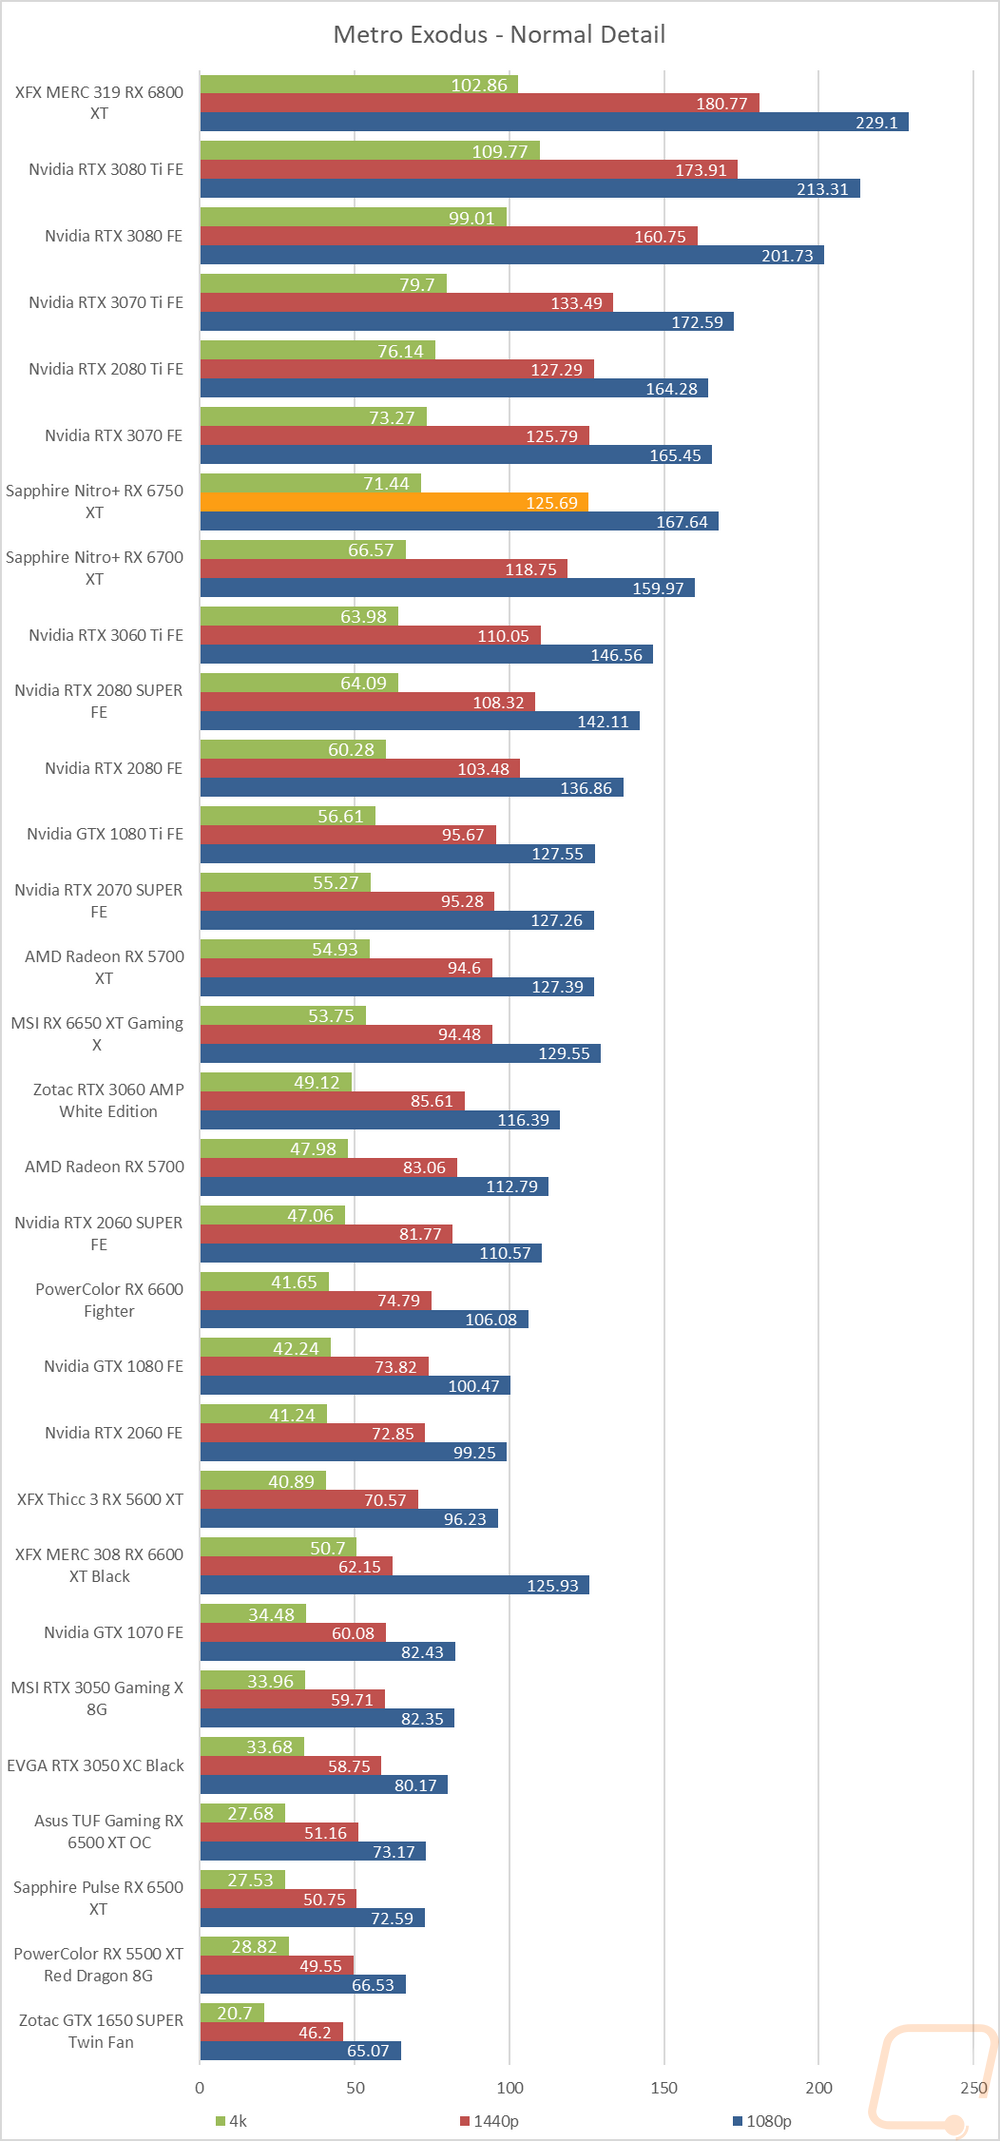
Metro Exodus |
Using built-in benchmark, testing at ultra and normal details at 1080p, 1440p, and 4k. I also do RTX and DLSS testing at 4K with the ultra detail base settings for Nvidia cards as well. |
|
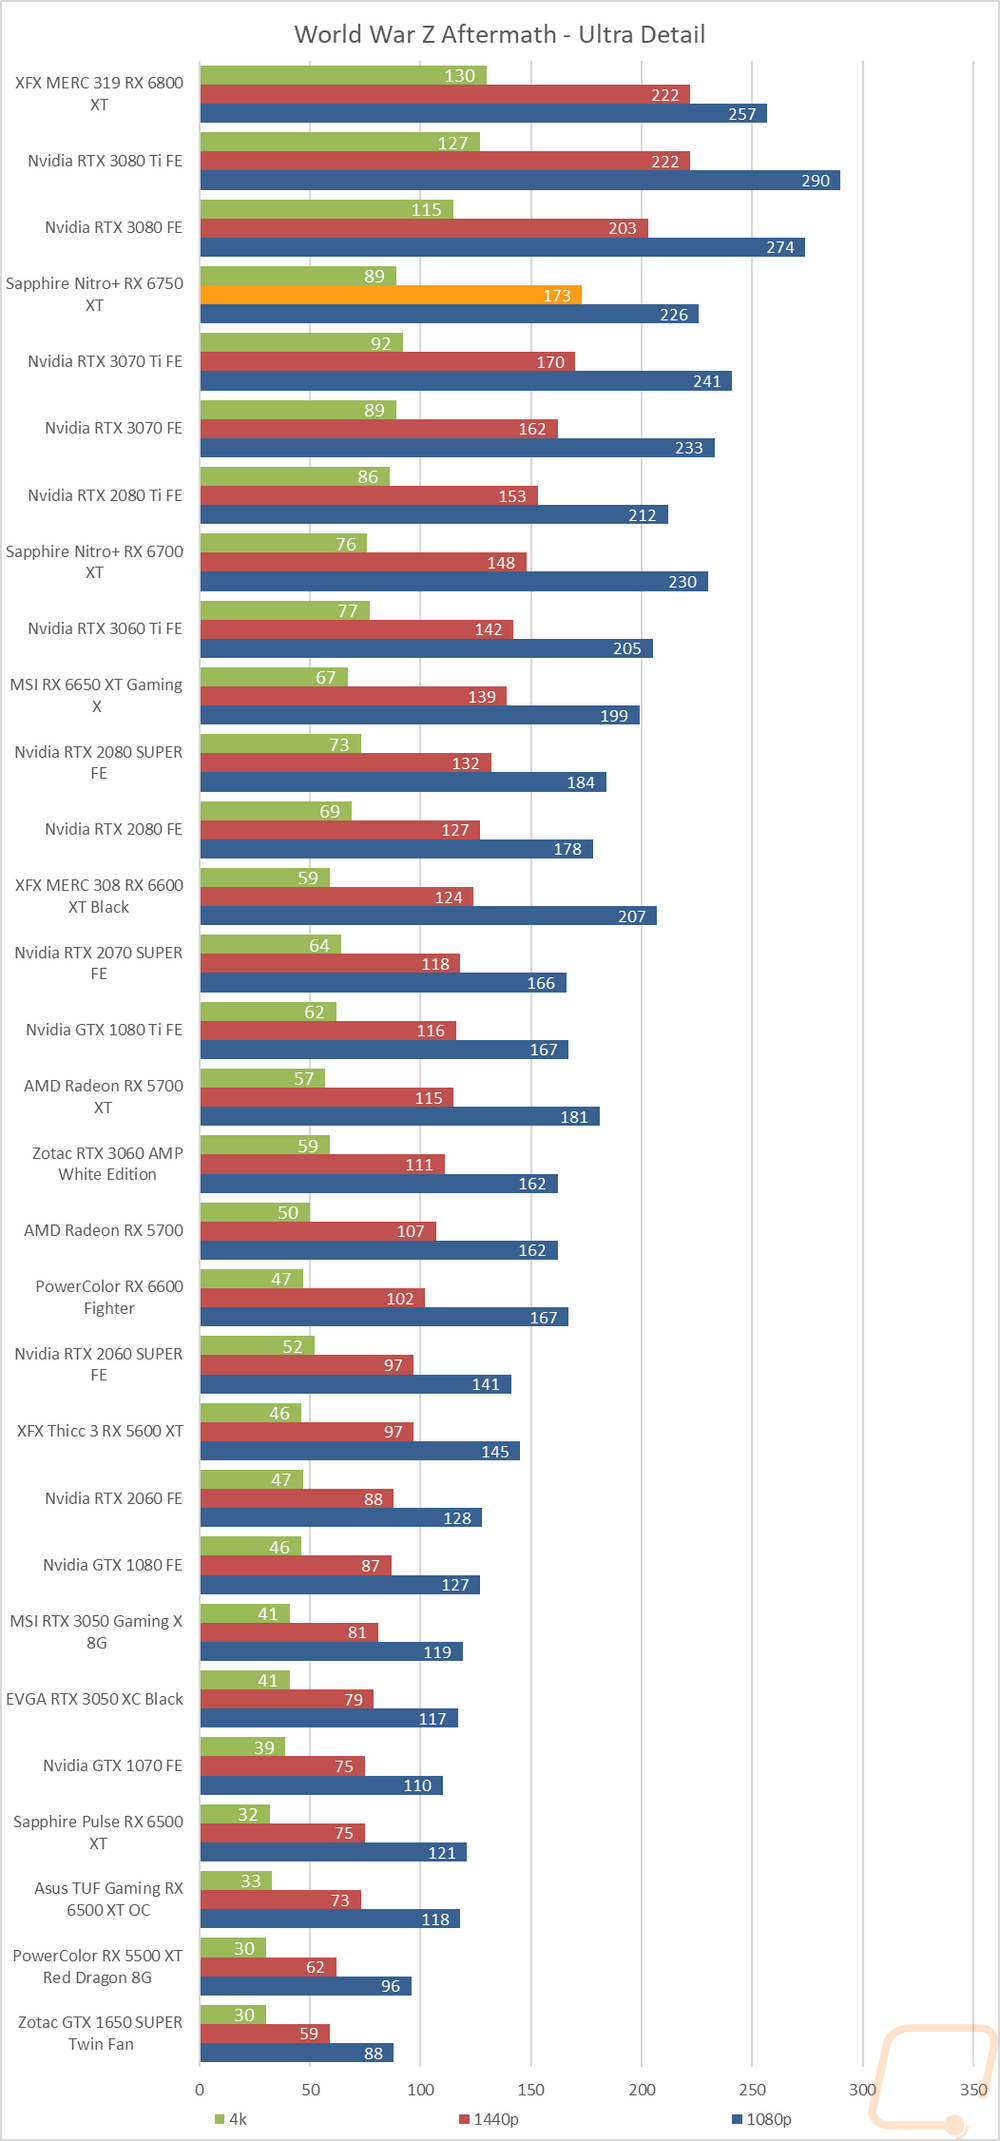
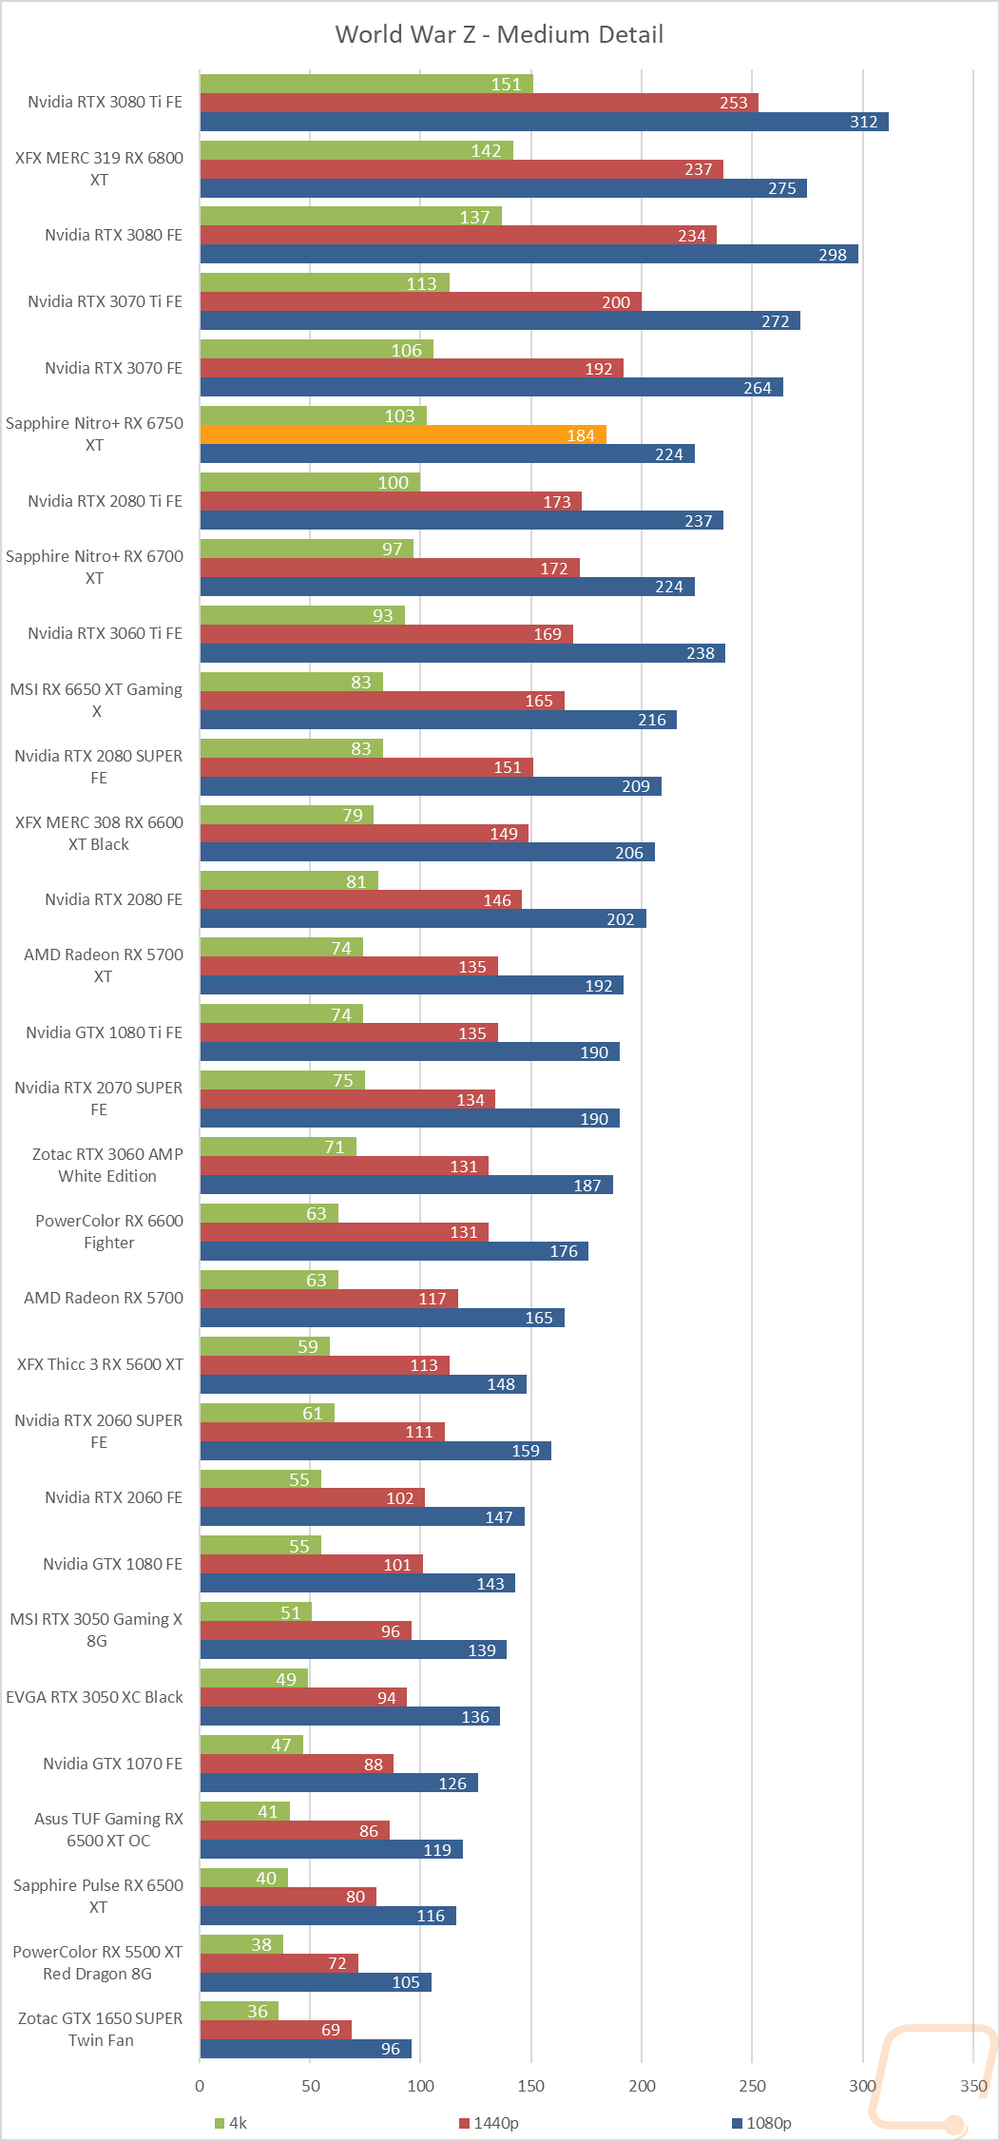
World War Z Aftermath |
Built-in benchmark in DX11 testing both the Ultra detail and Medium detail levels at 1080p, 1440p, and 4K resolutions |
|
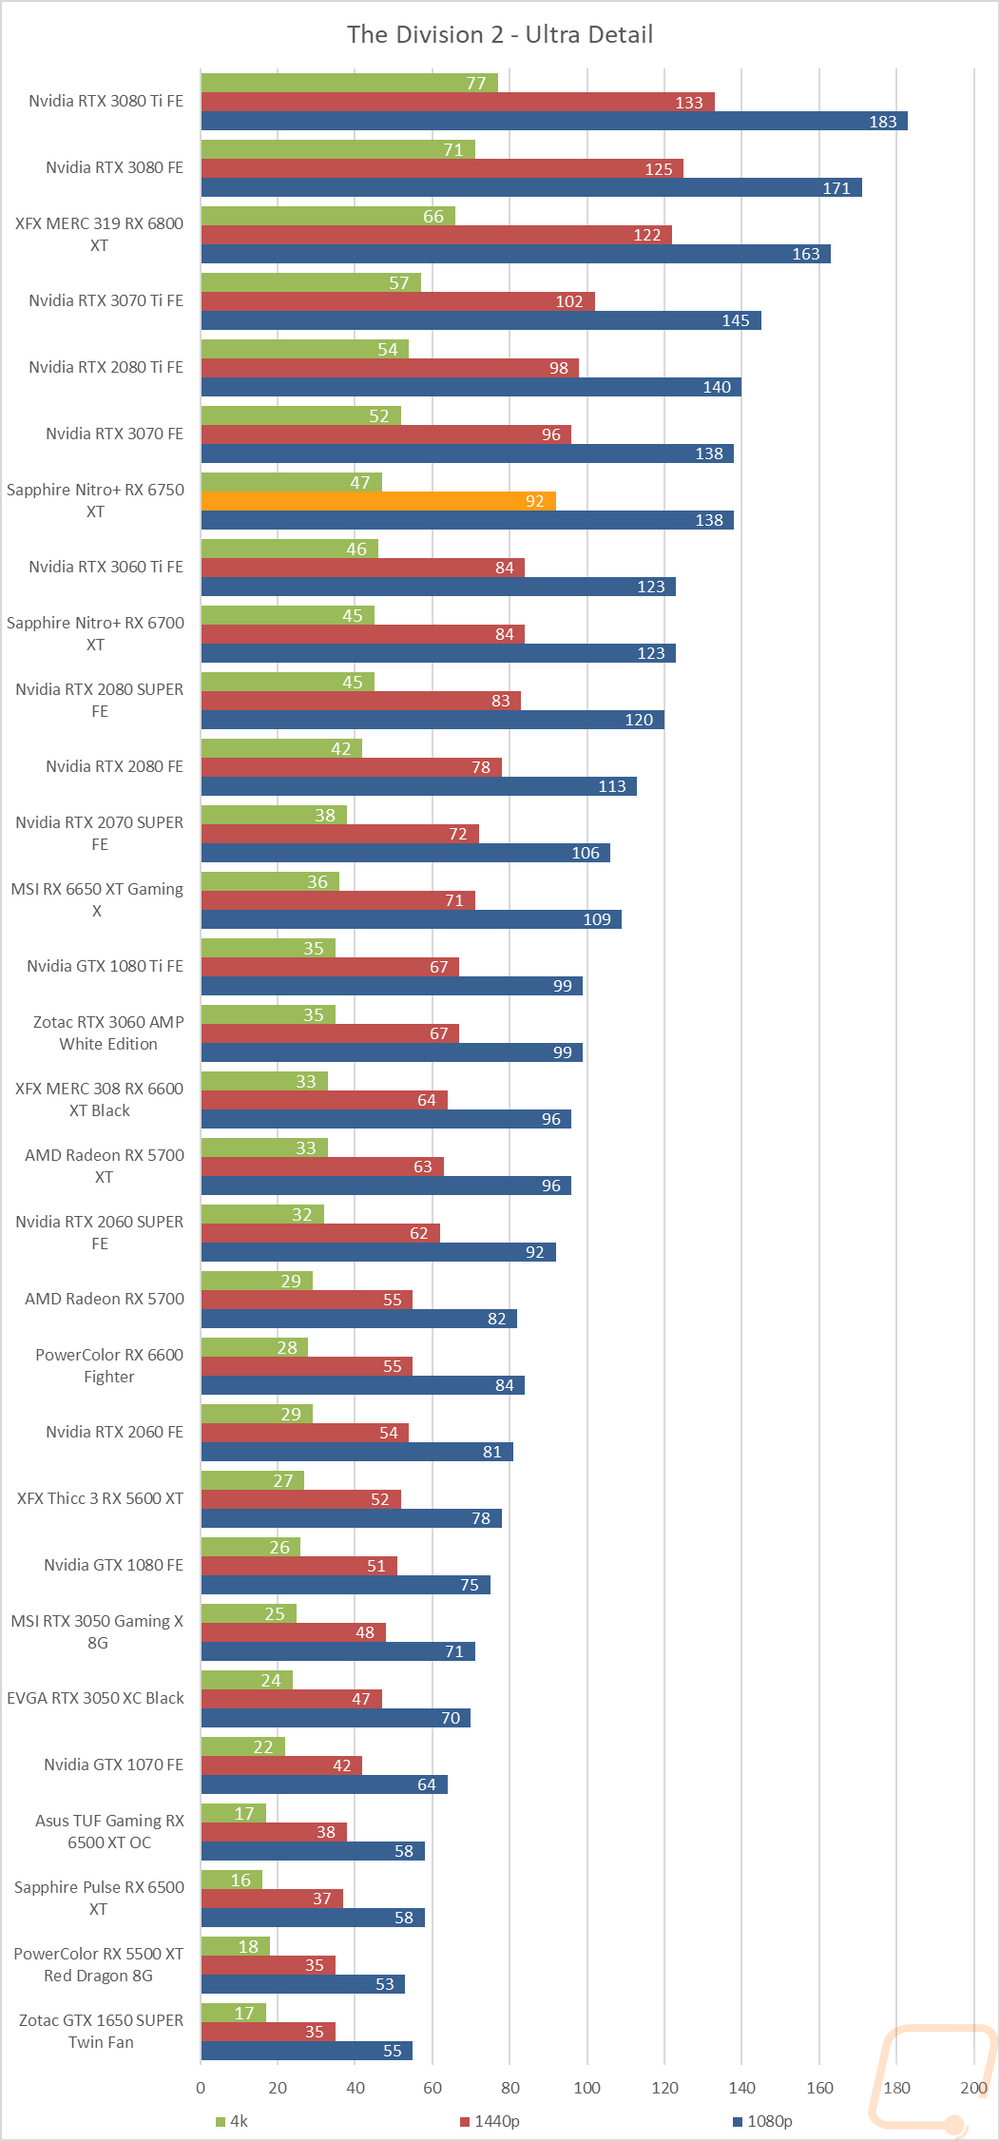
The Division 2 |
Built-in benchmark at Ultra detail with V-Sync turned off at 1080p, 1440p, and 4k resolutions. |
|
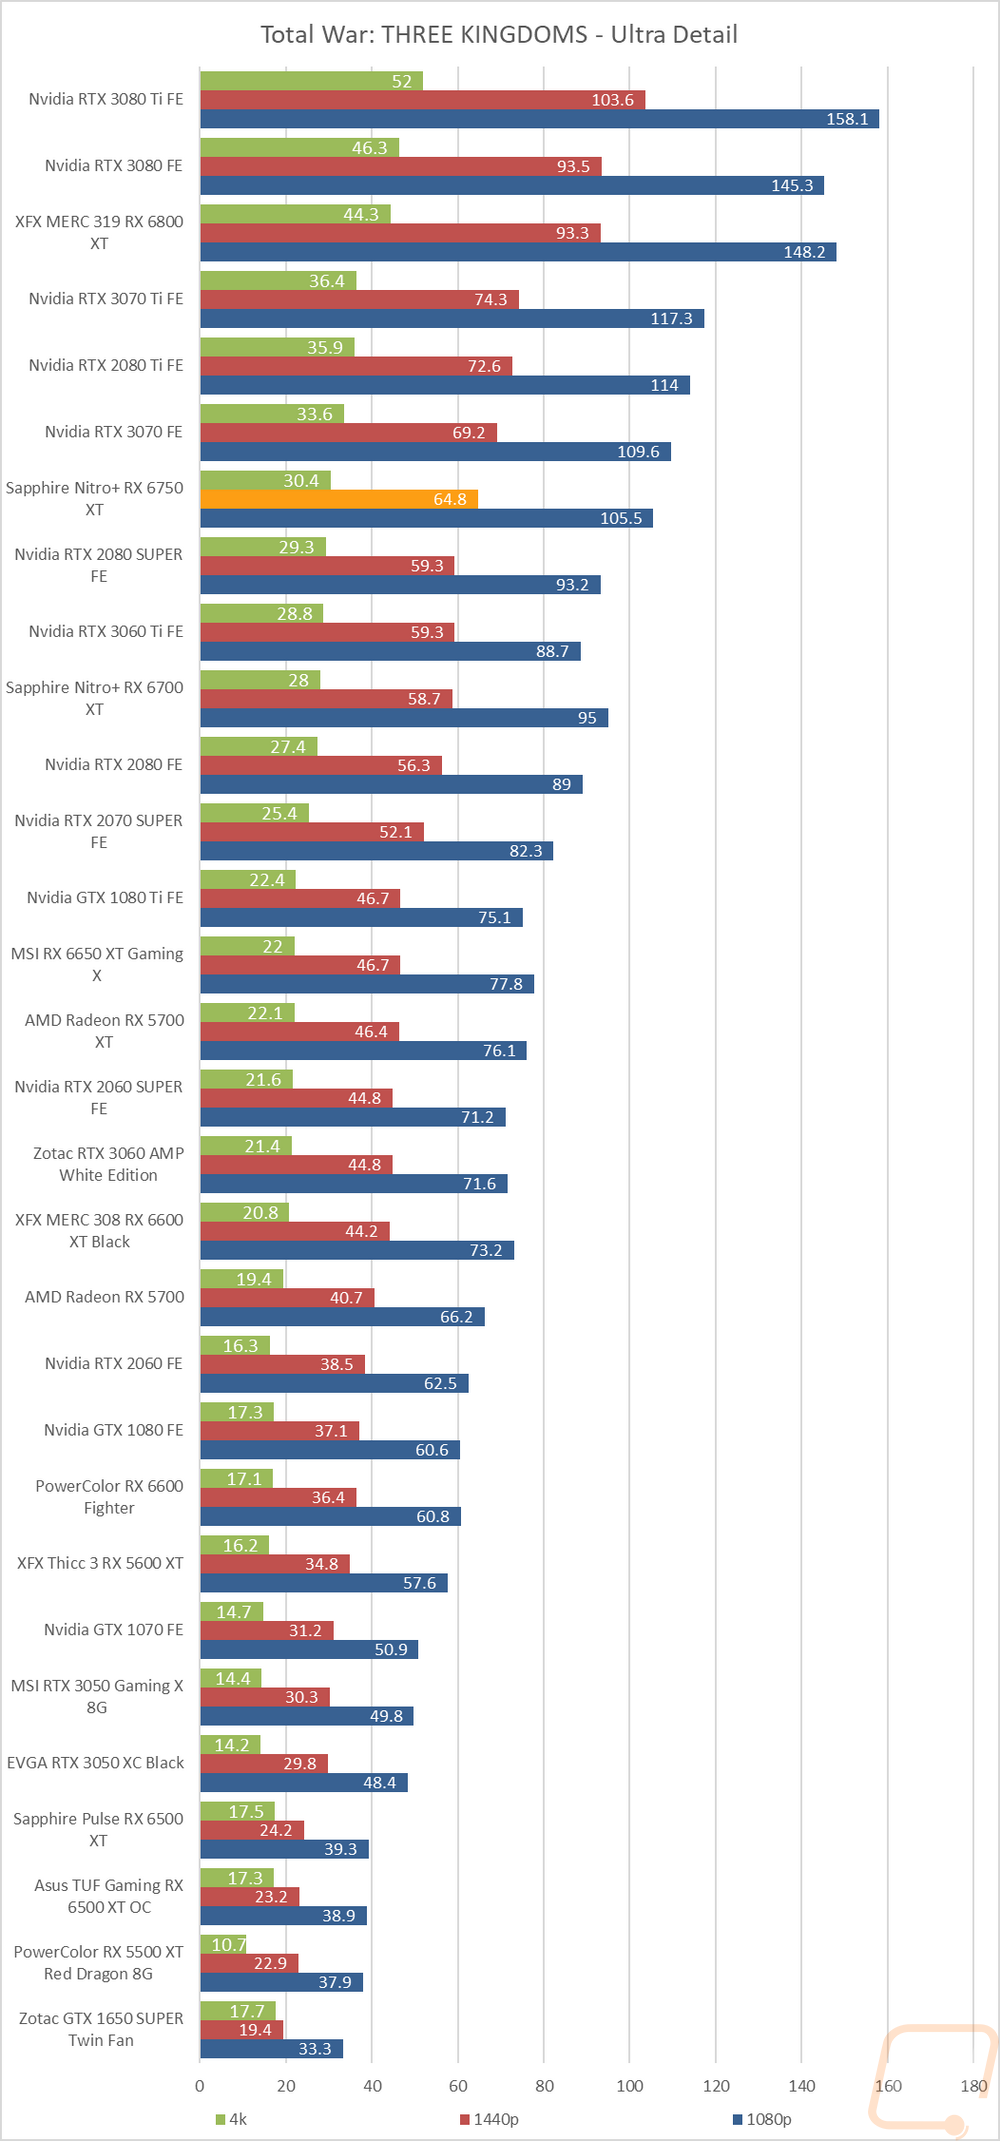
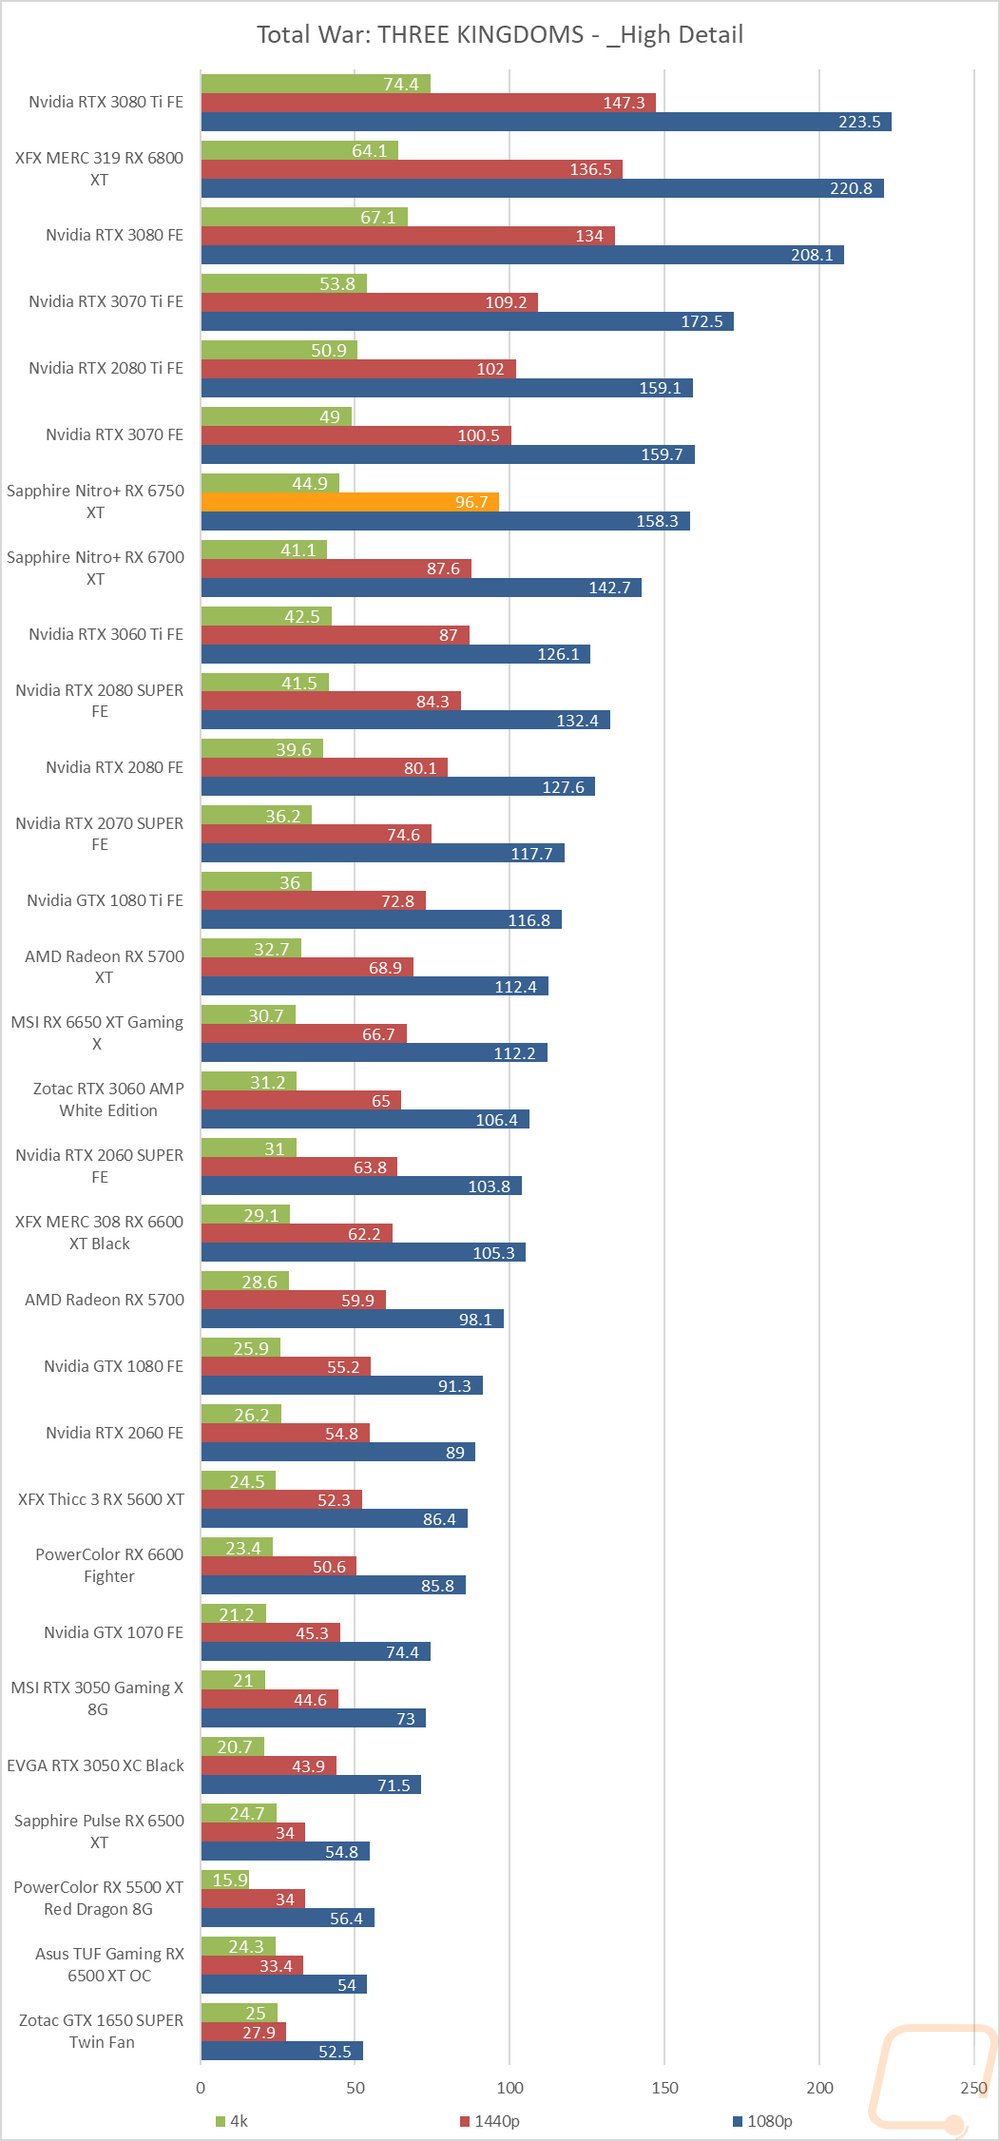
Total War: Three Kingdoms |
Built-in benchmark using the Battle Benchmark setting. Tested at 1080p, 1440p, and 4k at both high and ultra detail settings |
|
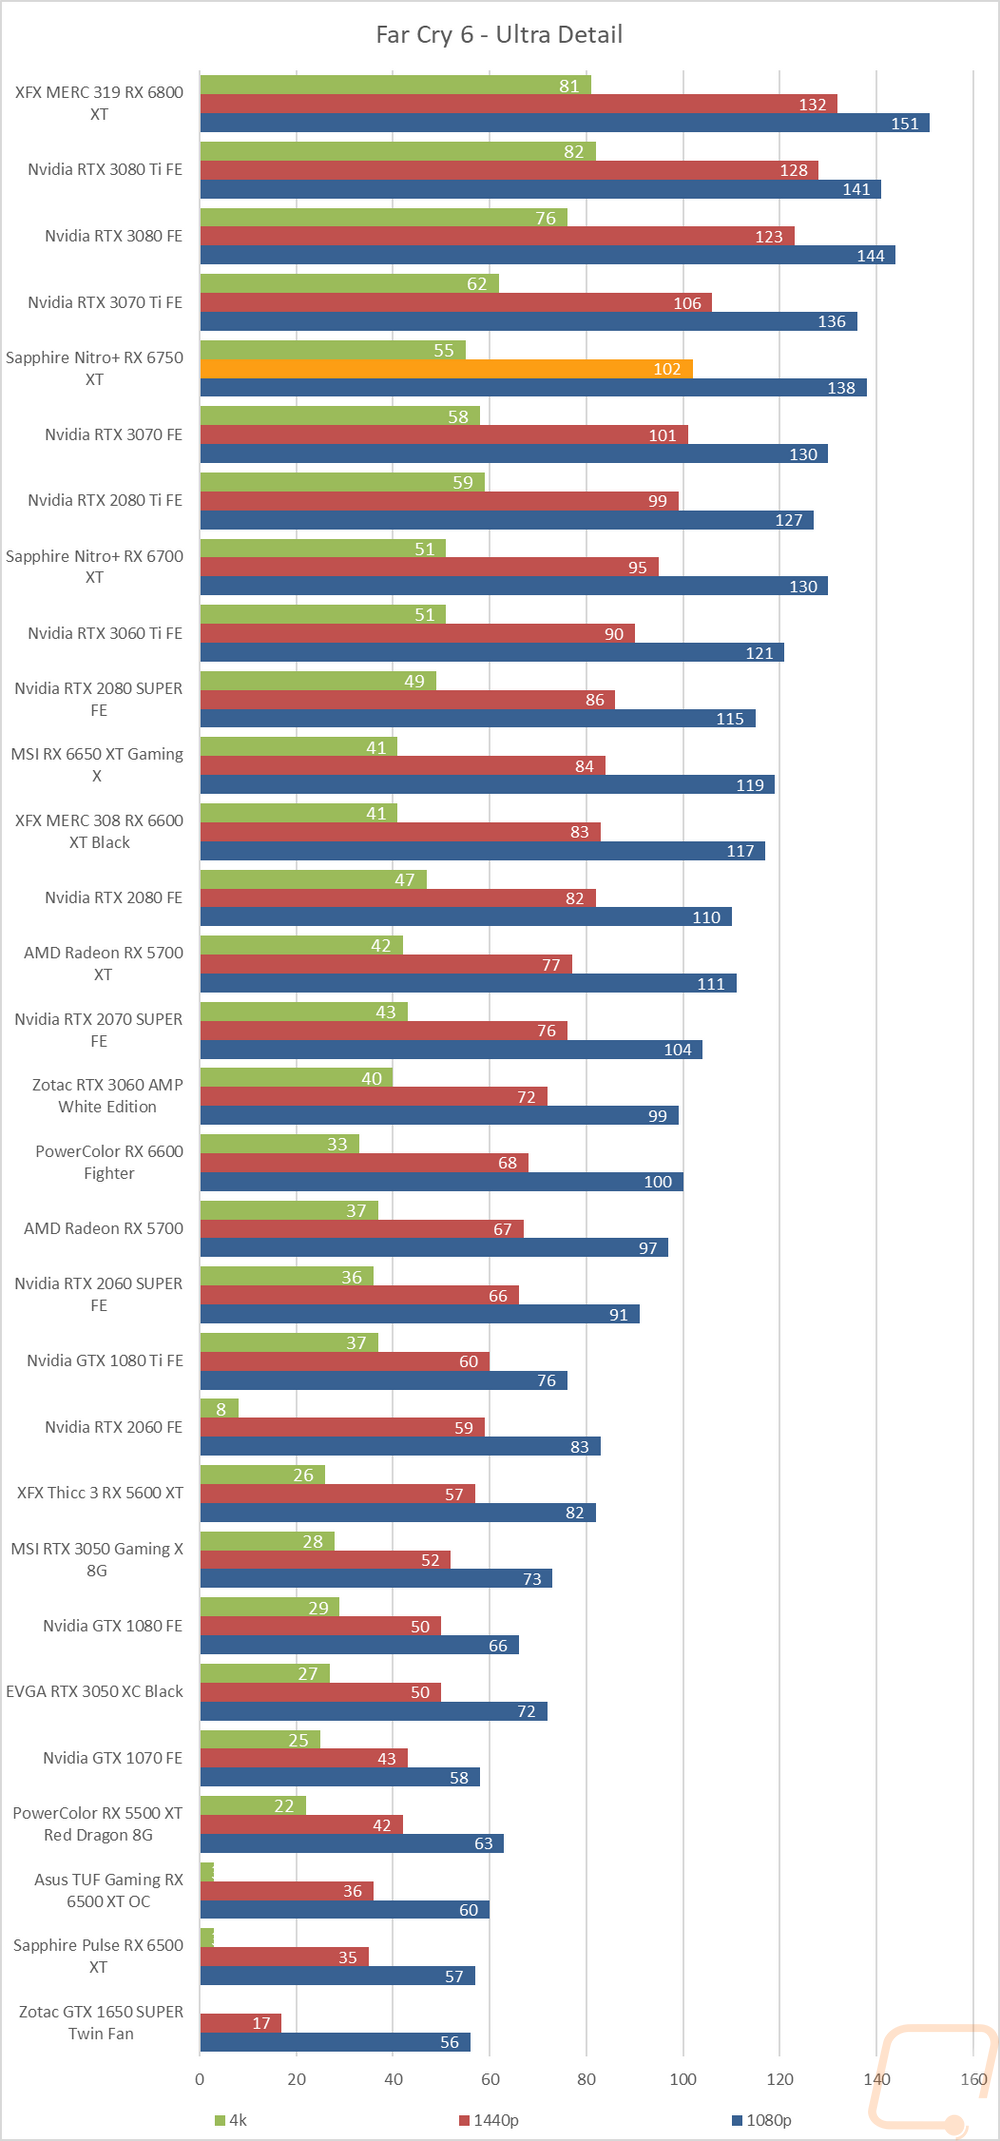
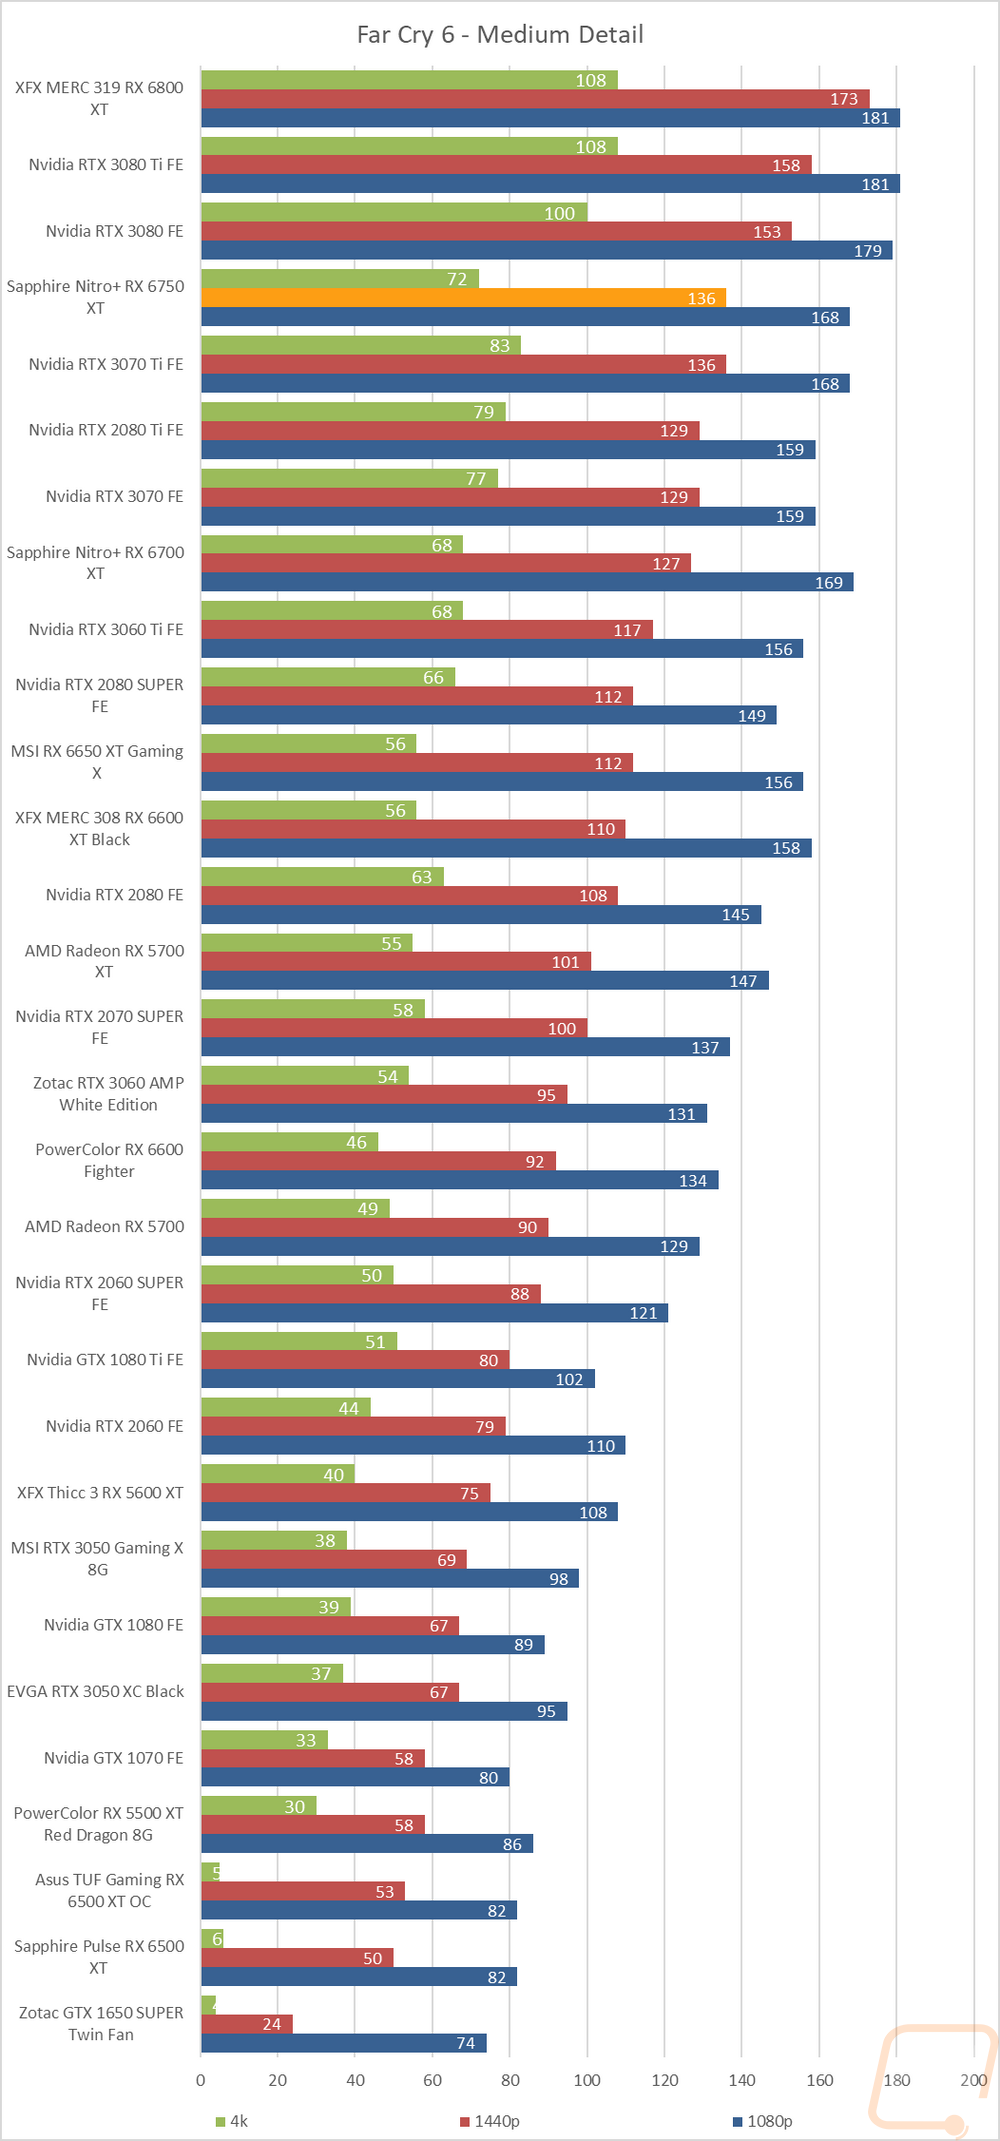
Far Cry 6 |
Built-in benchmark, tested at 1080p, 1440p, and 4k with the Ultra and Medium detail settings |
|
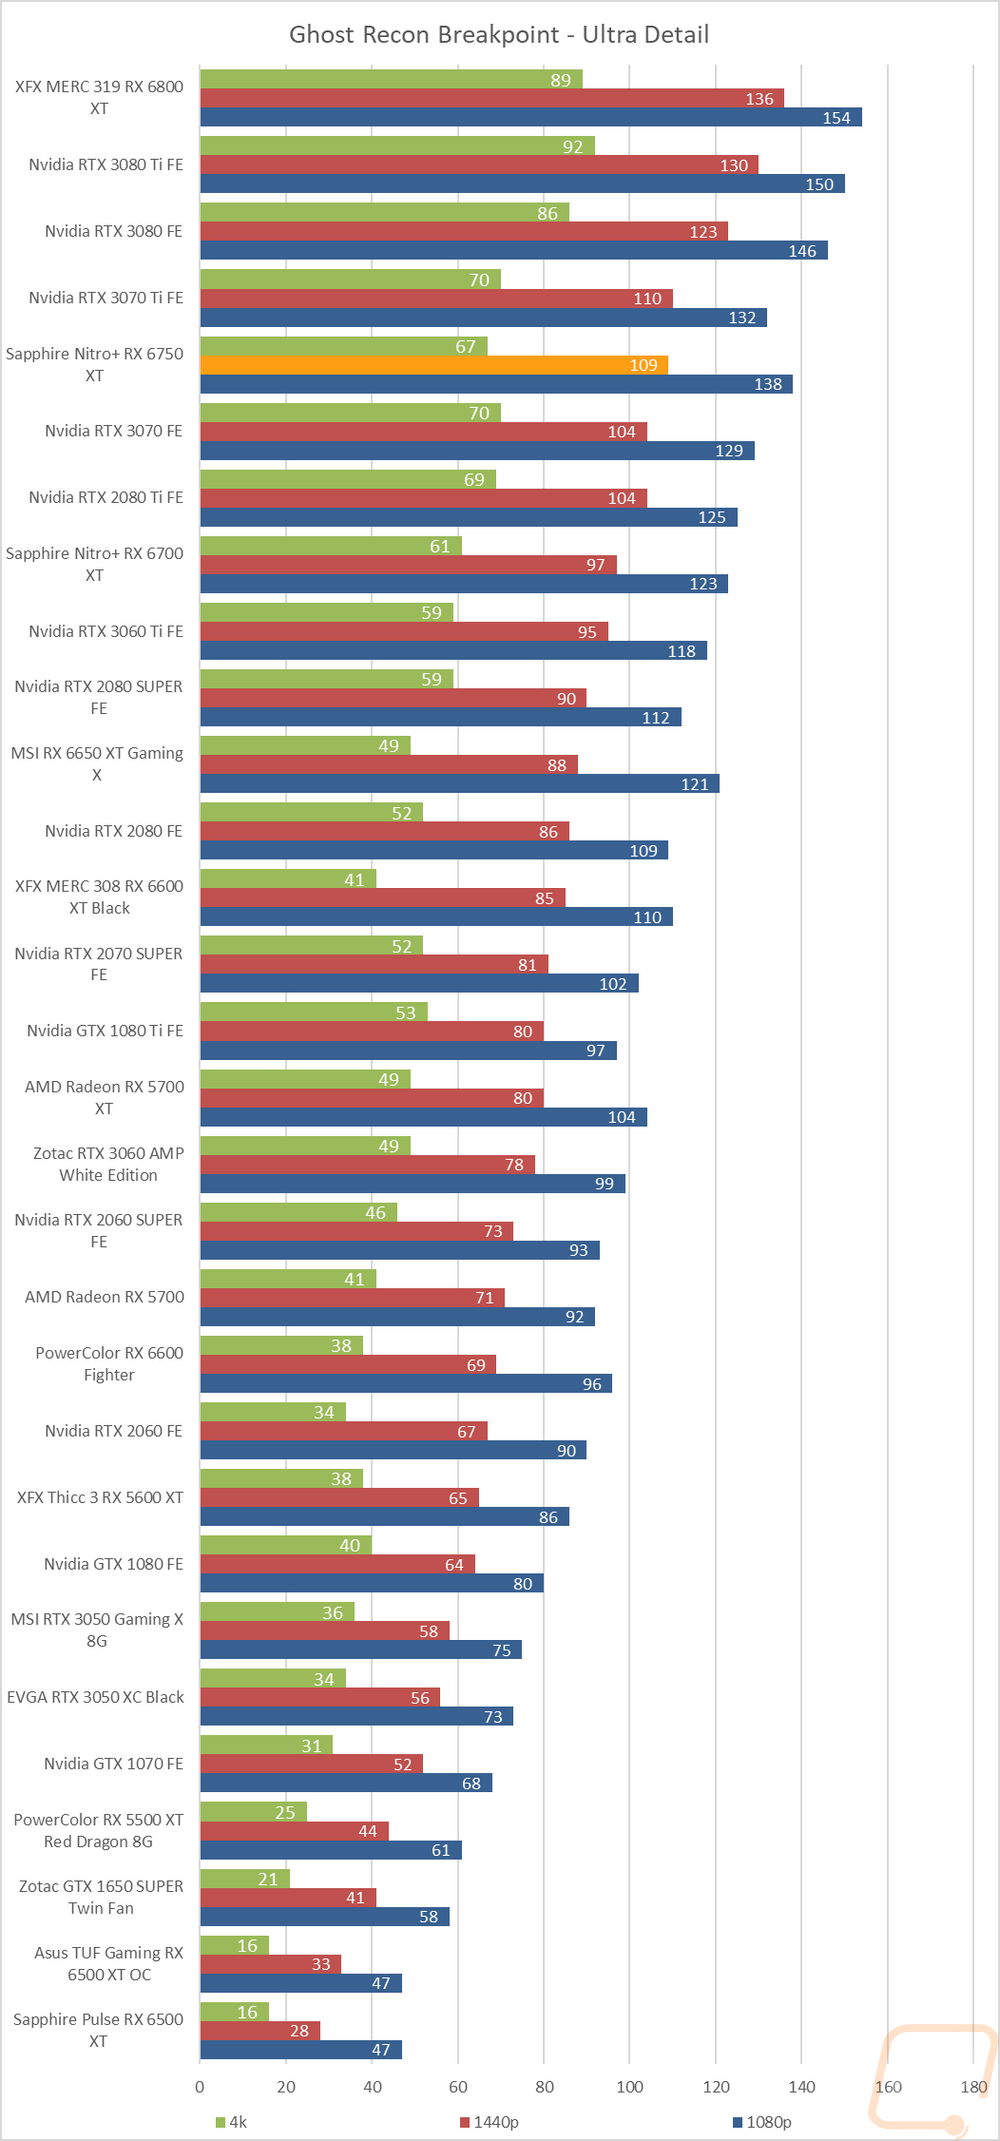
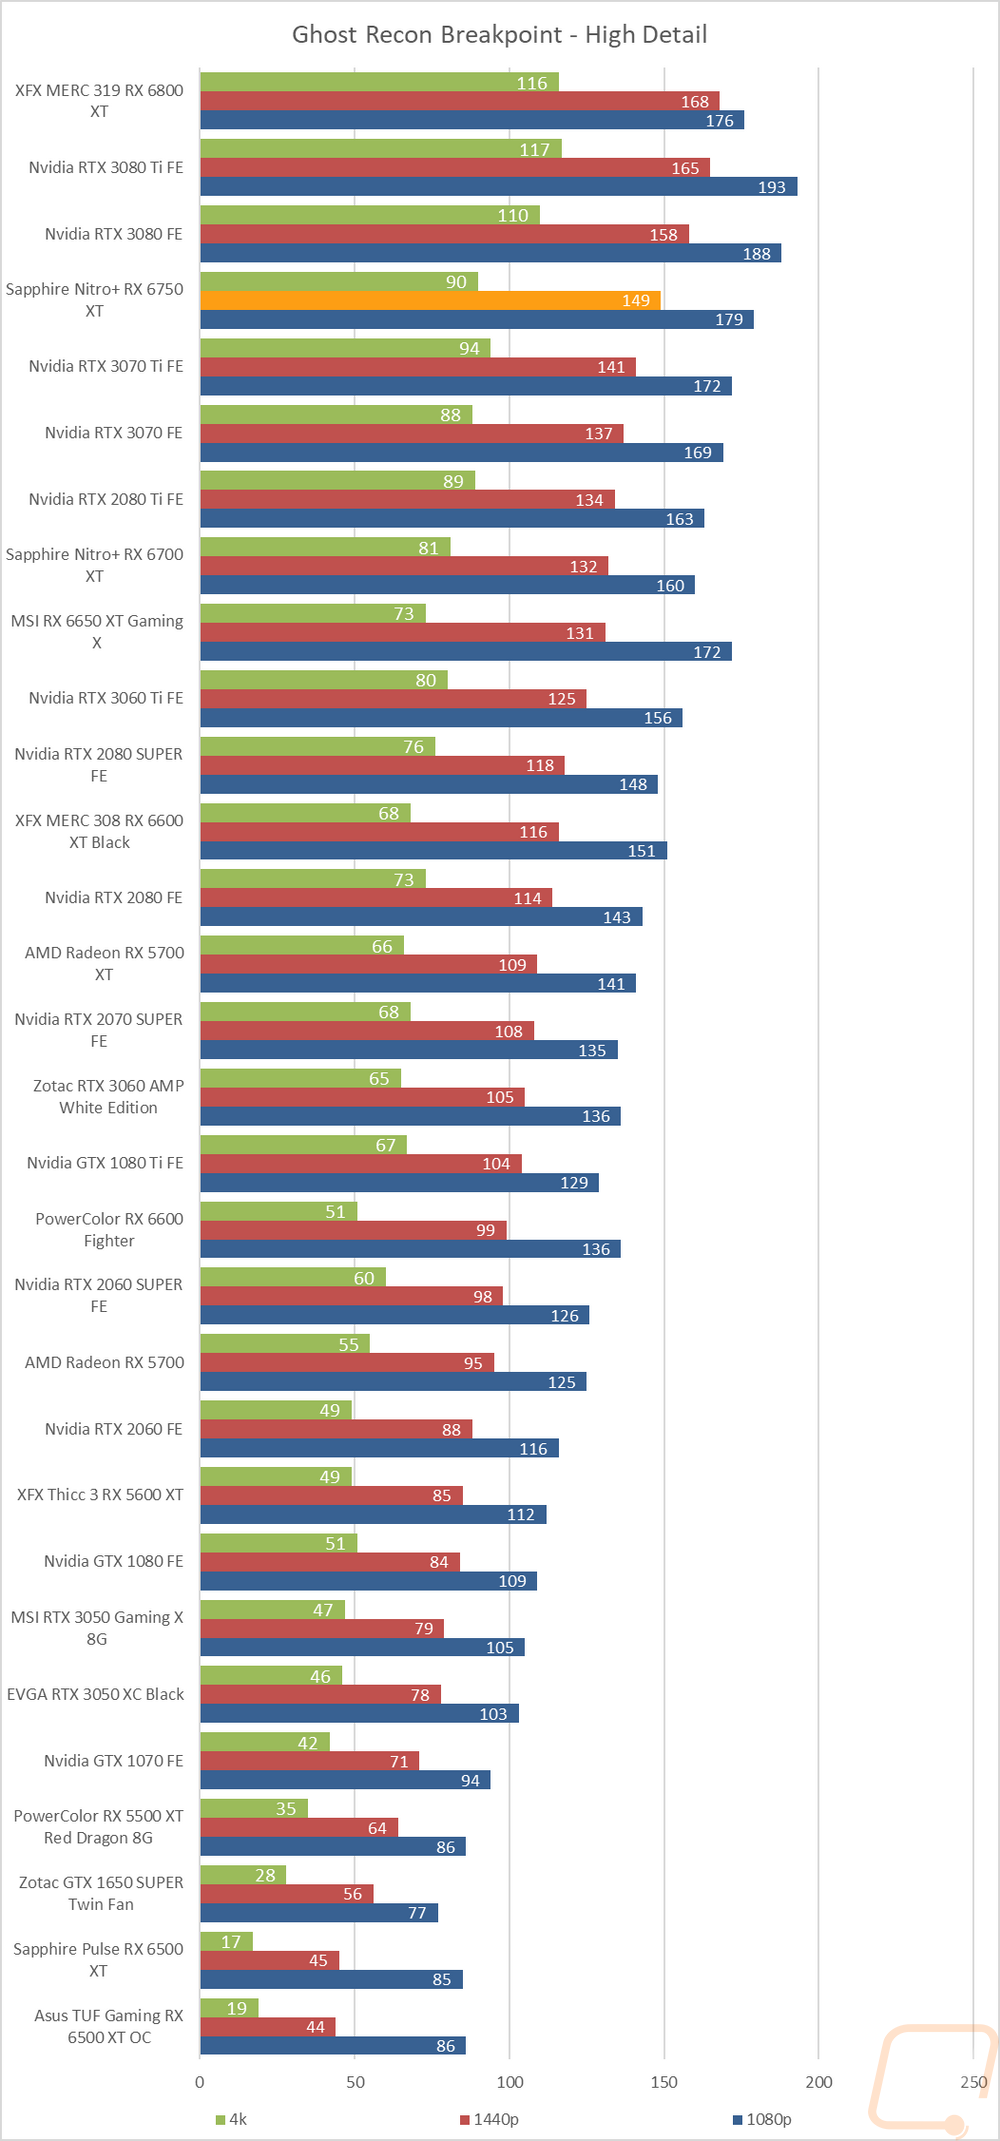
Ghost Recon Breakpoint |
Built-in benchmark, tested at 1080p, 1440p, and 4k with the Ultra and Medium detail settings |
|
Boundary Benchmark |
Testing different DLSS detail levels on cards that support it. All testing is done at 4k with RTX on |
|
Bright Memory Infinite RTX Benchmark |
Benchmark all of the different RTX detail levels. Resolution at 4k and DLSS on balanced for each test |
|
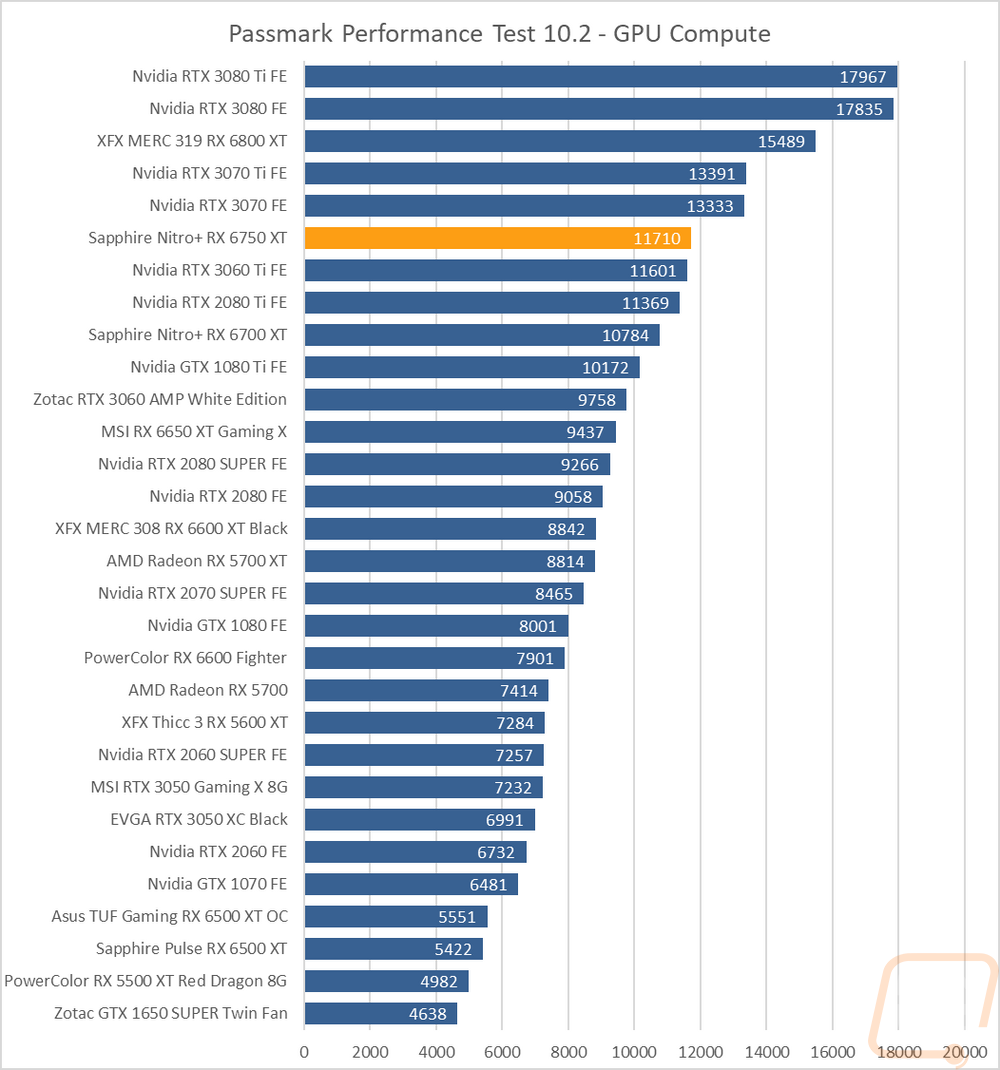
Passmark Performance Test 10.2 |
Test using the GPU Compute Score inside of Passmark’s Performance Test 10.2 |
|
Blender |
Using the new Blender Benchmark with the Quick Benchmark setting set to use the GPU, not the CPU. Nvidia cards are tested twice, once with CUDA and the other with Optix, and AMD cards are run on OpenGL. The result is in total seconds the test took, lower is better. The 2.93.1 build is used and I run all six tests, BMW27, Koro, Classroom, Pavillon, Fishy cat (my favorite), and Victor |
|
OctaneBench 2020.1 |
OctaneBench is designed to test rendering in OctaneRender. RTX and non-RTX are both run. This is a CUDA only test so only Nvidia cards are tested |
|
Power Testing |
I run three power tests. Two I use a Kill-A-Watt hooked up in line with the power cord for the test rig. Two tests are done, one using the AIDA64 Stress Test and the second uses the 3DMark Time Spy benchmark on the second test. I also use GPUz to document the GPU only reading off the card itself for wattage when doing the Time Spy test. The Time Spy test uses only the second test here because the3rd test is the combined test that loads the CPU as well. |
|
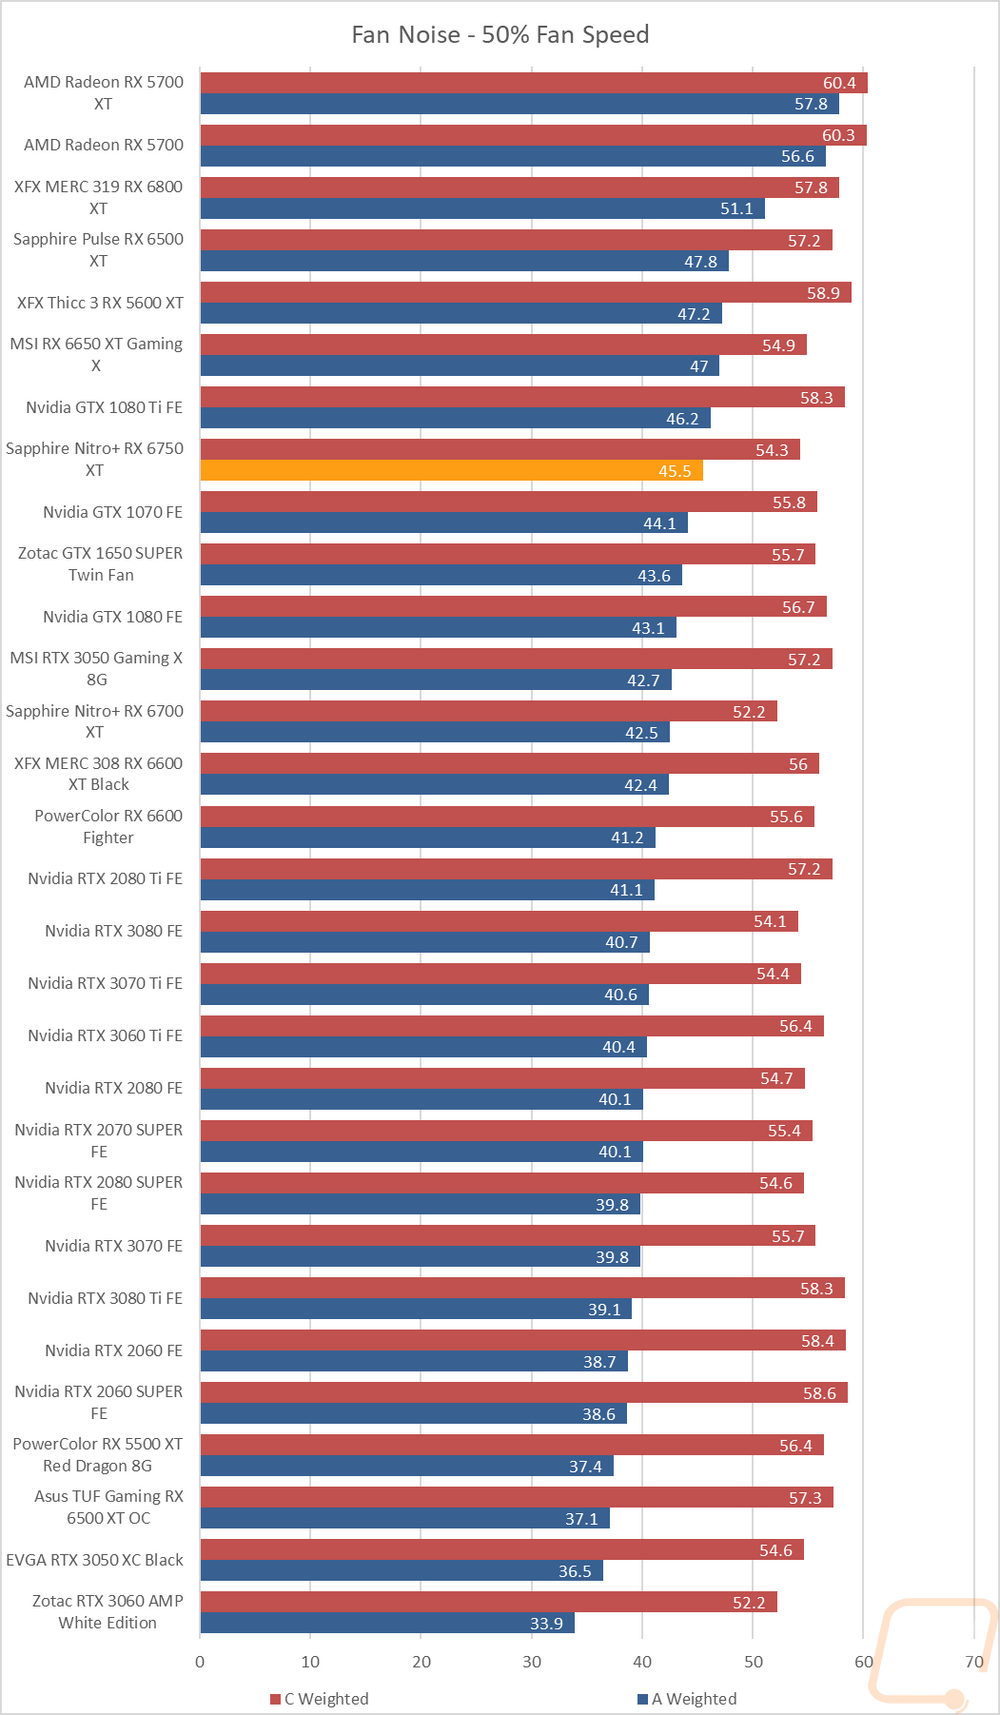
Noise Testing |
Our Noise testing is done using a decibel meter 18 inches away from the video card on the bottom/fan side of the card. We test at 50% and 100% fan speeds as well as a third test while under load using AIDA64's stress test. This is done using a Protmex PT02 Sound Meter that is rated IEC651 type 2 and ANSI S1.4 type 2. Tests are done set weighted to A and set to a slow response using the max function and tested a second time with C weighting as well. The ambient noise level in the testing area is 33.3 decibels using A weight and 50.0 using C weight. |
|
Temperature Testing |
Using AIDA64, the GPU stress test is run for 30 minutes or until the result has leveled off. The test is run twice, once with the stock fan profile and a second time with 100% fan speed. During this, I also document the 100% fan speed RPM and document the delta between the fan profile and 100% fan speed as well. |
Synthetic Benchmarks
As always I like to start my testing with a few synthetic benchmarks. 3DMark especially is one of my favorites because it is very optimized in both Nvidia and AMD drivers. It's nice to not have to worry about it being favored too much either way and the repeatability of the results makes it a nice chance to compare from card to card, especially when comparing with the same GPU. For the Nitro+ RX 6750 XT, I’m curious to see how it compares to the Nitro+ RX 6700 XT that I previously tested, and on the Nvidia side of things the 3070 and the 3060 Ti. AMD’s presentation was comparing the 6750 XT to the 3070 for a lot less. Price wise the base price of the 6750 XT is in the $549 range and our overclocked card is higher but overall they land right in between the 3070 and the 3060 Ti.
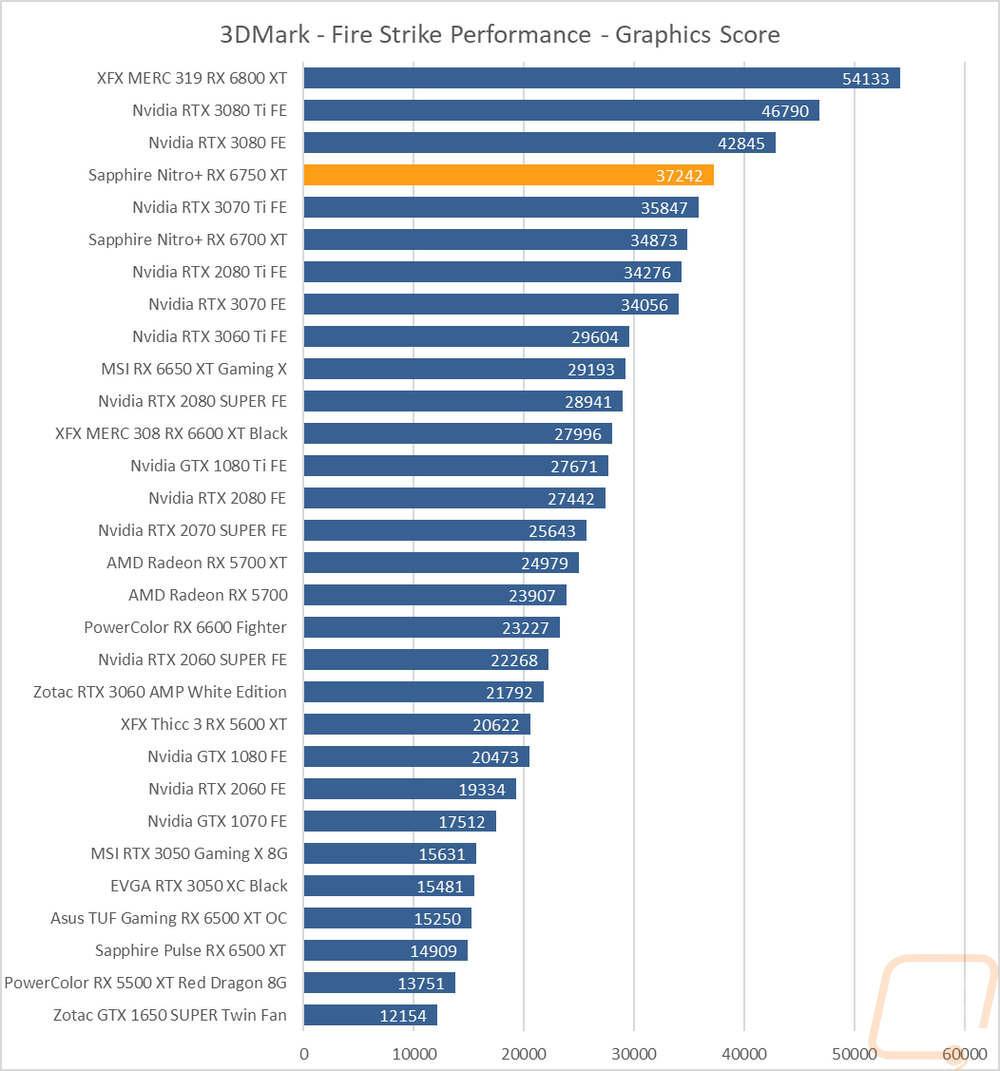
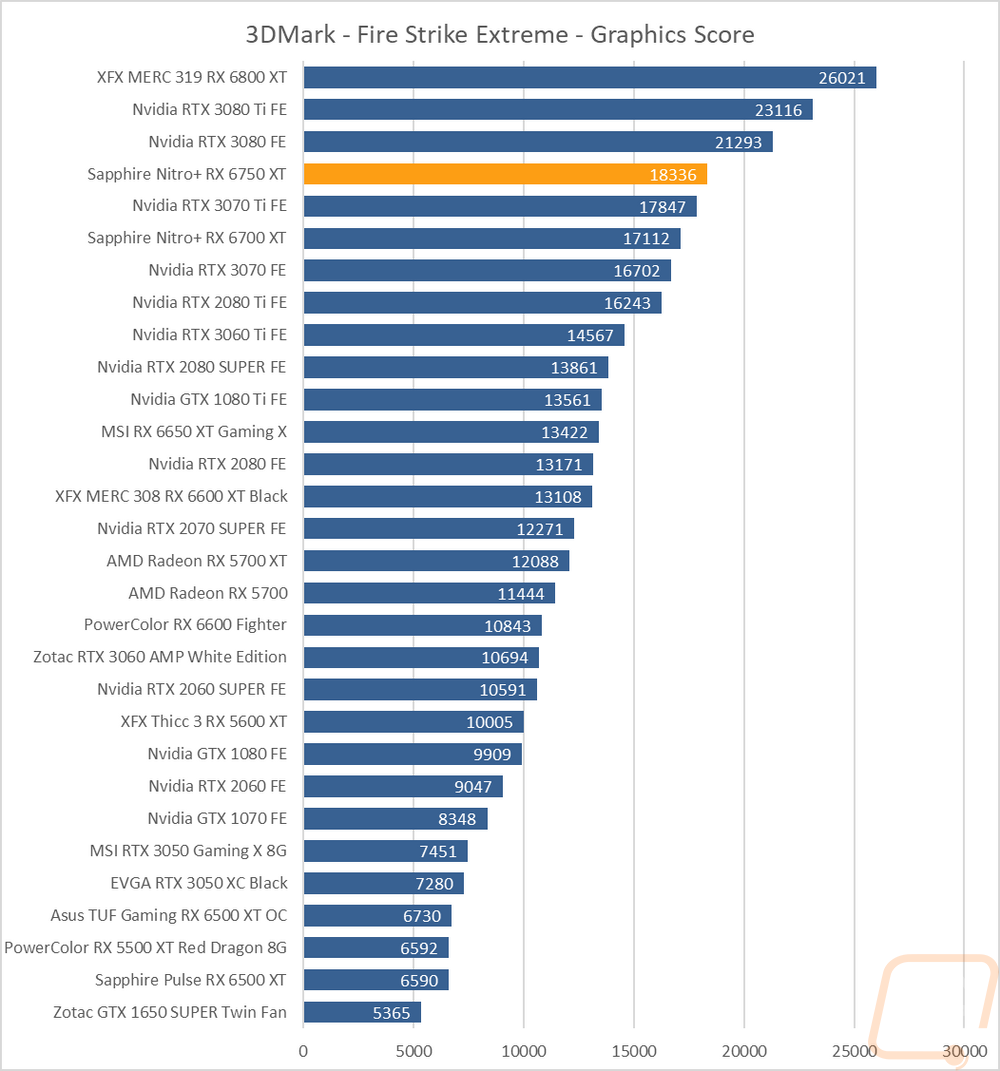
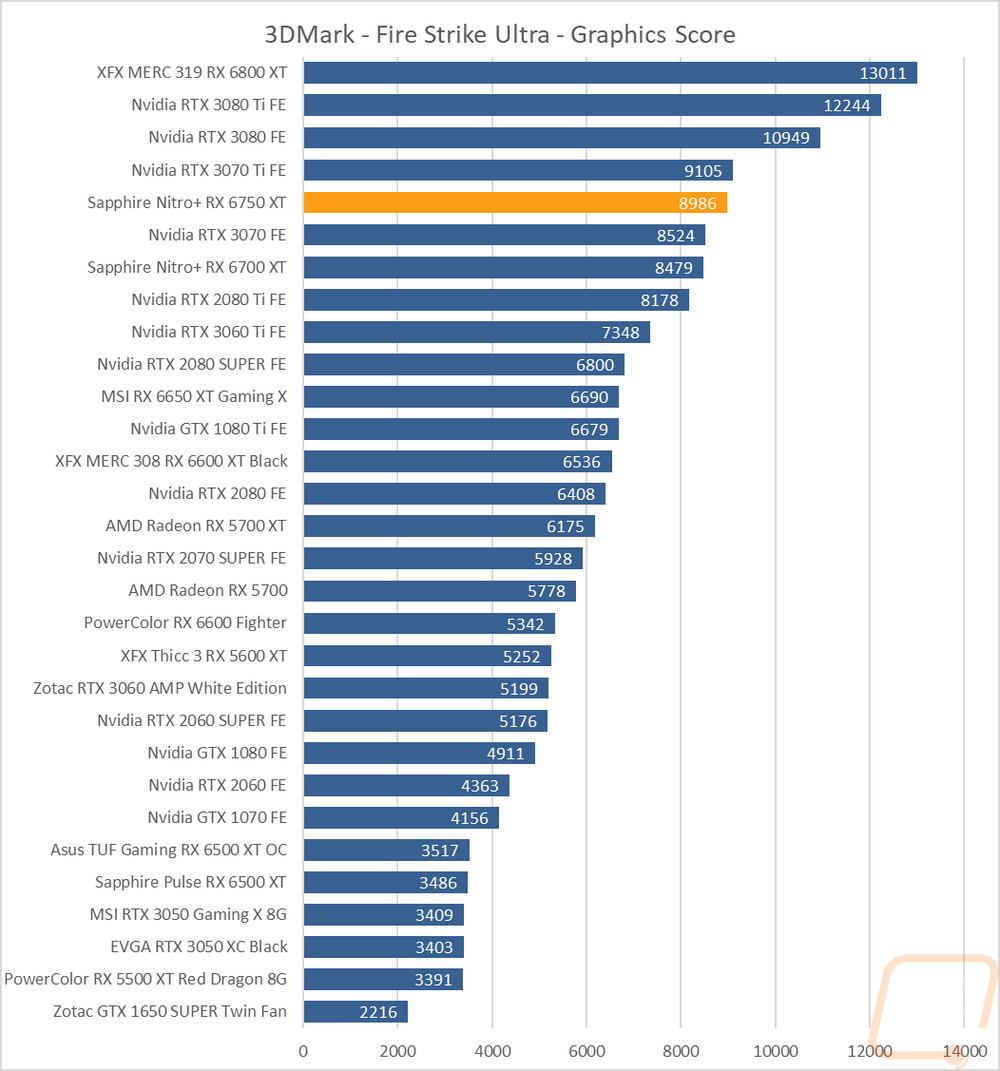
The first round of tests were done in the older Fire Strike benchmark which is a DX11 test. There are three detail levels, performance, extreme, and ultra. The Nitro+ RX 6750 XT did well here coming in ahead of the RTX 3070 Ti with the 6700 XT behind that. The only exception to that was in the ultra detail setting where the 3070 Ti jumped back ahead again.
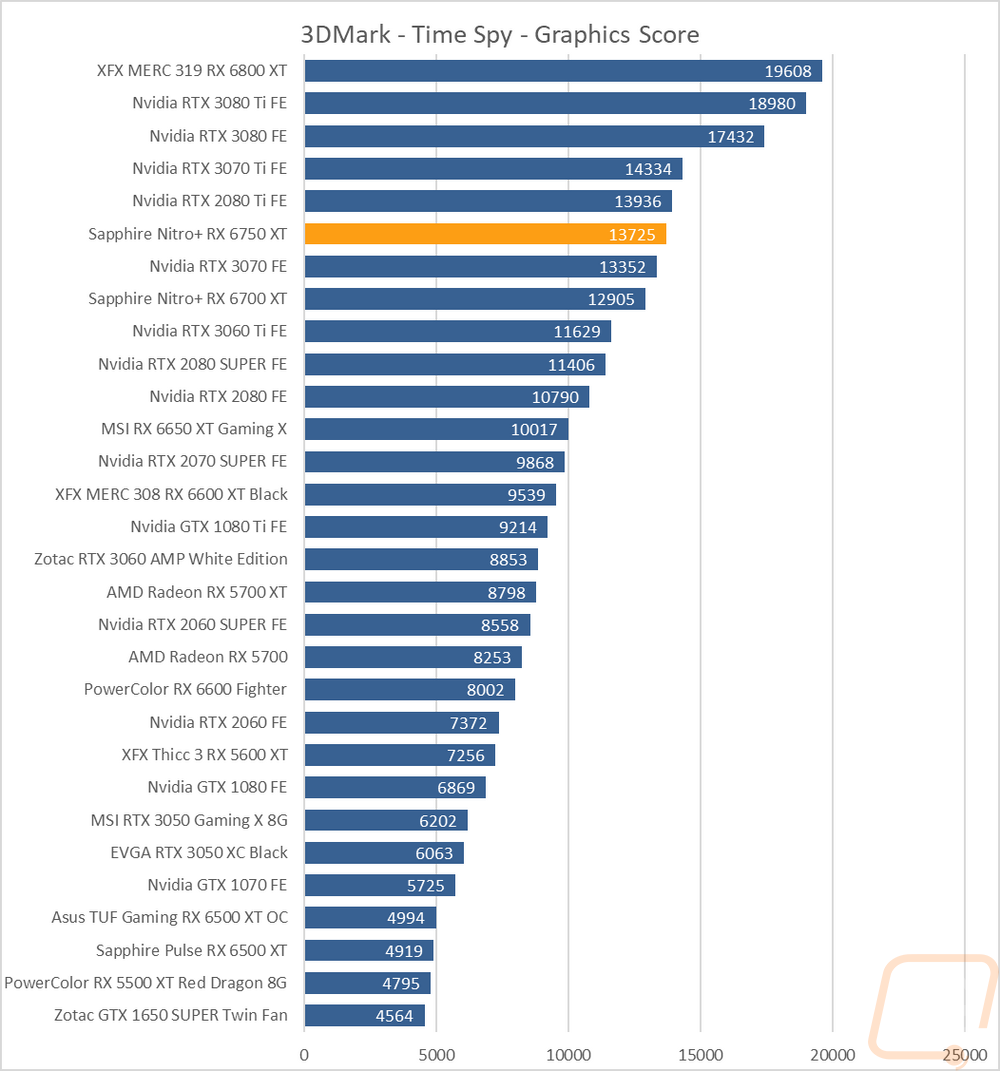
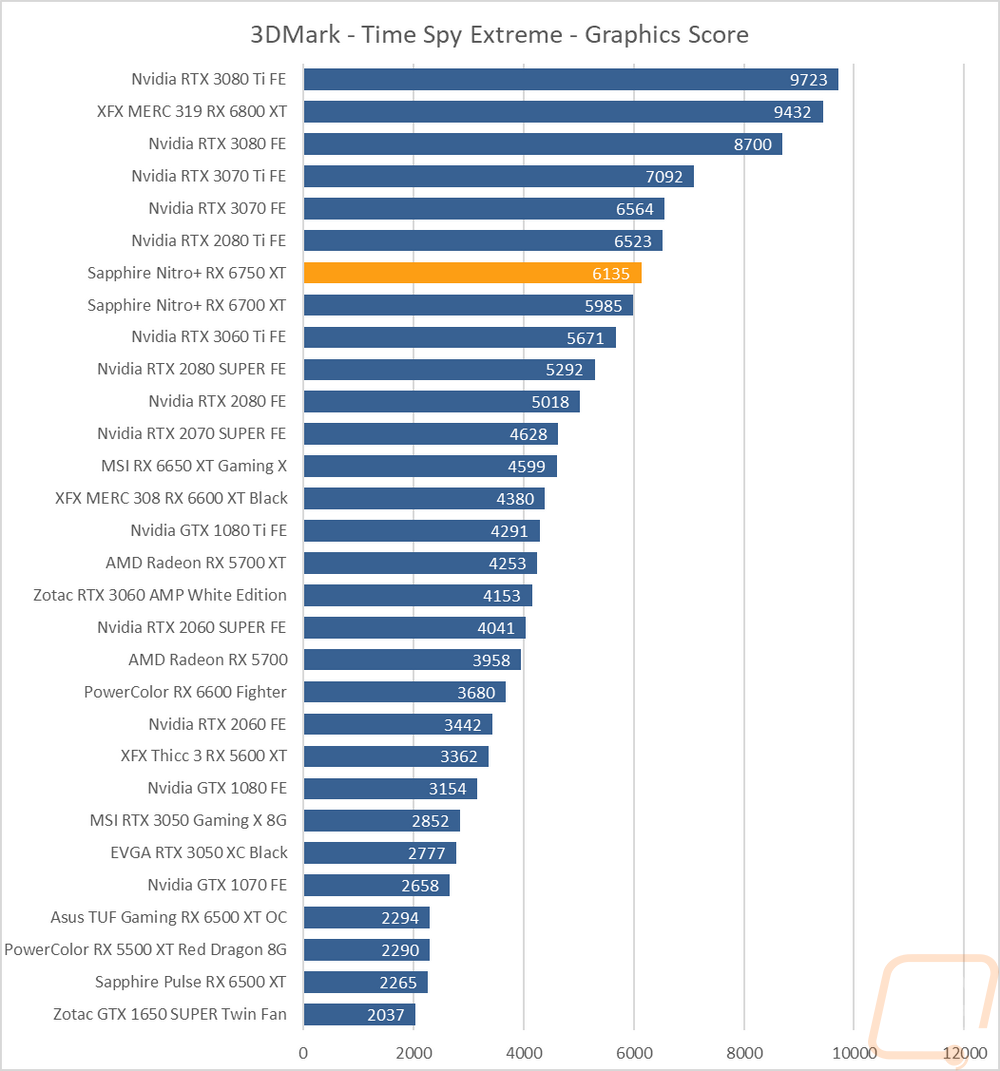
The next two were both based on the Time Spy benchmark. One is the standard test and then there is the extreme detail level. This is a DX12-based test which is a better representation of modern games. For Time Spy the Nitro+ RX 6750 XT outperformed the RTX 3070 with 820 points between it and the Nitro+ RX 6700 XT. With the extreme detail setting the 3070 was way out ahead but both the Nitro+ RX 6750 XT and the 6700 XT are ahead of the 3060 Ti.
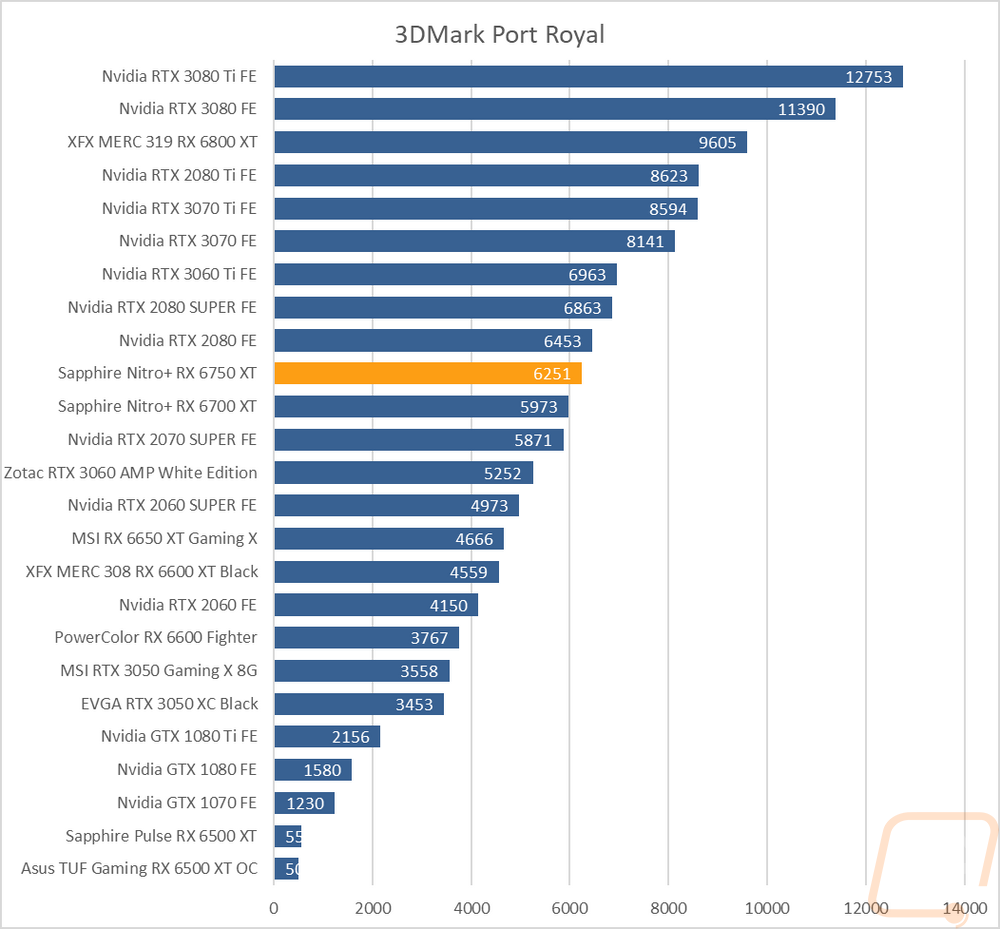
I did also check out ray tracking performance while doing my testing using the 3DMark Port Royal benchmark. The Nitro+ RX 6750 XT is 278 points ahead of the 6700 XT but the 3060 Ti and the 3070 are WAY out ahead of the Nitro+ RX 6750 XT.
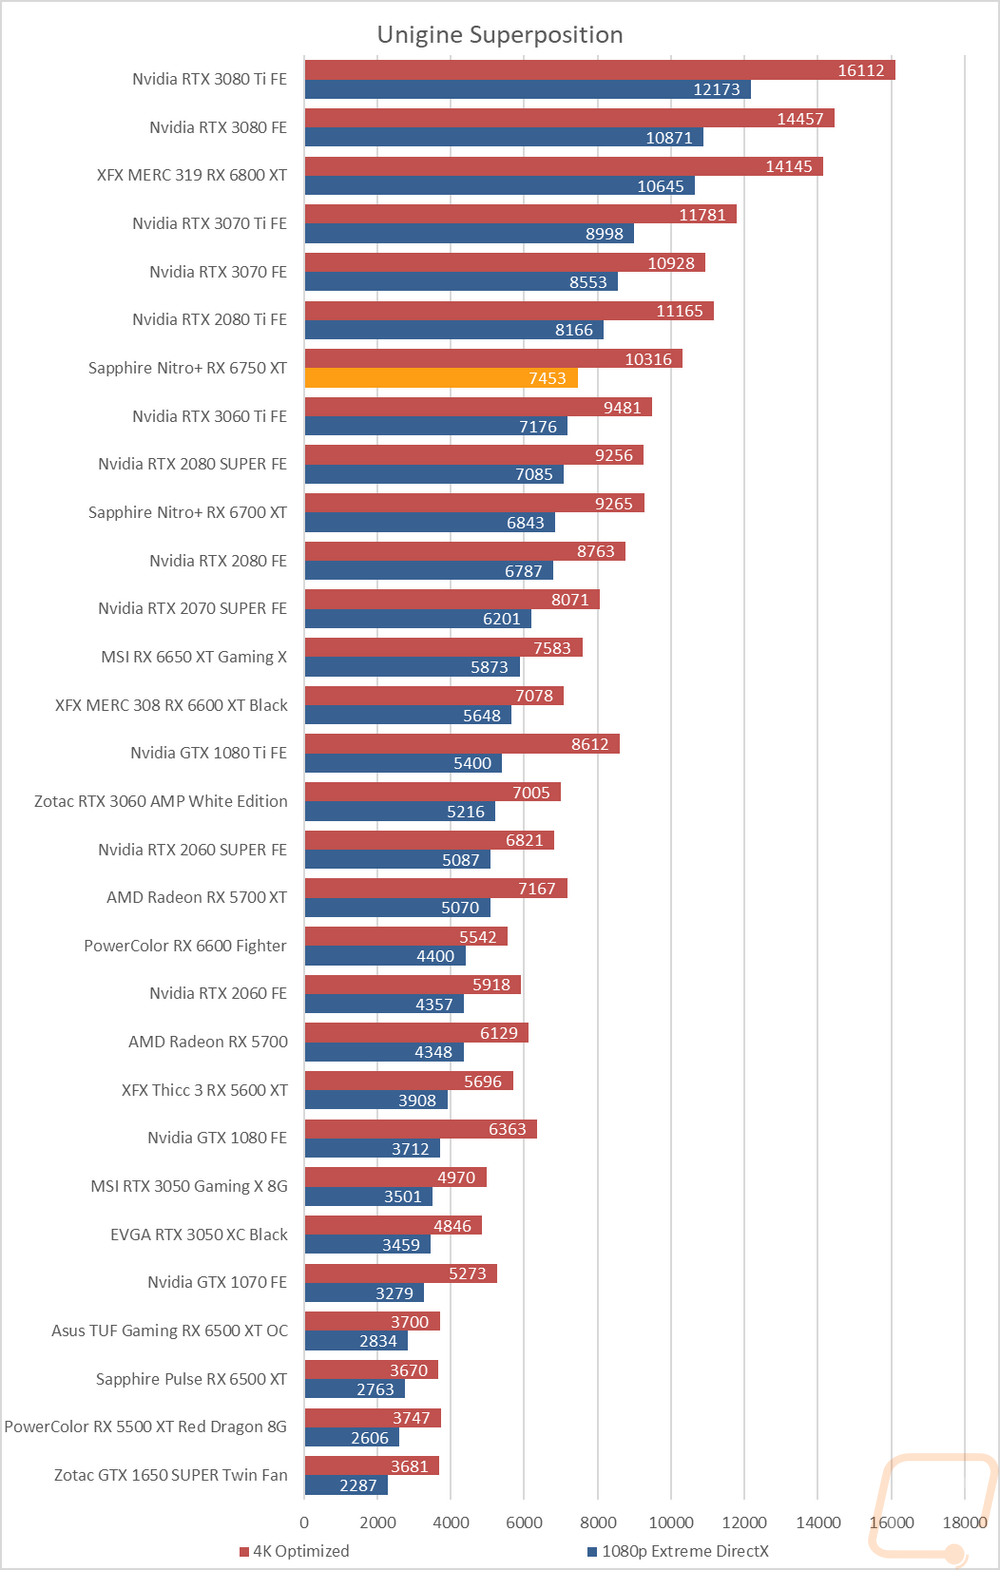
The last test was using the Unigine-based Superposition benchmark and I tested at 1080p with the extreme detail setting as well as the 4K optimized setting. In the extreme detail setting the Nitro+ RX 6750 XT comes in over the 3060 Ti and behind the 2080 Ti. 4K Optimized was similar but the gap between the Nitro+ RX 6750 XT and the Nitro+ RX 6750 XT is a lot bigger in the 4k test.
VR Benchmarks
As for Virtual Reality, I love it but it is more demanding than traditional gaming. This is partially because of the resolutions needed to render for two eyes and because they render more than what is immediately visible. But also because of post effects to get the proper “fisheye” effect for it to look proper in your eyes with the HMD. You also have to have much higher expectations for frame rates in VR, skipping frames or lower FPS can cause motion sickness in VR. Because of that, I ran a few tests.
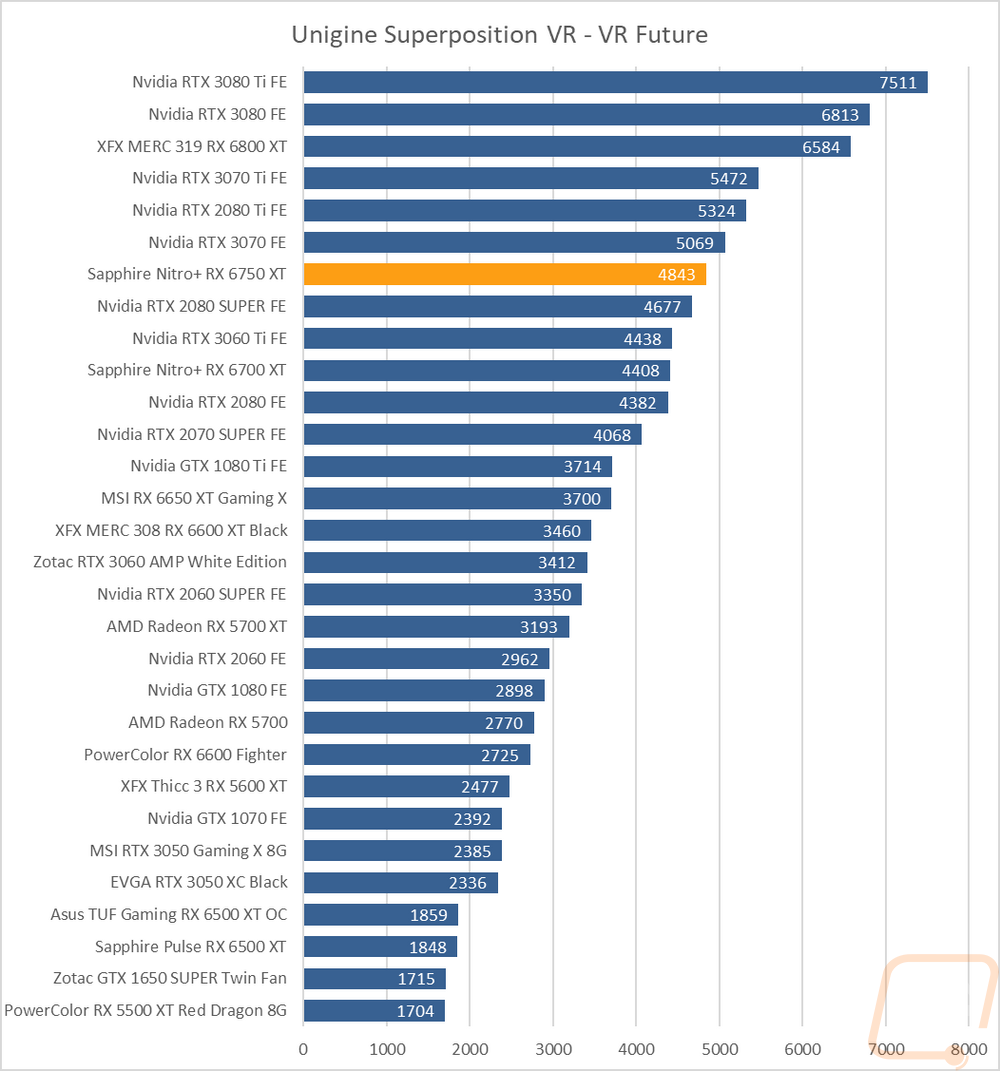
My first test was again in Superposition. This time I tested the VR Future test using the Oculus resolution. Here the Nitro+ RX 6750 XT slots in below the RTX 3070 and above the 3060 Ti and the 2080 SUPER. The Nitro+ RX 6700 XT is back 435 points just behind the 3060 Ti.
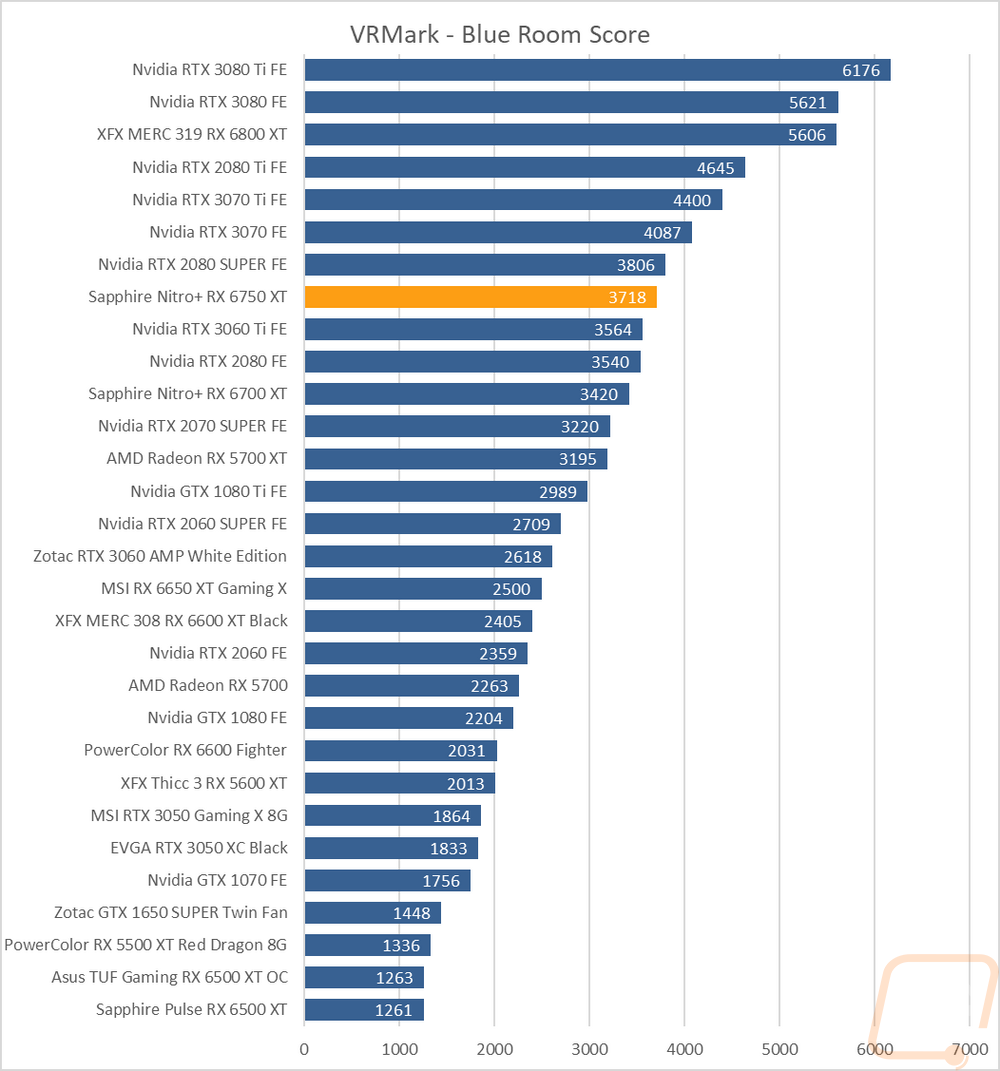
My second round of VR testing was in VRMark which has three tests that are similar to the VR tests in Superposition. I only focused on just the most demanding test called Blue Room that is looking more at future VR performance. The Nitro+ RX 6750 XT is in between the 3060 Ti and the RTX 3070, leaning a little closer on the 3060 Ti side.
In-Game Benchmarks
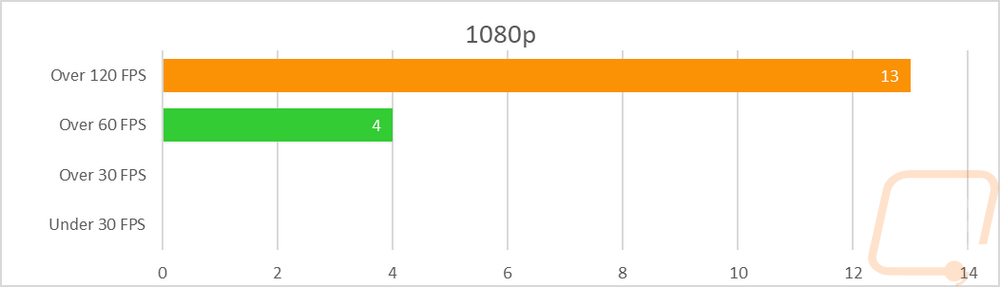
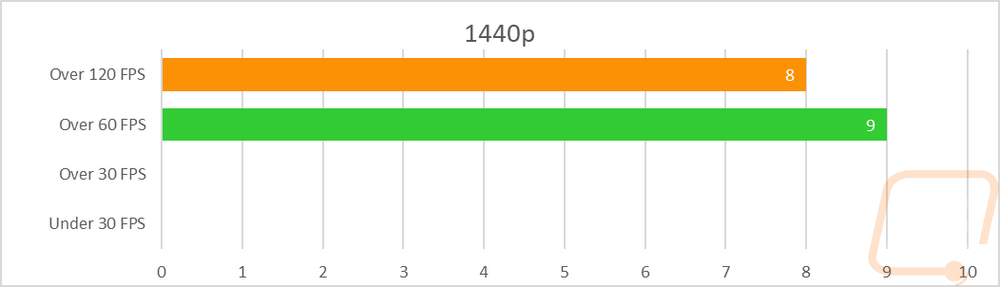
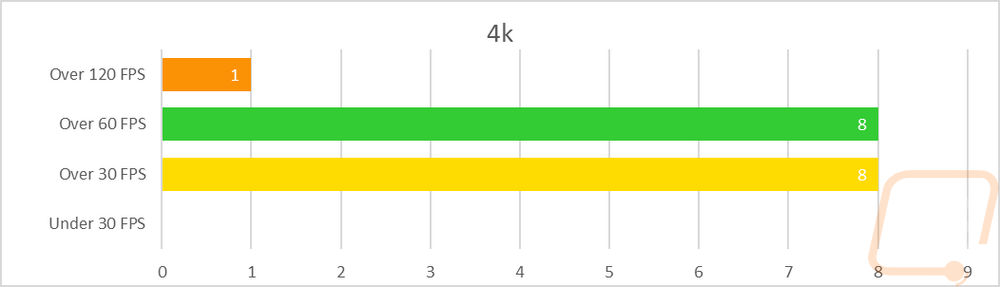
Now we finally get into the in game performance and that is the main reason people pick up a new video card. To test things out I ran through our new benchmark suite that tests 10 games at three different resolutions (1080p, 1440p, and 4k). Most of the games tested have been run at the highest detail setting and a mid-range detail setting to get a look at how turning things up hurts performance and to give an idea of if turning detail down from max will be beneficial for frame rates. In total, each video card is tested 54 times and that makes for a huge mess of results when you put them all together. To help with that I like to start with these overall playability graphs that take all of the results and give an easier-to-read result. I have one for each of the three resolutions and each is broken up into four FPS ranges. Under 30 FPS is considered unplayable, over 30 is playable but not ideal, over 60 is the sweet spot, and then over 120 FPS is for high refresh rate monitors.
So how did the Nitro+ RX 6750 XT do? AMD has this marketed as one of their 1440p focused cards and given the 8 results at over 120 FPS at 1440p and the other 9 are over 60 FPS I would agree. At 1080p it does even better of course with 13 over 120 FPS and 4 in the 60-119 range. As for 4K, the Nitro+ RX 6750 XT can handle it but does struggle. CS:GO as always is above 120 but beyond that half of the other results are over 60 FPS and the other half are playable but less smooth in that 30-59 FPS range.
Of course, I have all of the actual in game results as well for anyone who wants to sort through the wall of graphs below. I also have averaged out all of the results from the 6700 XT, 6750 XT, 3060 Ti, and the 3070. Keep in mind that the Nitro+ RX 6750 XT and Nitro+ RX 6700 XT are both aftermarket cards whereas the other two are Founders Edition cards. But it does put the overall results into perspective. The increase in clock speed for the Nitro+ RX 6750 XT was enough to push up past the 3060 Ti on all of the results but does still come in behind the RTX 3070, especially at 4K resolutions.
|
|
1080p |
1440p |
4K |
|
Nitro+ RX 6700 XT |
164.59 |
127.17 |
72.93 |
|
RTX 3060 Ti FE |
166.19 |
125.22 |
69.99 |
|
Nitro+ RX 6750 XT |
172.24 |
135.76 |
77.44 |
|
RTX 3070 FE |
182.96 |
140.14 |
90.53 |
Compute Benchmarks
Now some people don’t need a video card for gaming, they need the processing power for rendering or 2D/3D production, or in some cases people who game also do work on the side. So it is also important to check out the compute performance on all of the video cards that come in. That includes doing a few different tests. My first test was a simple GPU Compute benchmark using Passmark’s Performance Test 10 and the Nitro+ RX 6750 XT came in just a touch above the RTX 3060 Ti and with the 3070 still way out in front. The 6700 XT is 926 points back putting it behind the 3060 Ti and the 2080 Ti.
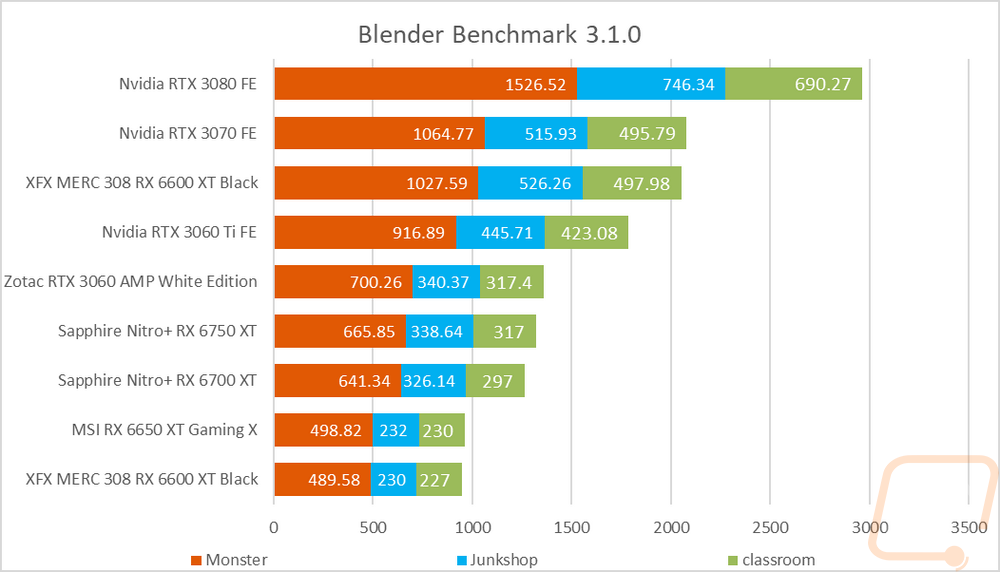
Blender is always my favorite compute benchmark because the open-source 3D rendering software is very popular and it isn’t a synthetic benchmark. With the latest version of Blender, they redid the benchmark so we now have a new test that runs three different renderings and gives each a score. I have all three stacked together so we can see the overall performance. The Nitro+ RX 6750 XT shows a decent improvement over the 6700 XT, especially when compared to the difference between the 6600 XT and the 6650 XT but it wasn’t enough to push it up past the RTX 3060 here, however.
Cooling Noise and Power
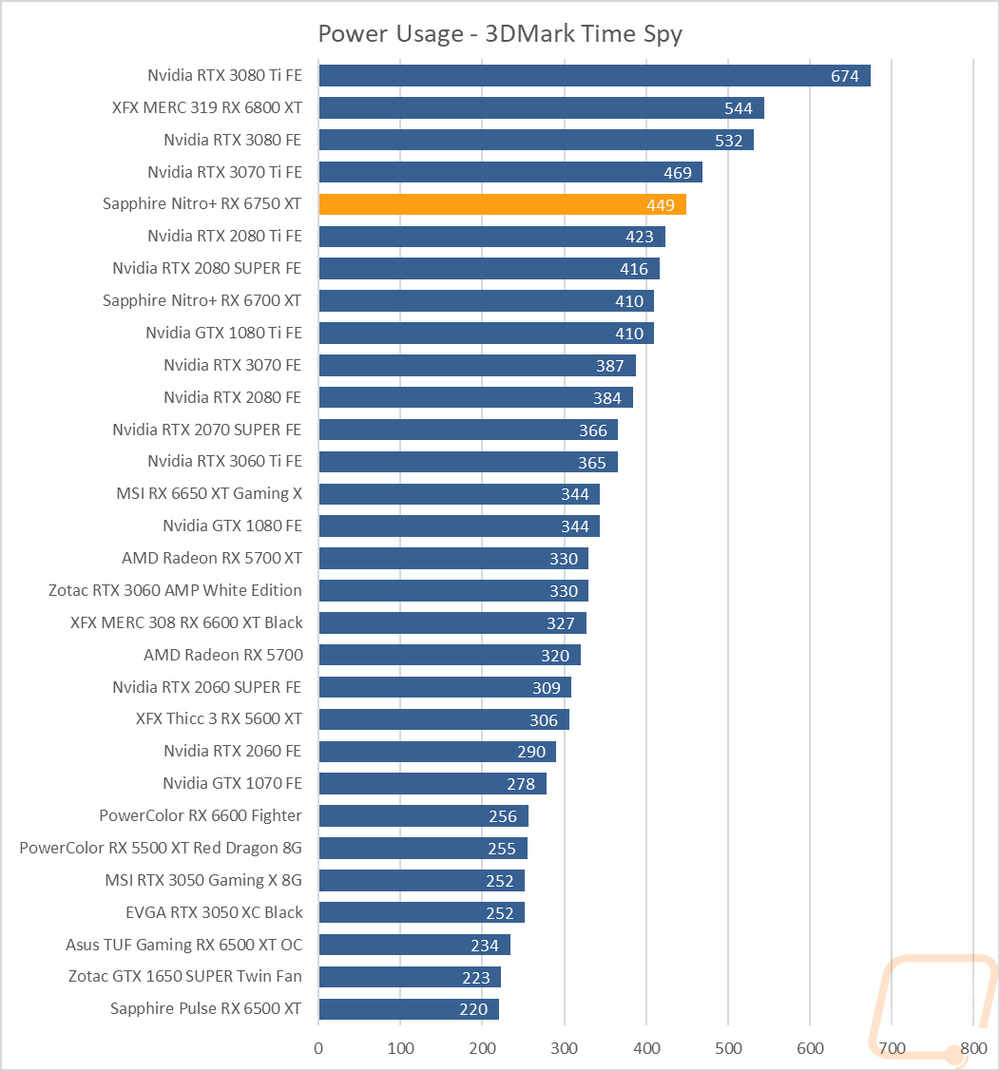
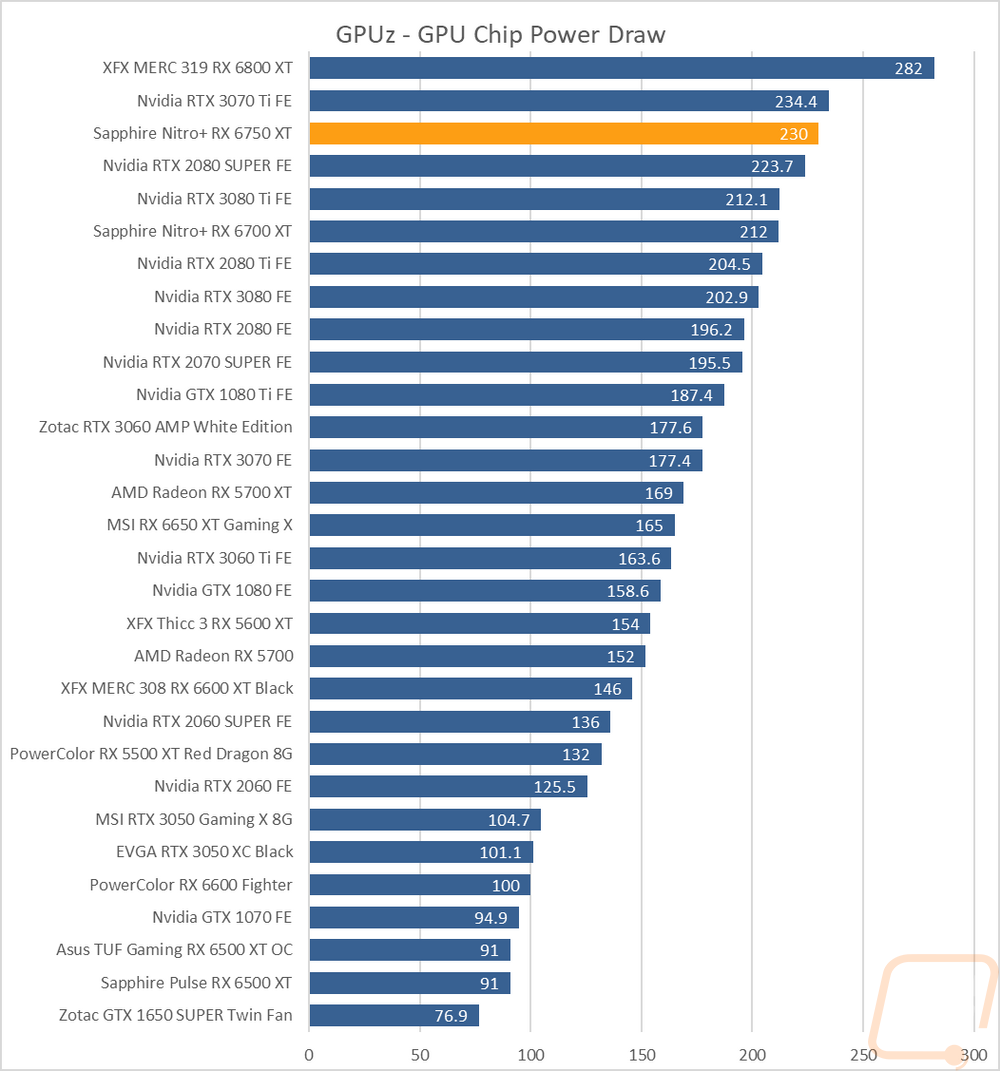
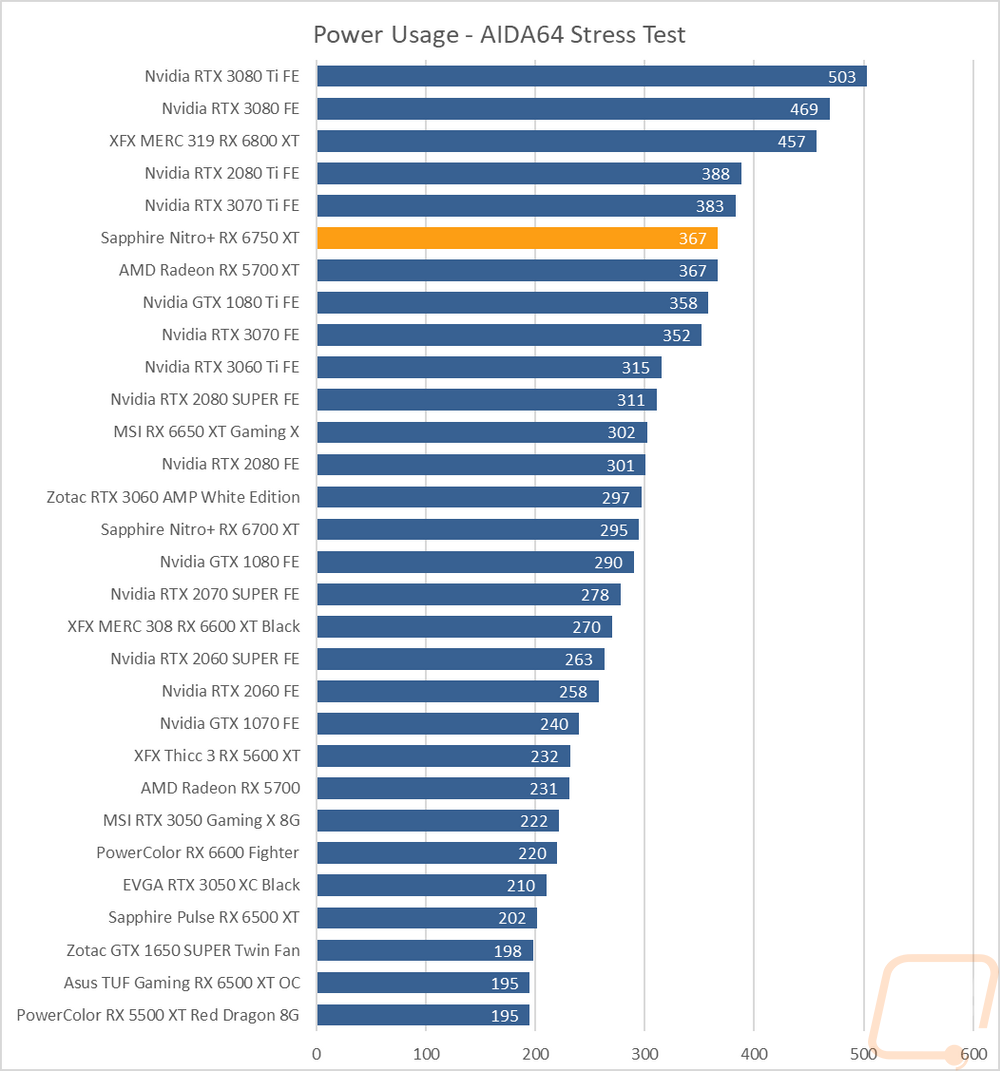
For my last few tests, rather than focusing on in game performance, I like to check out other aspects of video card performance. These are also the most important ways to differentiate the performance between cards that have the same GPU. To start things off I took a look at power usage. For this, I use our Kill-A-Watt hooked up to the test bench to record the total wattage of the system. I ran two tests with the first using 3DMark Time Spy to put the system under a load similar to normal in game performance. Here our test system with the Nitro+ RX 6750 XT pulled 449 watts which was 39 watts over the 6700 XT, for comparison the 3070 is 62 watts below that and the 3060 Ti was 84. At the same time with Time Spy I also use GPUz to check out the onboard reading for GPU power draw at the chip. The Nitro+ RX 6750 XT pulled 230 watts which was exactly what Sapphire's documentation had for the overclocked card, the Nitro+ 6700 XT was at 212 so the gap between the two cards isn’t that far here. Lastly, I run AIDA64’s stress test on the video card to load up only the GPU, and using the Kill-A-Watt our test bench with the Nitro+ RX 6750 XT pulled 367 watts matching the 5700 XT.
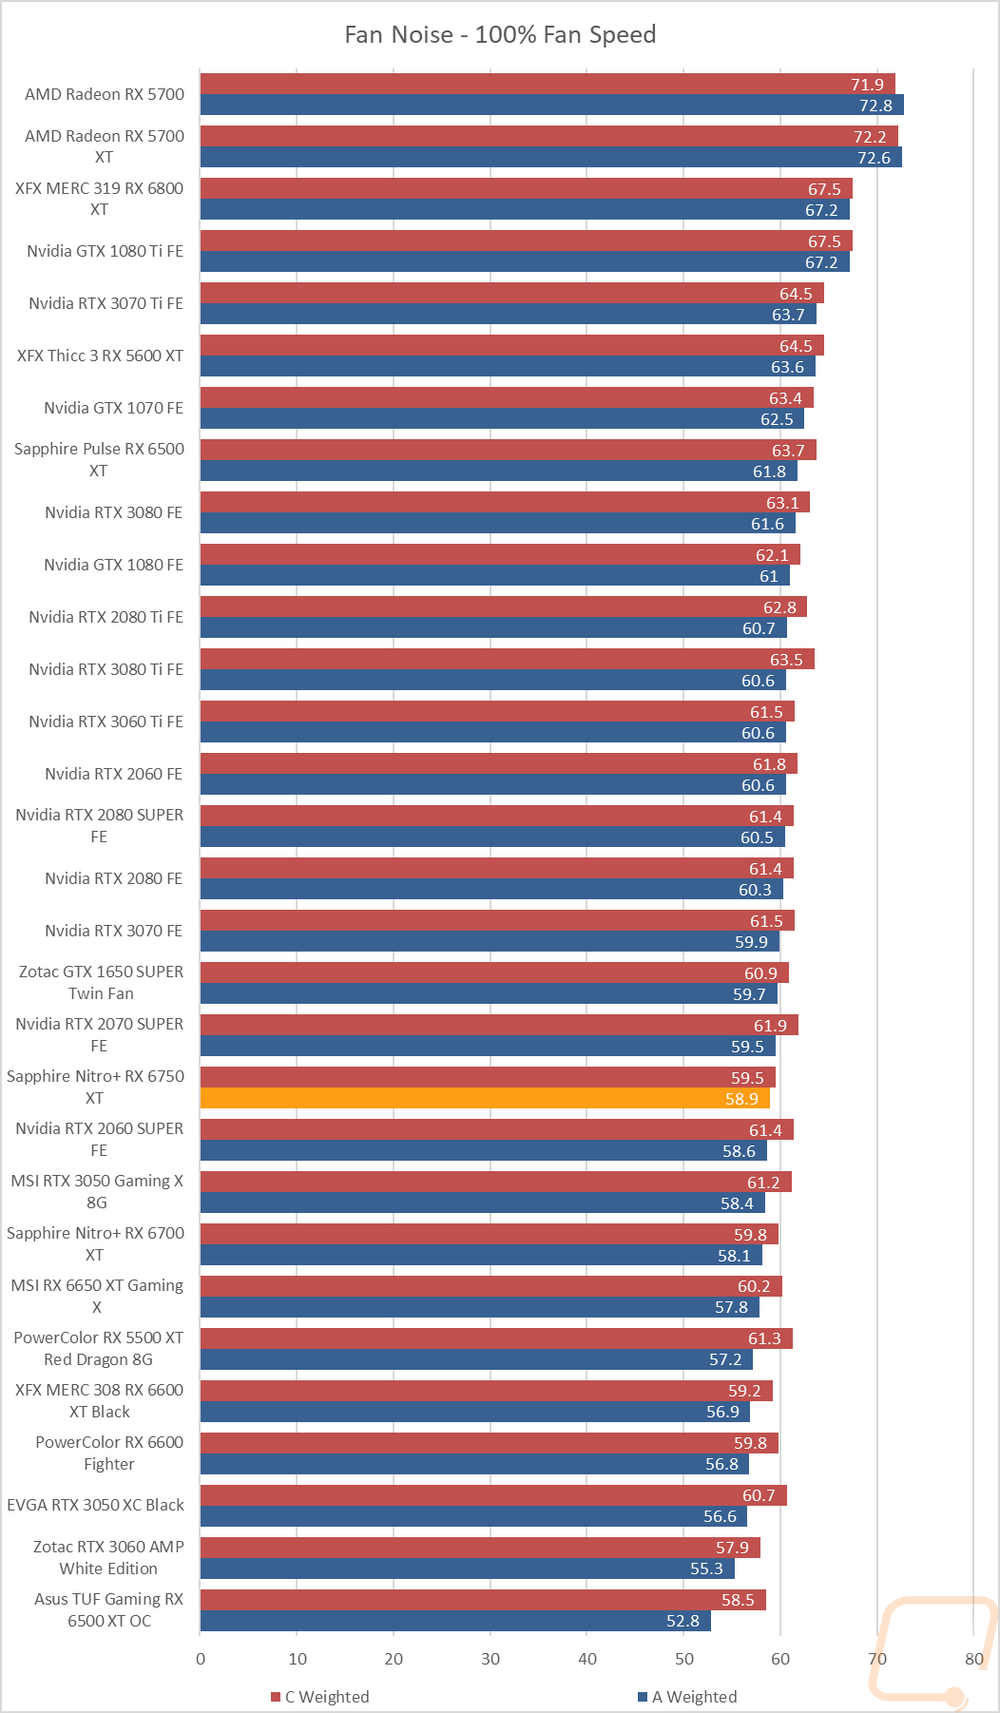
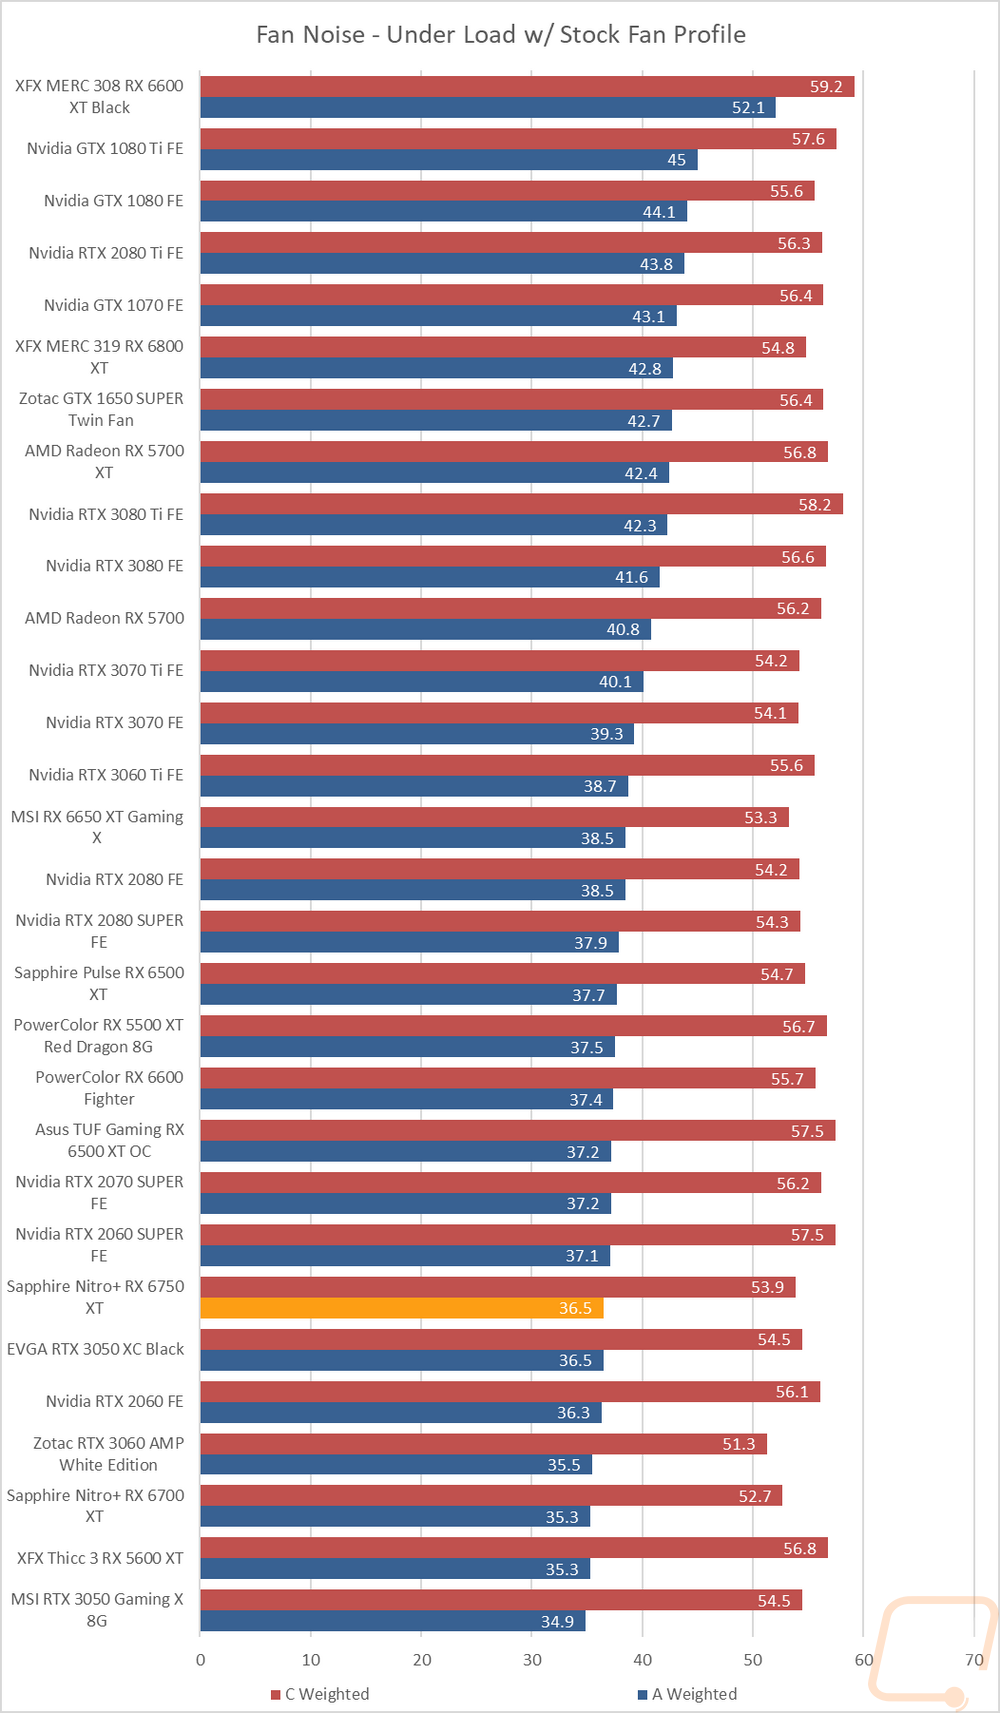
My next round of tests were looking at noise levels. These are especially important to me because I can’t stand to listen to my PC whirling. Especially when I’m not in game and other applications are using the GPU. For my testing, though I first tested with the fan cranked up to 100% to get an idea of how loud it can get, then again at 50% to get an idea of its range. I test using both A and C weighting, A is the standard way and C has a little more of the low end to check for low-level hums. The Nitro+ RX 6750 XT did well at 100% fan speed, even with it having three fans. This was just hair over the Nitro+ 6700 XT on the A-weighted but was lower on the C weighted with the new fan design being the difference between the two. At 50% fan speed, it was farther up in the charts for the A-weighted but did well on C-weighted again. I also take a look at noise performance while under load. For that when running AIDA64’s stress test I wait until the temperature of the card has leveled off and then measure how loud things are when the card is at its worst-case scenario with the stock fan profile. Here the Nitro+ RX 6750 XT did especially well and frankly, this is the only noise that you should worry about.
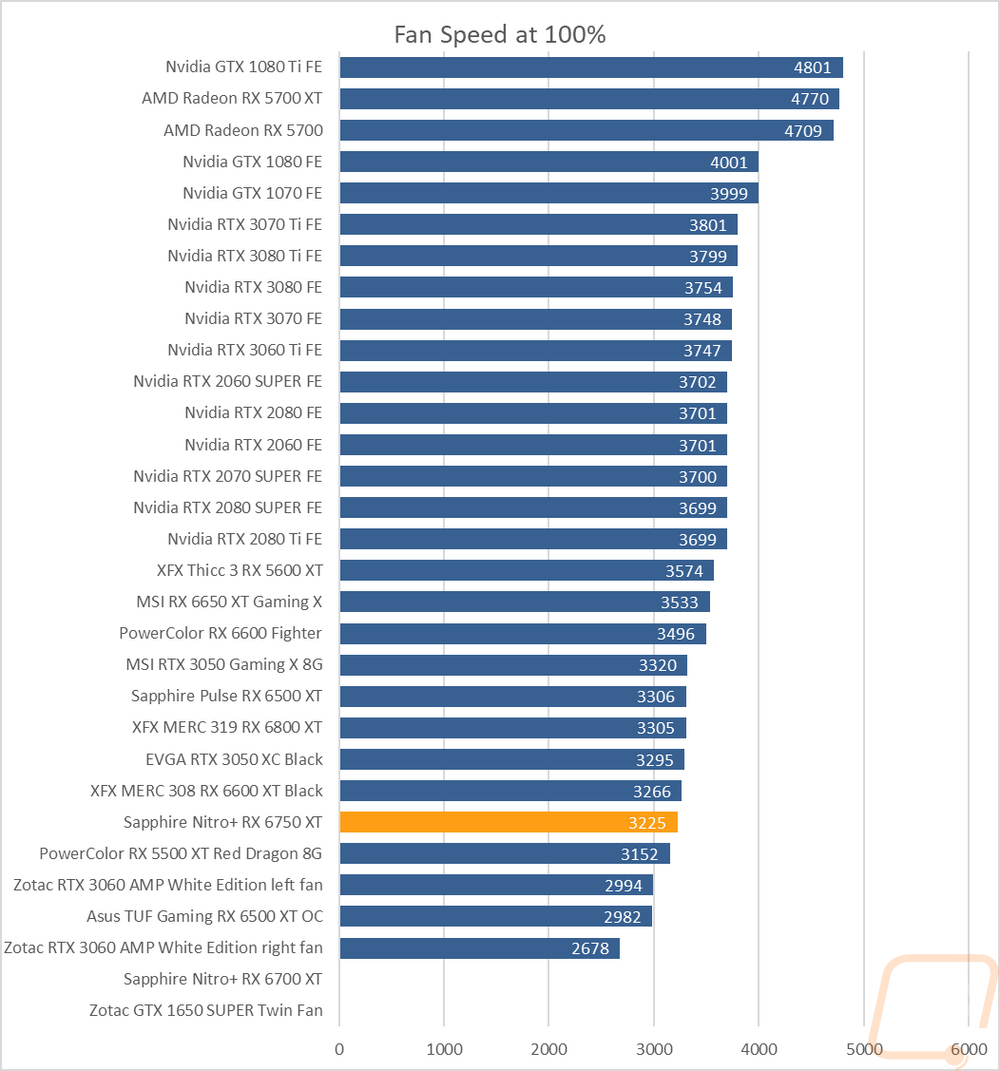
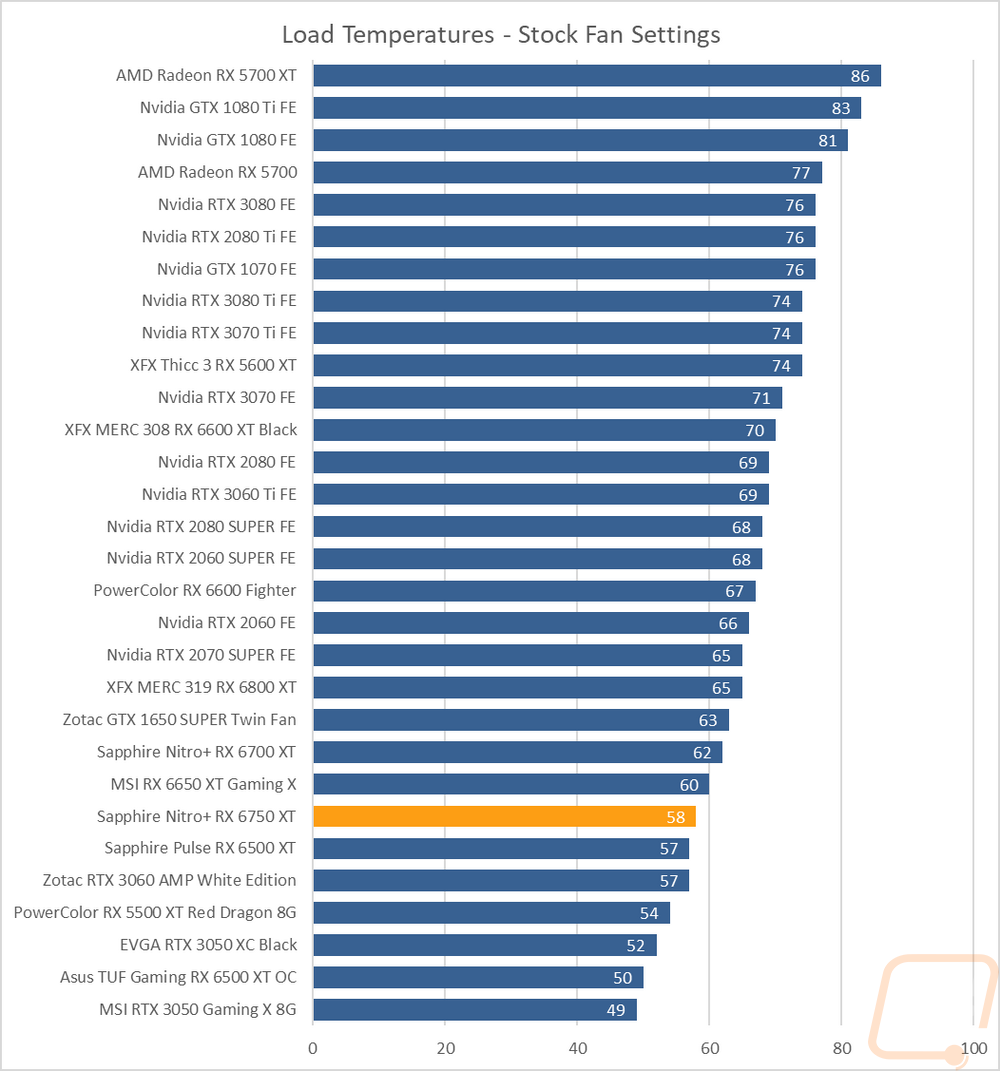
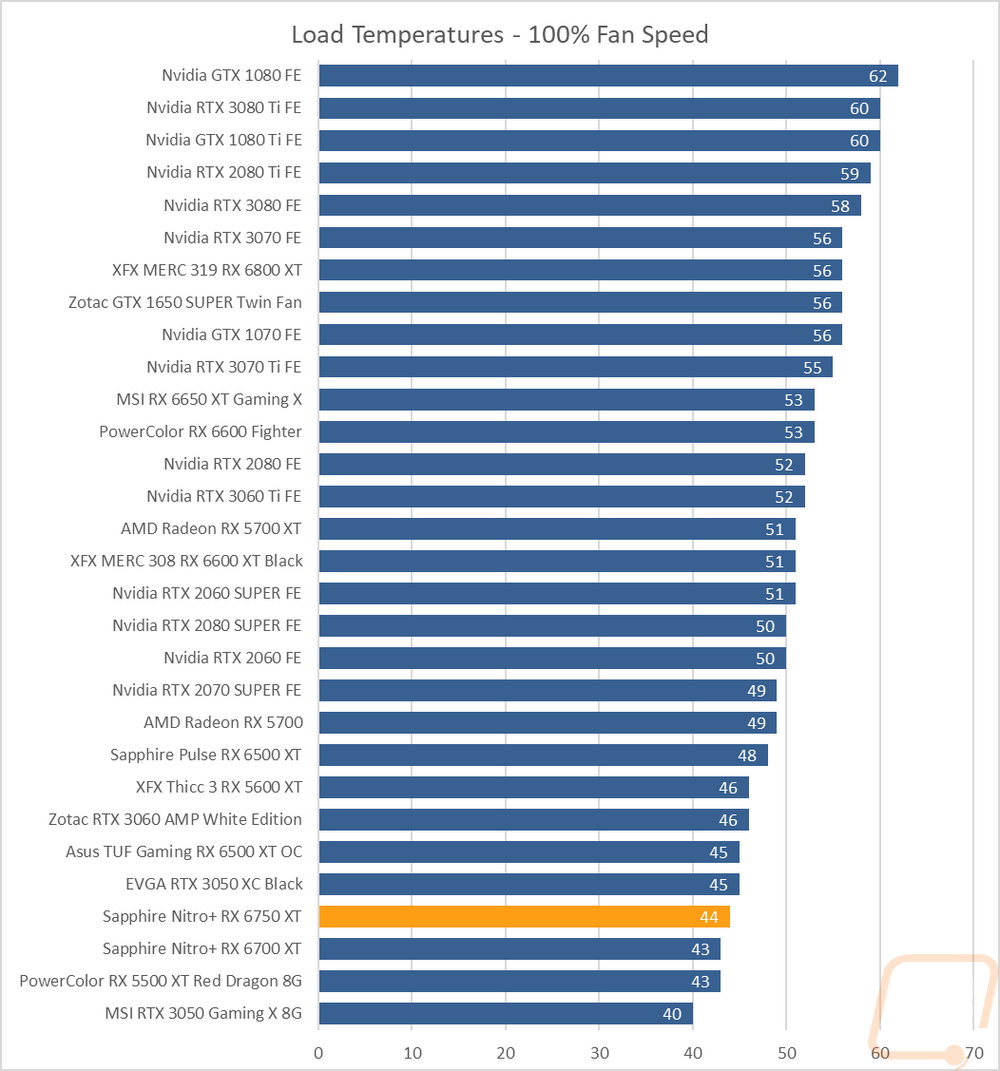
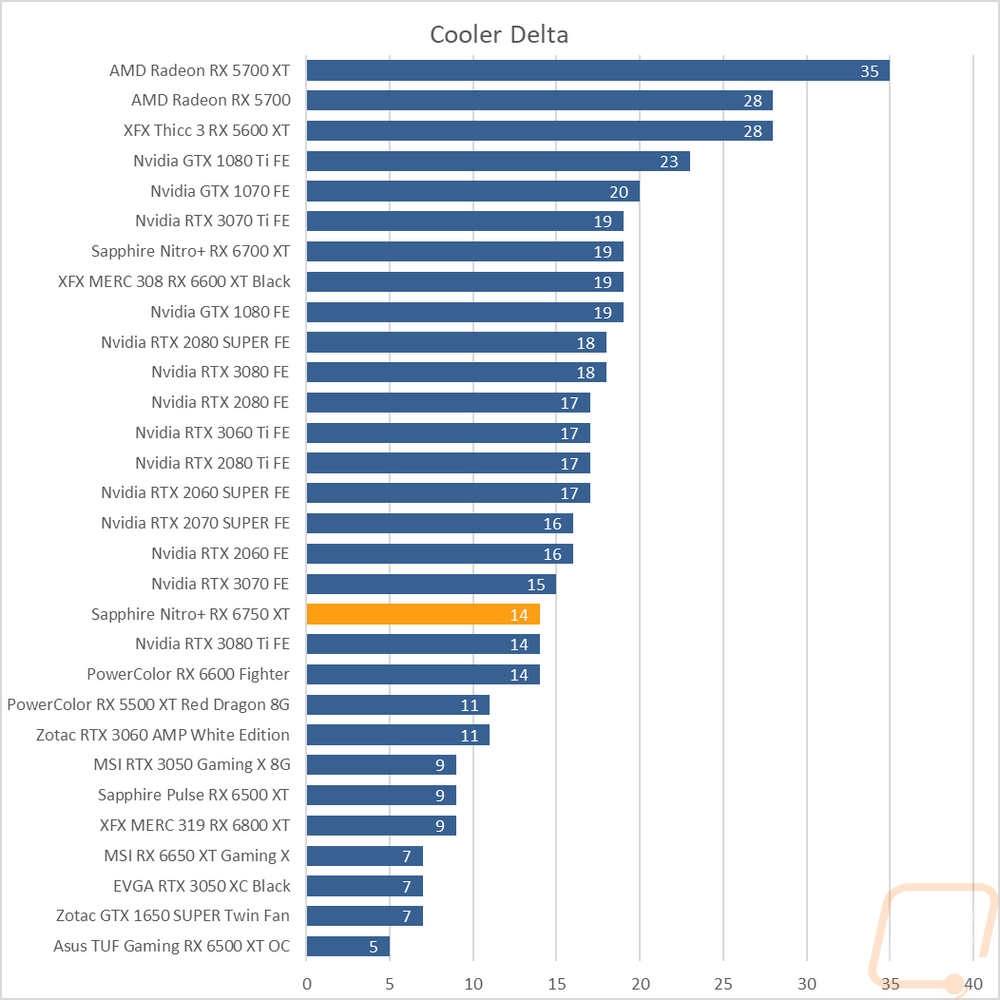
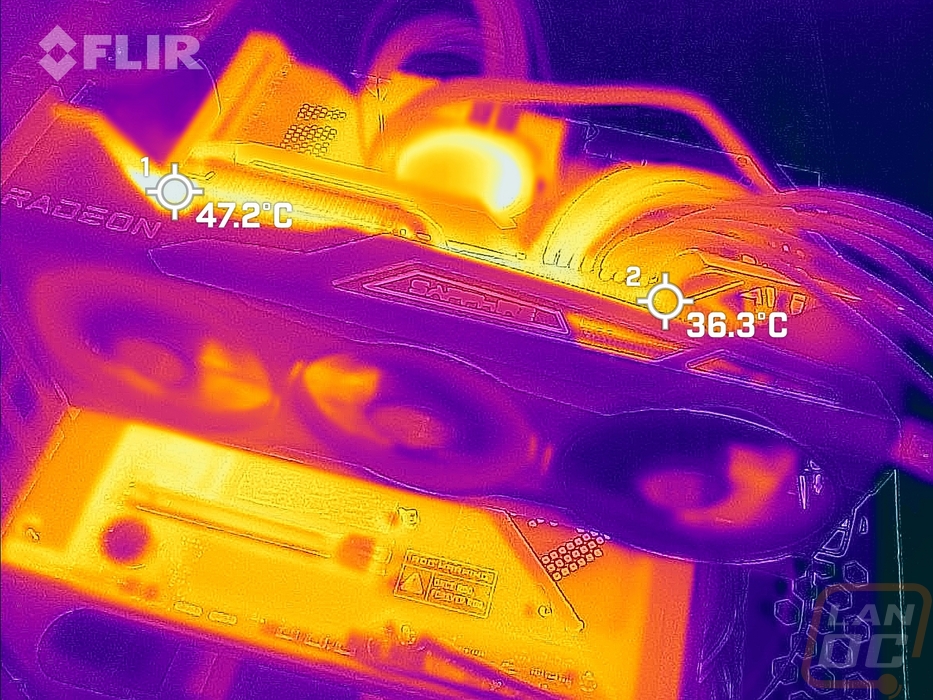
To finish up my testing I of course had to check out the cooling performance. To do this I ran two different tests. I used AIDA64’s Stress Test run for a half-hour each to warm things up. Then I documented what temperature the GPU leveled out at with the stock fan profile and then again with the fans cranked up to 100%. With the stock profile, the Nitro+ RX 6750 XT leveled off at 58 degrees which was 4 degrees below the Nitro+ RX 6700 XT. Then with the fans cranked up, the Nitro+ RX 6750 XT managed to drop things more down to 44c which was one degree above the Nitro+ RX 6700 XT for a delta between the two of 14 which is right where it should be. Not too much left on the table but also some headroom if needed. Given the huge cooler, the performance isn’t a big surprise.
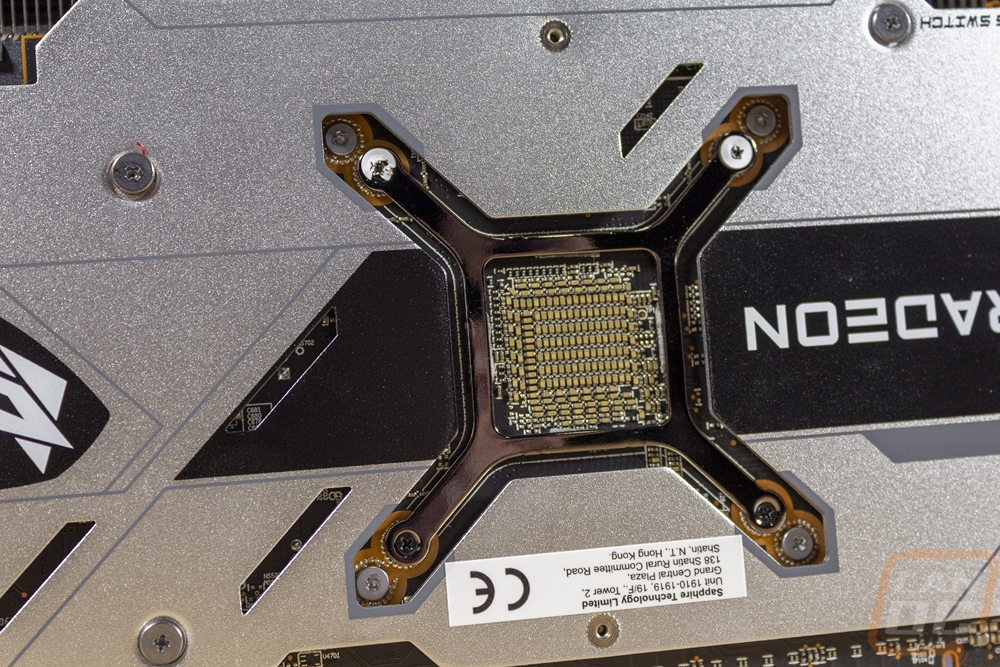
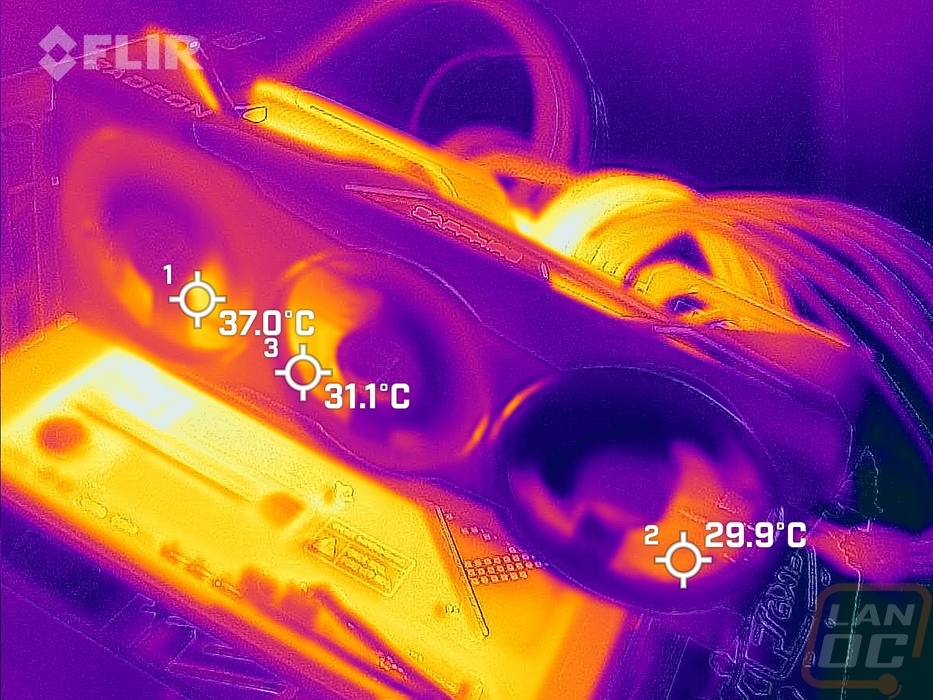
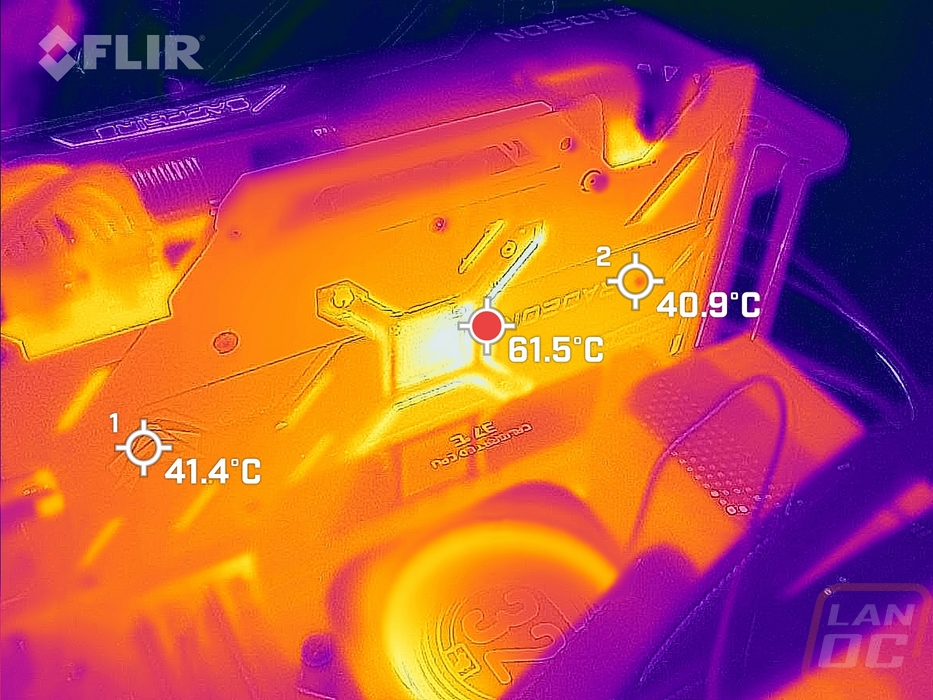
While running the stock fan profile testing I also took the time to get a few thermal images so we could see what is going on. On the fan side of the Nitro+ RX 6750 XT, most of the card is running extremely cool. There is a bit of a heat pocket coming from under the card which given that it blows air out the top and out of the bottom it isn’t a big surprise. Up on the top edge, the hottest area is on the far left where the fan shroud covers up some of the heatsink. For the back of the Nitro+ RX 6750 XT, the exposed PCB behind the GPU is of course the hottest area but it does look like the metal backplate is at least pulling some heat, unlike the plastic backplates that some cards have which are an insulator.
Overall and Final Verdict
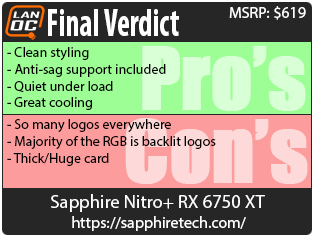
So the point of the new RX 6750 XT is to fill in a gap in the product lineup and to give a small bump in performance to cement the 6750 XT up above the RTX 3060 Ti and when it comes to gaming the Nitro+ RX 6750 XT does exactly that. There were a few exceptions like in compute performance and ray tracing, but I am liking where the Nitro+ RX 6750 XT sits performance-wise. You can throw anything you want at it at 1440p and expect it to perform well and when I averaged out the gaming results it fits in between the 3060 Ti and the 3070, leaning more towards the more expensive 3070. While 1080p is still the most popular resolution on the Steam surveys, 1440p has been growing in popularity and is still a nice sweet spot where you don’t have to throw down big money to get top level 4k gaming performance.
Sapphire did a great job with its update on the Nitro+ RX 6750 XT as well. It’s clear that with the higher clock speed they didn’t want to worry about things getting hot so the new card is larger than the Nitro+ RX 6700 XT that came before it. This helped a lot in our cooling performance testing and with that when running the stock fan profile the noise levels while under load were good as well. That’s even without the included “silent” BIOS on the BIOS switch that drops down to stock 6750 XT speeds. I like the styling of the card, Sapphire isn’t going too overboard with the “gamer” styling, the Nitro+ RX 6750 XT has a much cleaner look without being too bland. My biggest complaint there is that they have loaded the card up with their branding everywhere you look, every angle seems to have it not to mention the RGB lighting which lights up their logos on the top edge and the backplate. I completely understand why they want to get their branding out there, but I also don’t like my PC looking like times square.
The Nitro+ RX 6750 XT comes with an anti-sag bracket which is a nice addition and given the size of the card it could be necessary. They also have details like their easy to swap fans that can help cut down RMA costs and times for both the customer and Sapphire. Sapphire also slipped in an addressable RGB header on the back of the card for those who might need it.
As far as pricing goes, the RX 6750 XT according to AMD will start at $549 and the Nitro+ RX 6750 XT from Sapphire is set to have an MSRP of $619. When we go back to the performance numbers, the Nitro+ RX 6750 XT was running above the RTX 3060 Ti and behind the RTX 3070. The RTX 3060 Ti starts at $580 right now on Newegg and the RTX 3070 starts at $730 so the $619 price point is looking good in that comparison and any budget 6750 XT’s if they do end up at $549 are going to blow the RTX 3060 Ti pricing out of the water given the performance. AMD is also announcing their new “AMD RADEON RAISE THE GAME Bundle” which is going to bundle Saints Row and or other games to be announced later with their RX 6000 series of cards. Getting a card at or after the launch will get you the code, but it won't be redeemable until later which is when we will find out more about the games. Either way, the 6750 XT and the Nitro+ RX 6750 XT are looking like a great value even before any free games.

Live Pricing: HERE


