Cooling Noise and Power
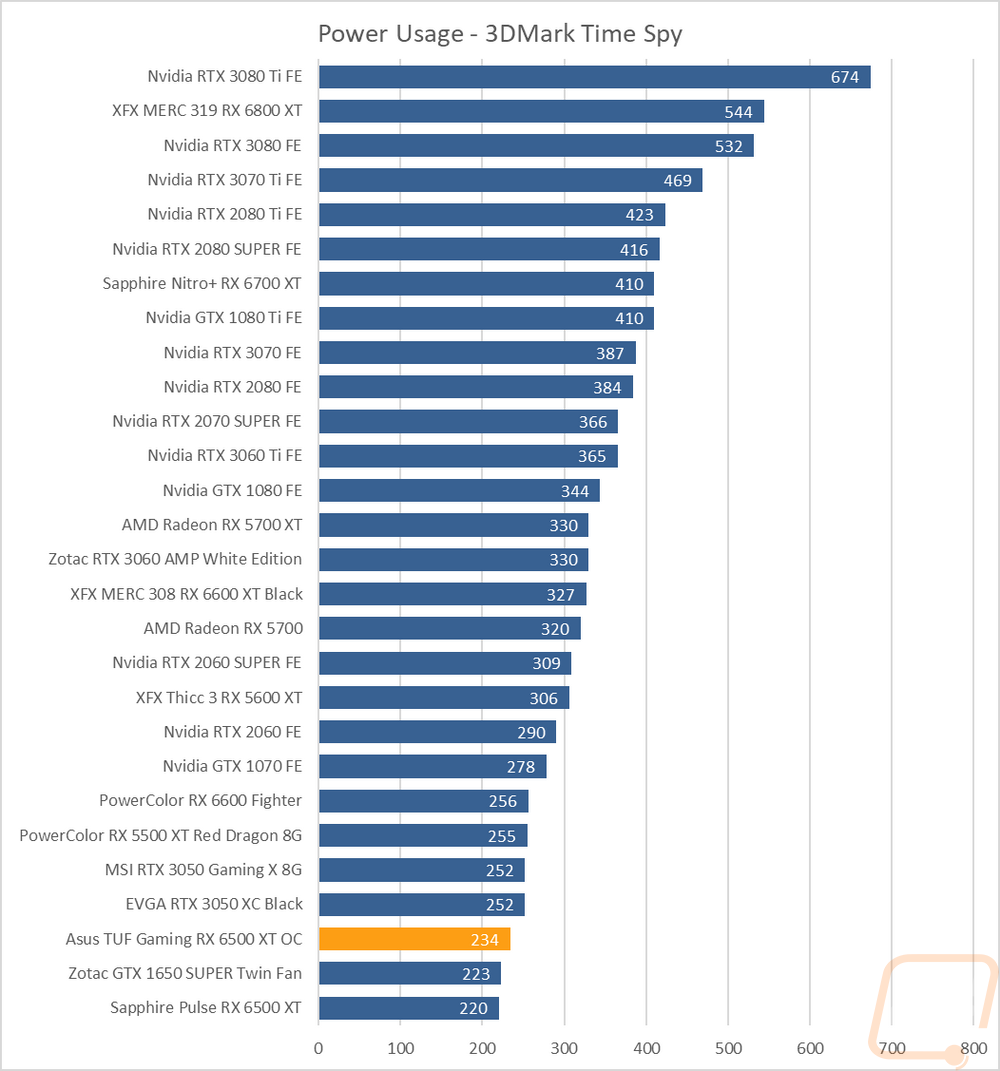
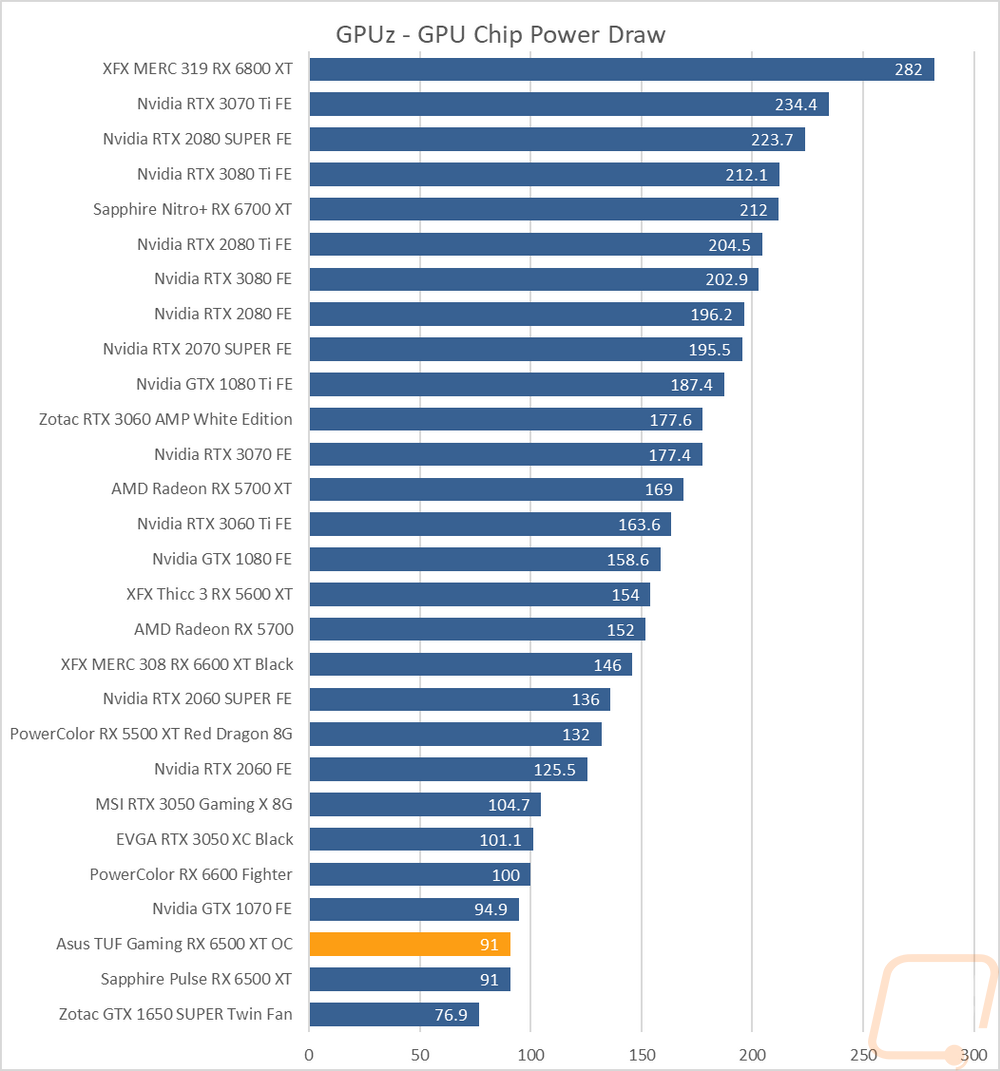
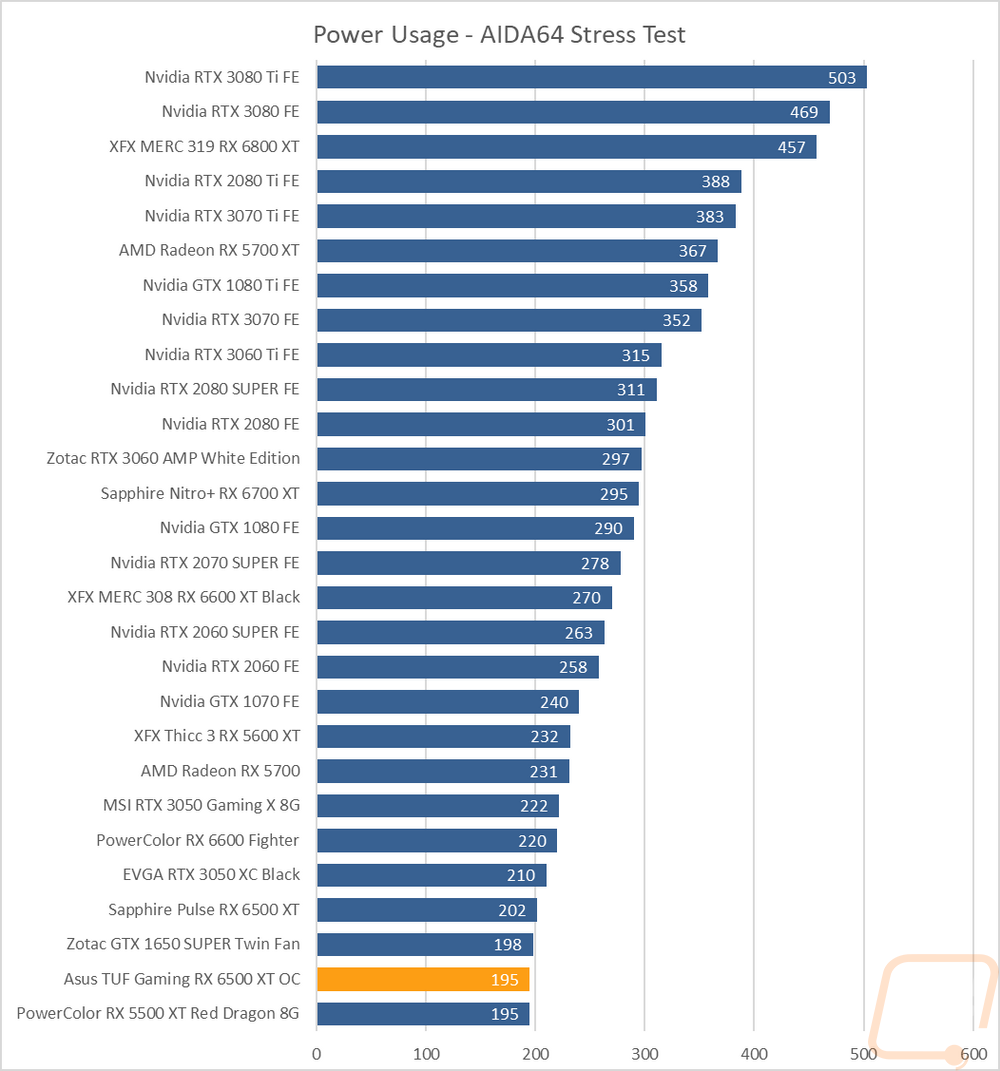
For my last few tests, rather than focusing on in game performance, I like to check out other aspects of video card performance. These are also the most important ways to differentiate the performance between cards that have the same GPU. To start things off I took a look at power usage. For this, I use our Kill-A-Watt hooked up to the test bench to record the total wattage of the system. I ran two tests with the first using 3DMark Time Spy to put the system under a load similar to normal in game performance. Here our test system with the TUF Gaming 6500XT pulled 234 watts which was 14 watts higher than the Sapphire card but still below the older 5500 XT and the RTX 3050’s which were all up in the 255 range. At the same time with Time Spy I also use GPUz to check out the onboard reading for GPU power draw at the chip. I was surprised to see that the TUF Gaming 6500XT was registering the same 91-watt limit as the Sapphire. I thought for sure with the power at the kill-a-watt being higher and with the TUF Gaming 6500XT performing better that we would see a small bump in the power going to the GPU. Lastly, I run AIDA64’s stress test on the video card to load up only the GPU, and using the Kill-A-Watt the test bench with the TUF Gaming 6500XT came in at 195 watts right with the 5500XT and 7 watts below the Sapphire 6500 XT.
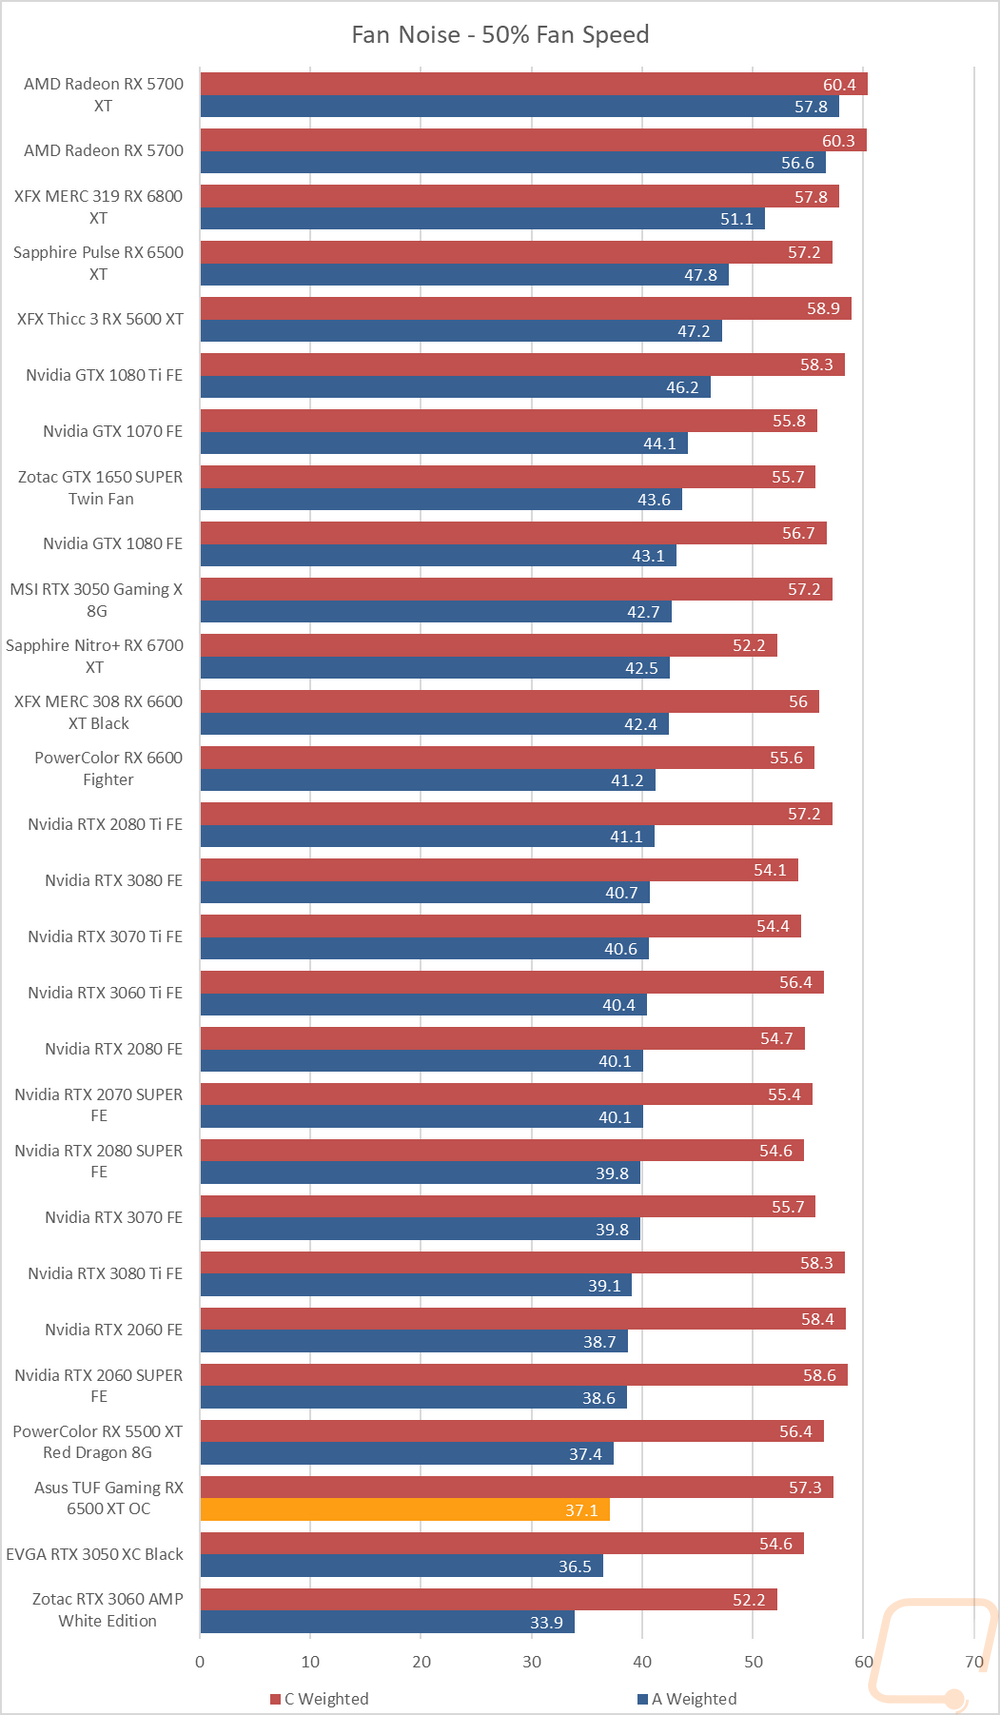
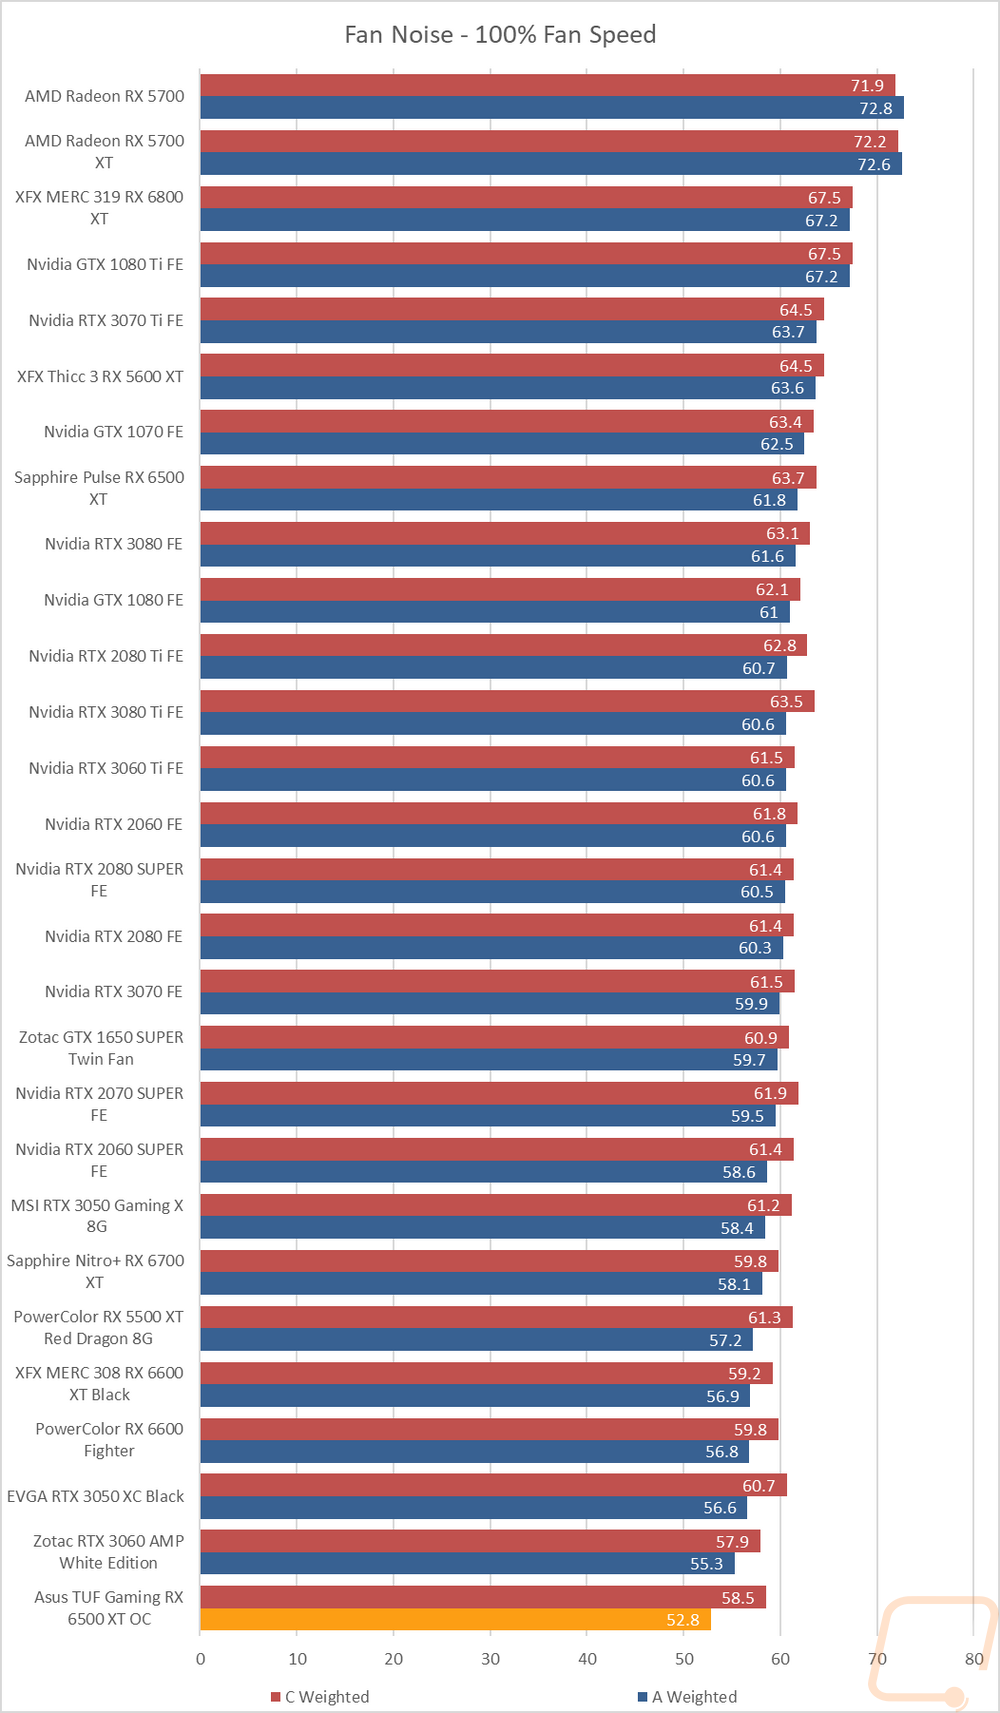
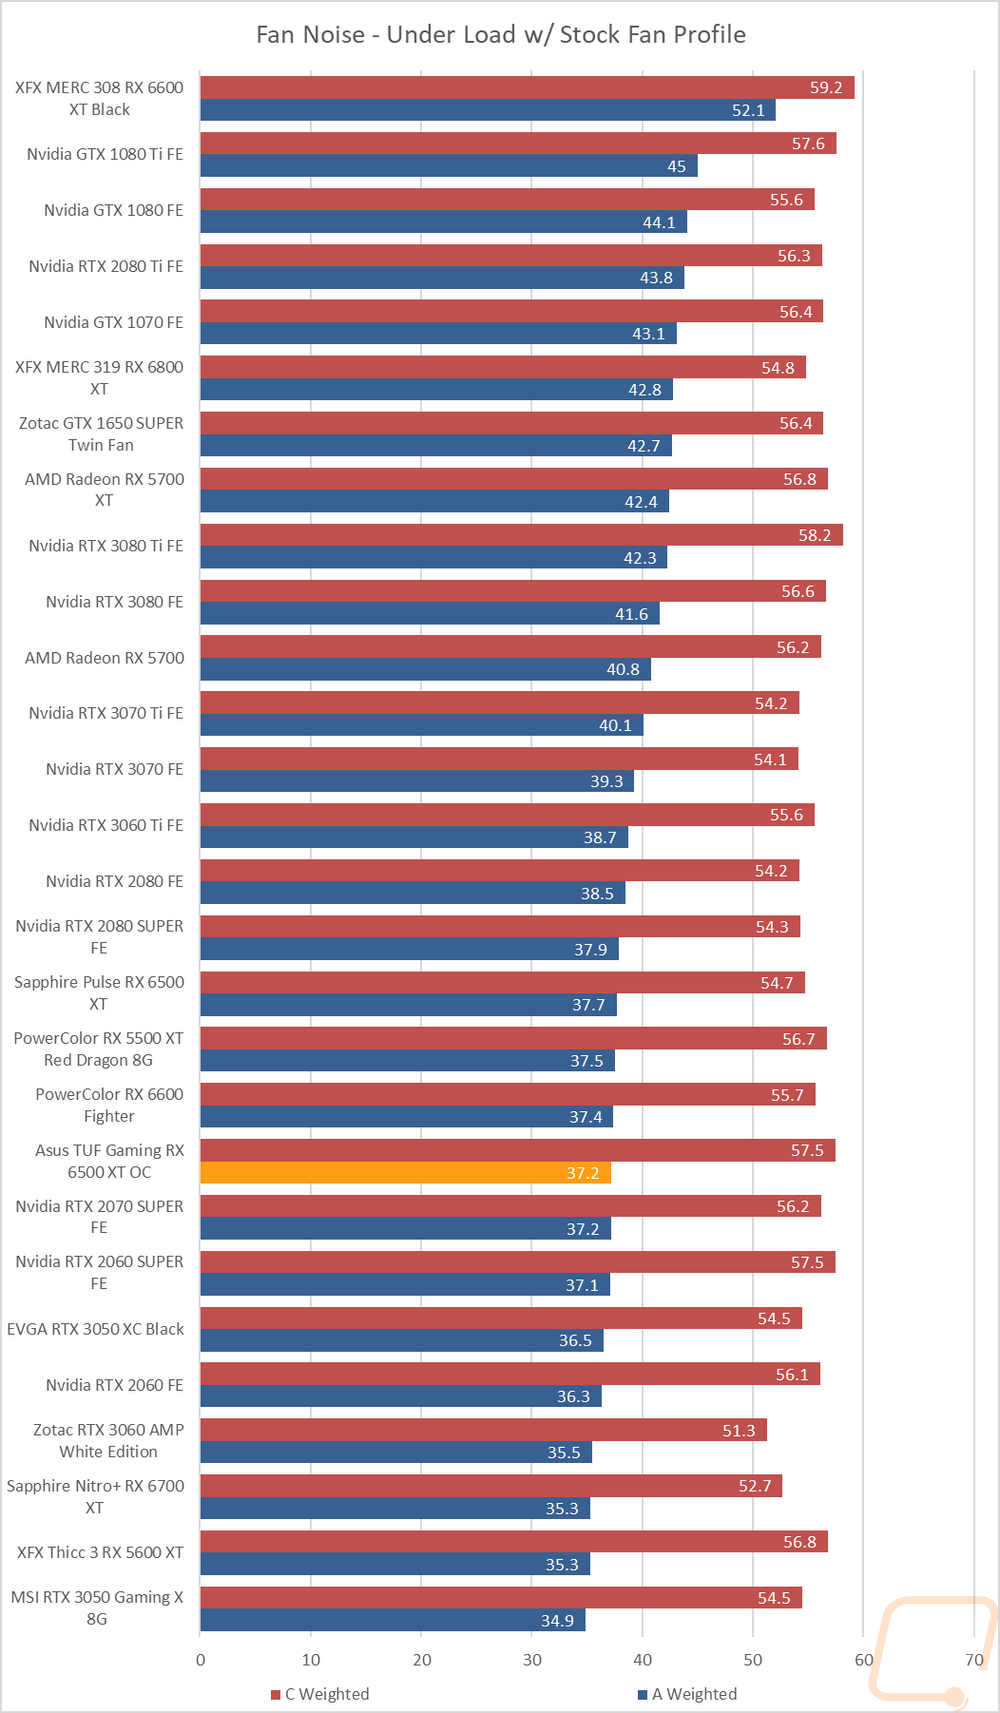
My next round of tests were looking at noise levels. These are especially important to me because I can’t stand to listen to my PC whirling. Especially when I’m not in game and other applications are using the GPU. For my testing, though I first tested with the fan cranked up to 100% to get an idea of how loud it can get, then again at 50% to get an idea of its range. I test using both A and C weighting, A is the standard way and C has a little more of the low end to check for low-level hums. The TUF Gaming 6500XT did really well in the A-weighted test with just two cards coming in lower at 50% and at the complete bottom at 100% fan speed. It was a little nosier on the c-weighted test showing it may have a little more low-end hum but that is normally in a range mostly unheard. At 100% fan speed, however, the C-weighted results were much better and near the bottom of the chart. I also take a look at noise performance while under load. For that when running AIDA64’s stress test I wait until the temperature of the card has leveled off and then measure how loud things are when the card is at its worst-case scenario with the stock fan profile. Here the TUF Gaming 6500XT was in the bottom 1/3 of the results. More importantly, here it was down below the Sapphire 6500 XT with the A-weight test but a little noisier on the c-weighted test similar to the 50% fan speed test. Overall the TUF Gaming 6500XT was well below the Sapphire 6500XT, especially with the fans cranked up to 100%.
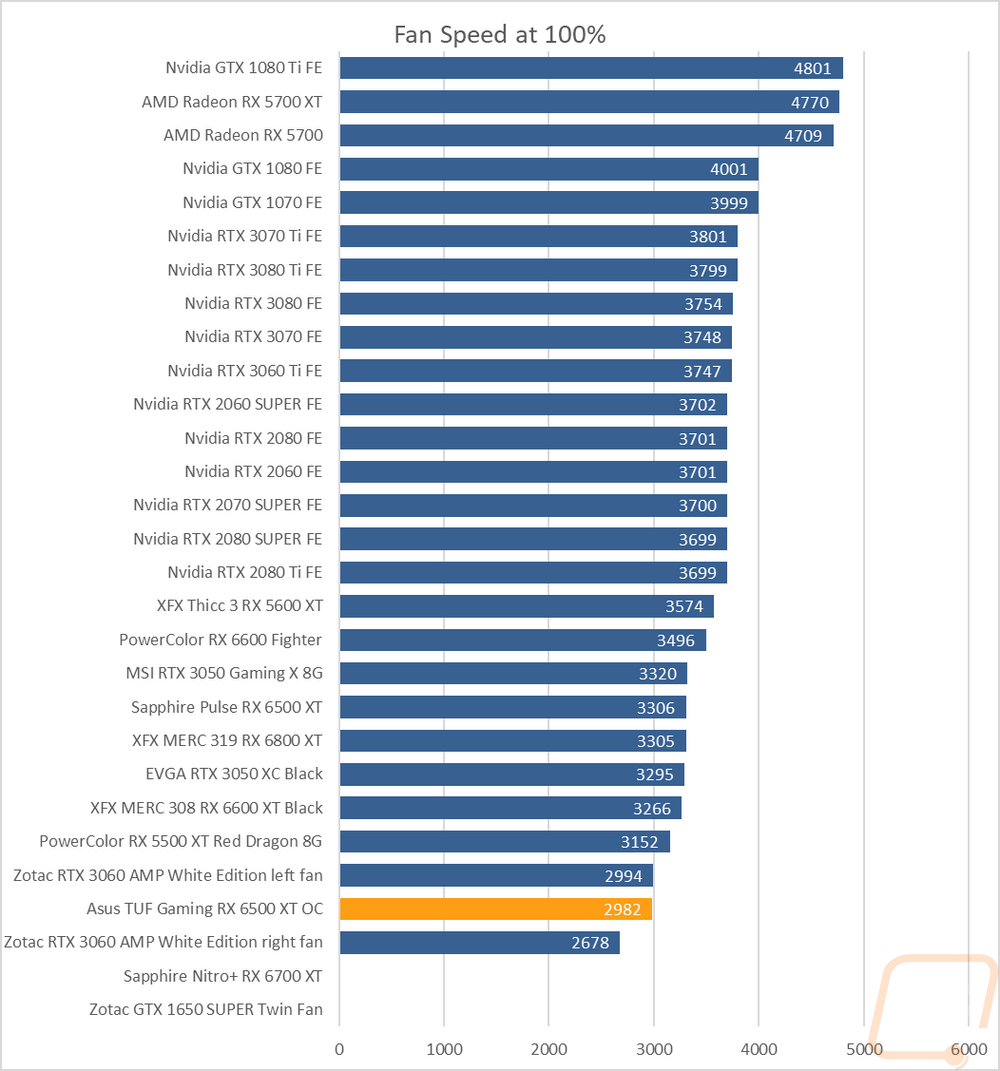
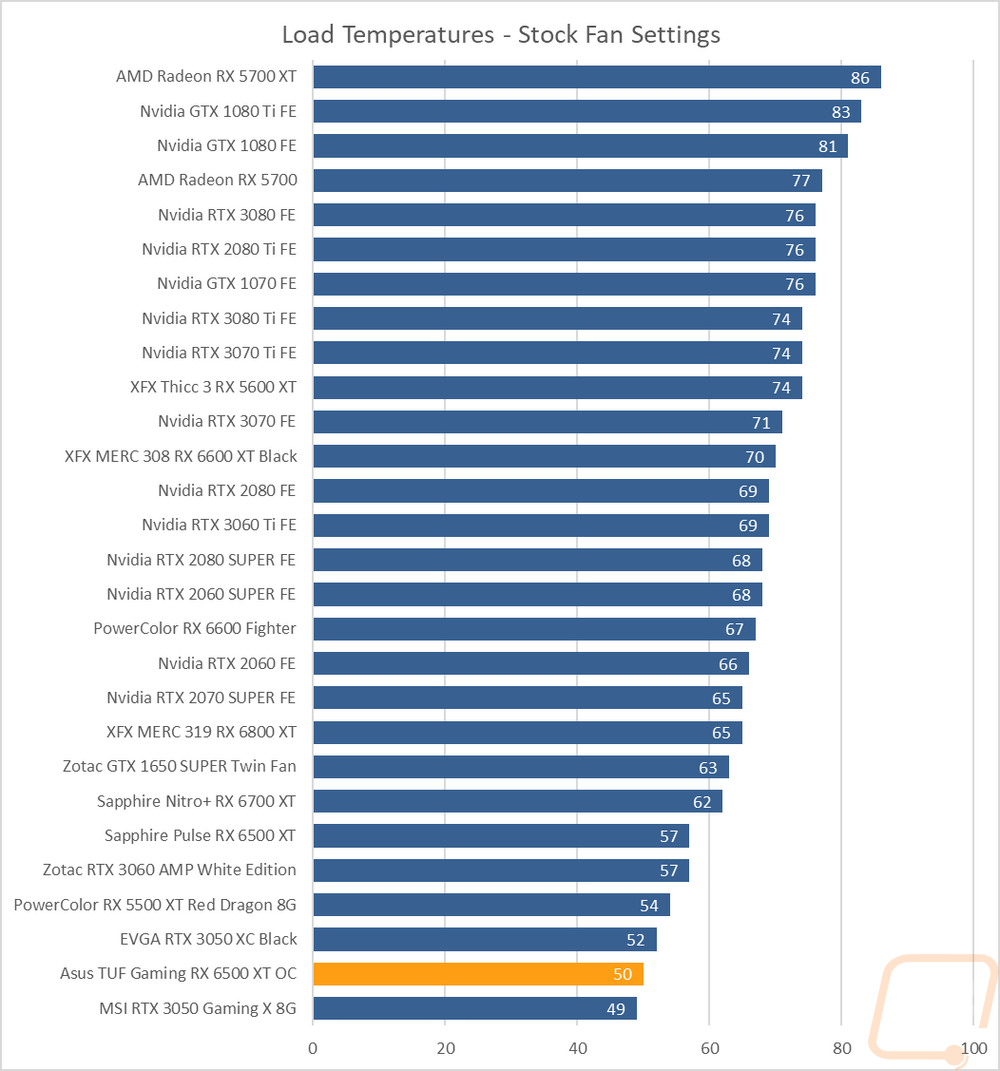
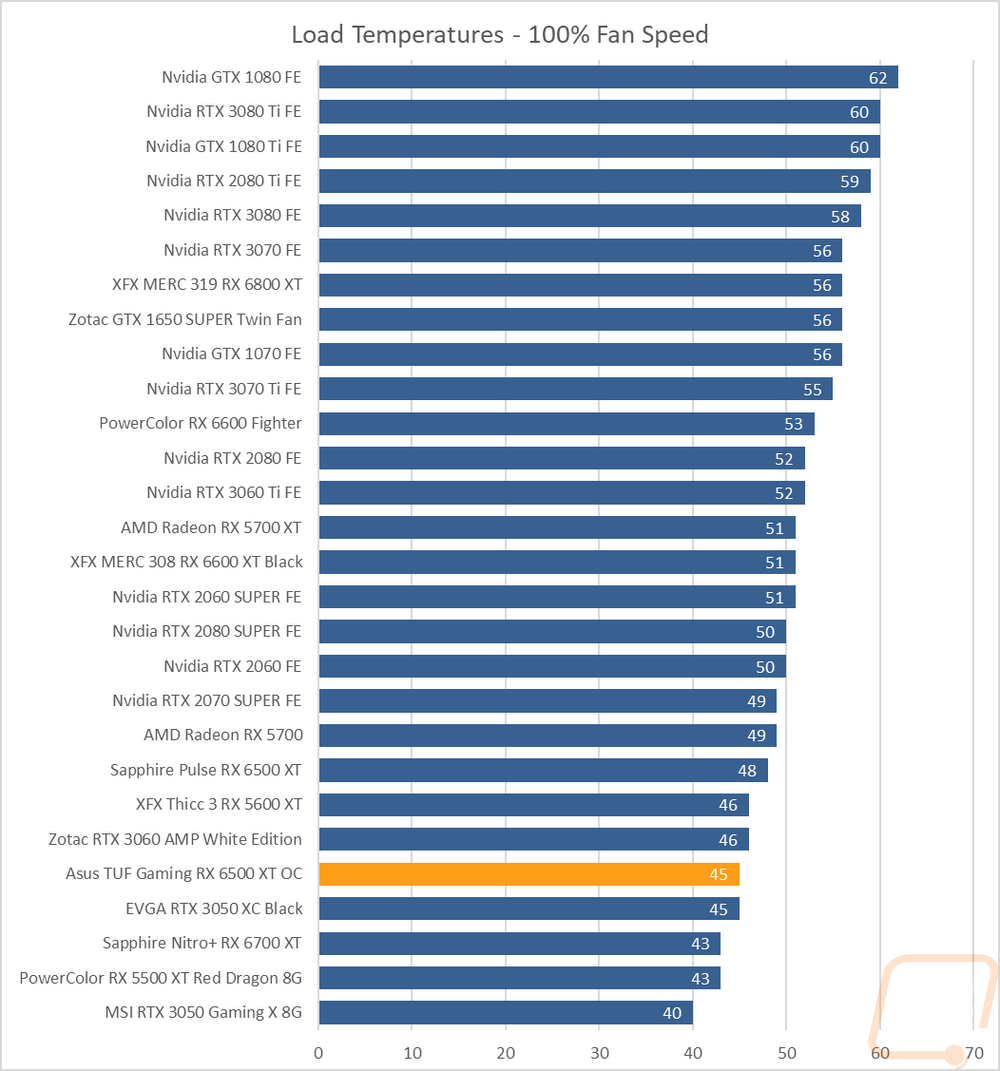
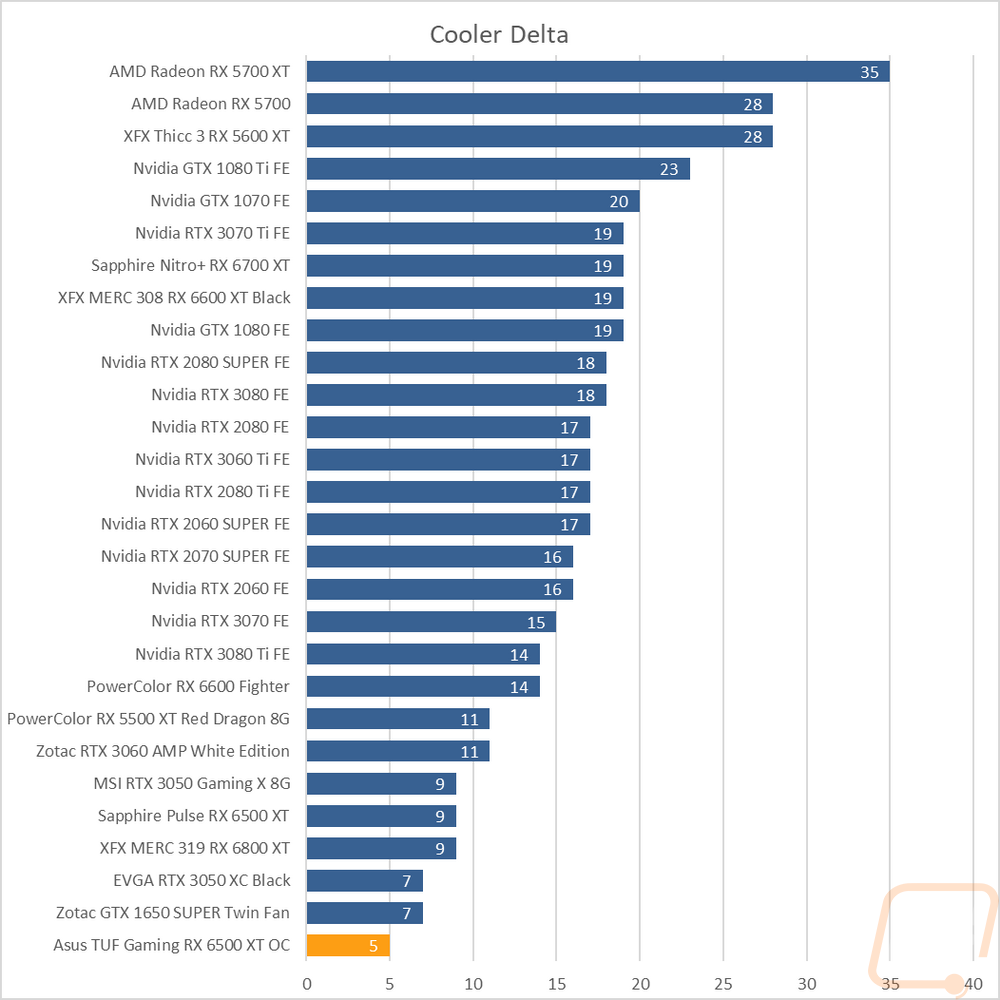
To finish up my testing I of course had to check out the cooling performance. To do this I ran two different tests. I used AIDA64’s Stress Test run for a half-hour each to warm things up. Then I documented what temperature the GPU leveled out at with the stock fan profile and then again with the fans cranked up to 100%. With the stock profile, the TUF Gaming 6500XT was running very cool at 50c. This is especially impressive given how quiet the TUF Gaming 6500XT was running and also the horizontal heatsink layout that is usually less efficient. For comparison, the Sapphire 6500 XT was running 7c warmer on this same test. Then with the fans cranked up, the TUF Gaming 6500XT ran at 45c. The Sapphire card closed the gap here with 3c between them. The TUF Gaming 6500XT’s two fans do run at a lower RPM at 100% fan speed. This put the delta between the stock fan profile and the 100% test at 5c which is on the low end. But we see that sometimes on lower-end cards where you can only cool things down so much.
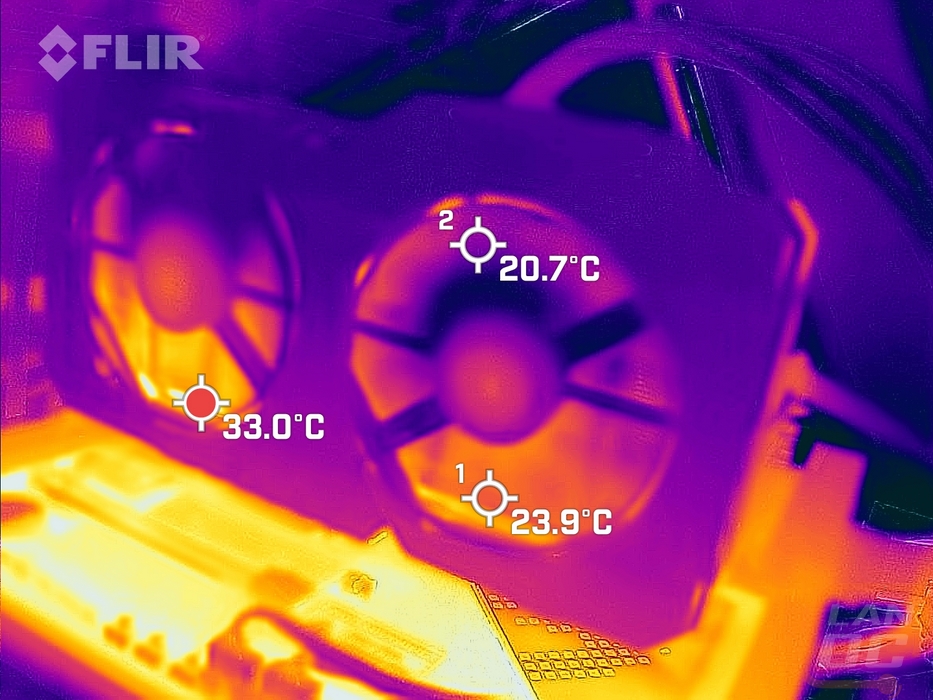
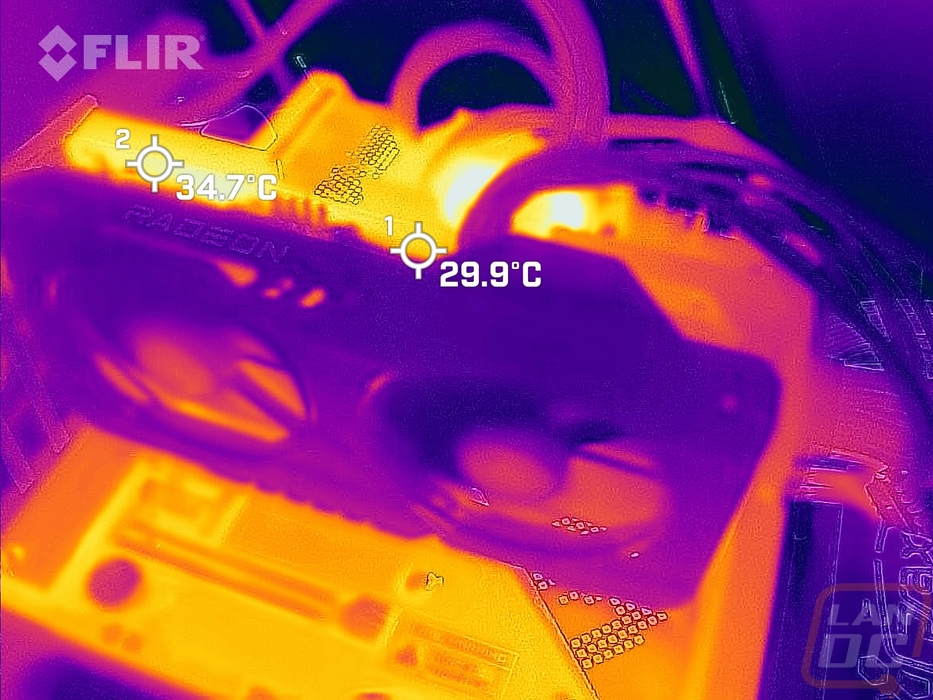
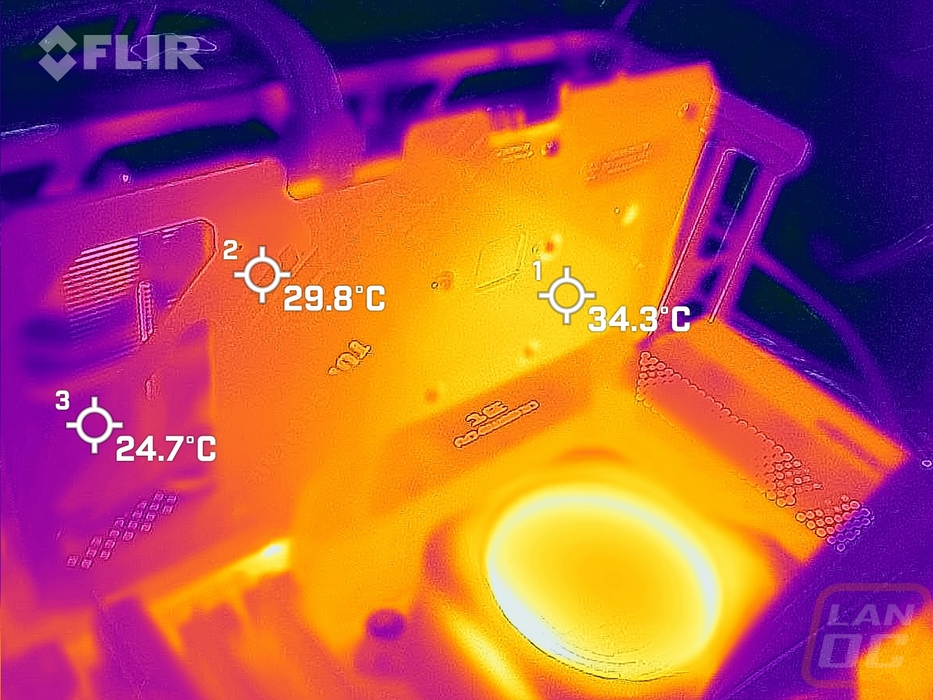
While running the stock fan profile testing I also took the time to get a few thermal images so we could see what is going on. I found it interesting that on the fan side there is a clear difference between the top half of the card and the bottom. But with the heatpipes on the bottom, this is showing the bottom half of the card pulling more heat from the heatpipes before they get up into the top half. The PCB peeking through on the top angle view shows the PCB not running too hot but it is warmer on the left side which has the VRM and GPU so that makes sense. That can also be seen on the backplate with that area being warmer and things being almost room temperature down on the end of the card where the TUF Gaming 6500XT has the openings for the fan to blow through.