In-Game Benchmarks
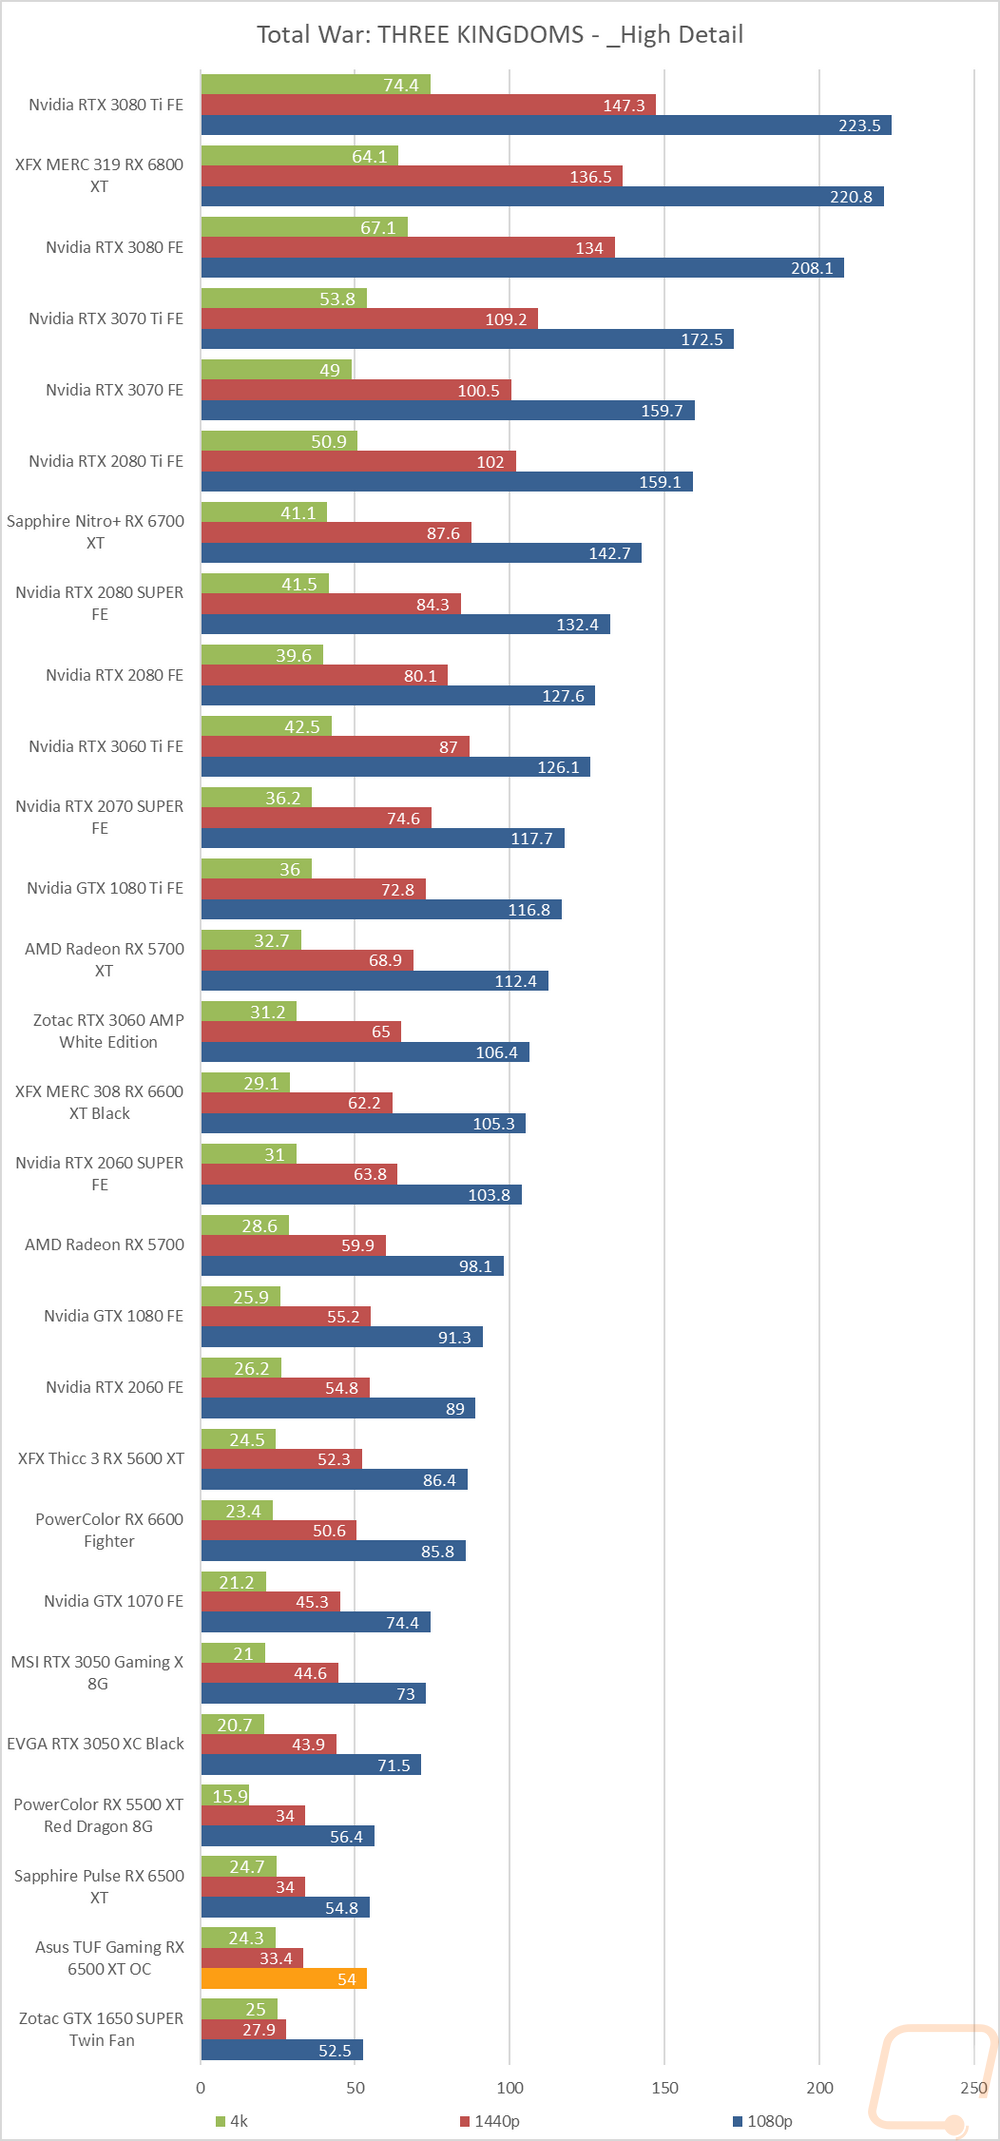
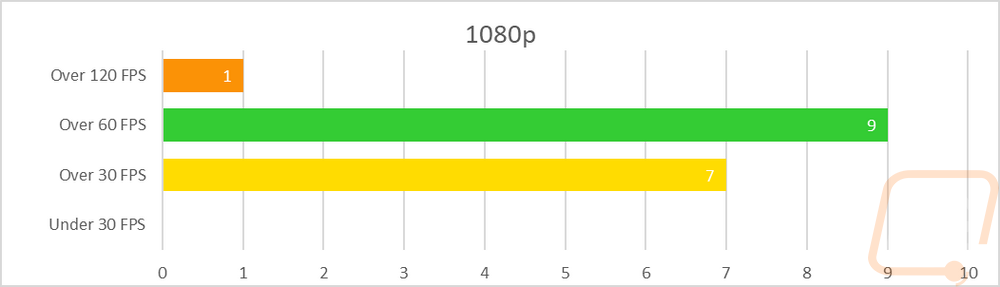
Now we finally get into the in game performance and that is the main reason people pick up a new video card. To test things out I ran through our new benchmark suite that tests 10 games at three different resolutions (1080p, 1440p, and 4k). Most of the games tested have been run at the highest detail setting and a mid-range detail setting to get a look at how turning things up hurts performance and to give an idea of if turning detail down from max will be beneficial for frame rates. In total, each video card is tested 54 times and that makes for a huge mess of results when you put them all together. To help with that I like to start with these overall playability graphs that take all of the results and give an easier-to-read result. I have one for each of the three resolutions and each is broken up into four FPS ranges. Under 30 FPS is considered unplayable, over 30 is playable but not ideal, over 60 is the sweet spot, and then over 120 FPS is for high refresh rate monitors.
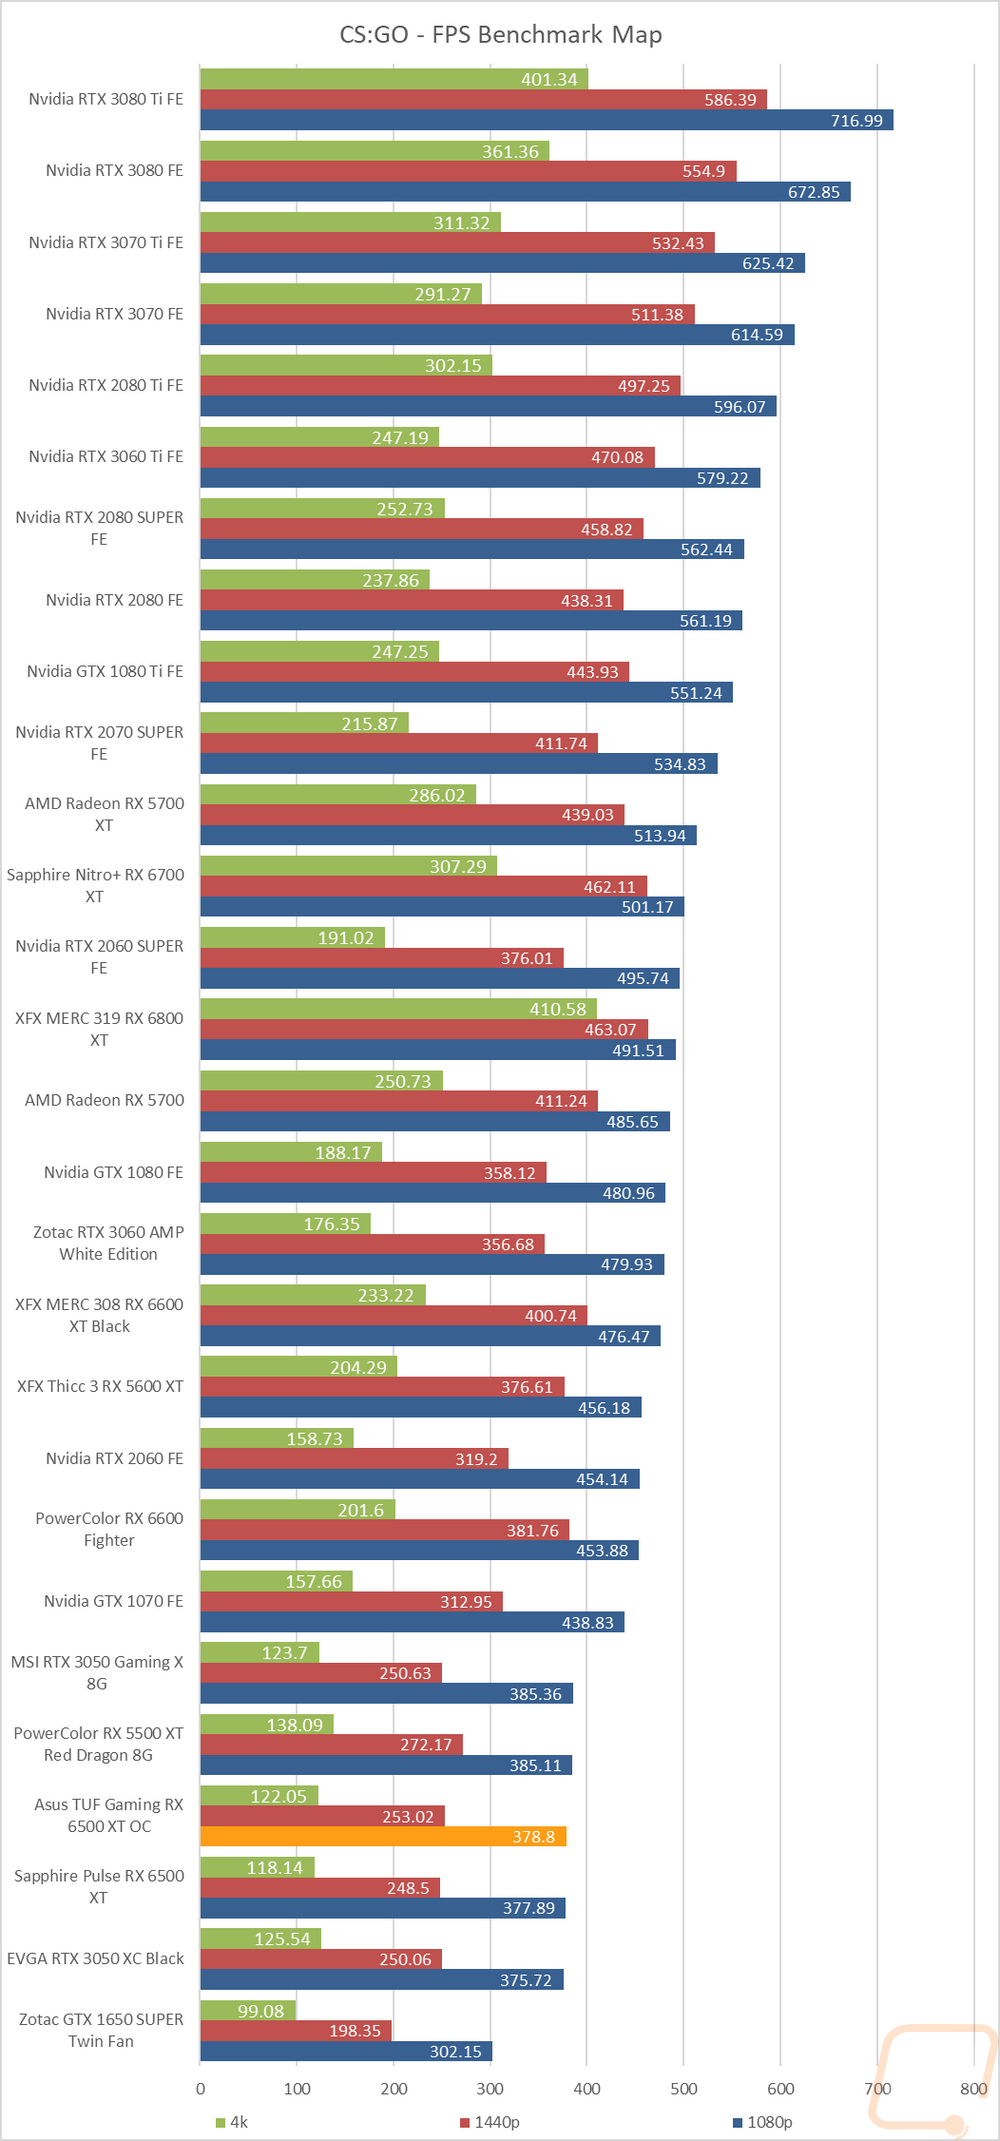
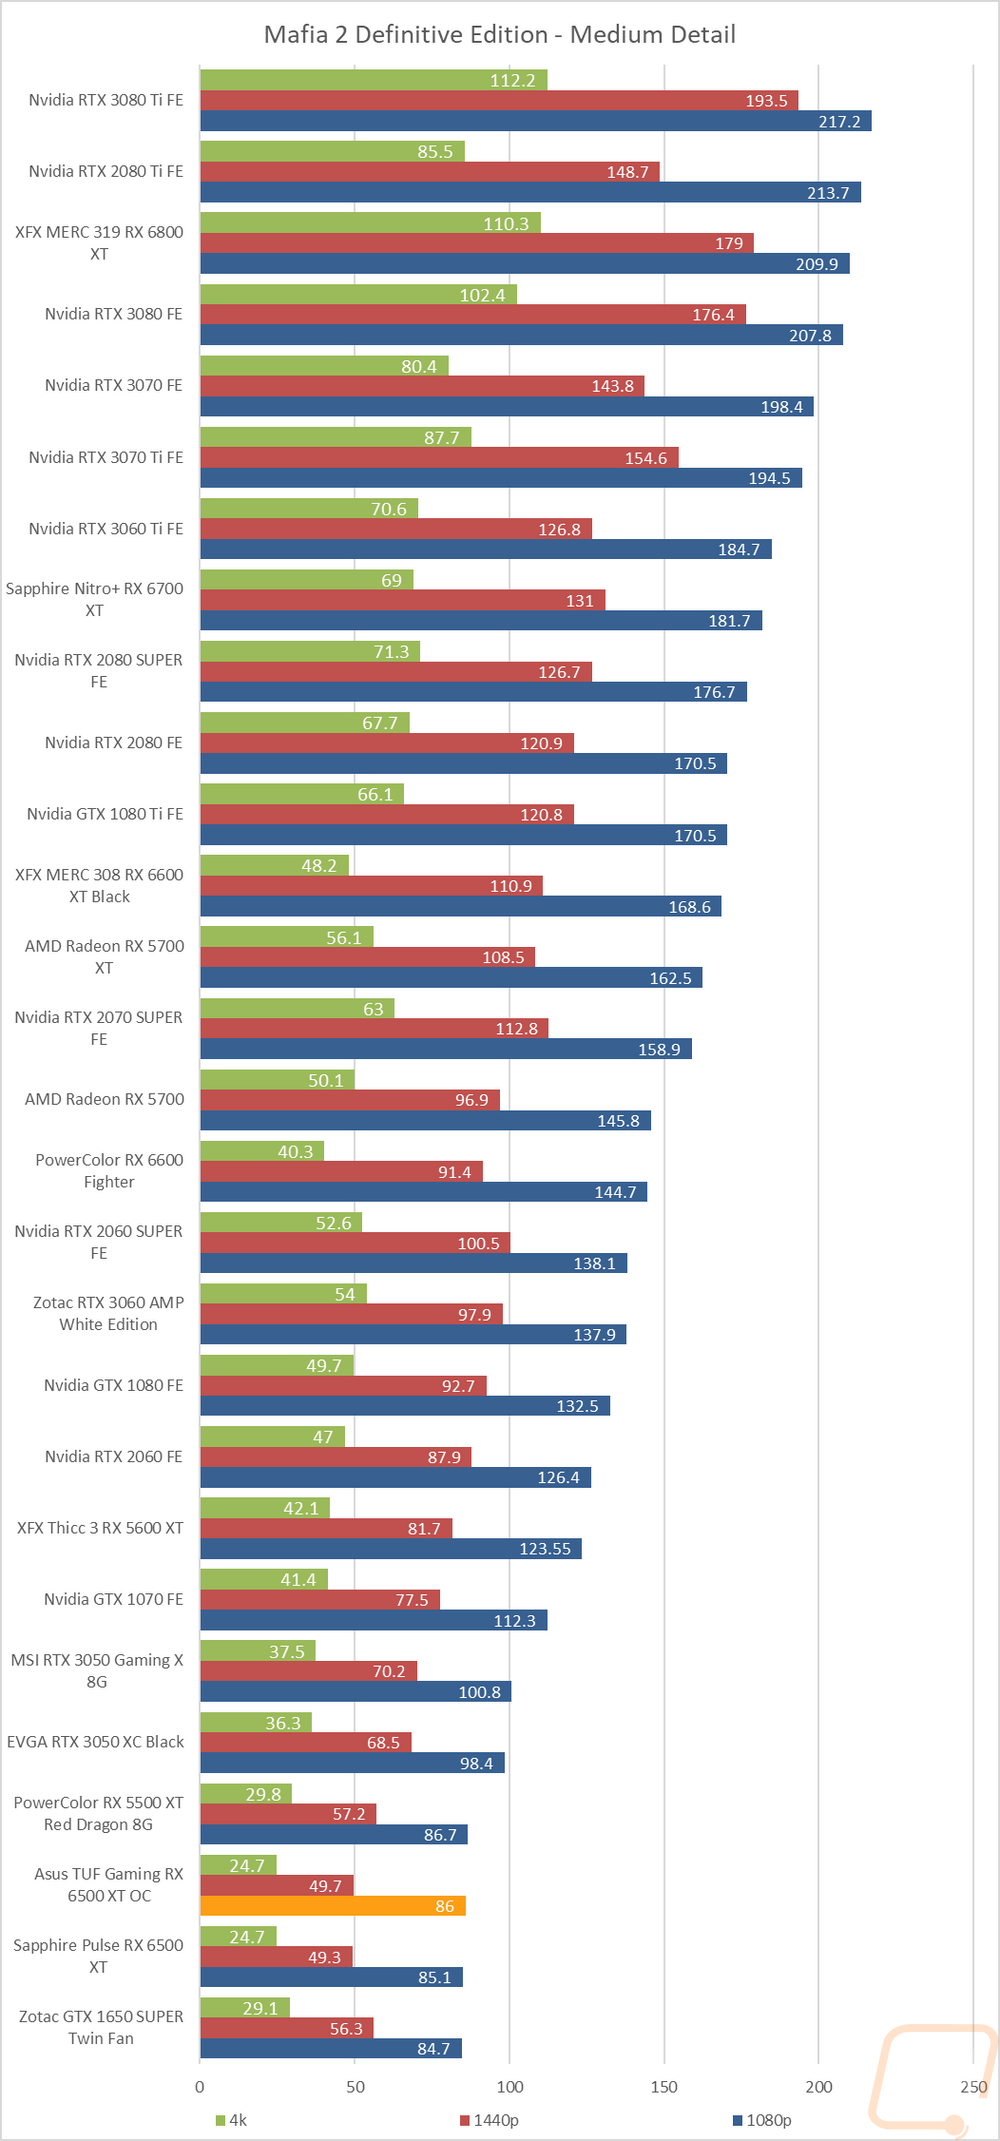
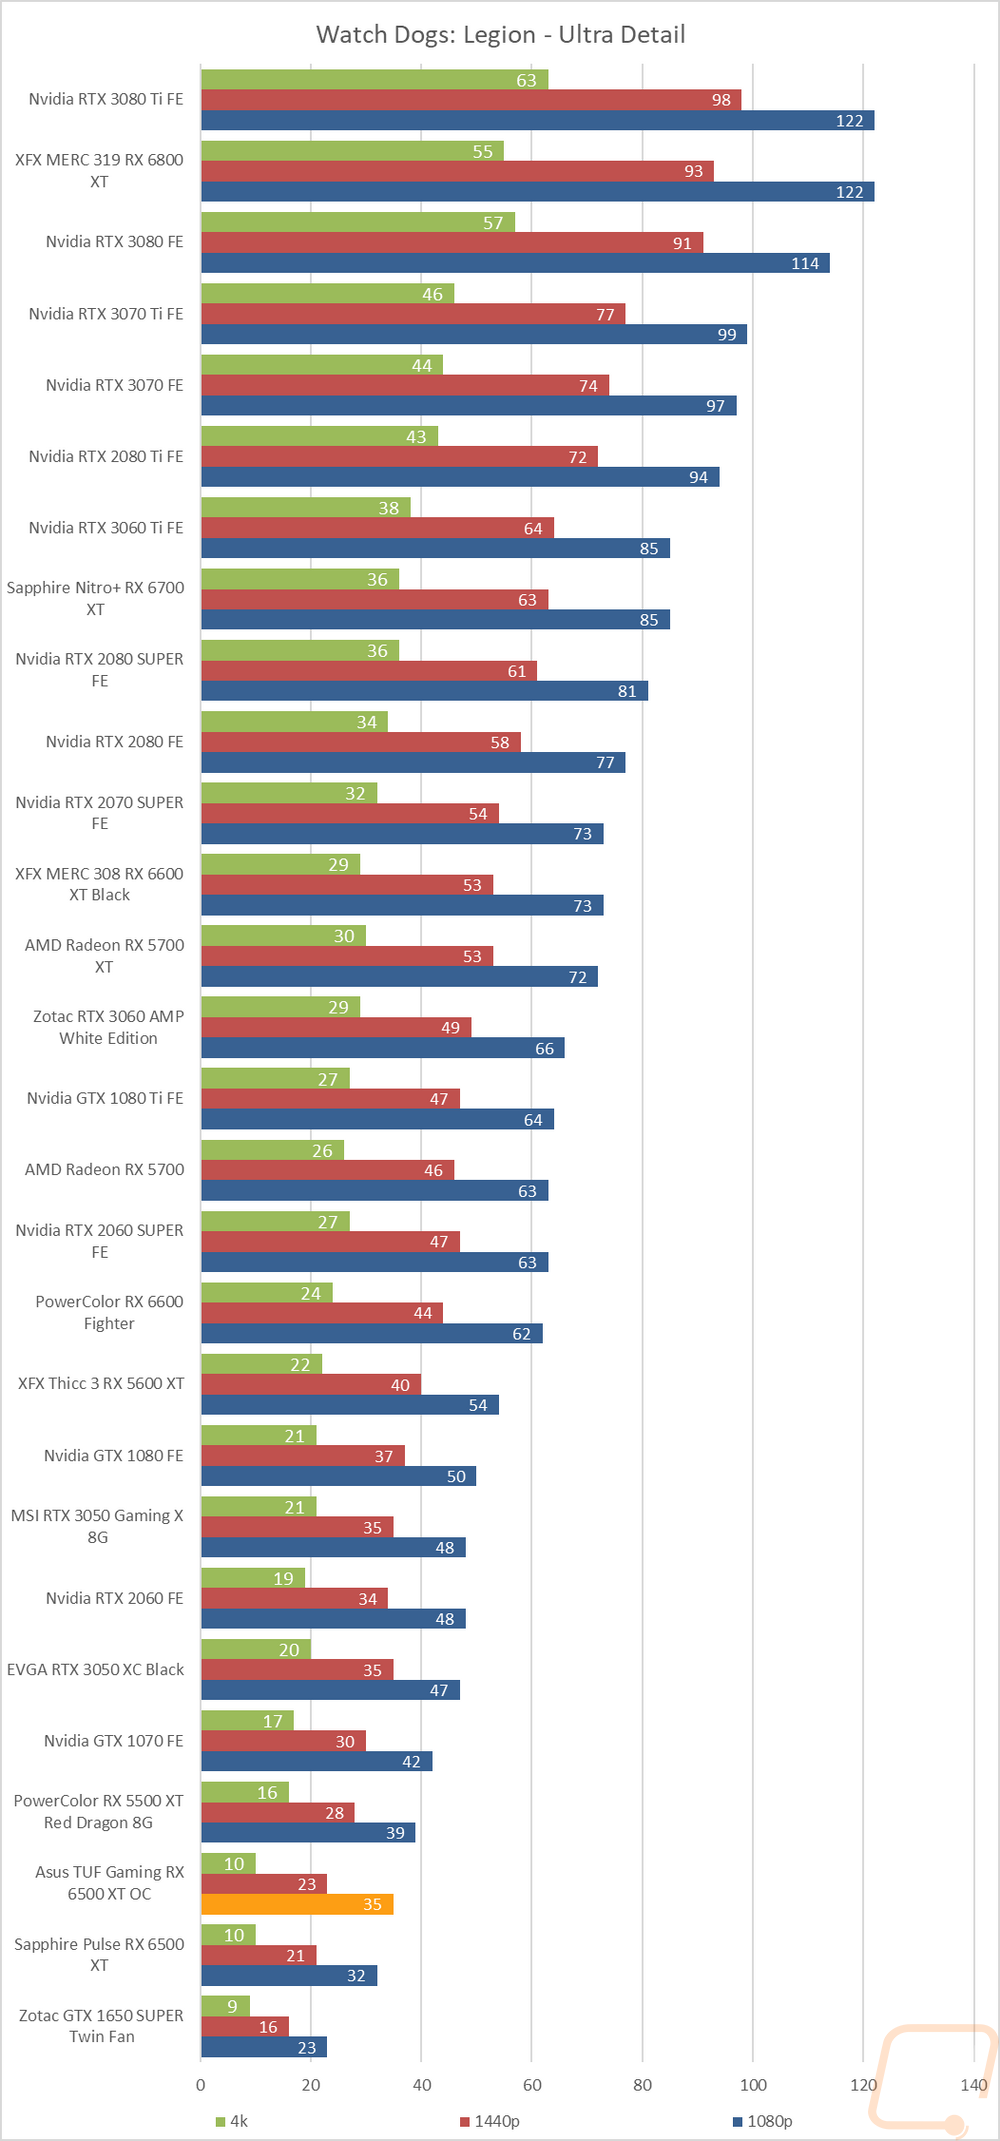
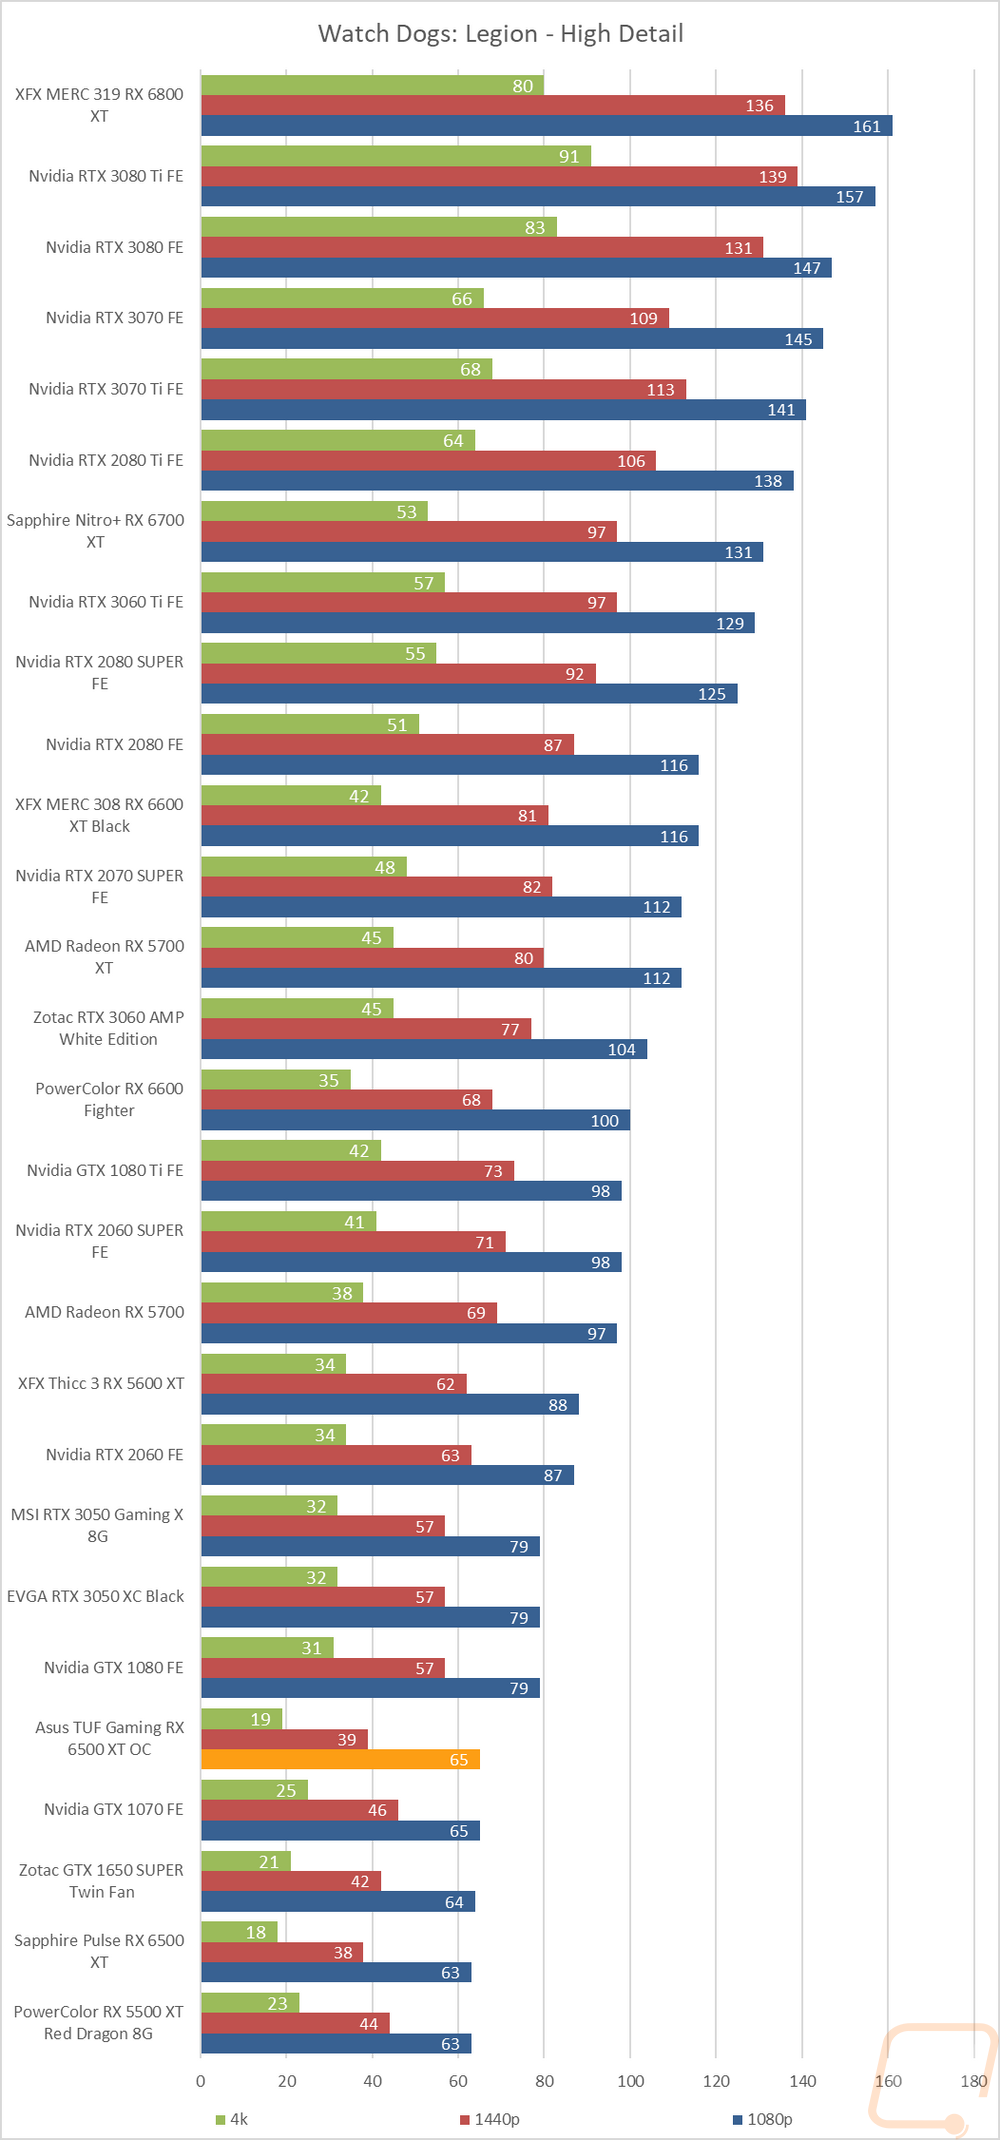
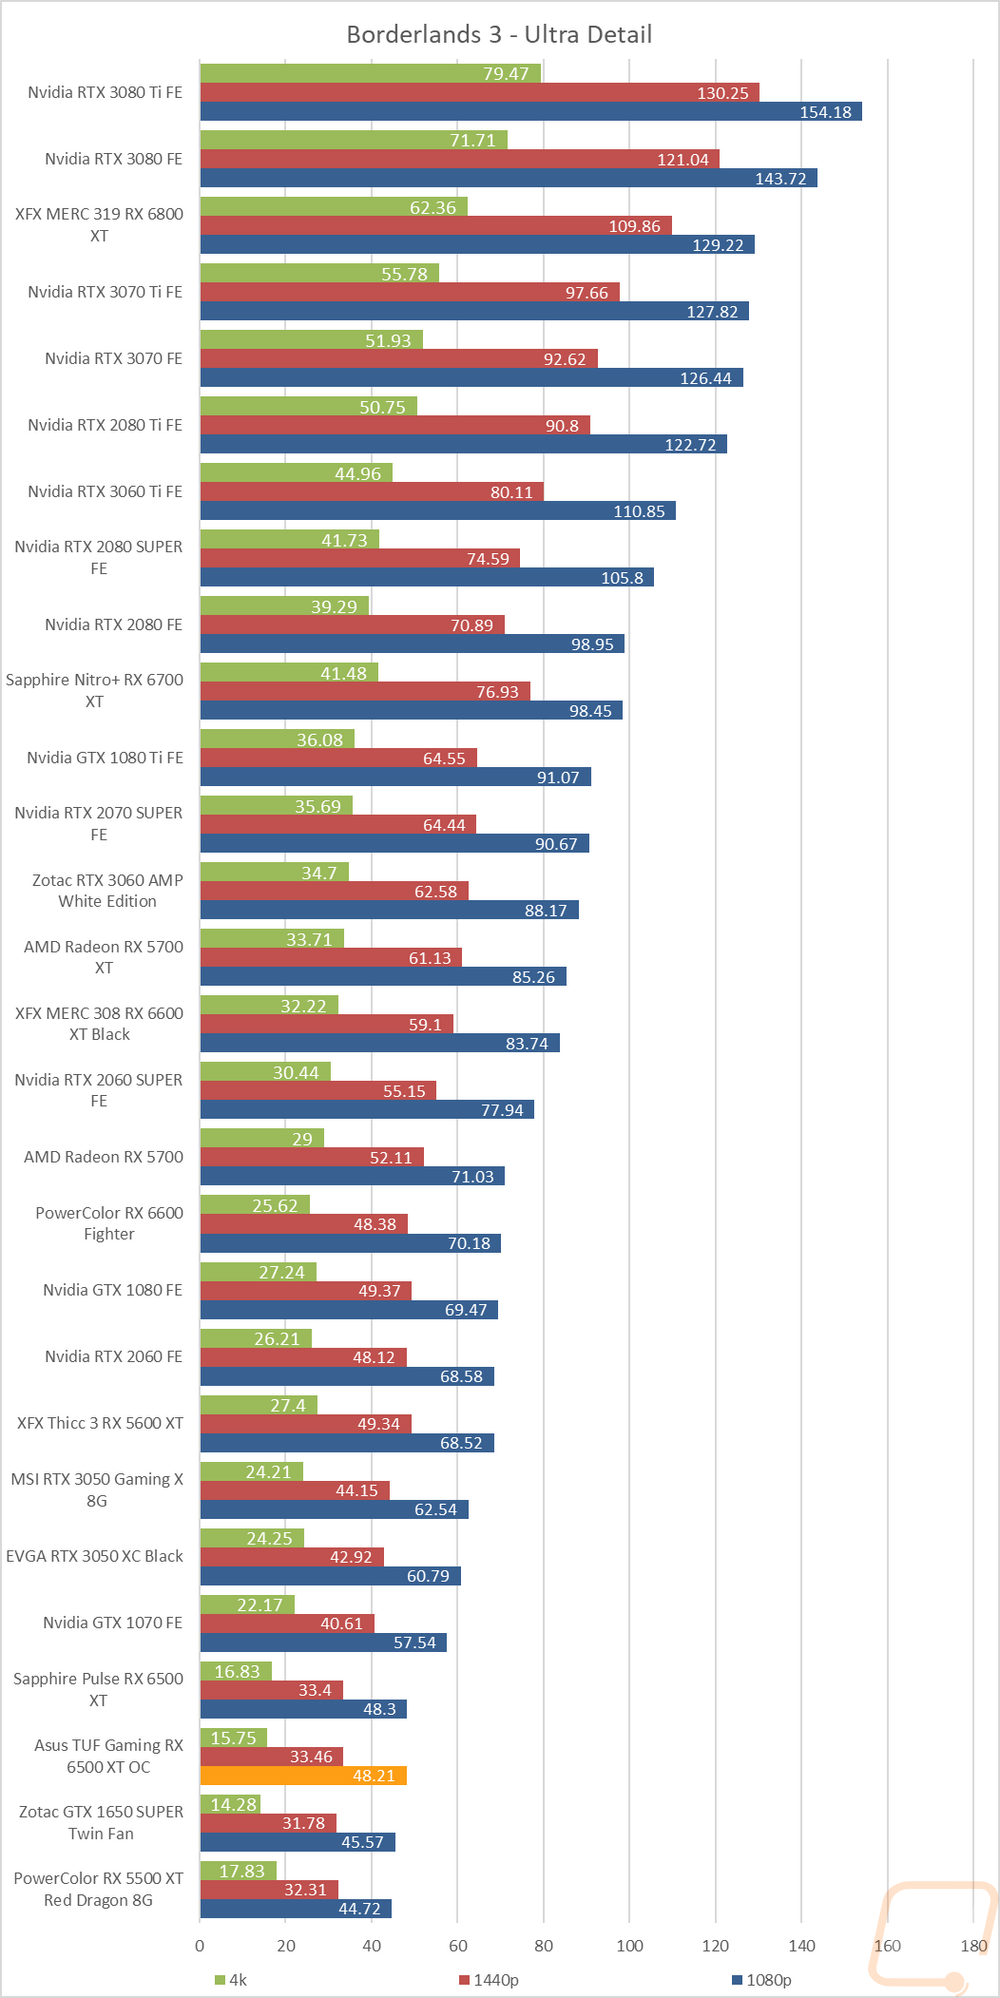
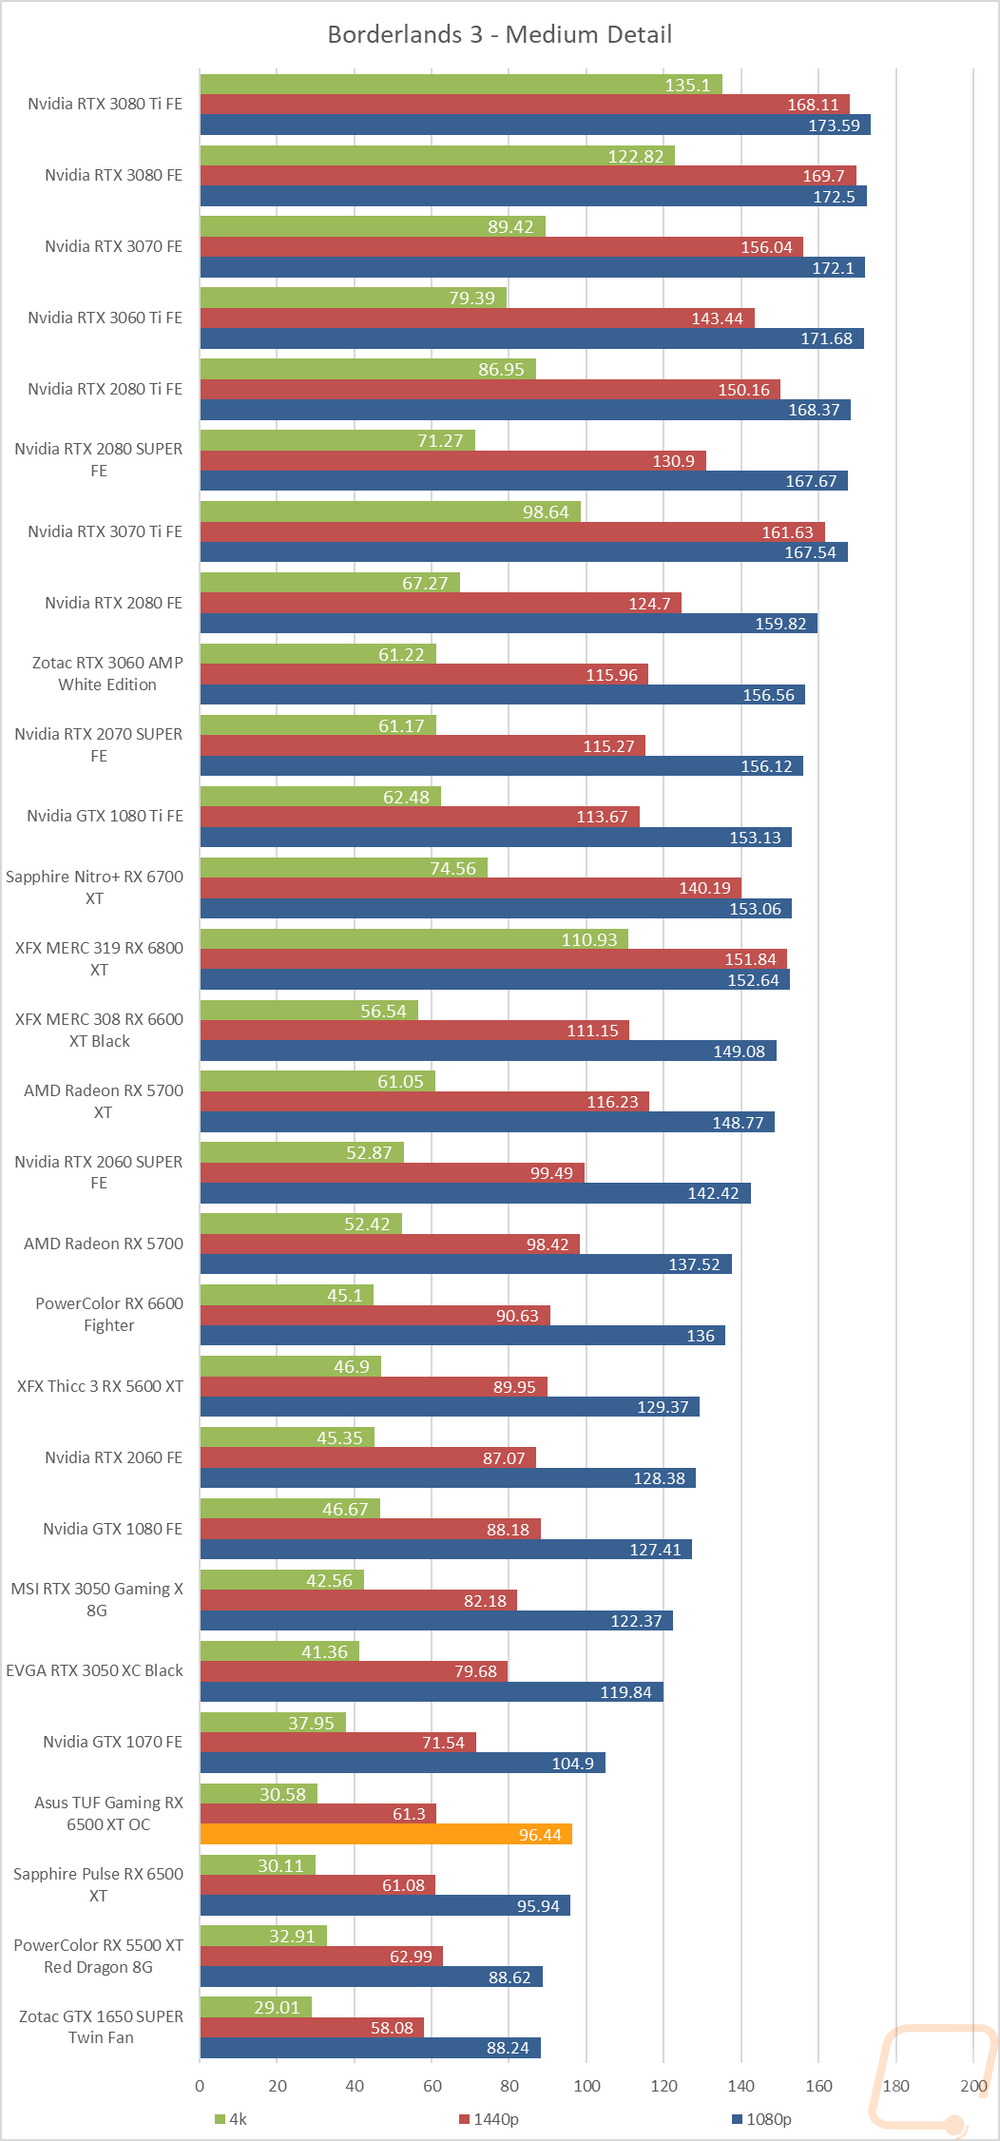
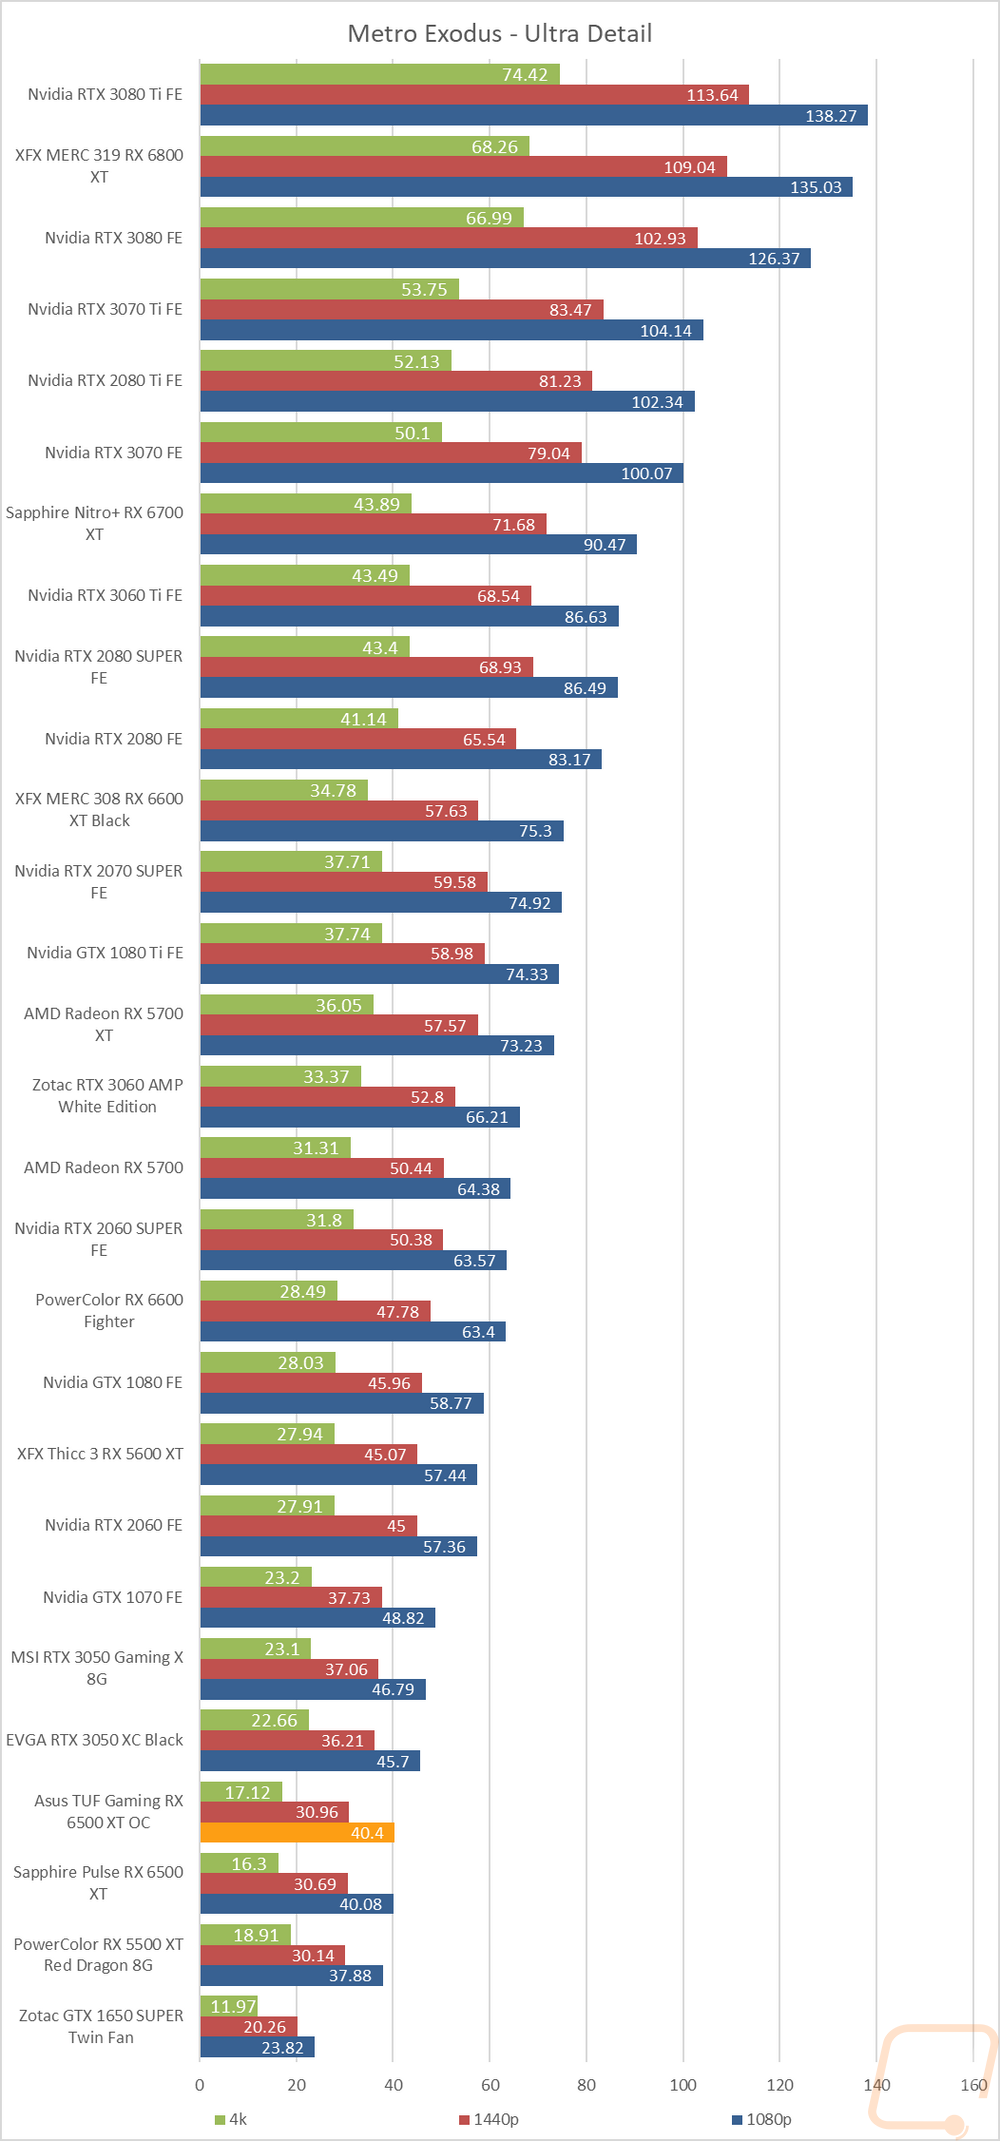
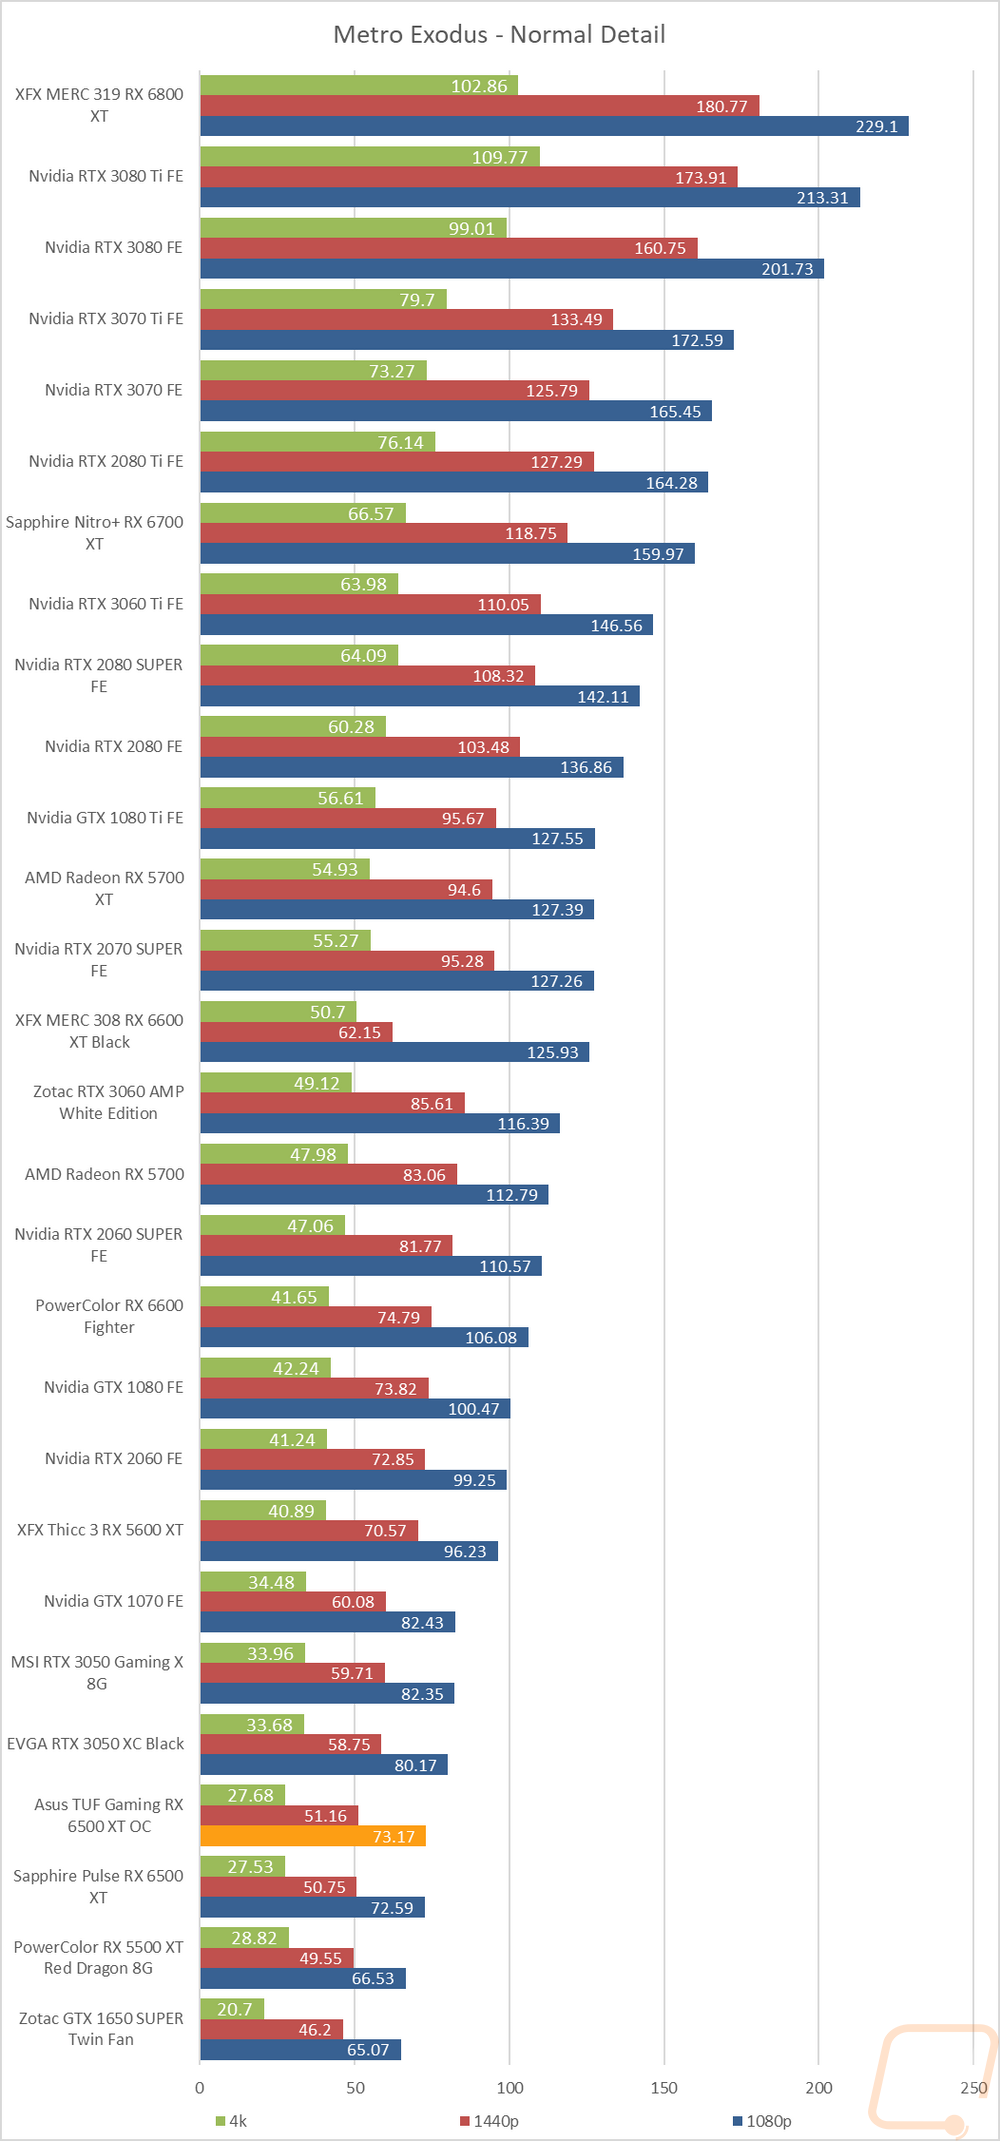
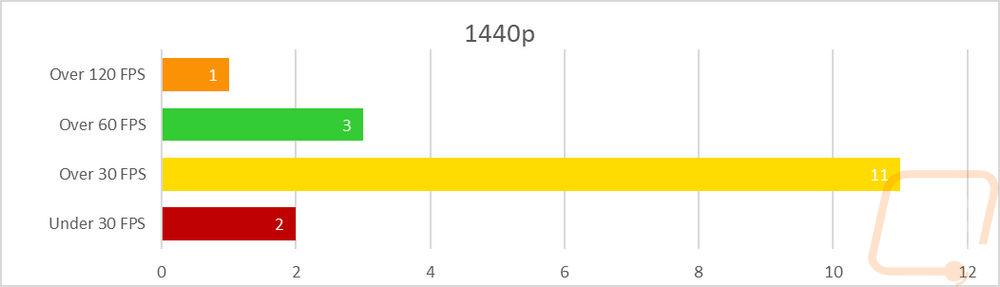
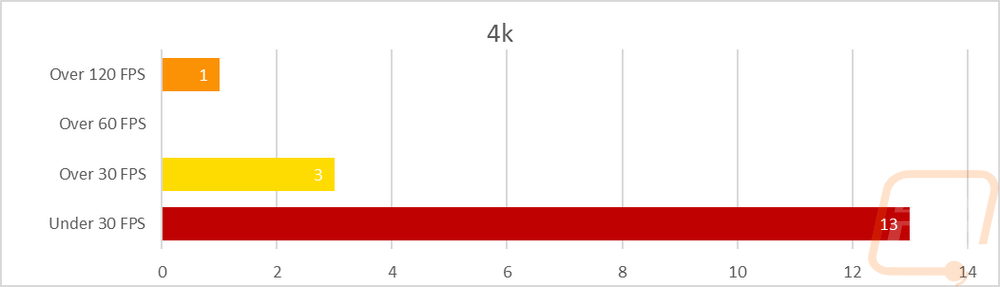
So how did the TUF Gaming 6500XT do? For 1080p which is where the 6500 XT was targeted and at 1080p each result was playable and a majority were smooth with 9 over 60 FPS and one over 120 FPS. Turning things up to 1440p the TUF Gaming 6500XT falls off but is still playable. There is one result (CS:GO) up over 120 FPS, three were over 60 FPS, but most were in the 30-59 FPS range with 11 in that range. Then two results were unplayable. Then at 4k, the 6500 XT falls on its face with CS:GO over 120 FPS and then only 3 other results were playable in that 30-59 FPS range. Most at 4k fall into the under 30 FPS unplayable range with 13 results in that range.
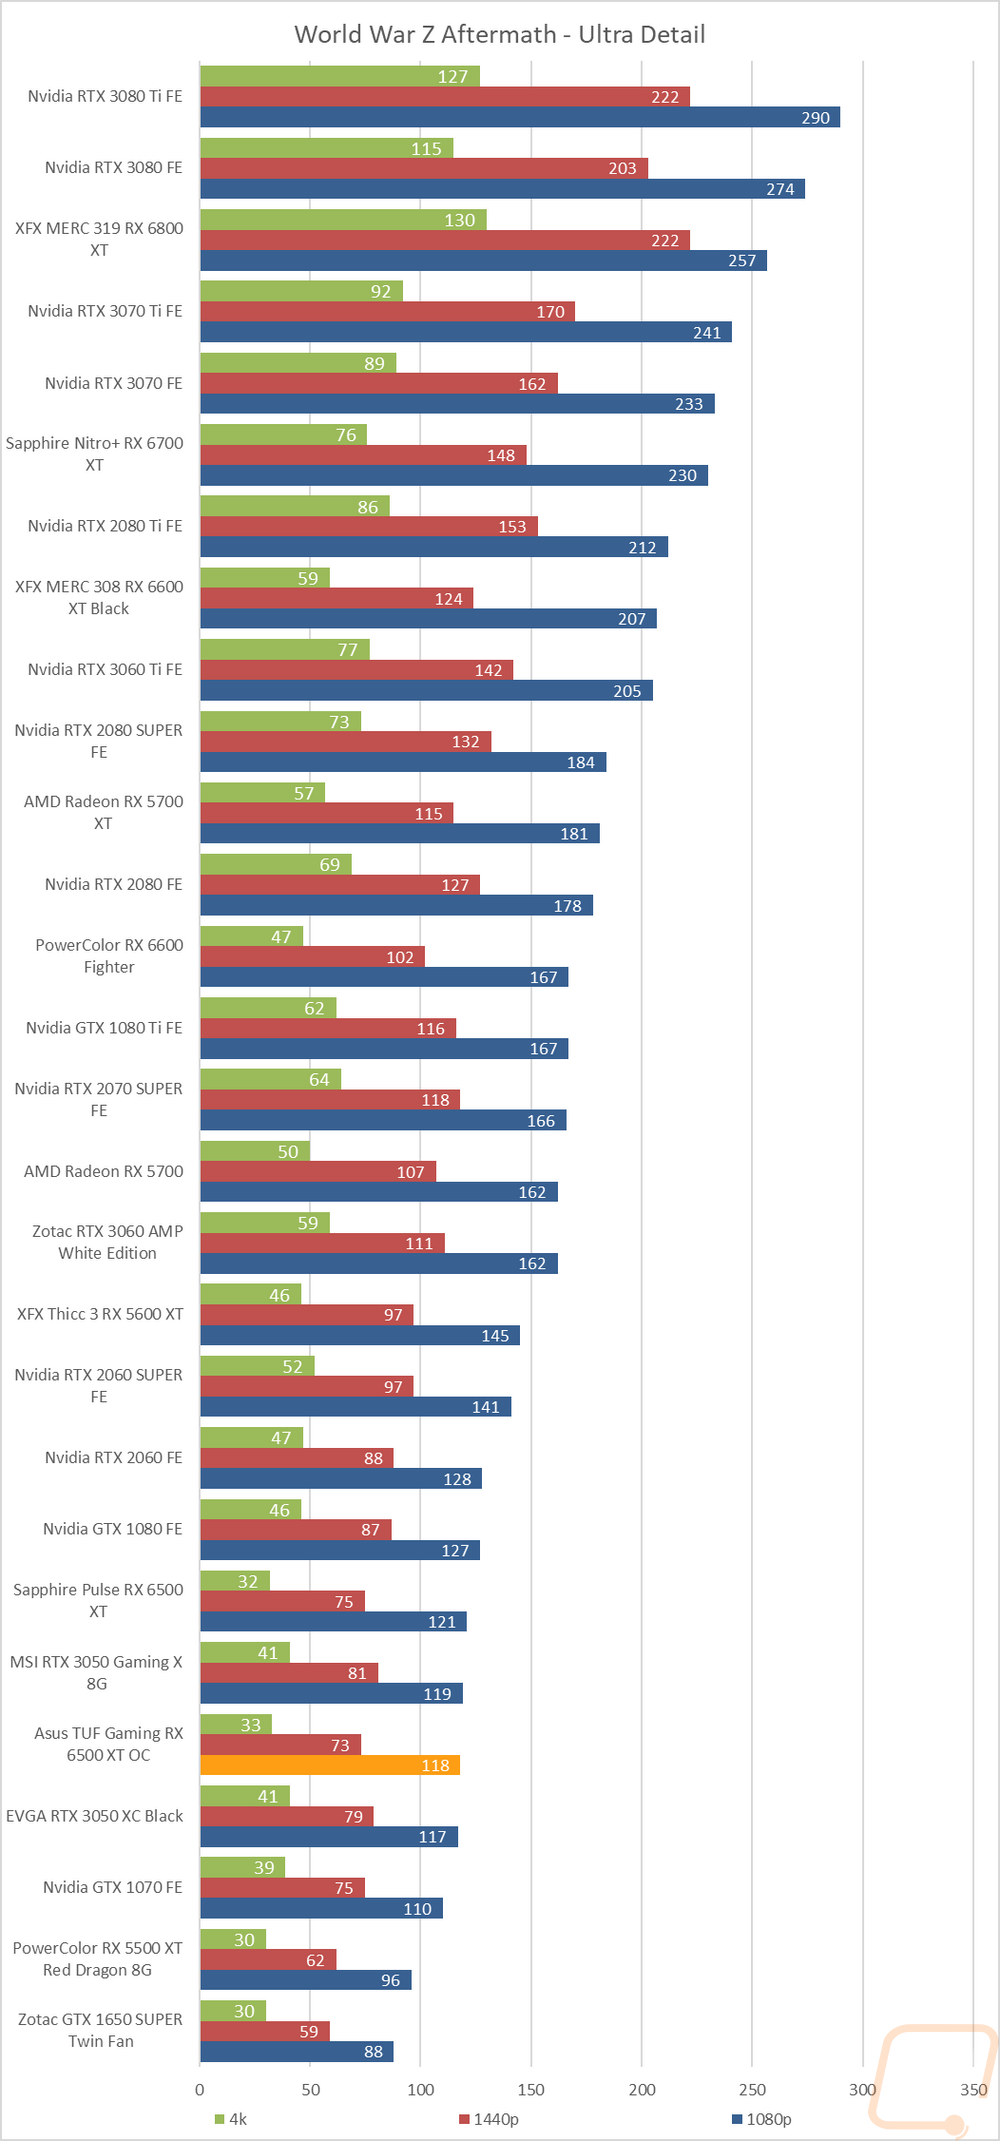
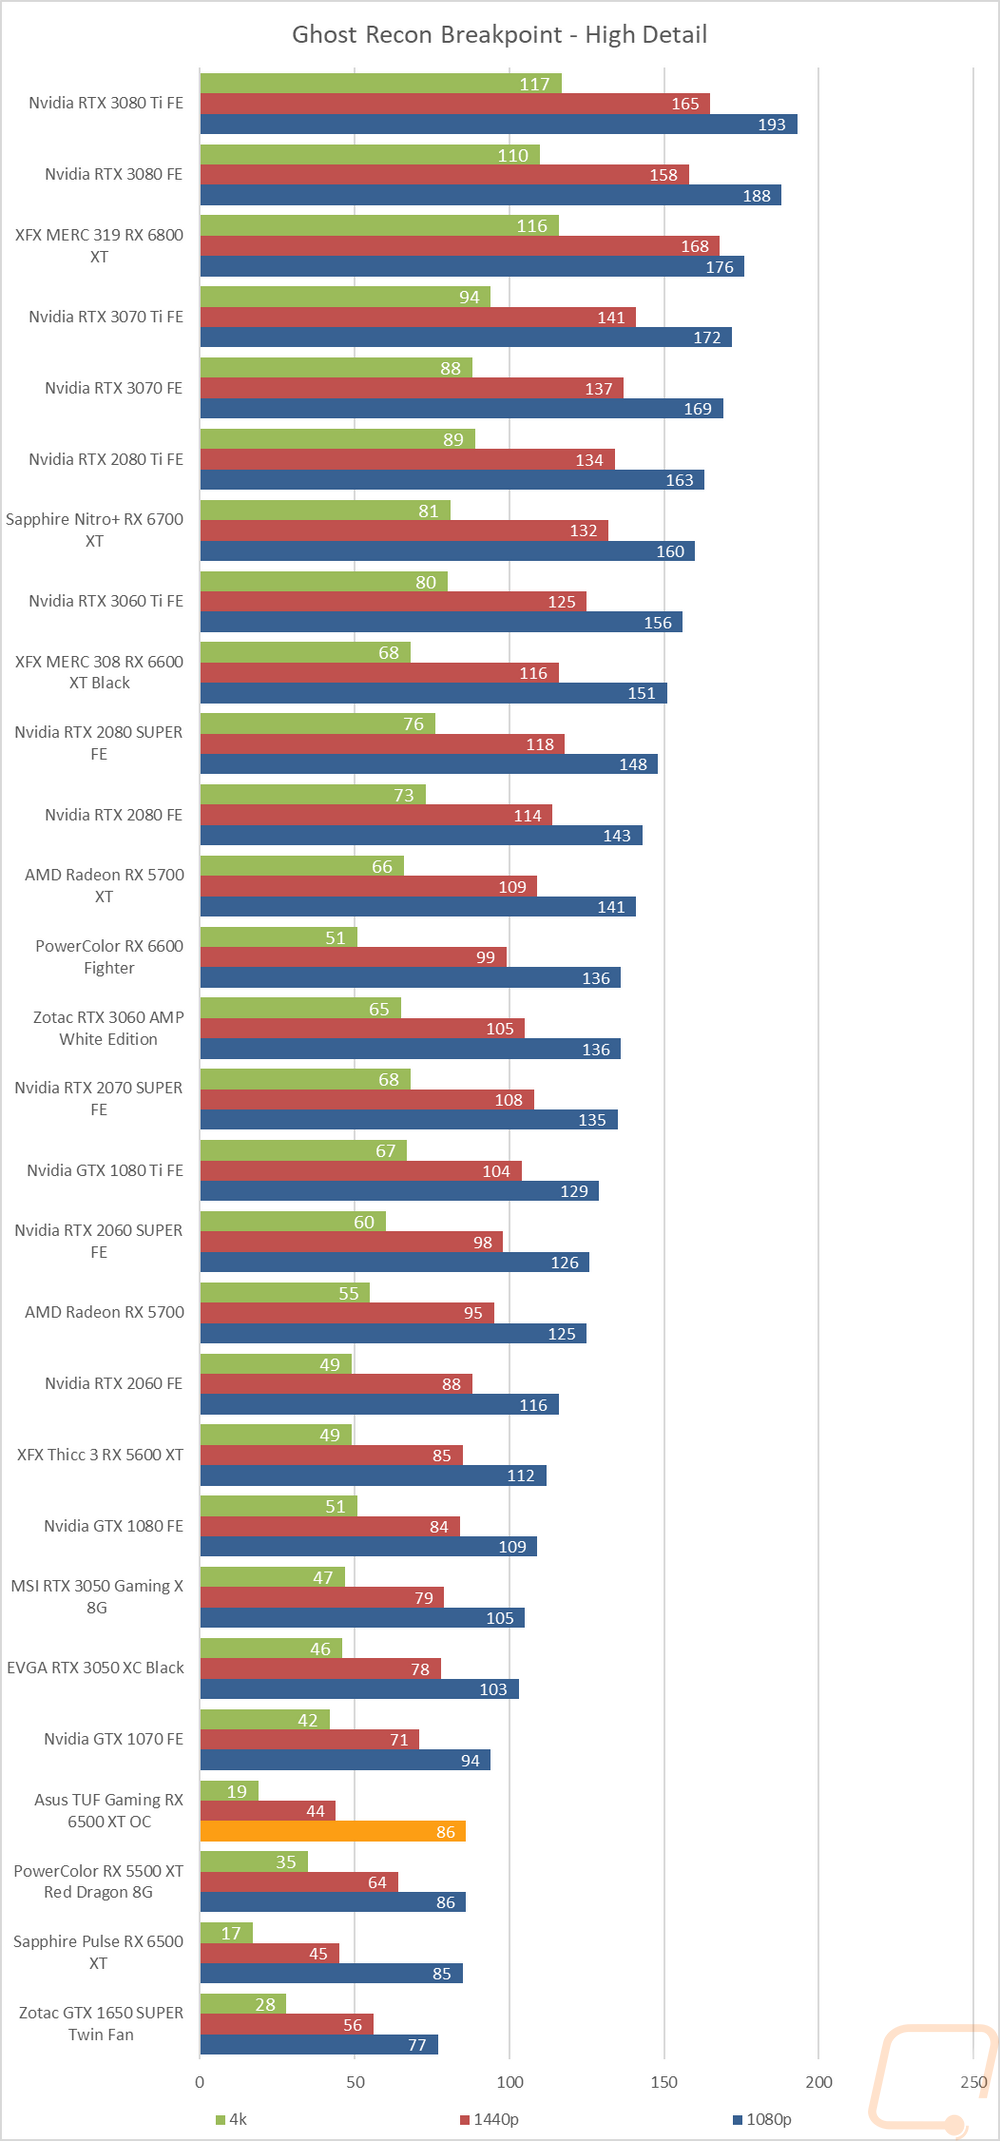
Of course, I have all of the actual in game results as well for anyone who wants to sort through the wall of graphs below. My main focus was seeing where the TUF Gaming 6500XT compared to the Sapphire 6500XT that I previously tested but I did also want to compare it with the older 5500 XT and GTX 1650 as well as the new RTX 3050 so I did average out all of the FPS results to get a better look at things. The TUF Gaming 6500XT somehow did manage to increase the average across all three resolutions compared to the Sapphire card with the same clock speed gaining 2 FPS at 1080p, 1 FPS at 1440p, and a half FPS at 4k. The CS:GO result increases the overall average. For example at 4k without that result, the average drops down to 20.03 FPS. The comparison with the GTX 1650, 5500XT, and 3050 still stand where our previous 6500XT was. The TUF Gaming 6500XT beats out the GTX 1650 handedly then for the 5500 XT the better performance I saw from the TUF card helped put it in front at 1080p but at 1440p and 4k, the 5500 XT performs significantly better. This is partially because that specific card had 8GB of VRAM, but also due to the limitations of the 6500 XT having that mobile-focused x4 PCIe lanes. Then for the RTX 3050, it is up in its own world. If you look through the individual results there are one or two results where the Sapphire card ends up on top over the TUF Gaming 6500XT like World War Z Aftermath where the TUF Gaming 6500XT lost 4 FPS and dropped that result down below 120 FPS. But most results have the TUF Gaming 6500XT being out in front as the average also shows.
|
1080p |
1440p |
4K |
|
|
GTX 1650 |
75.67 |
48.07 |
24.28 |
|
Sapphire RX 6500 XT |
85.47 |
55.34 |
25.52 |
|
TUF Gaming 6500XT |
87.41 |
56.54 |
26.03 |
|
RX 5500 XT |
85.64 |
59.43 |
31.17 |
|
RTX 3050 |
99.56 |
68.99 |
36.98 |