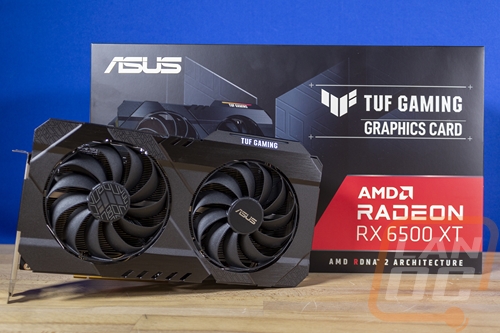
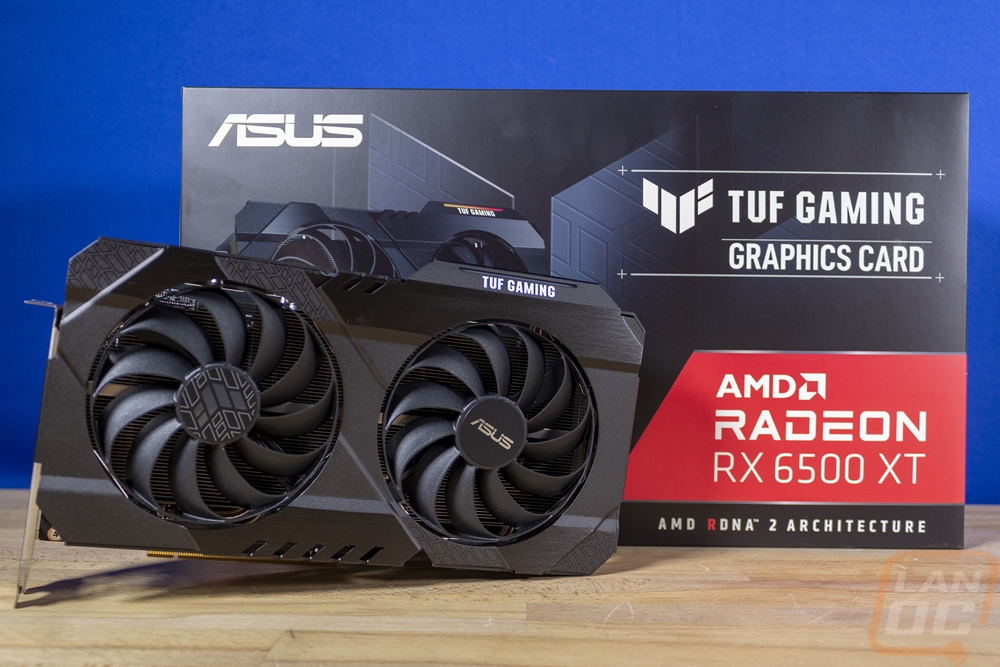
The launch of the RX 6500 XT had a lot of public backlash due to some of the limitations of AMD's new GPU, specifically the 4GB VRAM and the PCIe lanes being limited to 4 lanes which combined hold the card back when it comes to higher resolutions and at times if you are running very high detail games at 1080p. That said, the card does still have a place in the market, you just need to be clear about what you plan on using the card for. It is also one of the only cards you can get new without crazy markups. So I was excited when Asus offered to send their TUF Gaming RX 6500 XT OC Edition over. Not to mention, even though I had a lot of experience with the TUF lineup years ago when it first came out on motherboards. I’ve never had the chance to check out any of the TUF cards. So today I’m going to check out Asus’s card to see how the overclocked card performs and I’m especially curious to see what sets the TUF lineup apart and how it performs in things like cooling, noise, and power usage that help set cards with the same GPUs apart. So let’s check it out.
Product Name: Asus TUF Gaming RX 6500 XT OC Edition
Review Sample Provided by: Asus
Written by: Wes Compton
Amazon Affiliate Link: HERE
|
Specifications |
|
|
Graphic Engine |
Radeon RX 6500 XT |
|
Bus Standard |
PCI Express 4.0 |
|
OpenGL |
OpenGL®4.6 |
|
Video Memory |
4GB GDDR6 |
|
Engine Clock |
OC mode: up to 2825 MHz(Boost Clock)/ up to 2705 MHz(Game Clock) Gaming mode: up to 2825 MHz(Boost Clock)/ up to 2685MHz(Game Clock) |
|
Stream Processors |
1024 |
|
Memory Speed |
18 Gbps |
|
Memory Interface |
64-bit |
|
Resolution |
Digital Max Resolution 7680 x 4320 |
|
Interface |
Yes x 1 (Native HDMI 2.1) Yes x 1 (Native DisplayPort 1.4a) HDCP Support Yes (2.3) |
|
Maximum Display Support |
2 |
|
NVlink/ Crossfire Support |
Yes |
|
Accessories |
1 x Speedsetup Manual |
|
Software |
ASUS GPU Tweak II & Drivers: please download all software from the support site. |
|
Dimensions |
250 x 147 x 54 mm 9.76 x 5.78 x 2.12 inch |
|
Recommended PSU |
500W |
|
Power Connectors |
1 x 6-pin |
|
Slot |
2.7 Slot |
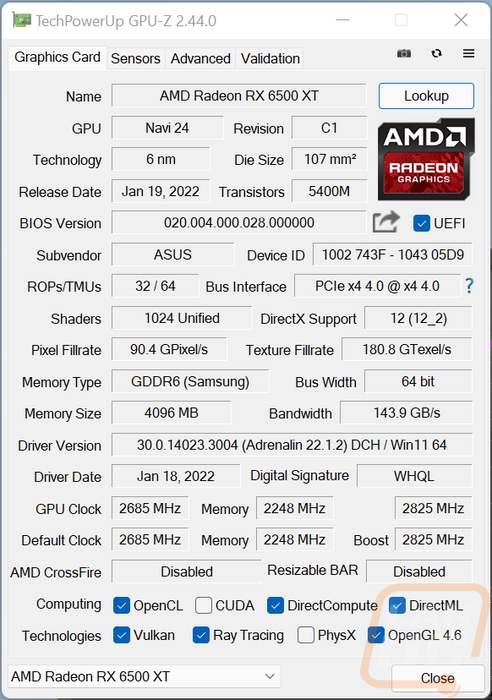
Before getting into testing I did also run GPUz to double-check that our clock speeds match up with the specifications. The TUF has a boost clock of 2825 MHz which did match up in GPUz and is also the same clock speed as the Sapphire 6500XT card that I previously took a look at as well. For the driver, I tested using the 6500XT launch driver. GPUz also notes what BIOS revision we have as well for future reference.
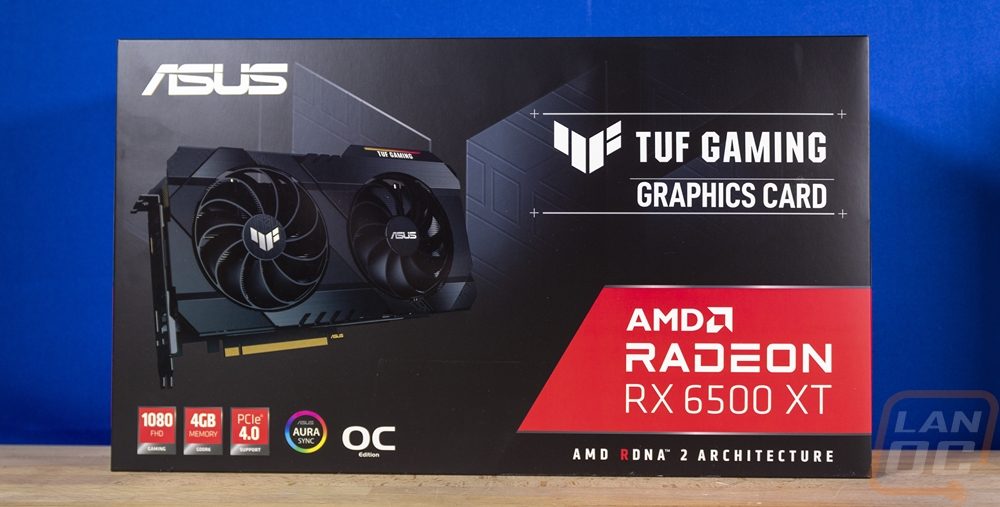
Packaging
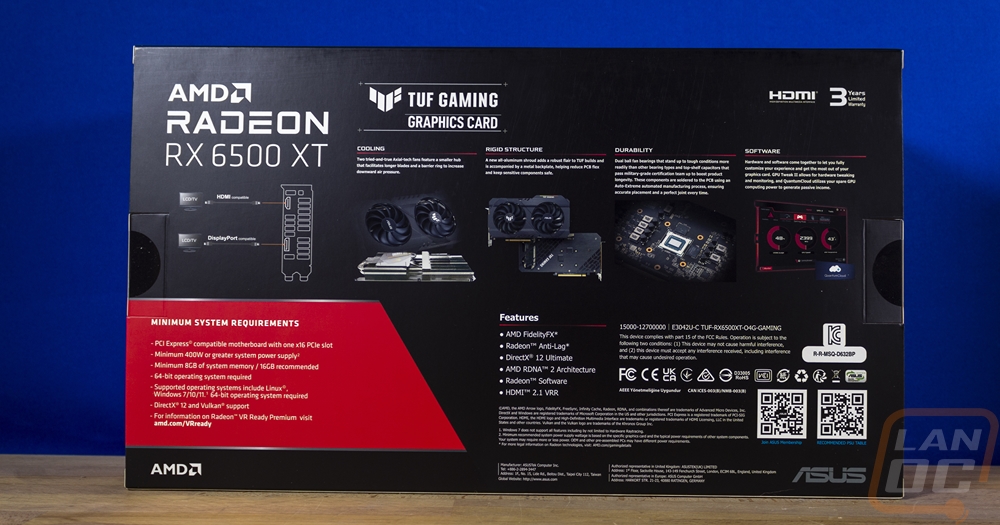
I was surprised that the TUF RX 6500 XT packaging didn’t have the armor-like packaging design that uses a lot of blacks and browns like some of the TUF products have done in the past. The TUF RX 6500 XT’s box does have a little bit of that design with the TUF logo in the black background but with it mostly being black combined with the Red wraparound that AMD requires it feels more like your standard black and red “gaming” theme. I love that Asus includes a picture of the card itself on the front which I don’t think enough boxes get these days. Beyond that, they have the TUF Gaming logo features and of course, the model name is in the red wrap-around. Around on the back of the box, there are more pictures of the TUF RX 6500 XT, each is there to go with a short paragraph description of a feature. There is also a line drawing of the PCI bracket to show the display connections and one picture of Asus’s software as well. I would love to see the card dimensions here and enough specifications that will at least let people know what the clock speed is for anyone shipping in retail. But overall Asus covers a lot of what you might be interested in.
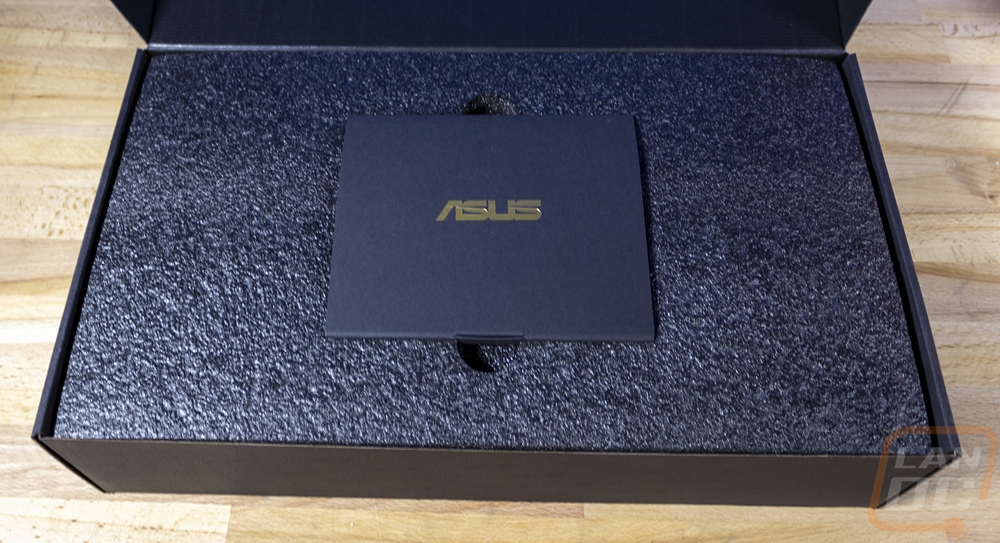
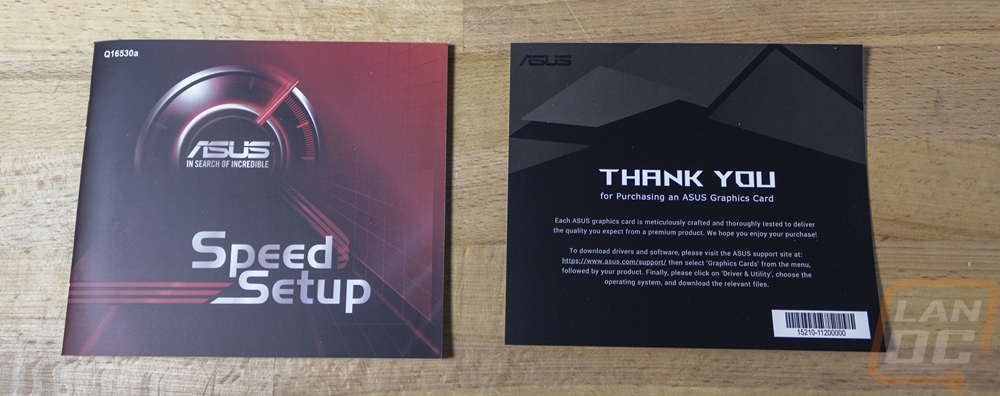
Inside the box, there is a second box. This one is a thicker cardboard. When you get inside there is foam all across the top and a small envelope on top with the documentation. Asus includes a card with a thank you card and a small setup guide book.
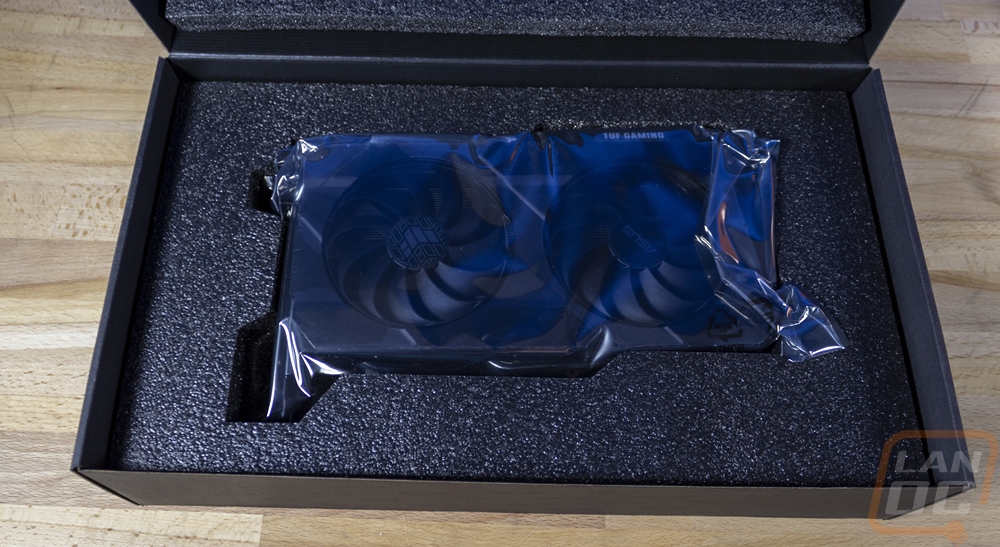
In addition to the static protective bag, the card itself does come with the full shroud wrapped up in plastic as well.
Card Layout and Photos
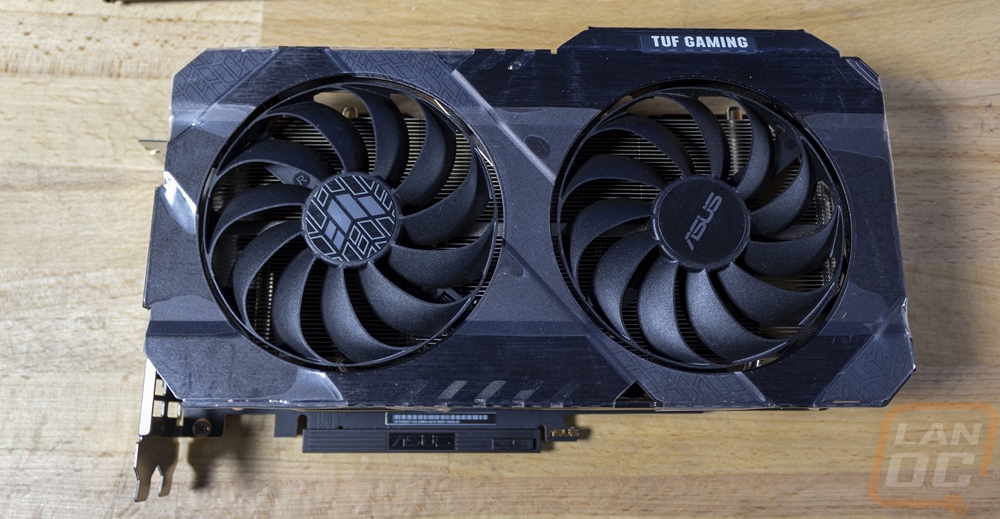
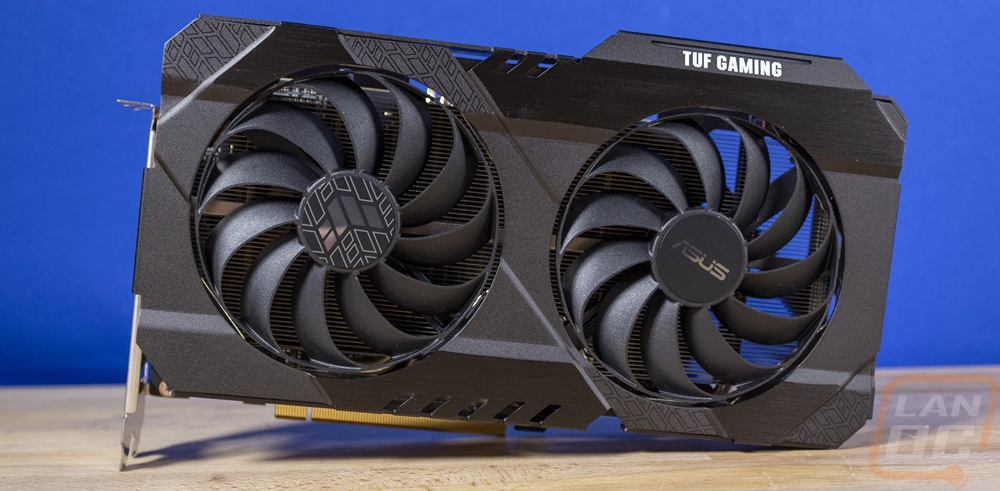
While the packaging for the TUF RX 6500 XT reminded me of an older gaming box, not the TUF line. The card itself is a much bigger departure from the norm. Asus’s ROG cards have been mostly focused on the black and grey very angular design. The TUF RX 6500 XT does share some of that, but it is also a lot more flattened out. They use multiple materials on the fan shroud and different colors to add depth, but overall the fan side is flat. The reason for that and what really makes this a TUF card is because the fan shroud is actually metal, not plastic like almost every other card on the market these days. Years ago MSI and XFX at one point hard metal fan shrouds and I loved that. So I was excited to see that was part of the focus with the TUF lineup for the TUF RX 6500 XT. They have given the shroud a brushed finish in some areas and down the center it has a media blasted finish that gives it contrast. Then in a few areas, it also has the tire tread looking TUF logo shape including on one of the fans center sections.
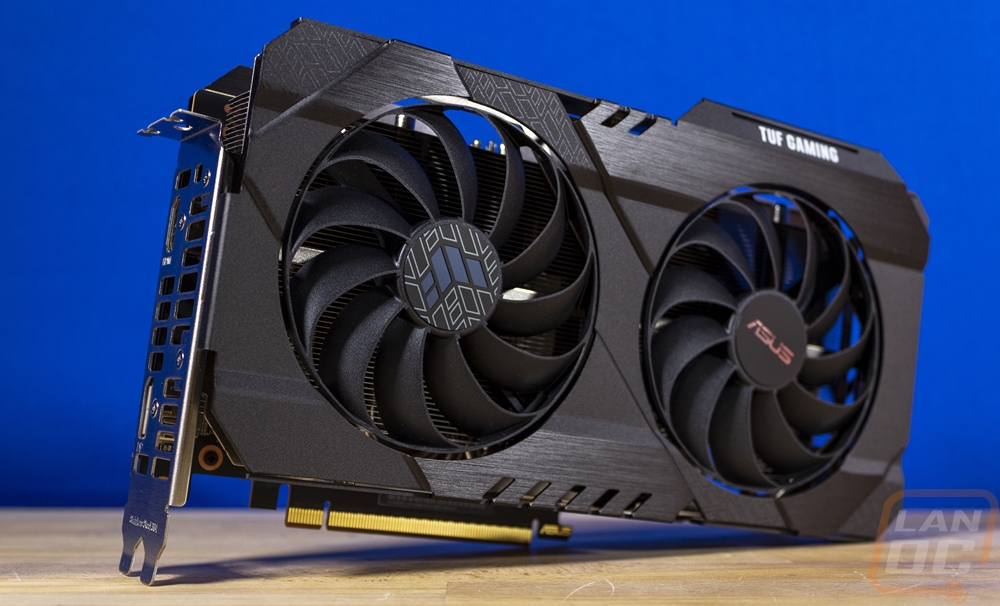
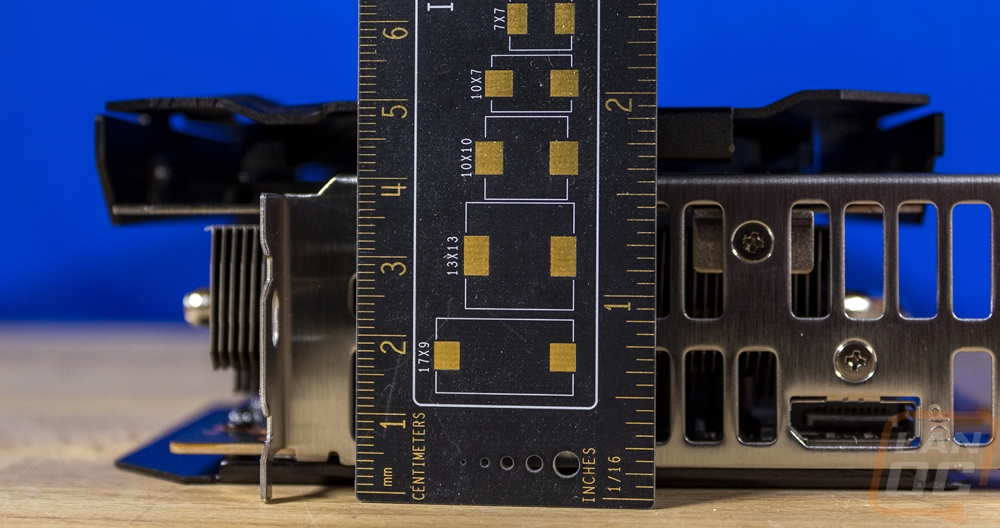
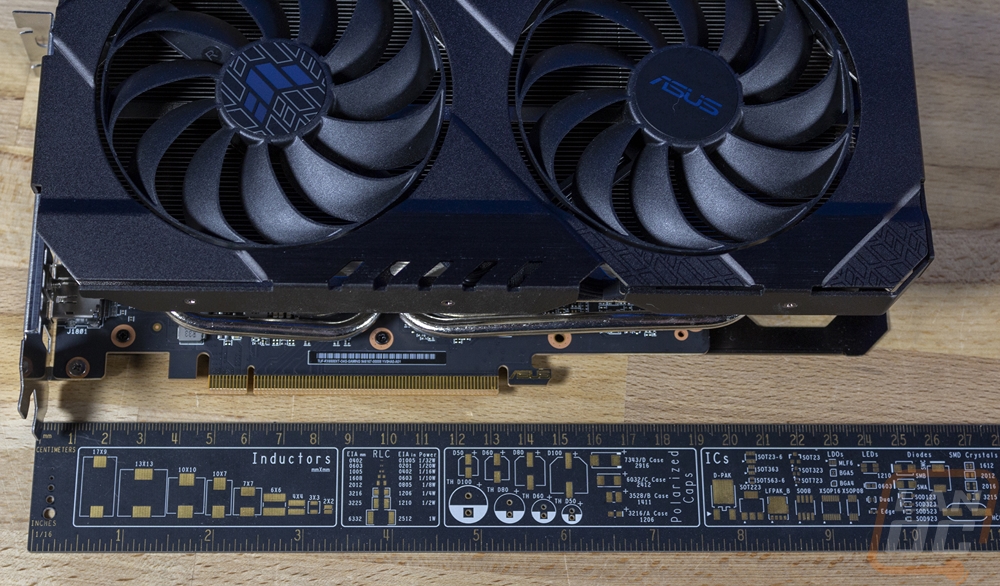
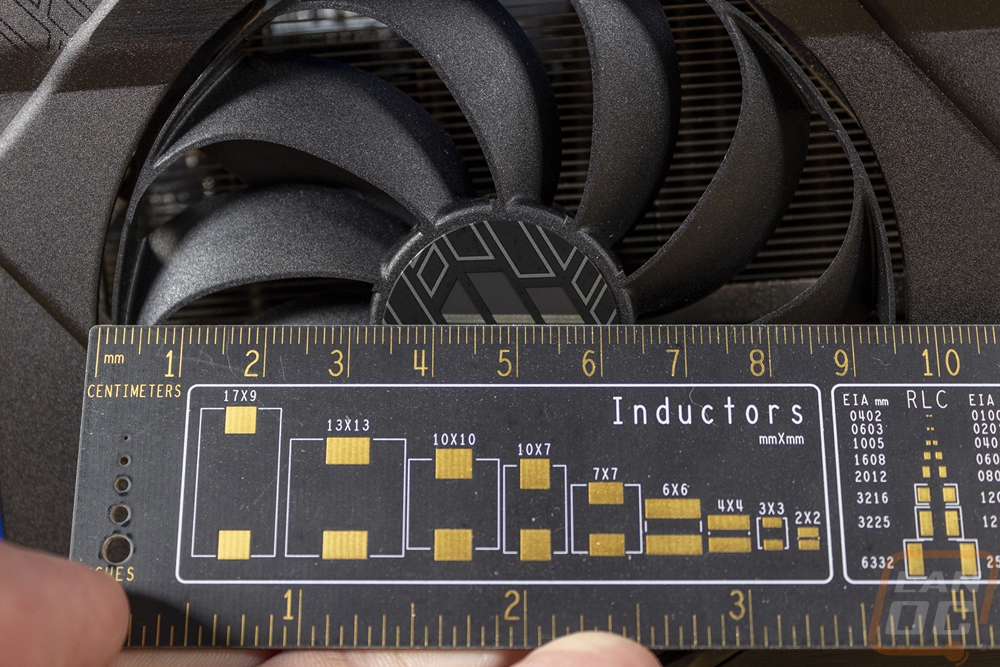
The flatter shape makes this look like a little smaller card, but the TUF RX 6500 XT does still go beyond the standard PCI dimensions like most other cards. For the width, it is a two and a half slot card or 54mm. Then it is 250mm long and we can see that the PCB ends at just past 190mm. Then for height, the card is 147mm tall. It extends out past the height of the PCI bracket even on that end of the card and it is even taller down at the far end of the card where the shroud pops up and hides your power cables.
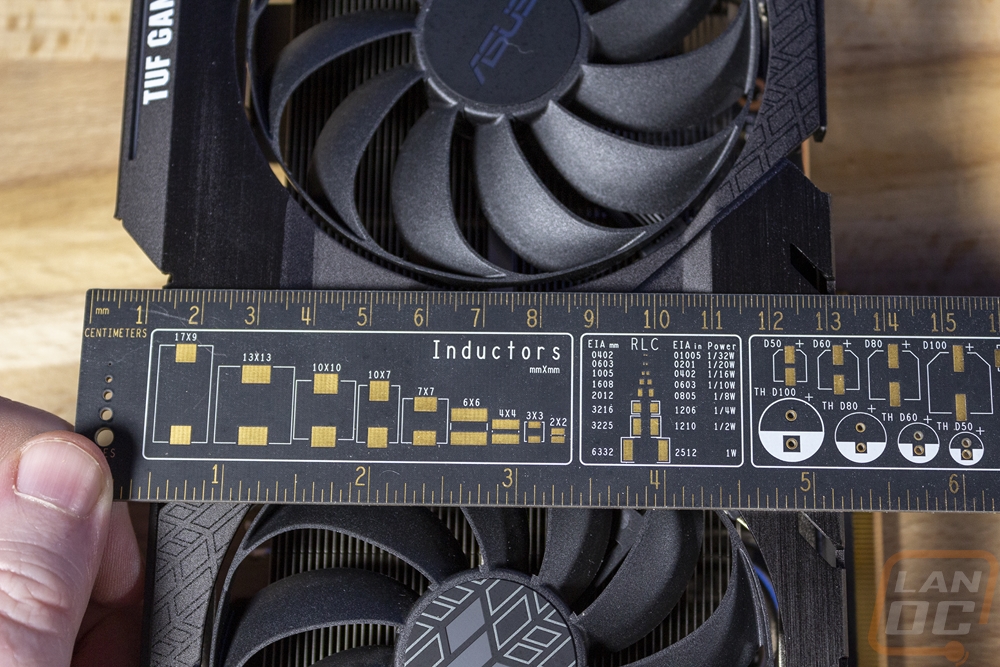
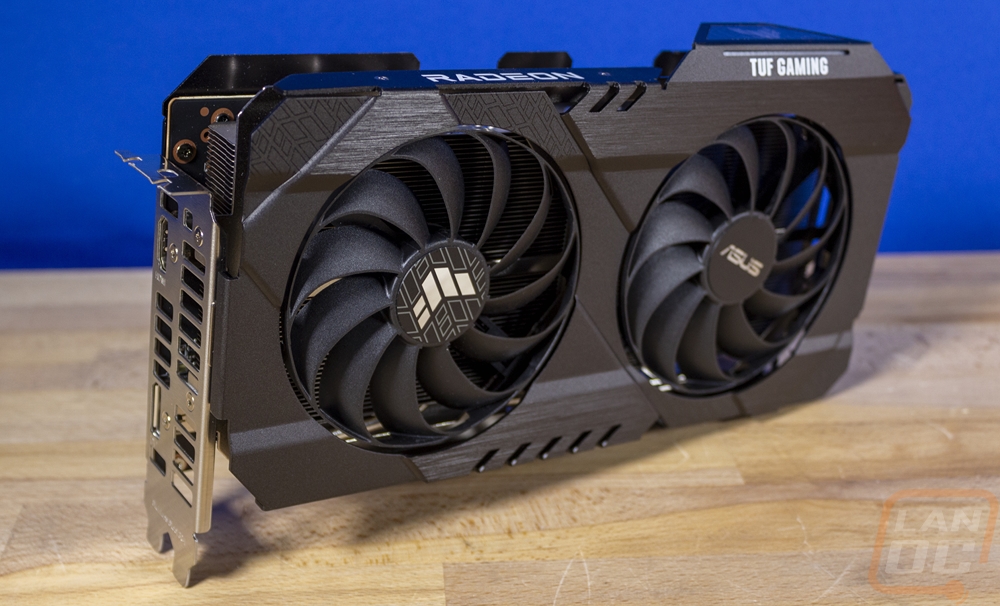
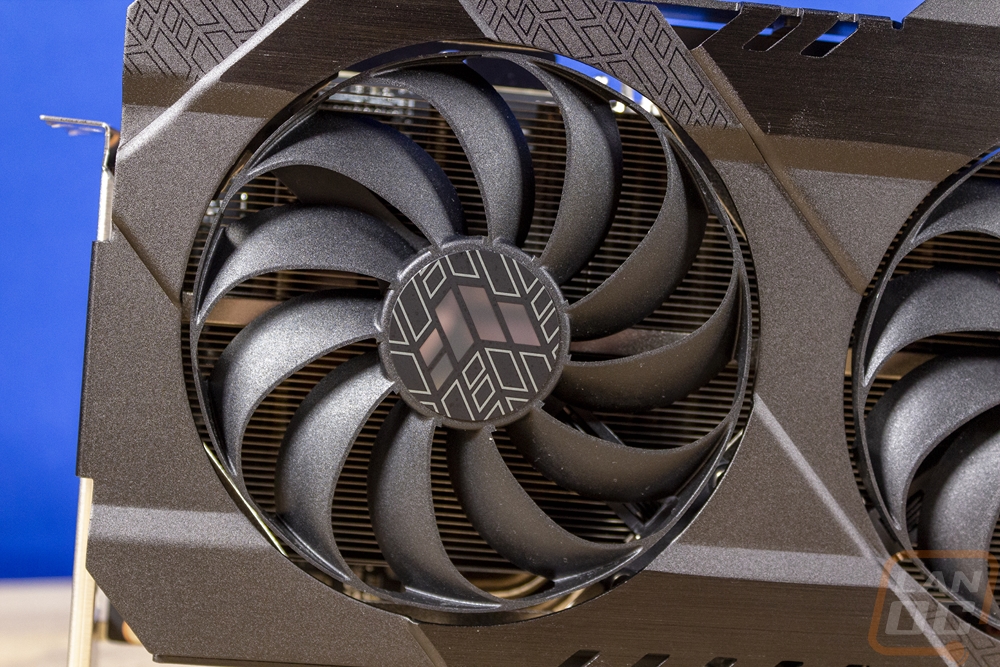
The metal fan shroud wouldn’t do much good without the fans that it is directing air for. The TUF Gaming 6500XT has two axial fans blowing air down into the heatsink and if we look closely we can see that the heatsink is an aluminum sheet metal design in a horizontal layout. So the air blown down into the heatsink will be focused down towards the ends of the card and through the back of the card past the end of the PCB. Both fans are 95mm wide and they have 11 blades with a heavy twist to the blades. At the end of the blades all of them are linked together for additional stability and to help direct the air down more than out. Then in the centers, both have stickers, the sticker of the left fan has the TUF logo in chrome and the right has the Asus logo also in chrome both with black backgrounds.
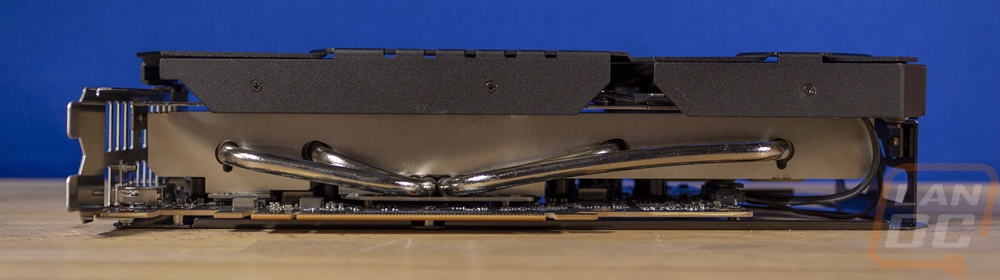
Looking around at the edges of the TUF Gaming 6500XT tells us a lot more about the cooling configuration. The bottom view shows the horizontal layout of the aluminum fins but it also shows the heatpipe layout well and If you look close you can see the heatspreader directly over top of the GPU. For heatpipes, the TUF Gaming 6500XT has four all right on top of the GPU. Two pull the heat over to the left side of the cooler and the other two go over to the right side of the card under that fan. The right heatpipes are more spread out with that side covering a much wider area. I was surprised that the fan shroud doesn’t wrap around more than it does given the horizontal layout but it does drop down to cover up to the heatsink. The end of the TUF Gaming 6500XT has the backplate that wraps around to attach to the fan shroud locking the metal housing altogether. The top view shows that the heatsink sits tight against the PCB in any area where there aren’t components and like the bottom the shroud covers around 1/3 of the gap which is enough to keep the fans blowing down but is more open than I would expect for a horizontal heatsink.
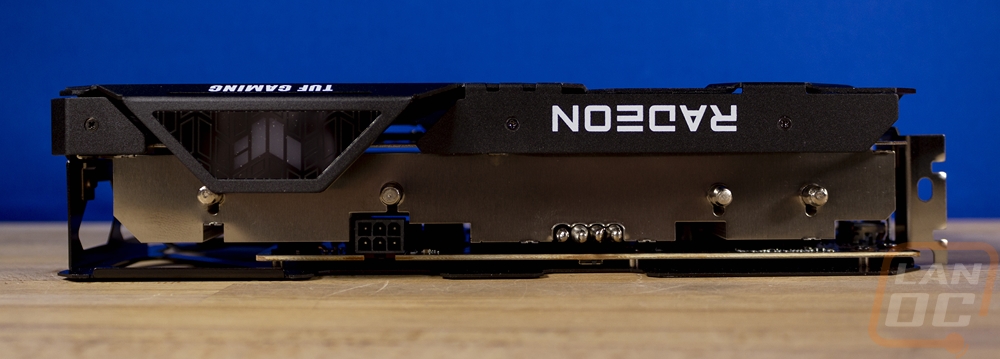
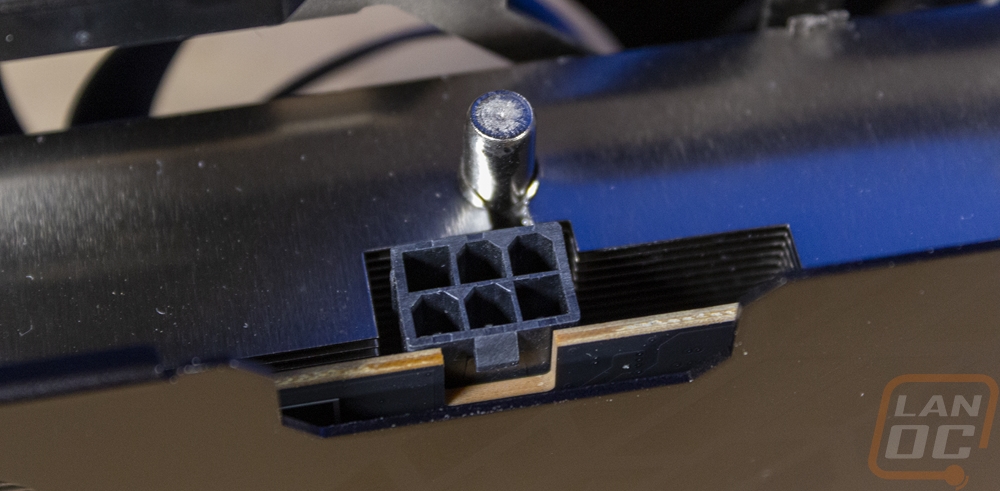
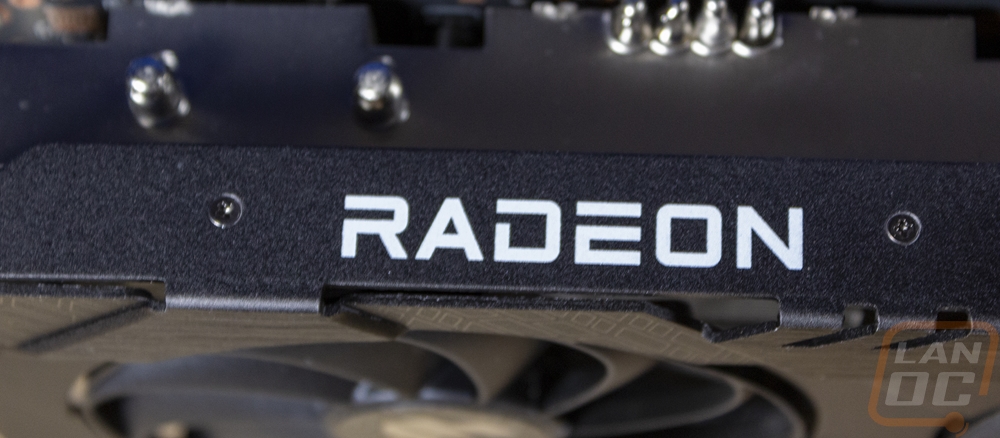
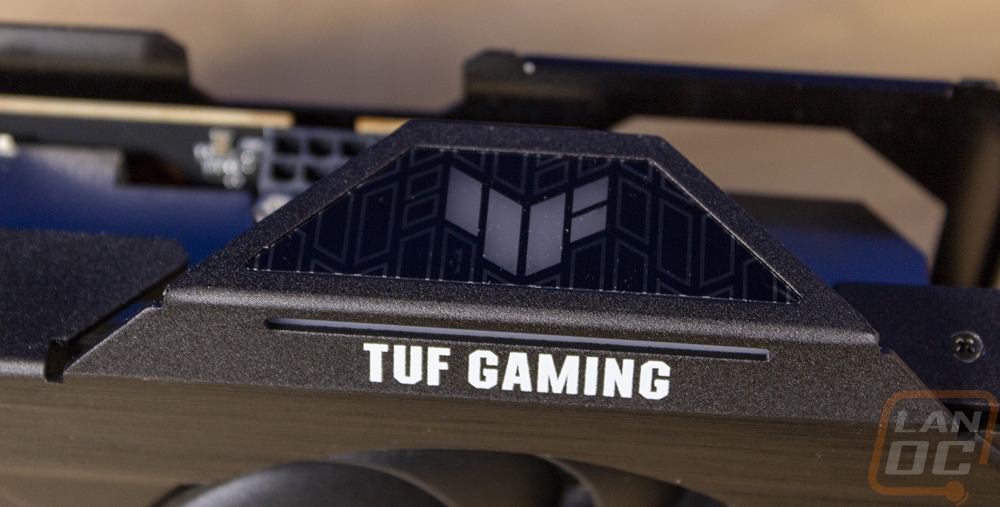
Up along the top edge of the card, the TUF Gaming 6500XT has a few things going on. Asus has printed the Radeon logo in white on the top edge of the fan shroud and near the end of the card, the shroud also juts out farther and has the TUF Gaming branding with the name and logo. The logo on top is backlit with RGB lighting as well as a small strip above the text as well. The top edge also has the power connection which for the TUF Gaming 6500XT is just a single 6-pin power, the same as the Sapphire had as well. Then farther down the card they also have a small switch on the top edge to flip between P and Q mode which is performance and quiet modes for the fan profiles.
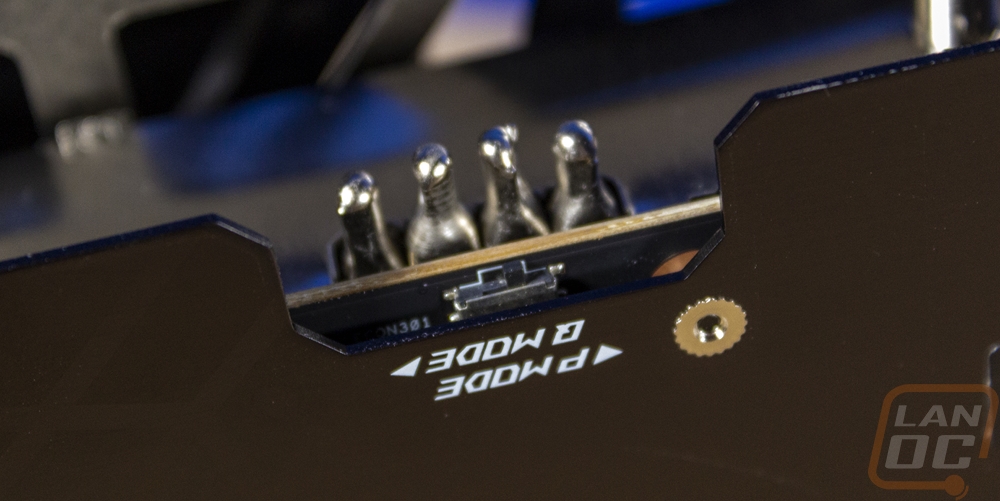
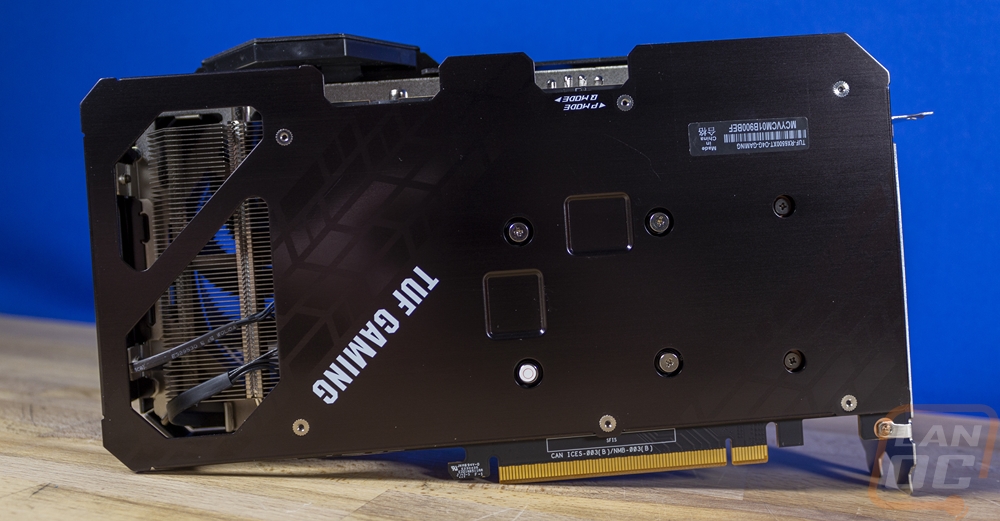
The back of the TUF Gaming 6500XT has a full-length metal backplate. This fits with the TUF branding but was still a surprise, a lot of lower-end cards skip the backplate. But so far both 6500XT’s that we have had in the office have had them. For the TUF Gaming 6500XT, it has what looks like tire tread marks running across the back printed on with a glossy finish to stand out from the brushed black texture of the rest of the backplate. Then below that, they have the TUF Gaming branding in white flipped around so it is visible best when installed. The backplate runs past the end of the PCB and has two large cutouts at the end for the air from the second fan to blow through. Asus also has it notched up at the top for the power connections and the performance and quite BIOS switch.
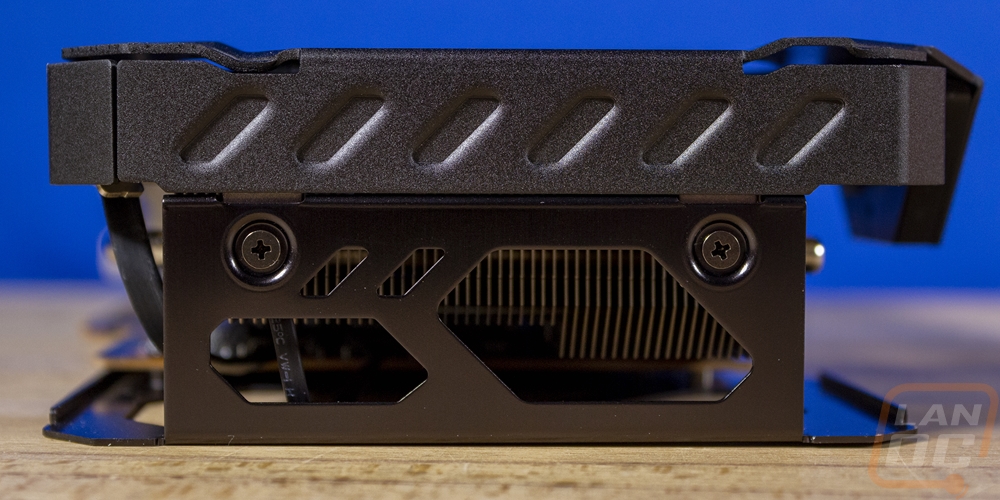
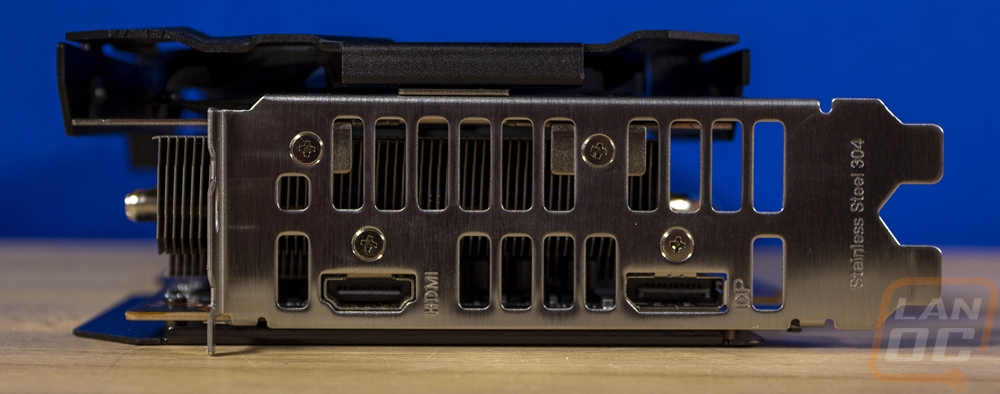
For display connections, the TUF Gaming 6500XT has the same two connection configurations that all 6500XT’s have. That is a single HDMI and one DisplayPort which is half as many as most cards have these days. But the 6500XT is originally a mobile GPU and when you keep that in mind it makes sense, most laptops have the monitor and one external connection if you are lucky. The rest of the PCI bracket is covered in large air vents which given the horizontal heatsink layout should be very helpful.
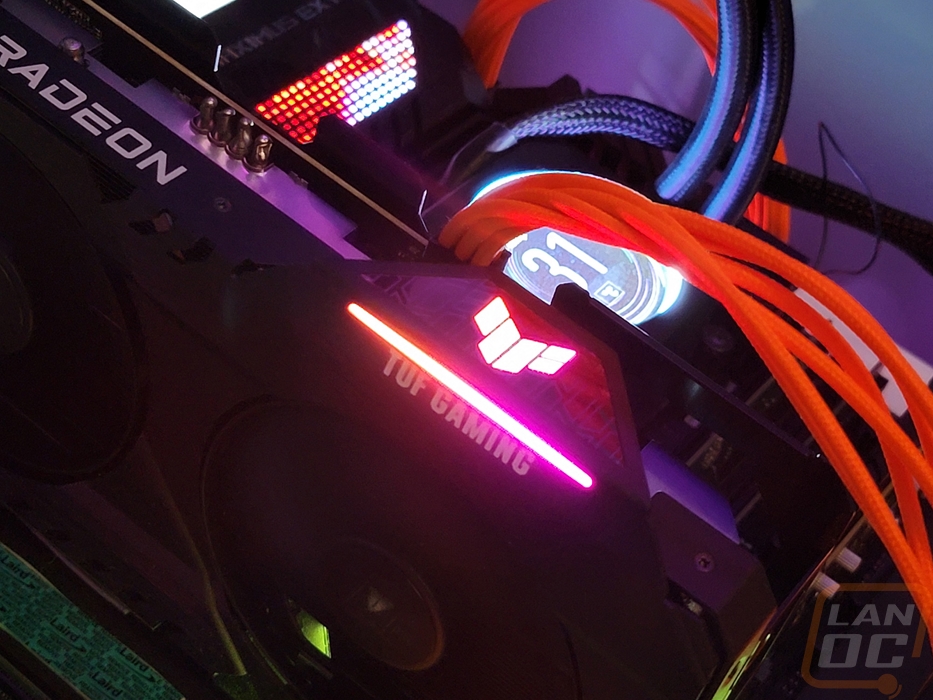
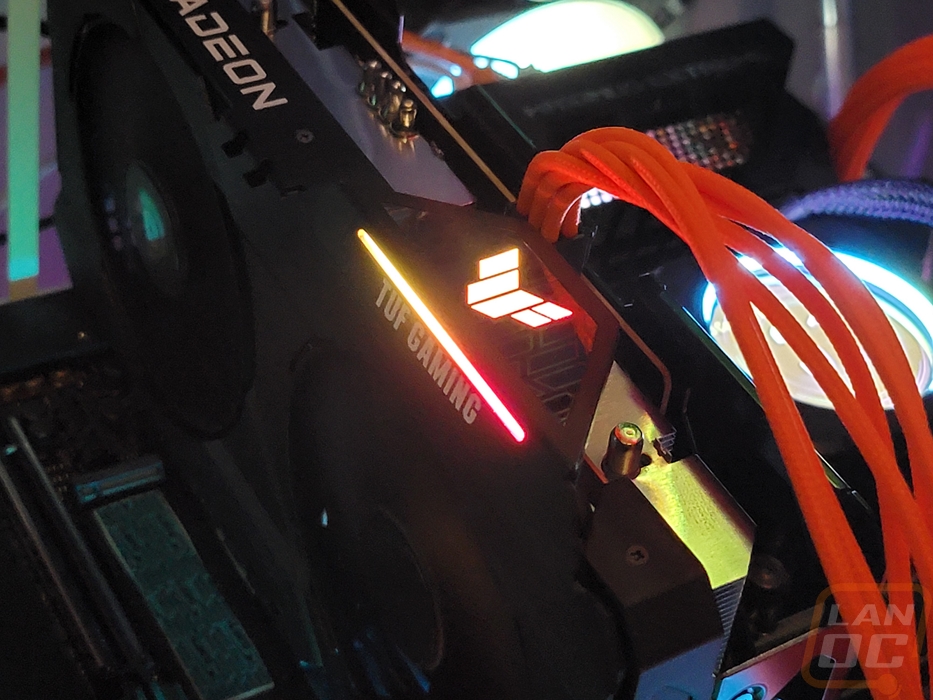
For the lighting on the TUF Gaming 6500XT, everything is all in just the one area on the end of the top edge of the card. They have the TUF logo lit up as well as a light bar on the angled section above the TUF Gaming that is printed on that area. I’m not a big fan of just backlit branding, but at least it is the logo, not the text. More accents like the light bar under the logo would be nice as well.
Test Rig and Procedures
Test System
CPU: Intel Core-i9 12900K – Live Pricing
Motherboard: Asus ROG Maximus Z690 Extreme – Live Pricing
Cooling: Corsair H100i Elite LCD Display - Live Pricing
Noctua NT-H1 Thermal Paste - Live Pricing
Memory: Micron Pre Launch DDR5 2x32GB – Live Pricing
Storage: Sabrent Rocket Q4 2TB – Live Pricing
Power Supply: Corsair AX1200 - Live Pricing
Case: Primochill Wetbench - Live Pricing
OS: Windows 11 Pro 64-bit - Live Pricing
|
Our Testing Procedures |
|
|
3DMark |
All 3DMark based tests are done using the most recent version. We test using all three versions of Fire Strike and both Time Spy and Time Spy Extreme. Tests to look at ray tracing performance is done with Port Royal when supported and for Nvidia cards that support DLSS, the DLSS subtest is also done at 1440p with the performance setting and DLSS 2.0. |
|
Unigine Superposition |
1080p Extreme and 4k Optimized benchmarks along with the VR Future test are done. The VR test is done at the Oculus resolution |
|
VRMark |
Only the Blue room test is run |
|
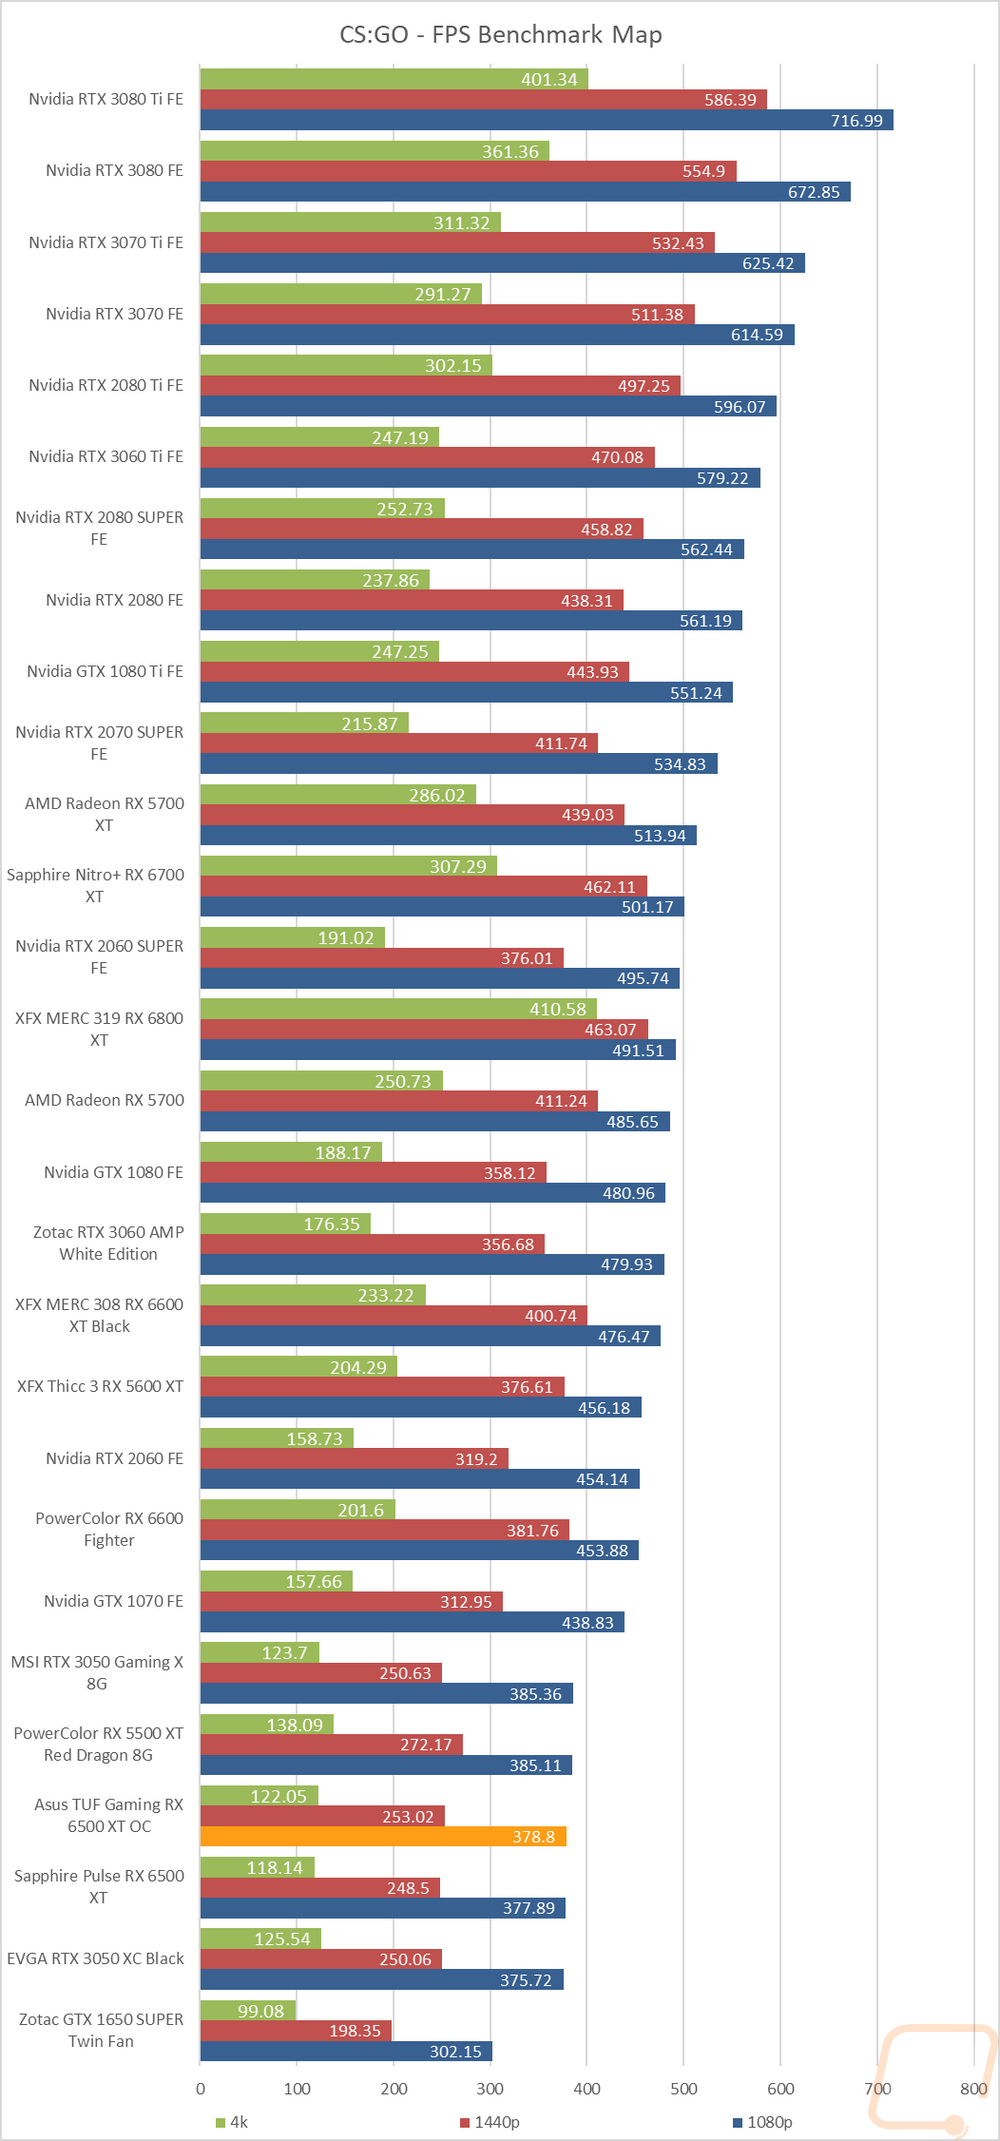
CS:GO |
This test is done using the workshop map called CS:GO Benchmark. You can find more information at this link. https://www.gamingpcbuilder.com/how-to-install-csgo-fps-benchmark-map/ I test at 1080p, 1440p, and 4K resolutions. All auto settings are turned off and detail is set to their highest settings. shadow quality high, model texture detail high, shader detail very high, AA set to 16x, uber shaders enabled |
|
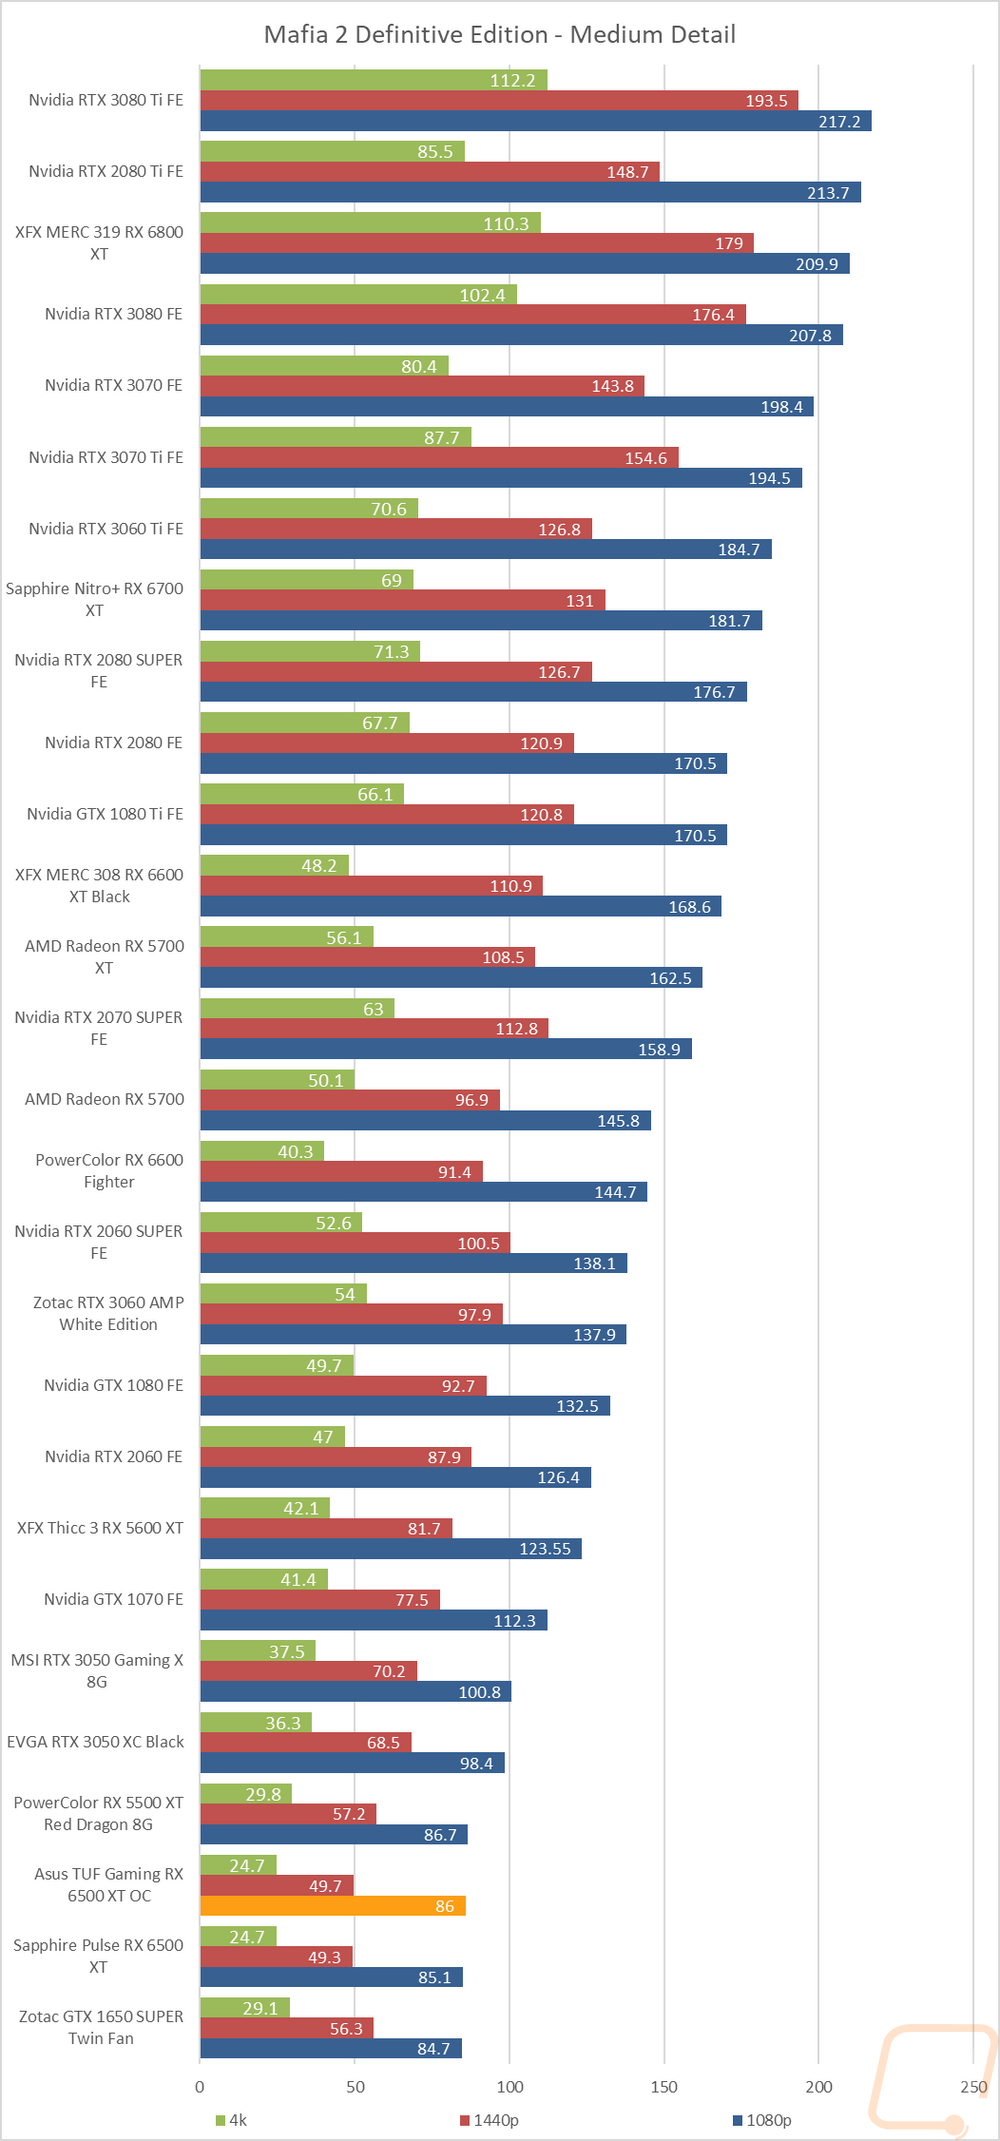
Mafia 2 Definitive Edition |
This uses the built-in benchmark to test at High and Medium detail presets at 1080p, 1440p, and 4K resolutions |
|
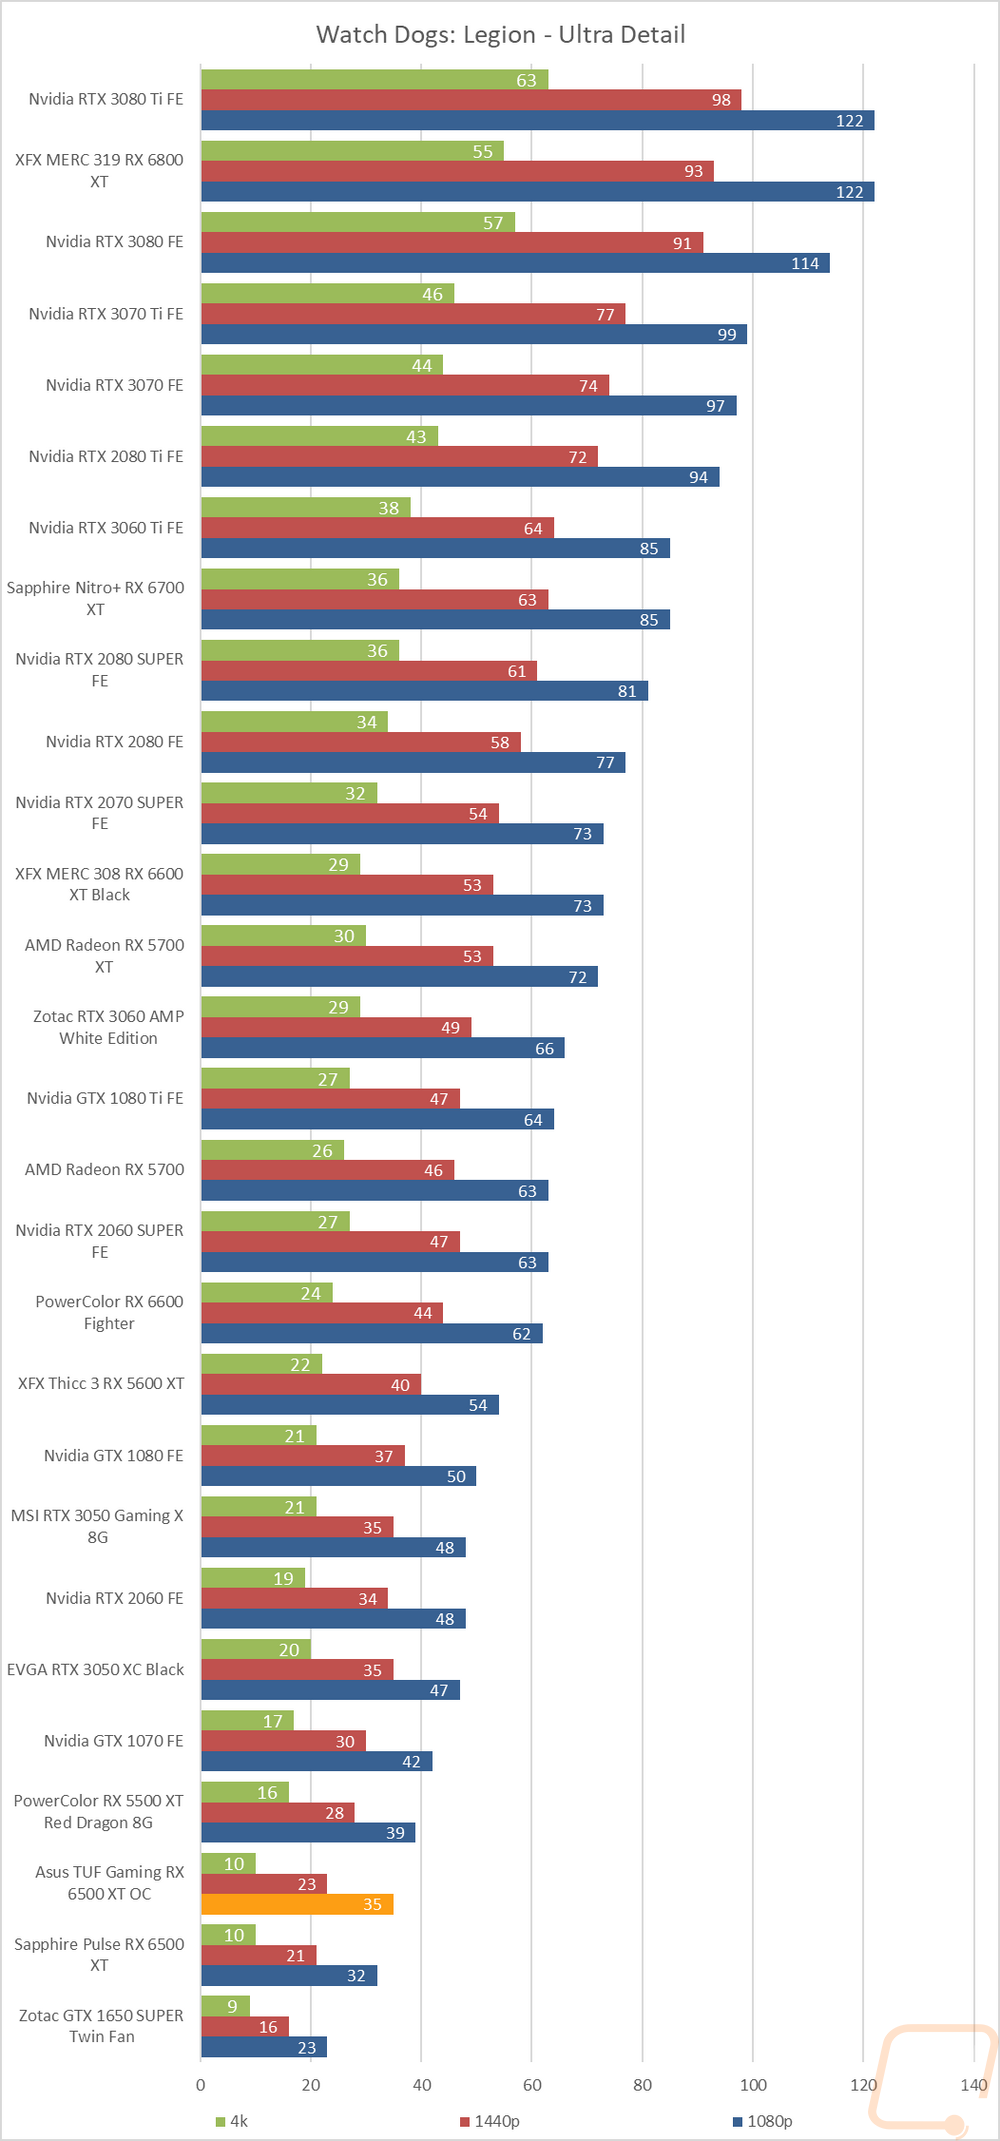
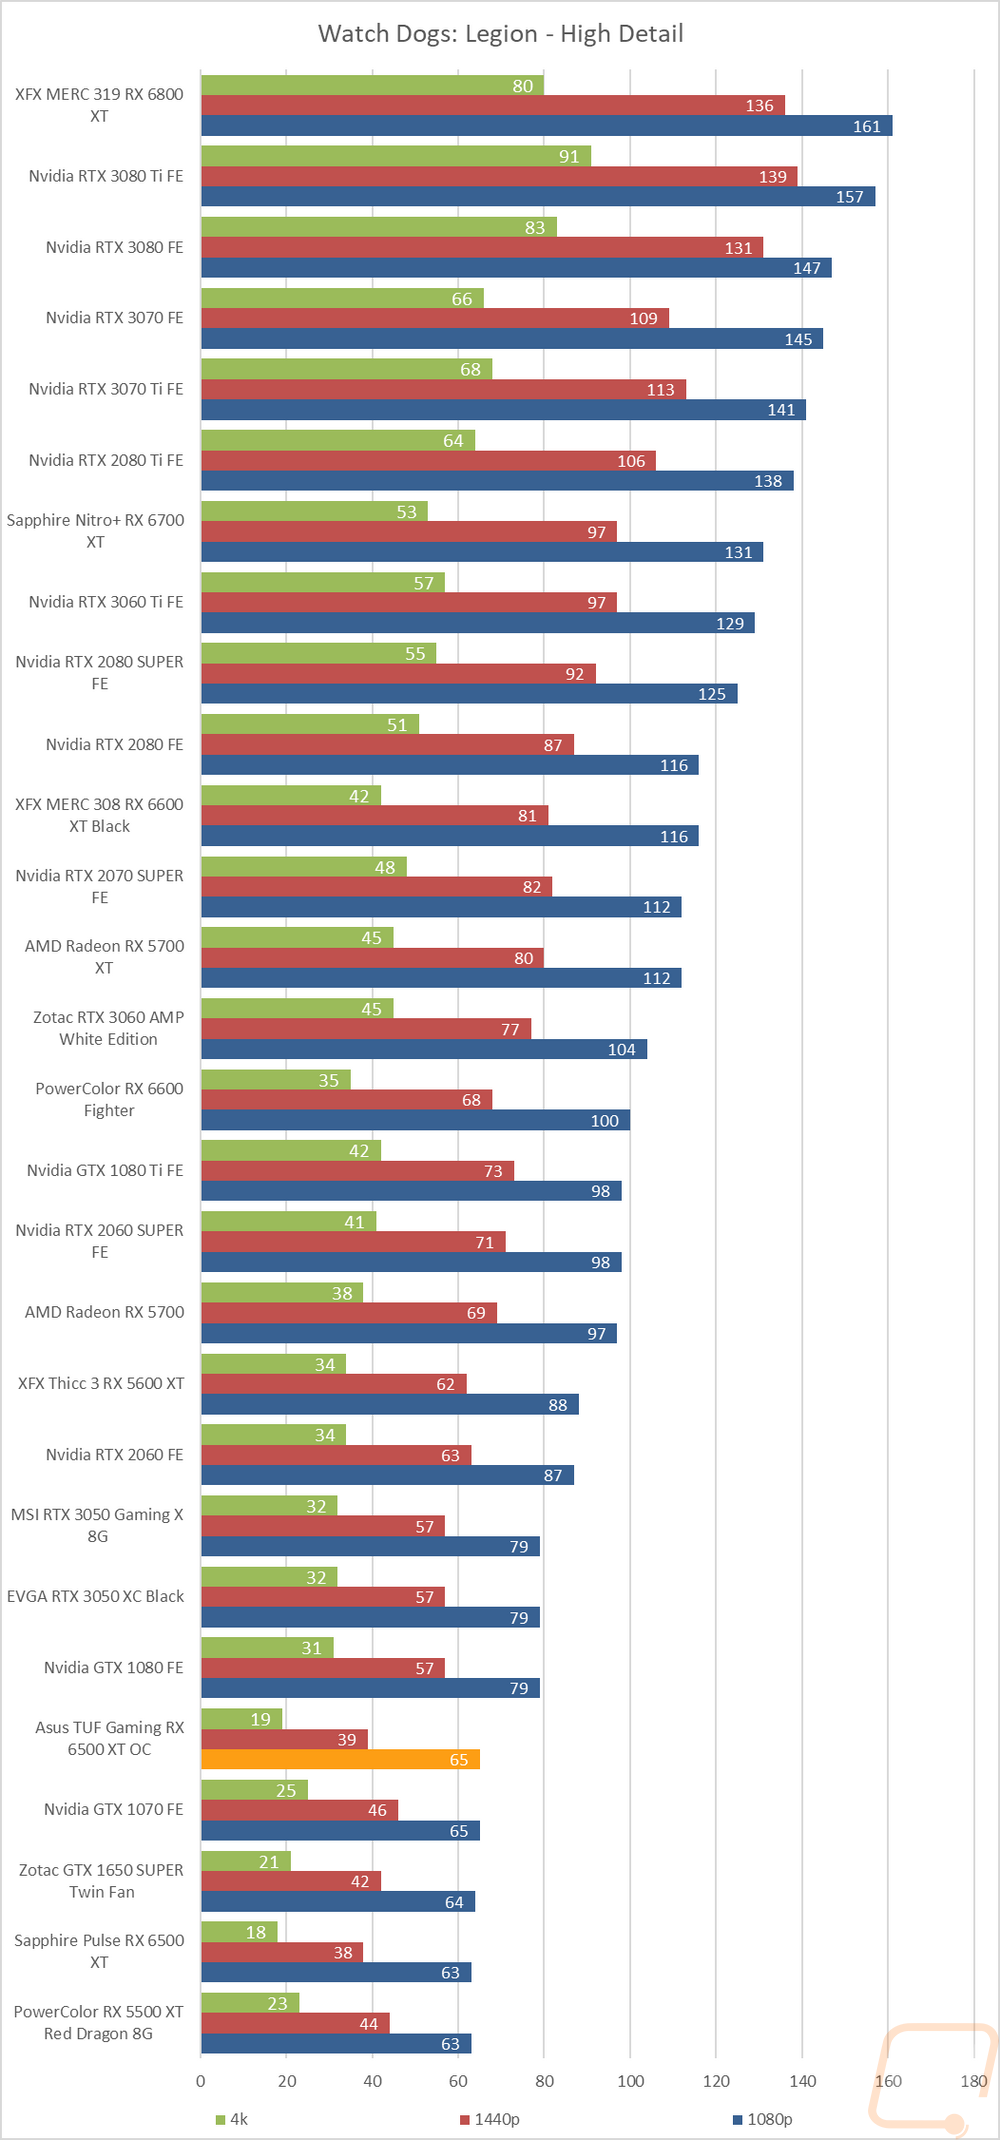
Watch Dogs: Legion |
Built-in benchmark testing at ultra and high details. Tested at 1080p, 1440p, and 4k. I also do RTX and DLSS testing on Nvidia cards at 4K using the Ultra detail settings as a base as well. |
|
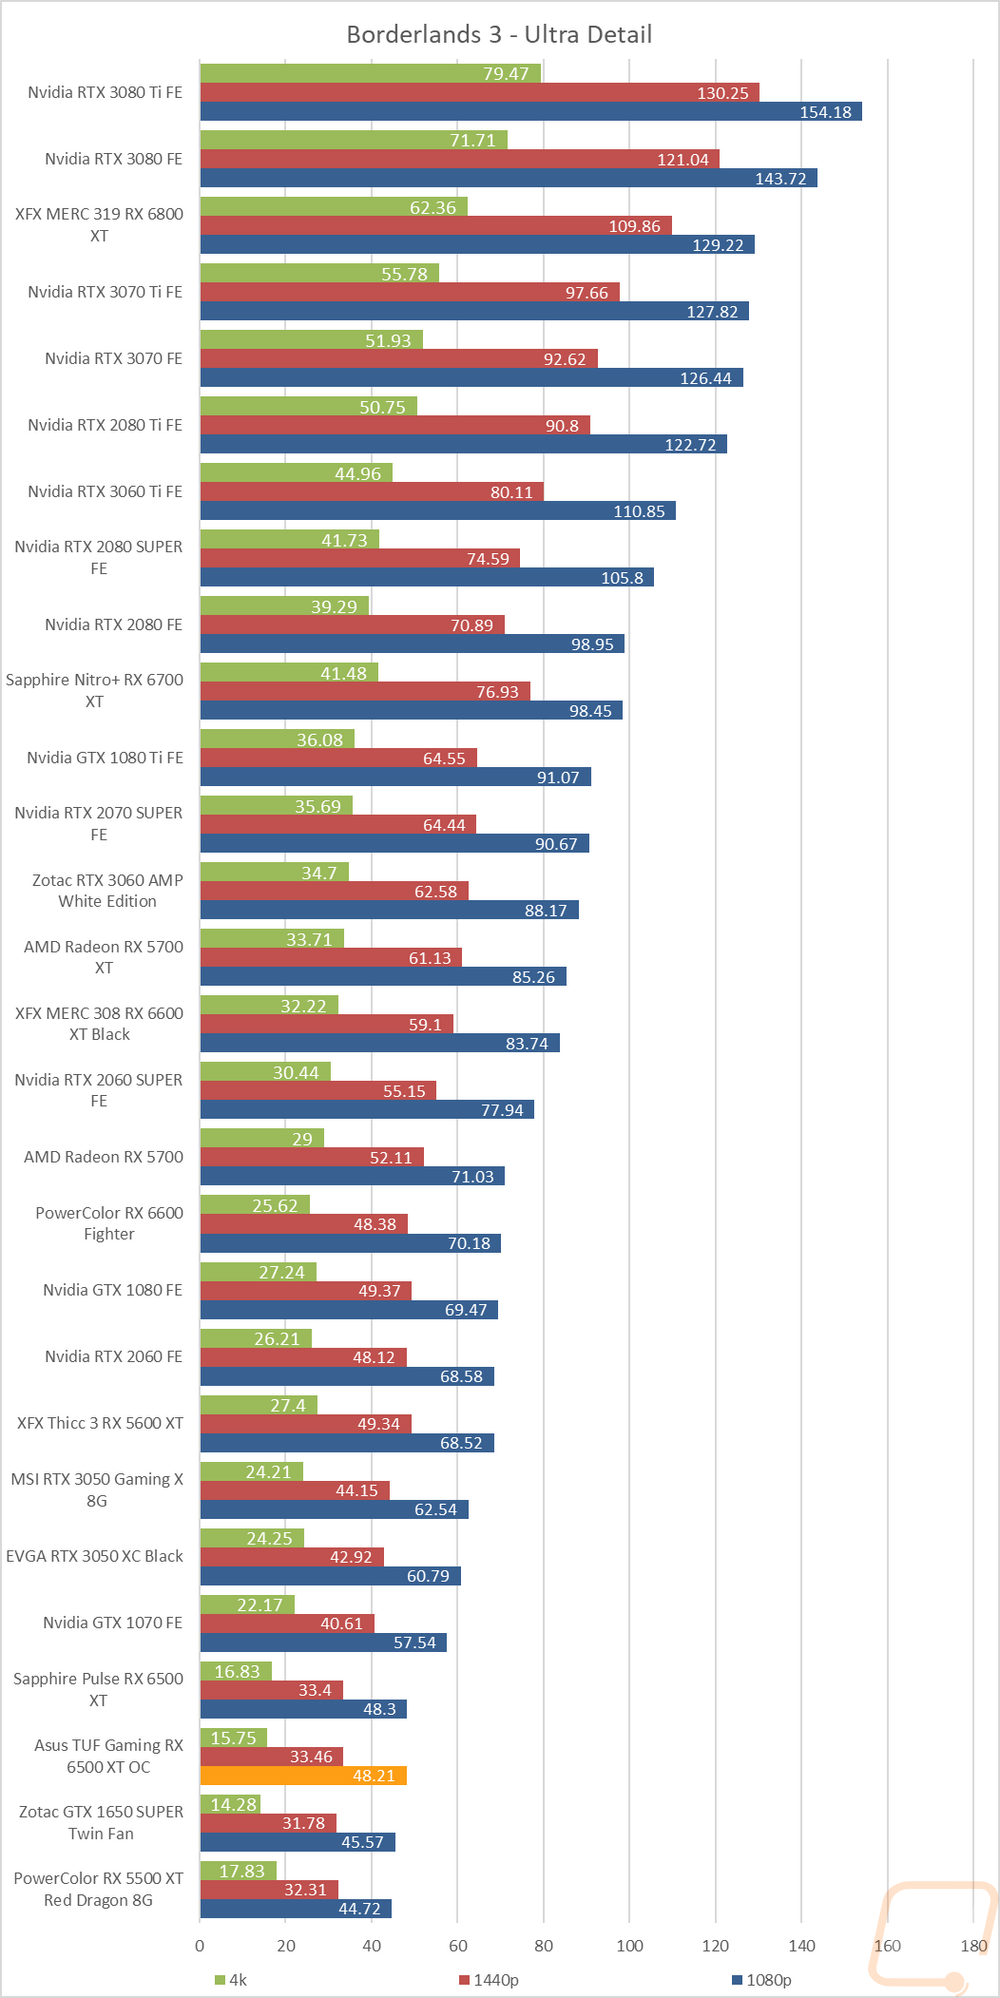
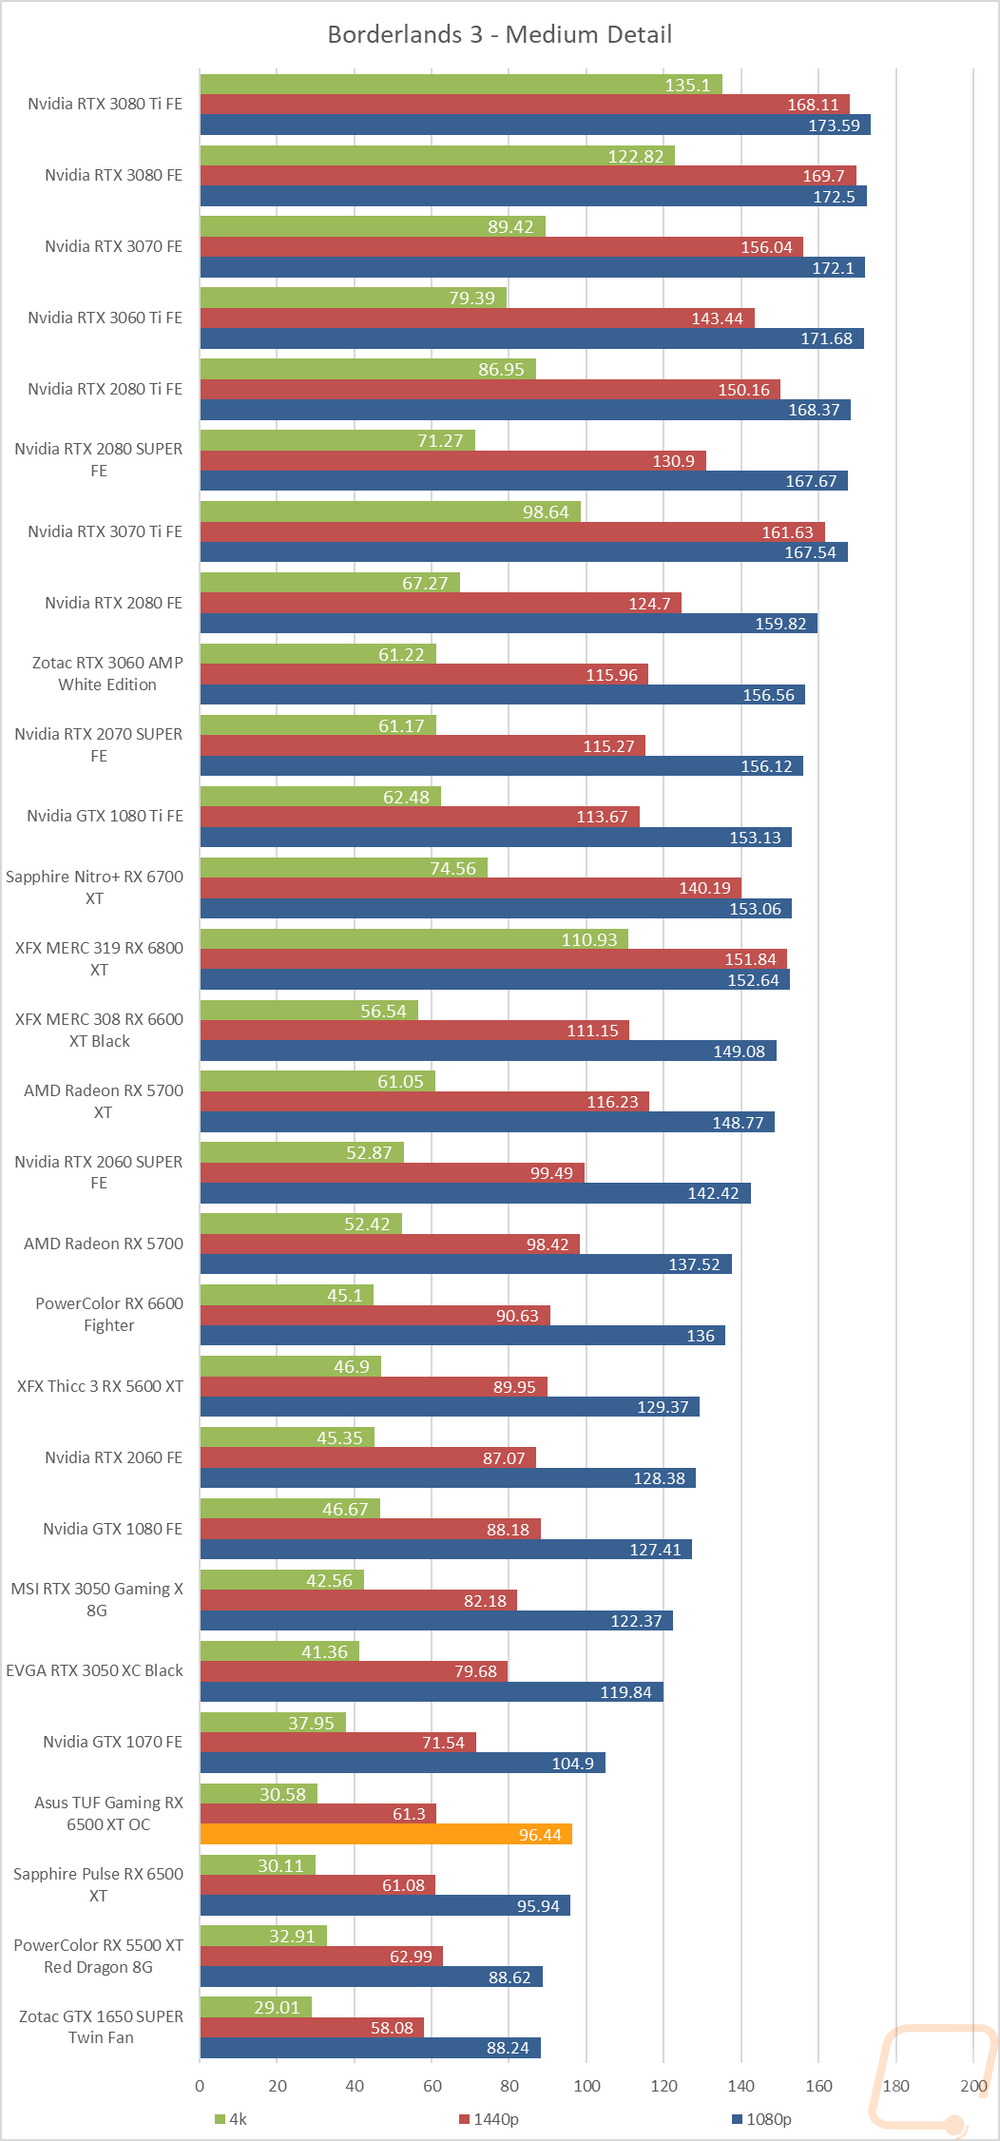
Borderlands 3 |
Built-in benchmark testing with the ultra detail setting and medium detail setting, done at full screen with default settings at 1080p, 1440p, and 4k on DX11 |
|
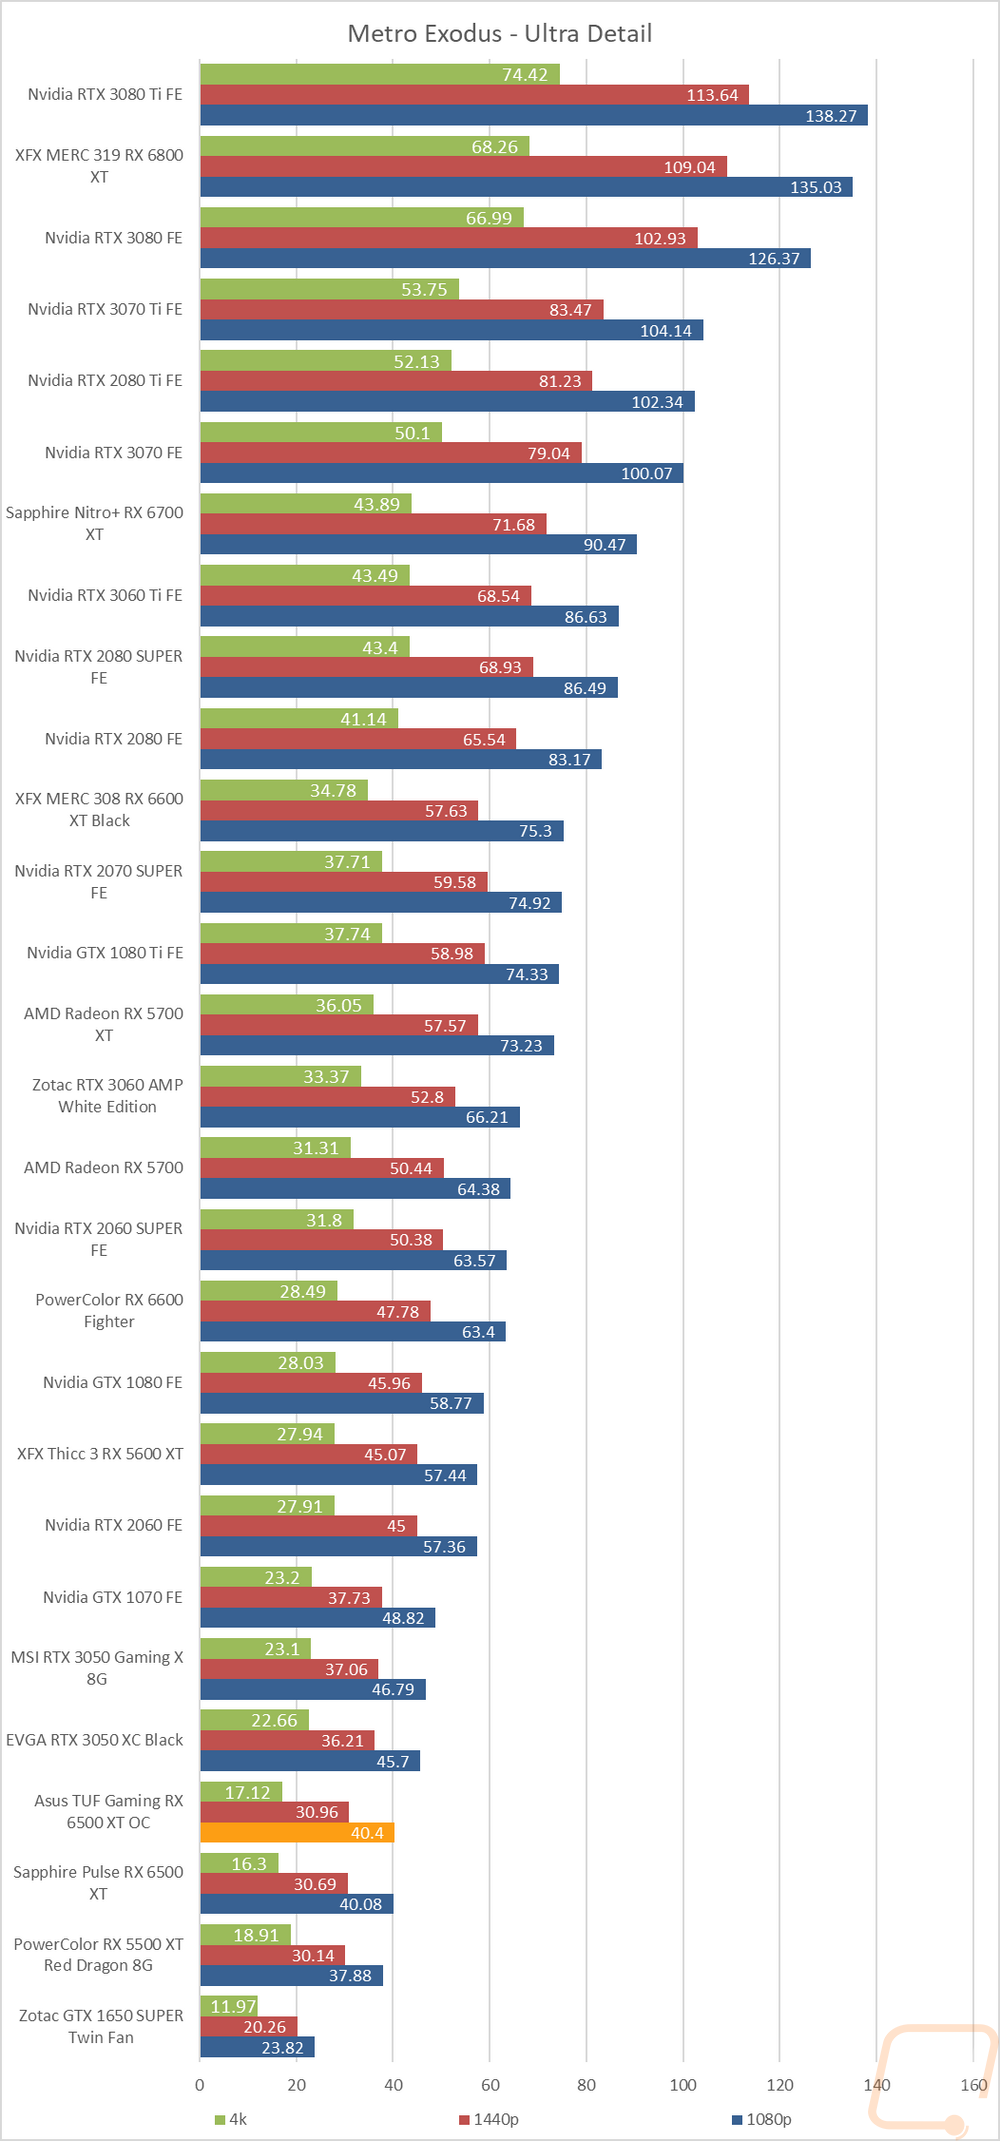
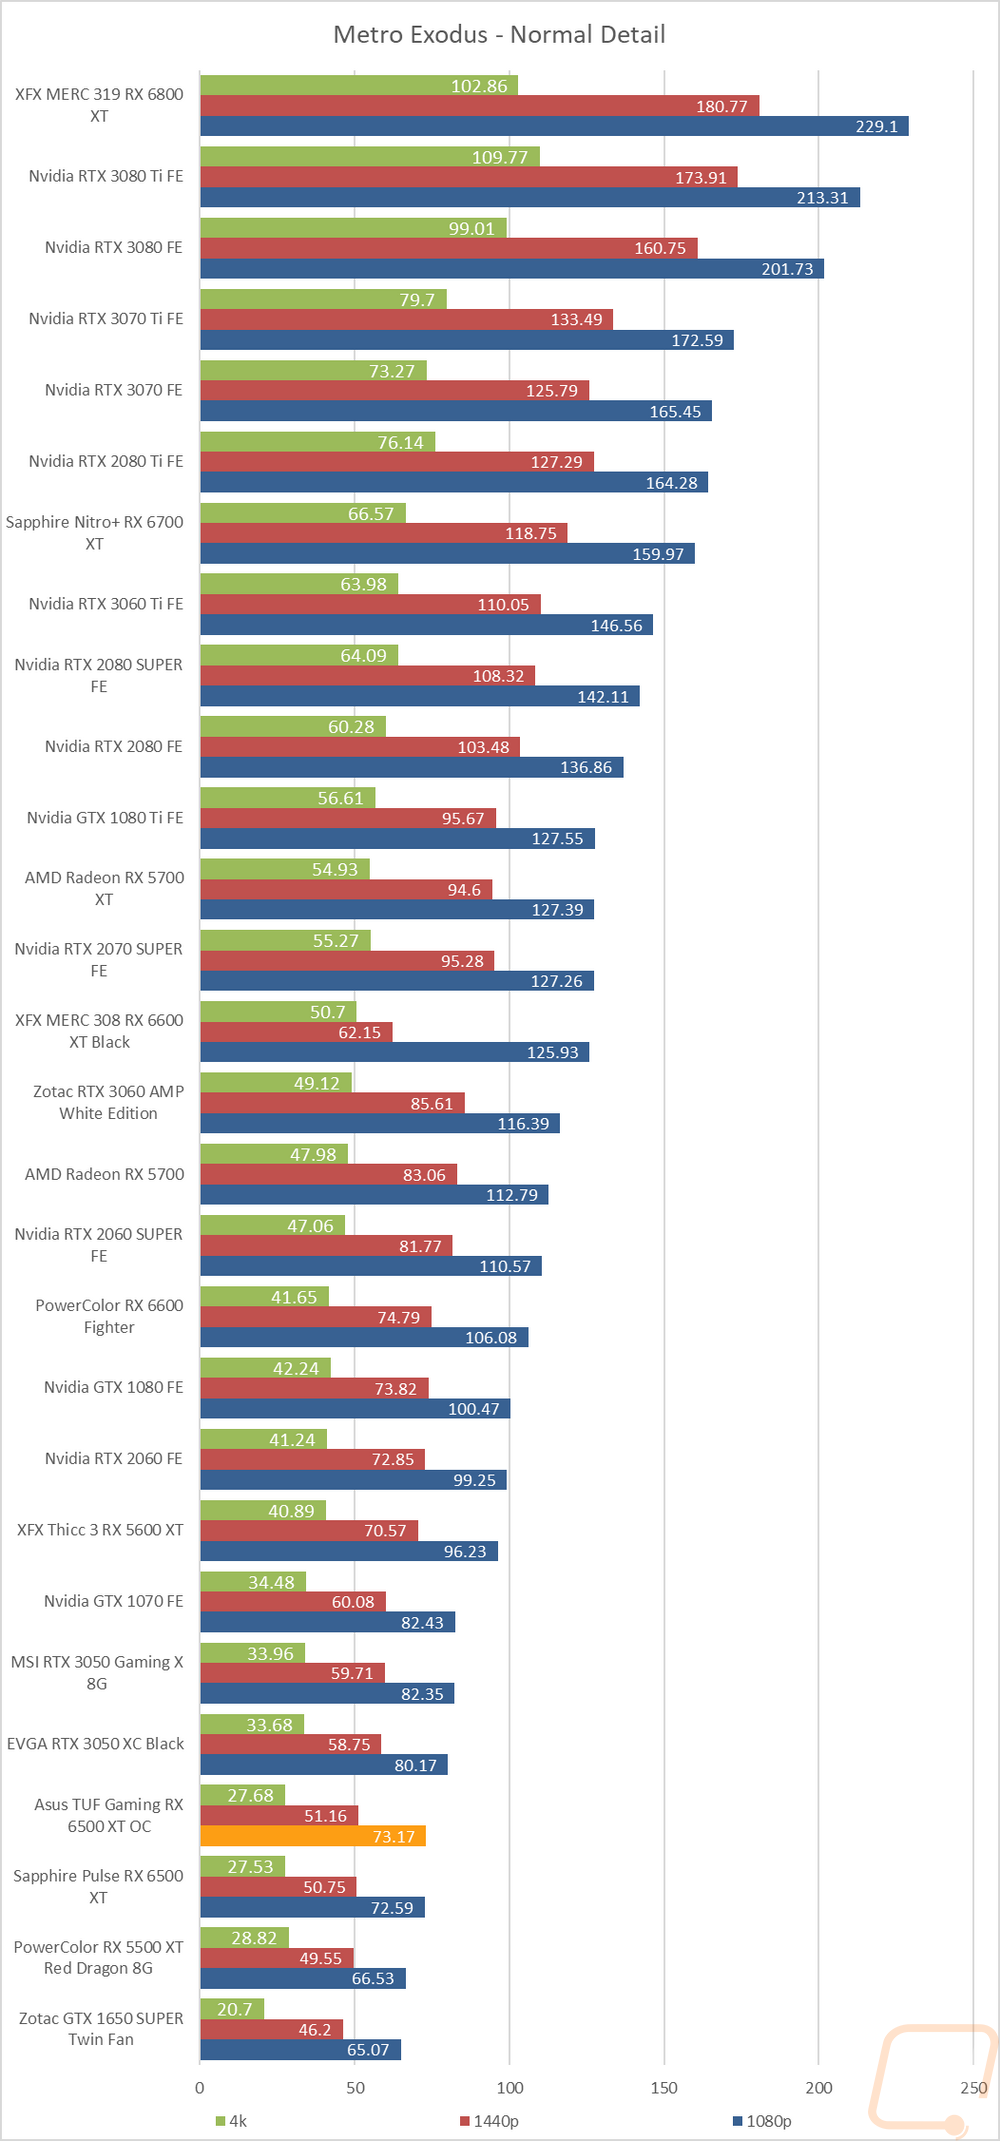
Metro Exodus |
Using built-in benchmark, testing at ultra and normal details at 1080p, 1440p, and 4k. I also do RTX and DLSS testing at 4K with the ultra detail base settings for Nvidia cards as well. |
|
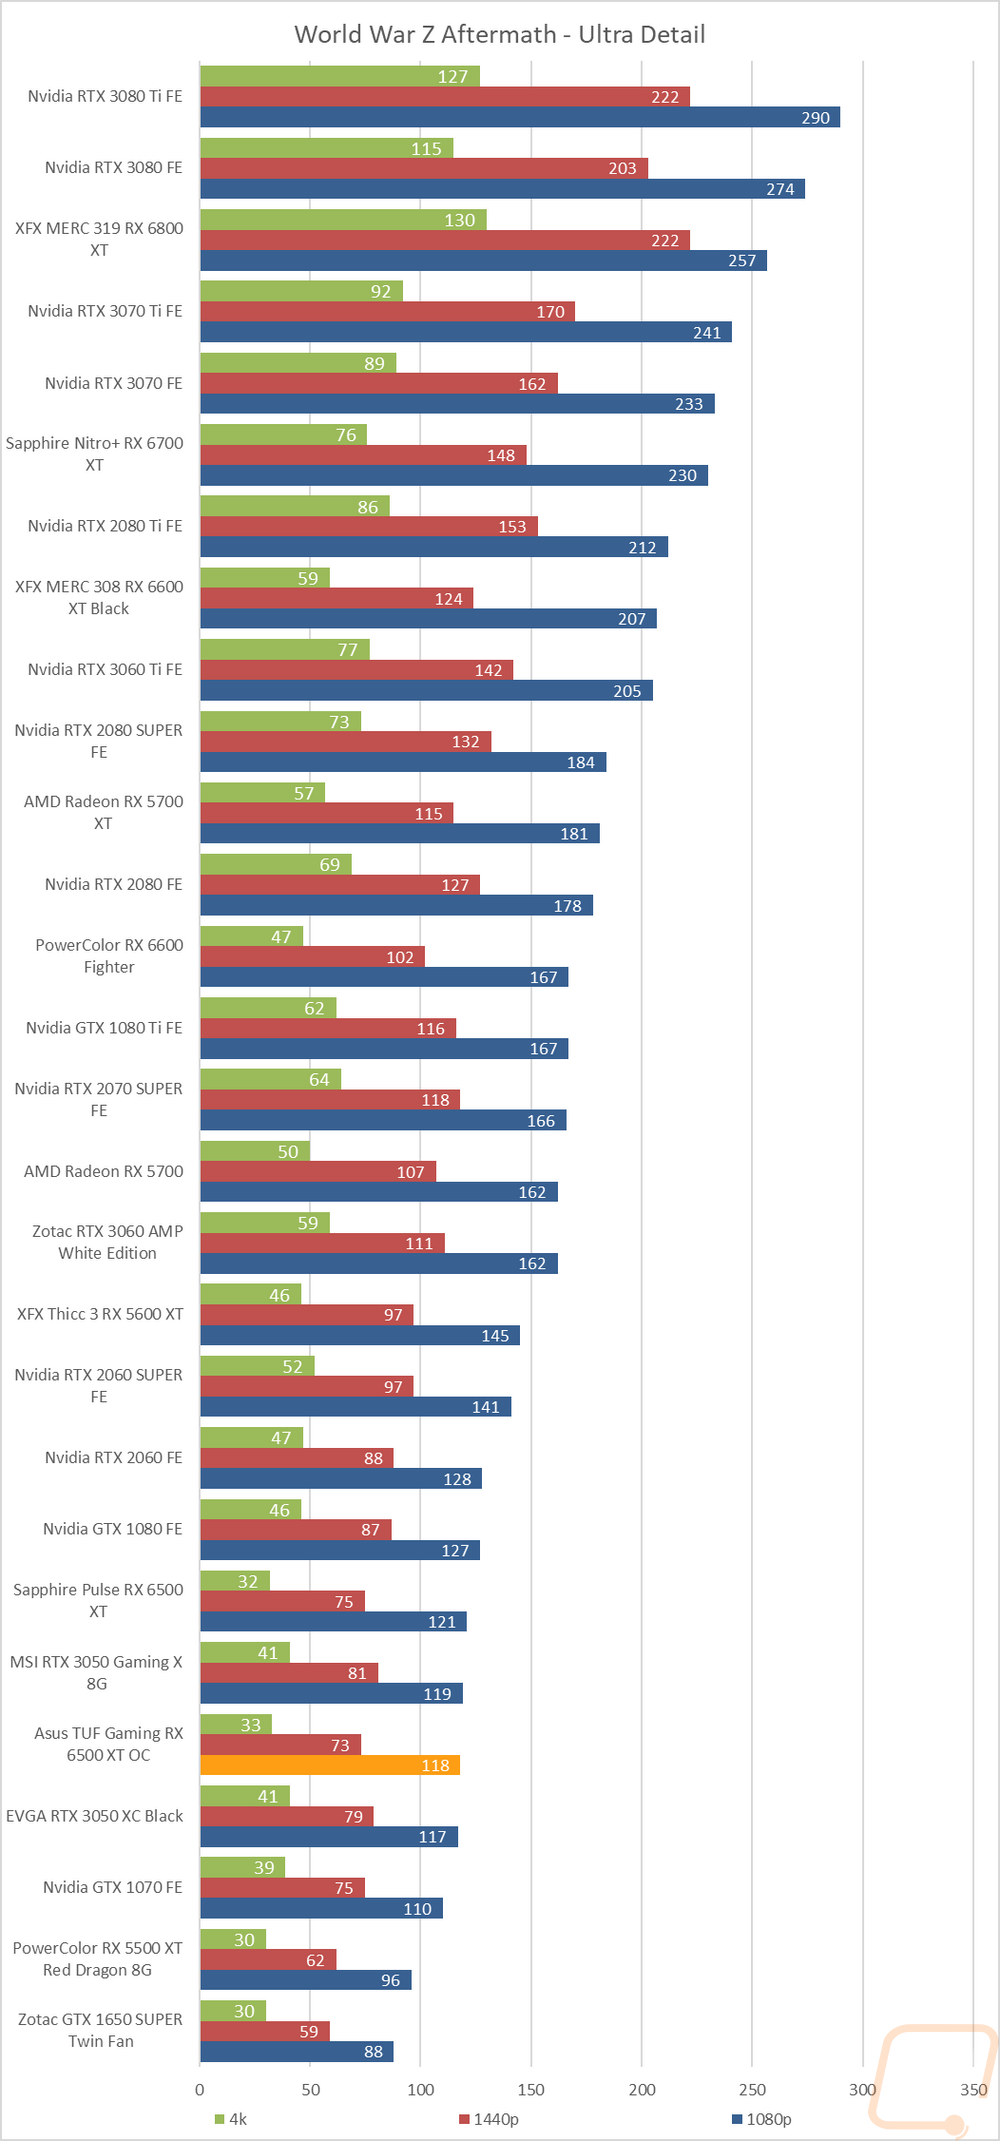
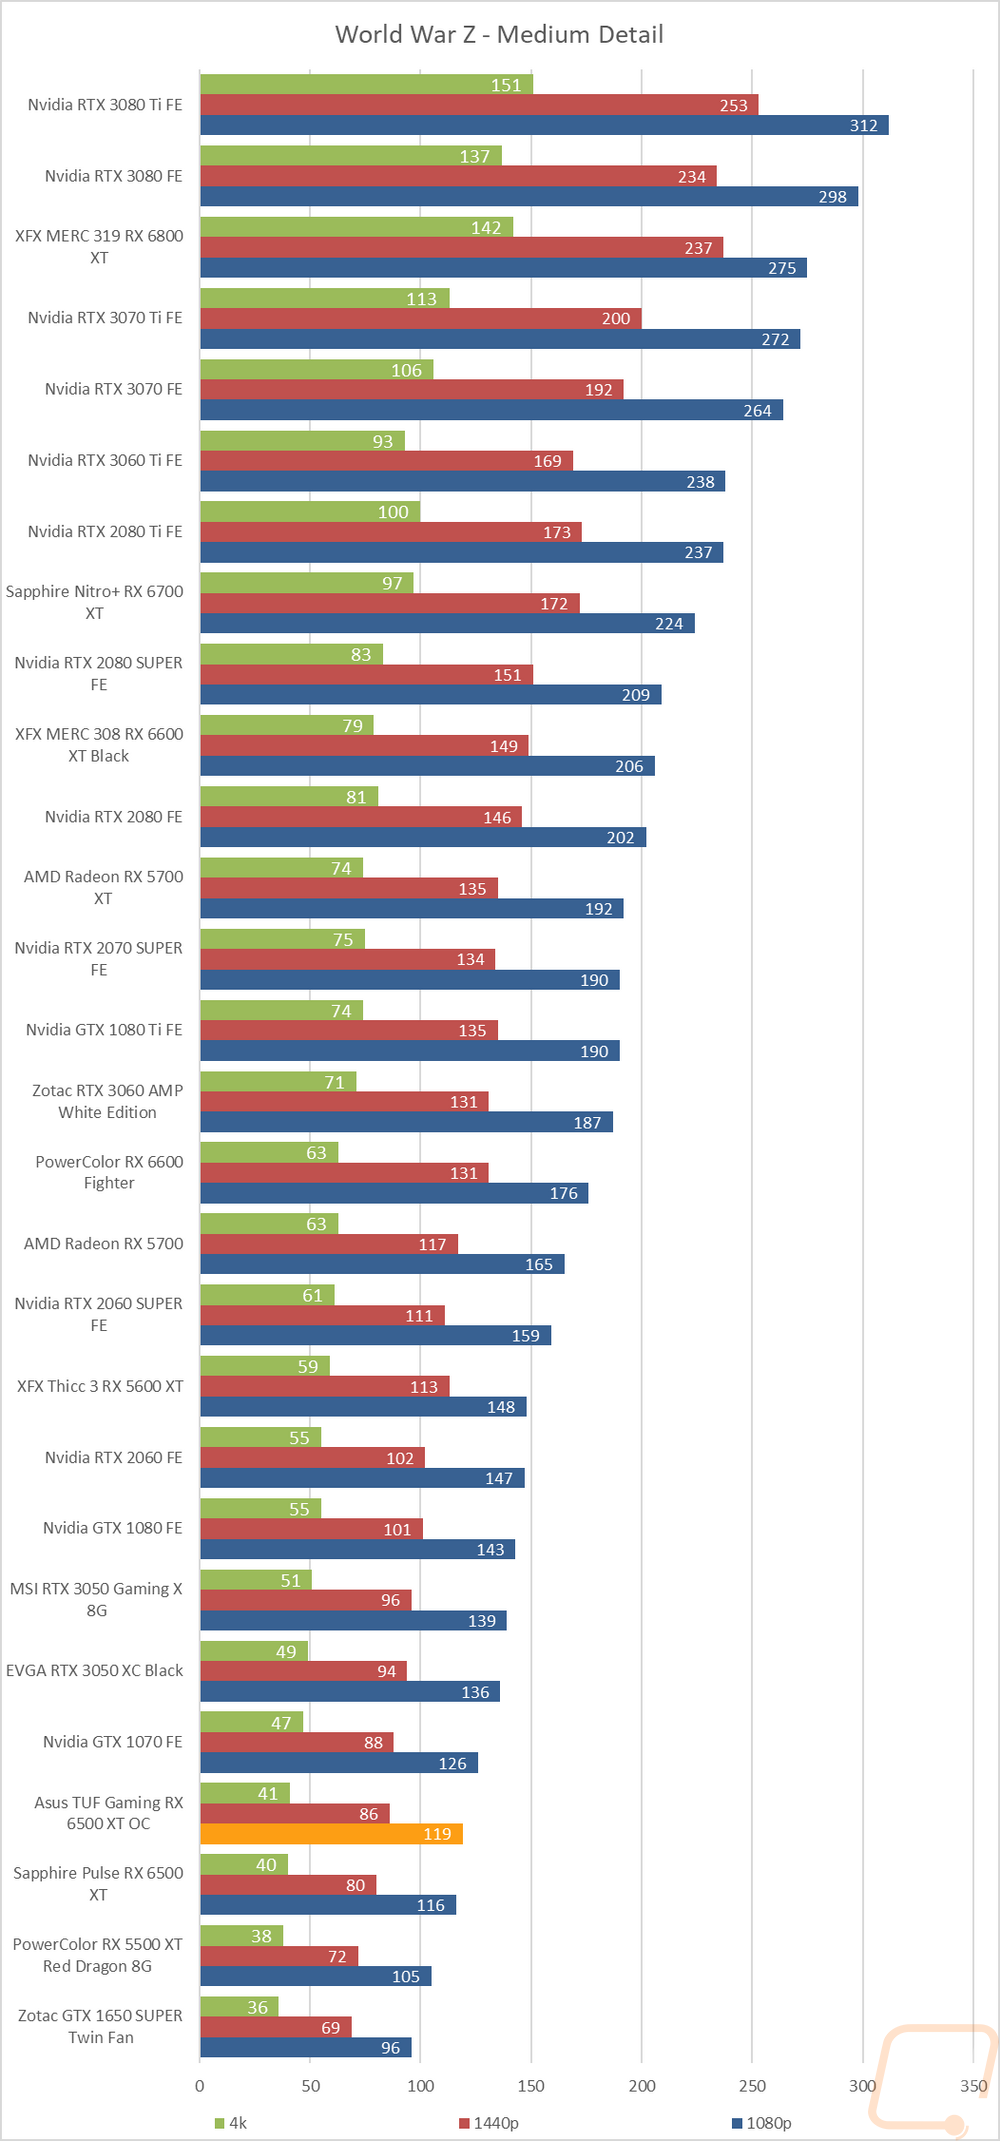
World War Z Aftermath |
Built-in benchmark in DX11 testing both the Ultra detail and Medium detail levels at 1080p, 1440p, and 4K resolutions |
|
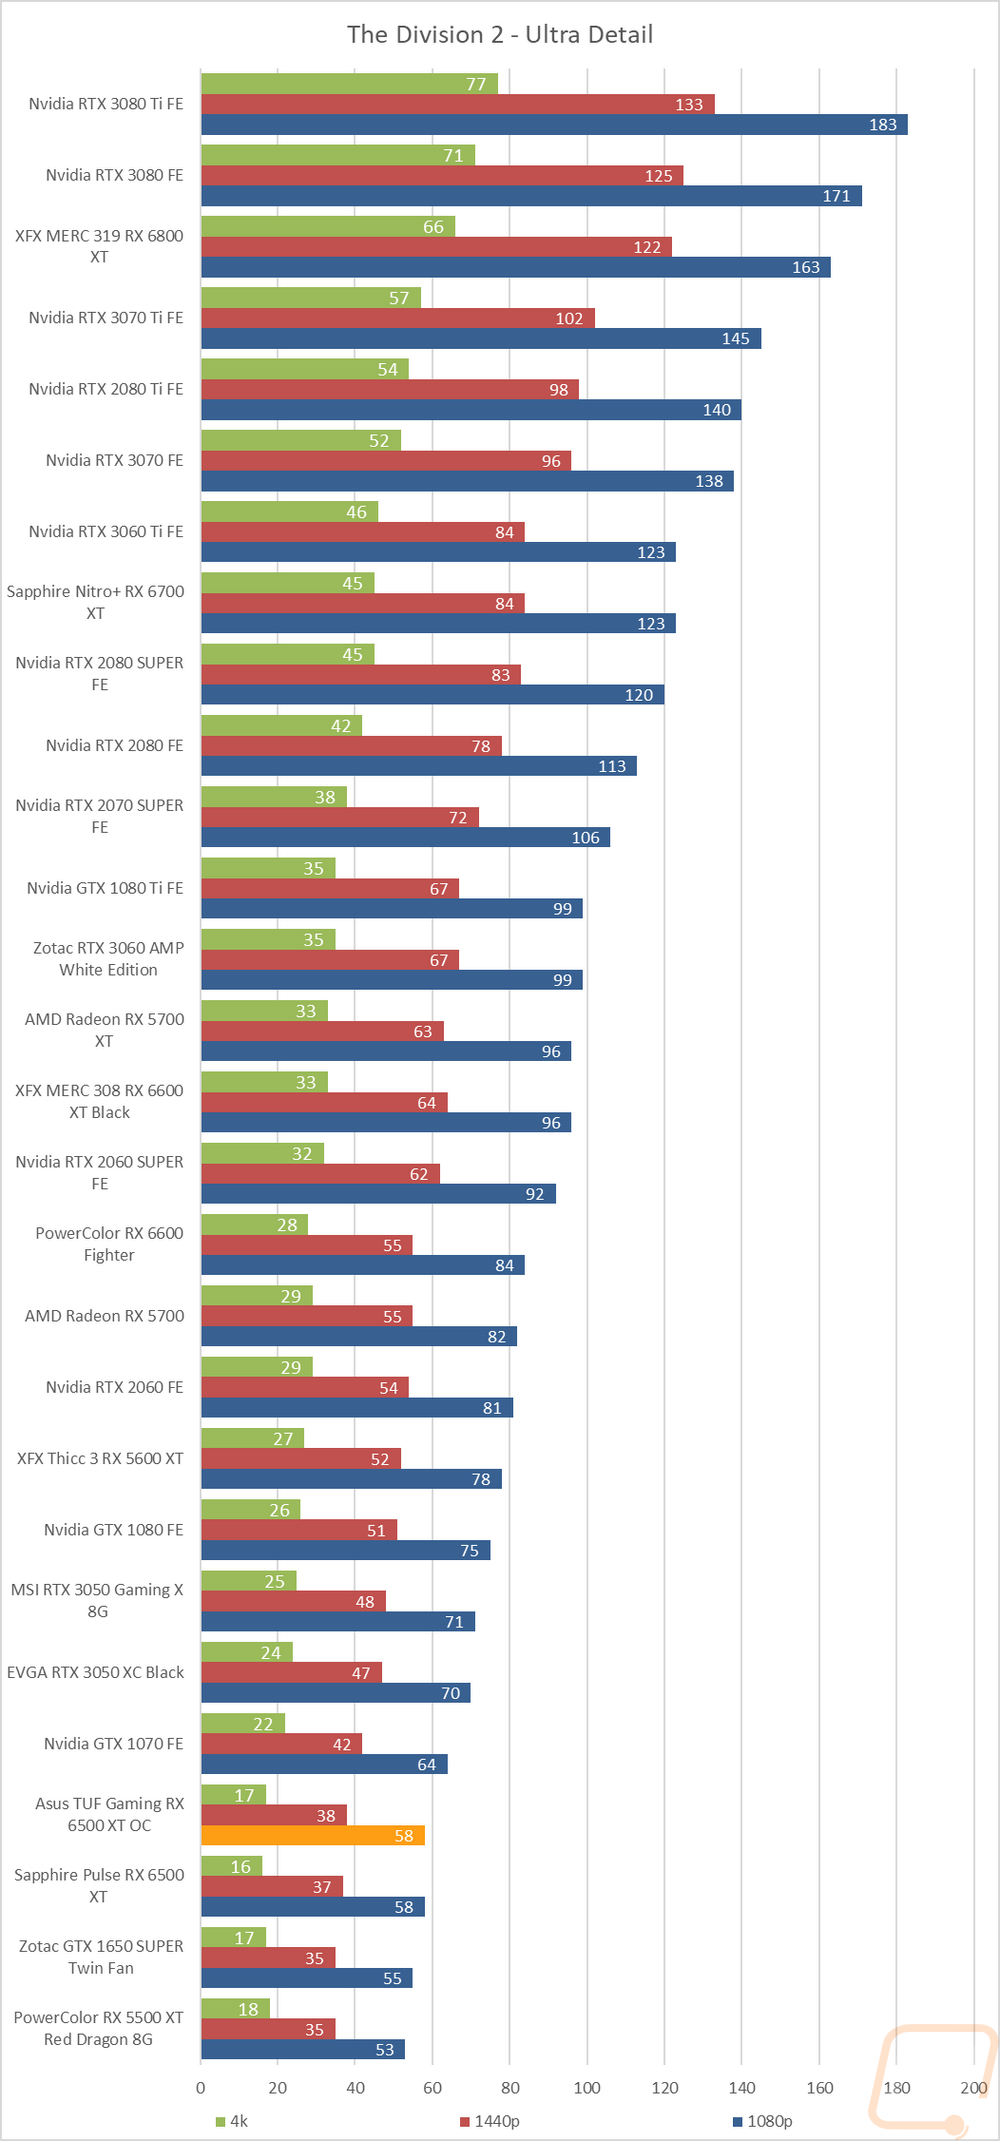
The Division 2 |
Built-in benchmark at Ultra detail with V-Sync turned off at 1080p, 1440p, and 4k resolutions. |
|
Total War: Three Kingdoms |
Built-in benchmark using the Battle Benchmark setting. Tested at 1080p, 1440p, and 4k at both high and ultra detail settings |
|
Far Cry 6 |
Built-in benchmark, tested at 1080p, 1440p, and 4k with the Ultra and Medium detail settings |
|
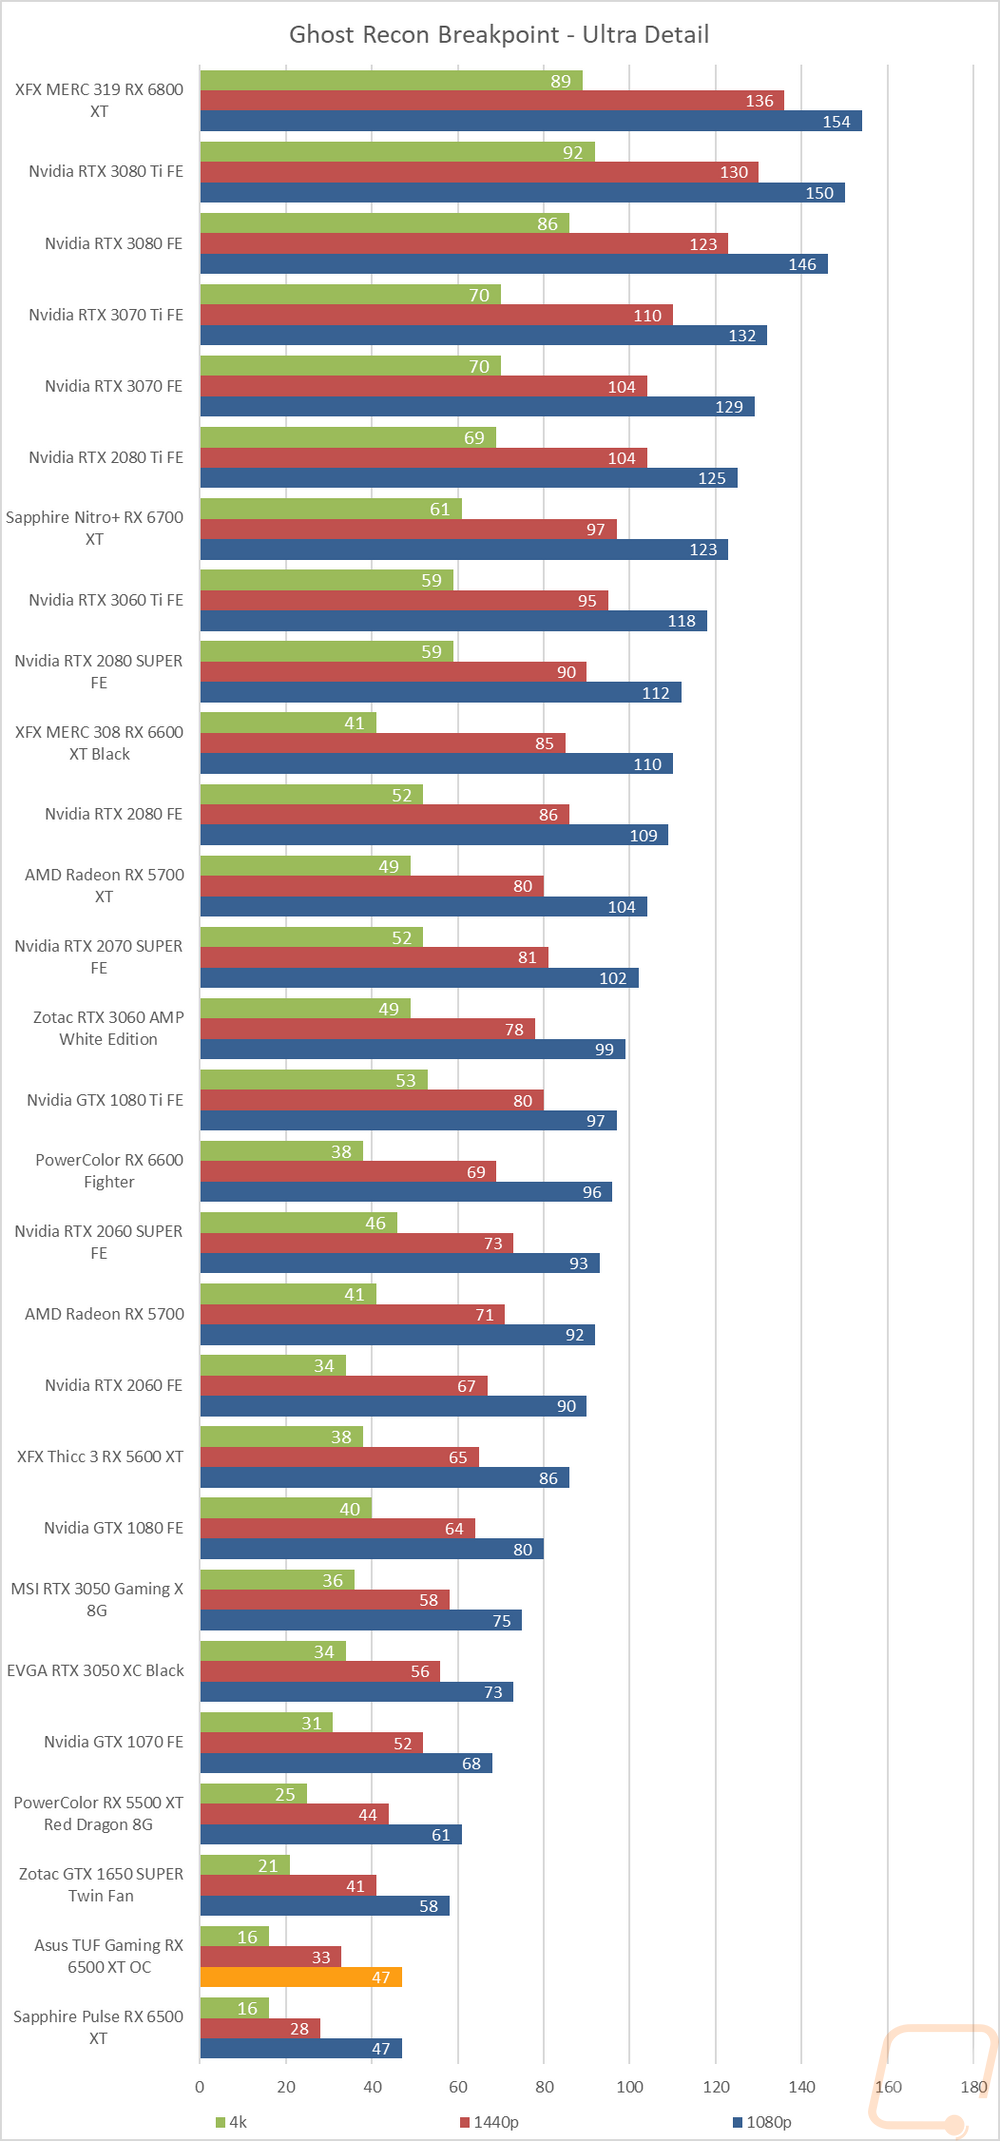
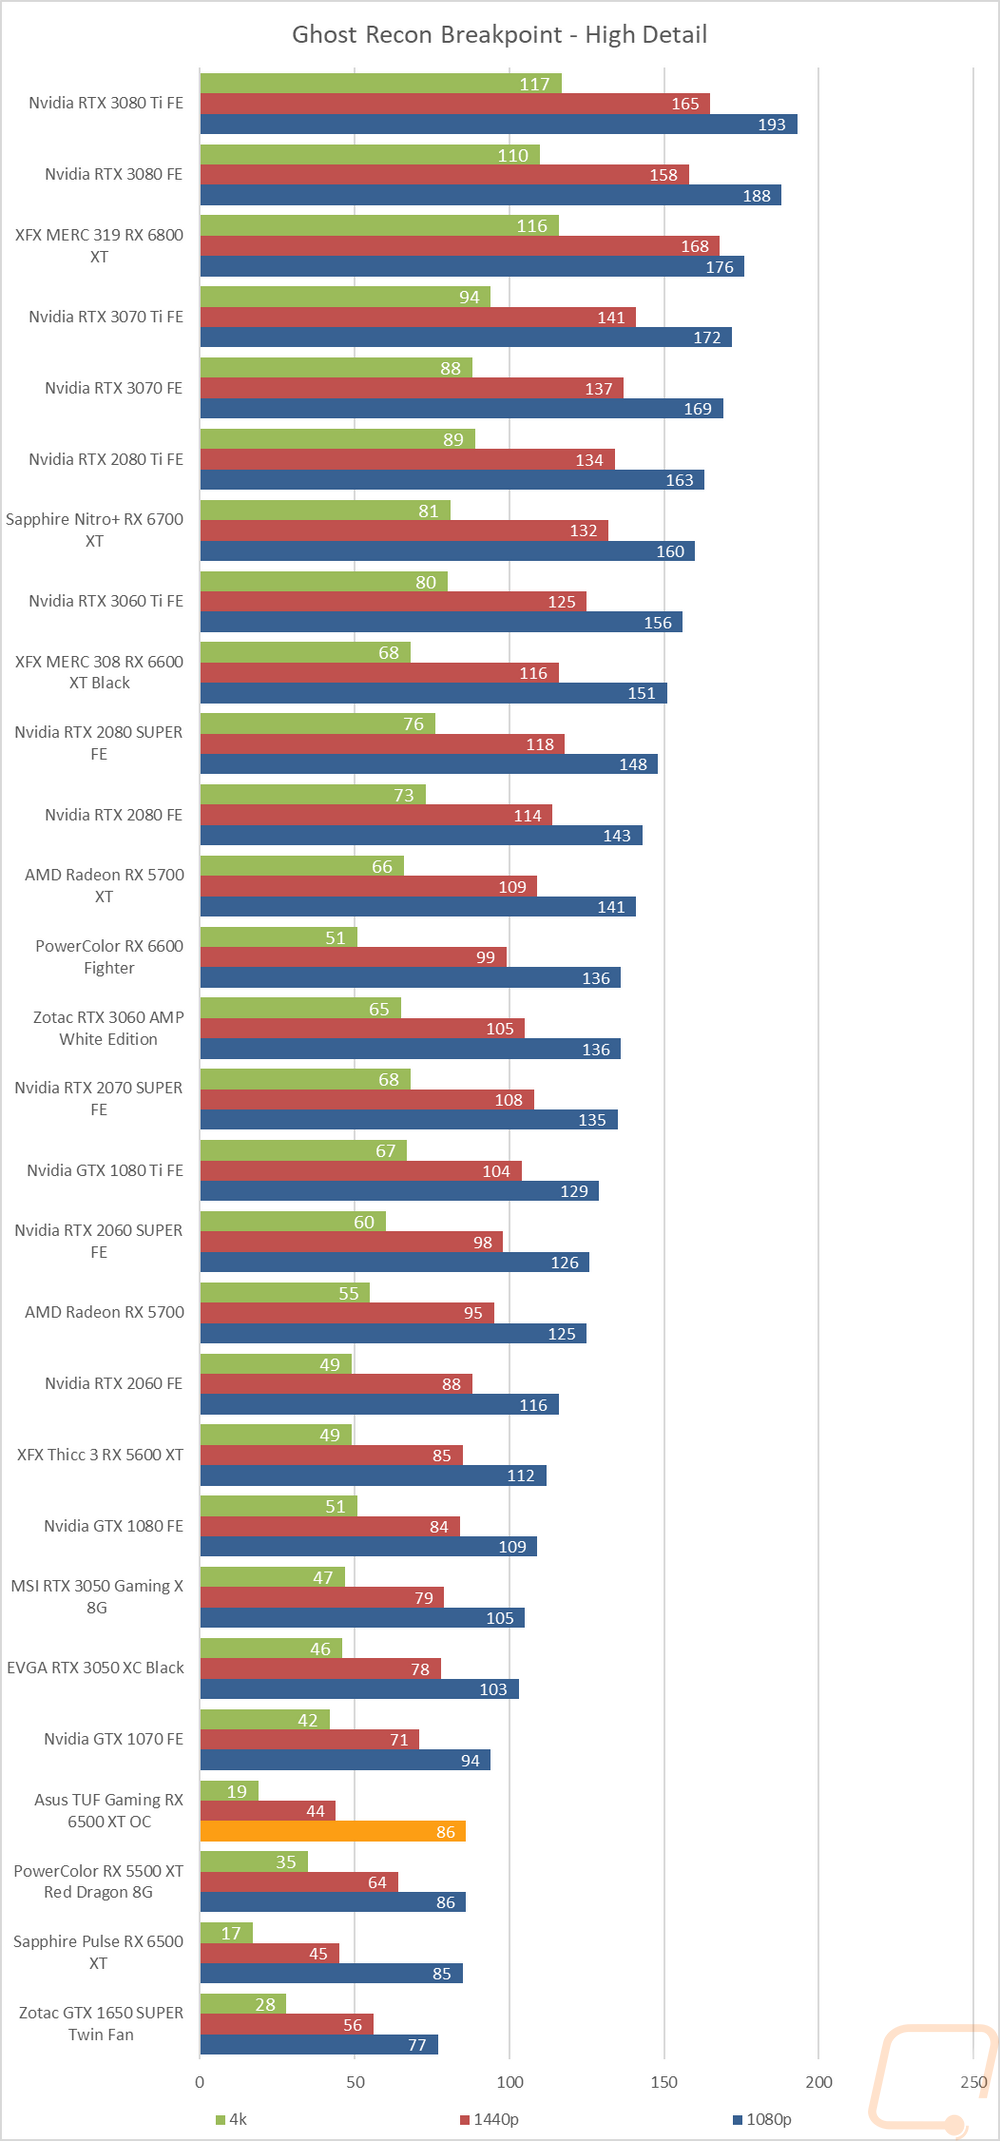
Ghost Recon Breakpoint |
Built-in benchmark, tested at 1080p, 1440p, and 4k with the Ultra and Medium detail settings |
|
Boundary Benchmark |
Testing different DLSS detail levels on cards that support it. All testing is done at 4k with RTX on |
|
Bright Memory Infinite RTX Benchmark |
Benchmark all of the different RTX detail levels. Resolution at 4k and DLSS on balanced for each test |
|
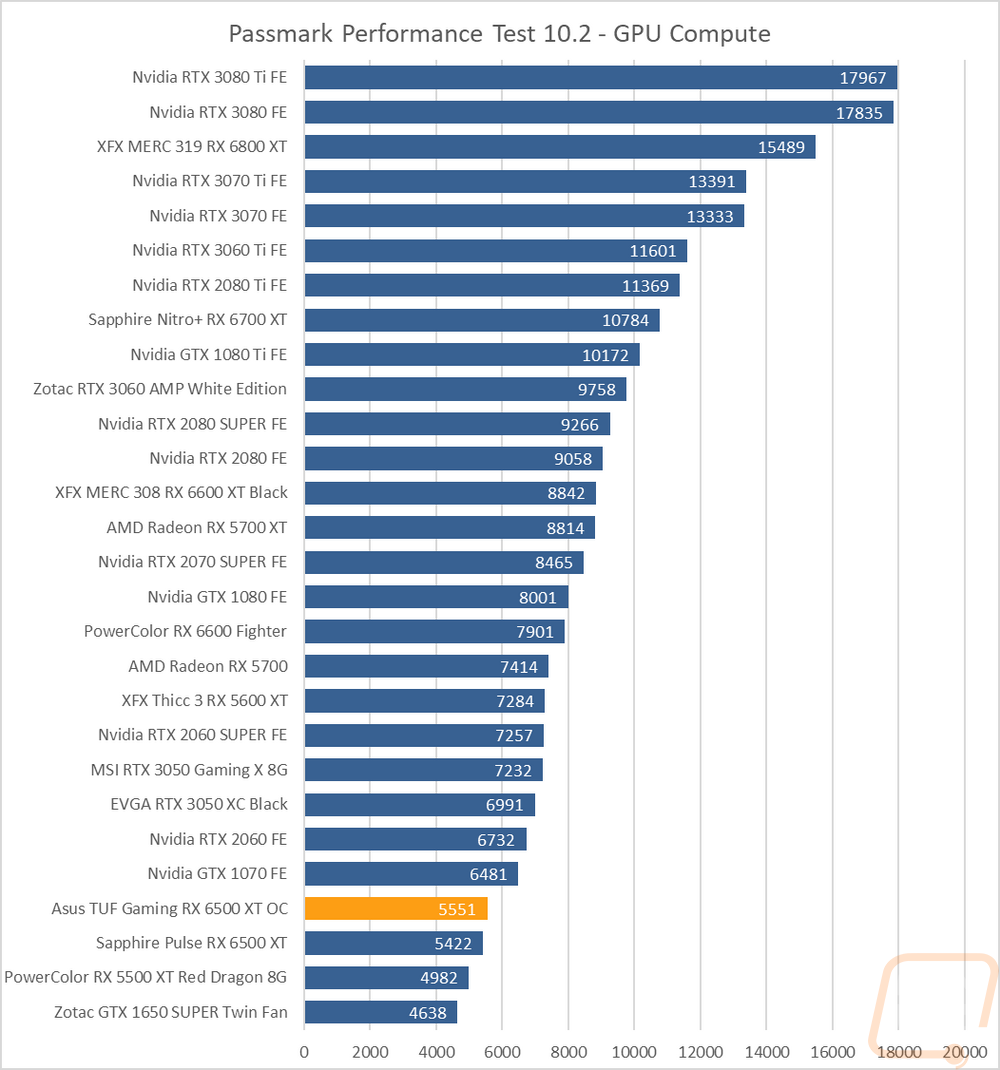
Passmark Performance Test 10.2 |
Test using the GPU Compute Score inside of Passmark’s Performance Test 10.2 |
|
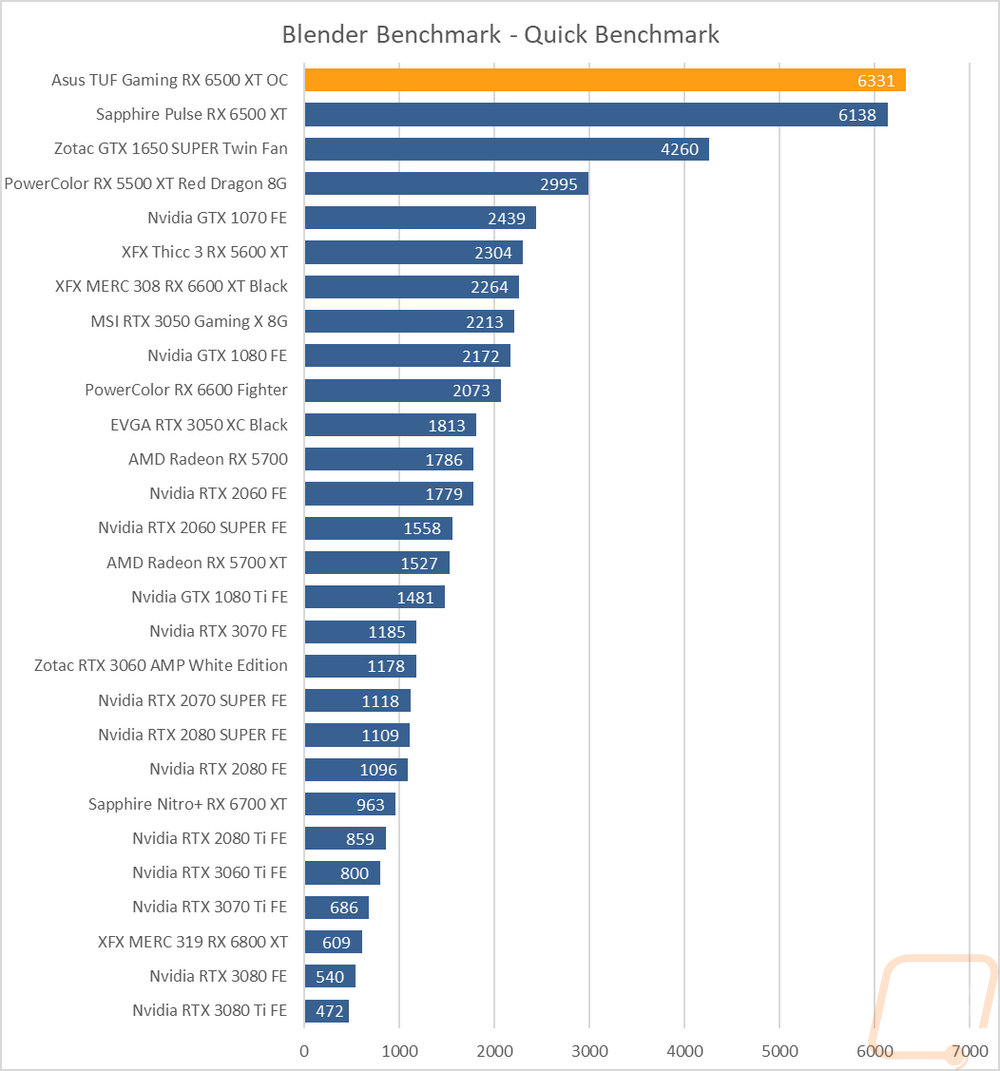
Blender |
Using the new Blender Benchmark with the Quick Benchmark setting set to use the GPU, not the CPU. Nvidia cards are tested twice, once with CUDA and the other with Optix, and AMD cards are run on OpenGL. The result is in total seconds the test took, lower is better. The 2.93.1 build is used and I run all six tests, BMW27, Koro, Classroom, Pavillon, Fishy cat (my favorite), and Victor |
|
OctaneBench 2020.1 |
OctaneBench is designed to test rendering in OctaneRender. RTX and non-RTX are both run. This is a CUDA only test so only Nvidia cards are tested |
|
Power Testing |
I run three power tests. Two I use a Kill-A-Watt hooked up in line with the power cord for the test rig. Two tests are done, one using the AIDA64 Stress Test and the second uses the 3DMark Time Spy benchmark on the second test. I also use GPUz to document the GPU only reading off the card itself for wattage when doing the Time Spy test. The Time Spy test uses only the second test here because the3rd test is the combined test that loads the CPU as well. |
|
Noise Testing |
Our Noise testing is done using a decibel meter 18 inches away from the video card on the bottom/fan side of the card. We test at 50% and 100% fan speeds as well as a third test while under load using AIDA64's stress test. This is done using a Protmex PT02 Sound Meter that is rated IEC651 type 2 and ANSI S1.4 type 2. Tests are done set weighted to A and set to a slow response using the max function and tested a second time with C weighting as well. The ambient noise level in the testing area is 33.3 decibels using A weight and 50.0 using C weight. |
|
Temperature Testing |
Using AIDA64, the GPU stress test is run for 30 minutes or until the result has leveled off. The test is run twice, once with the stock fan profile and a second time with 100% fan speed. During this, I also document the 100% fan speed RPM and document the delta between the fan profile and 100% fan speed as well. |
Synthetic Benchmarks
As always I like to start my testing with a few synthetic benchmarks. 3DMark especially is one of my favorites because it is very optimized in both Nvidia and AMD drivers. It's nice to not have to worry about it being favored too much either way and the repeatability of the results makes it a nice chance to compare from card to card, especially when comparing with the same GPU. In this specific case, the TUF Gaming RX 6500 XT OC Edition has the same overclock as the Sapphire card that I previously took a look at but we will see how it performs in comparison.
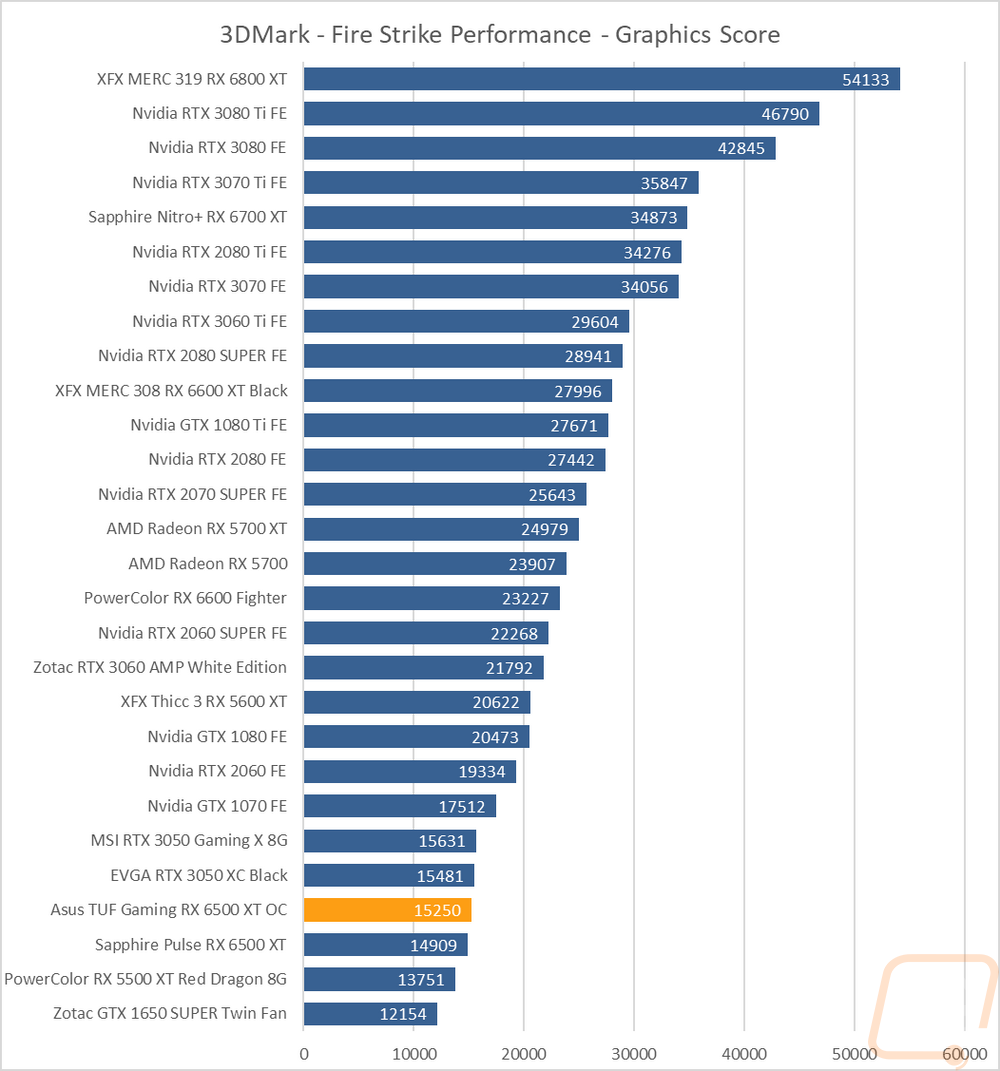
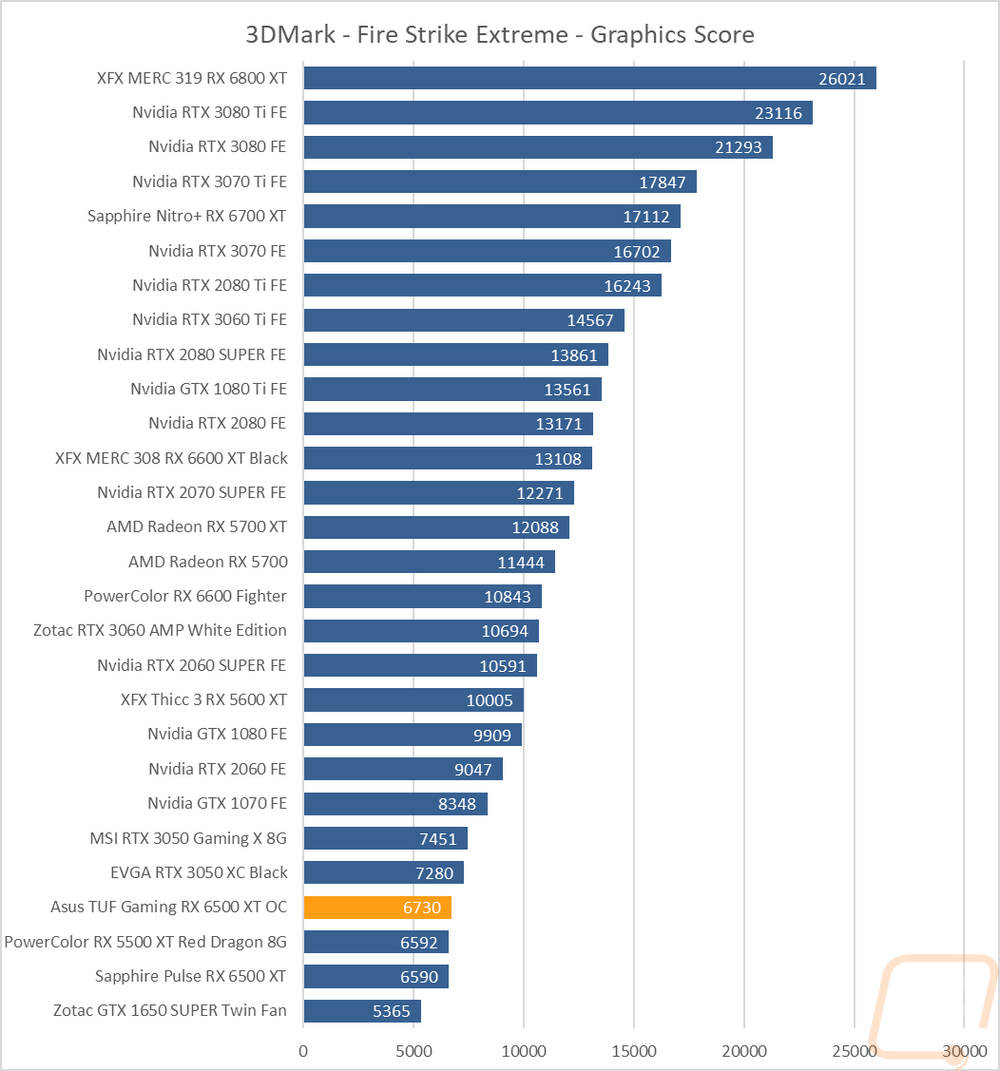
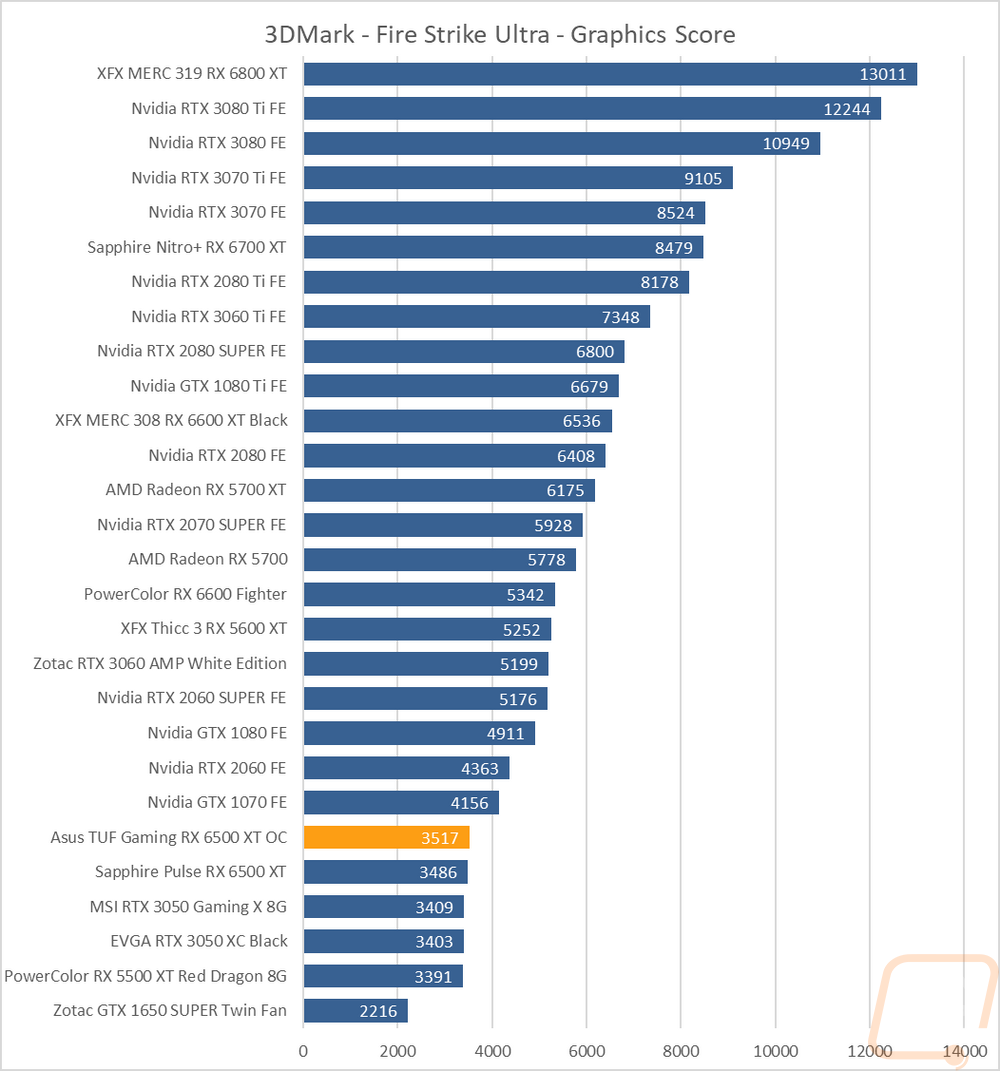
The first round of tests were done in the older Fire Strike benchmark which is a DX11 test. There are three detail levels, performance, extreme, and ultra. The TUF Gaming 6500XT surprisingly did come in ahead of the Sapphire even with the same overclock. In the performance detail setting that put it a lot closer to the RTX 3050 with a stock clock. In the extreme detail mode the TUF Gaming 6500XT was faster than the Sapphire but still far behind the 3050. Then in Ultra the 3050 fell off and the TUF Gaming 6500XT was at the top of the Sapphire once again.
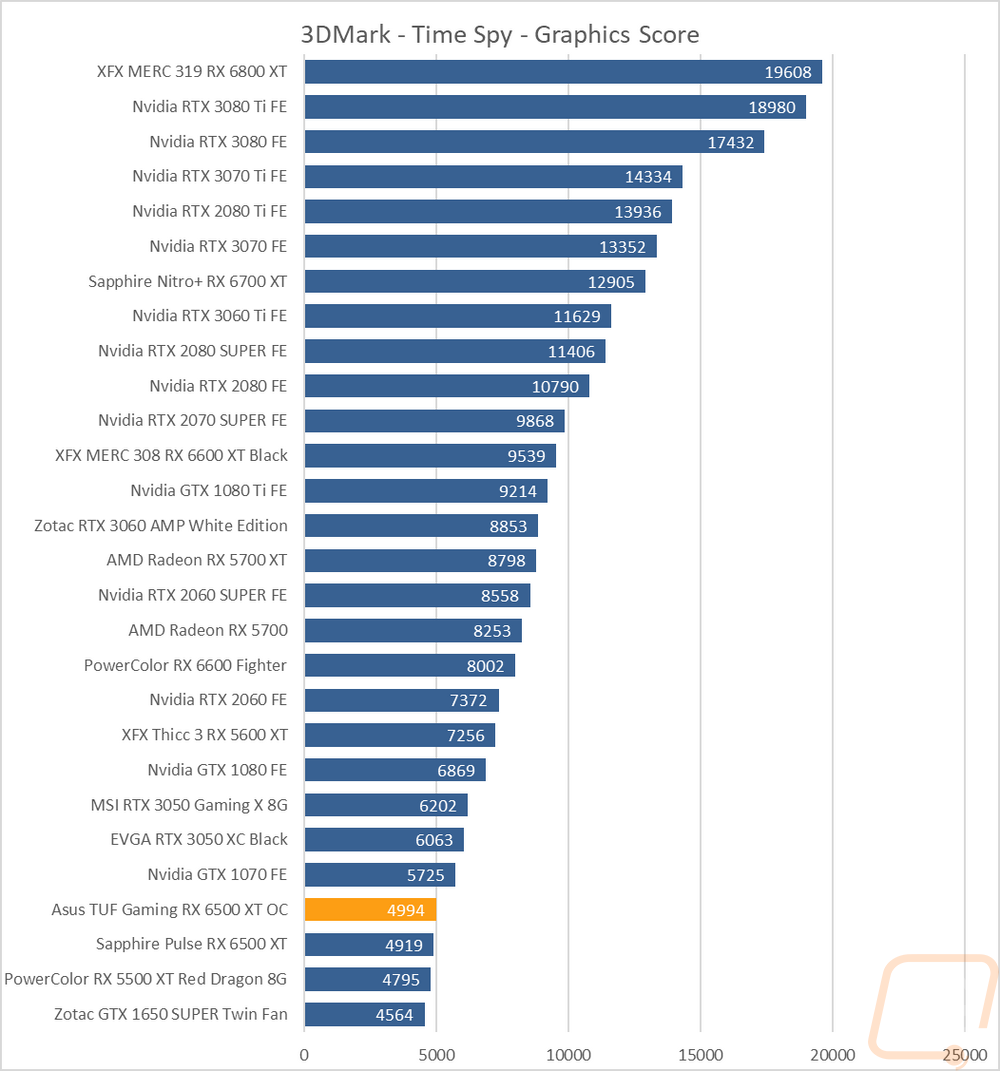
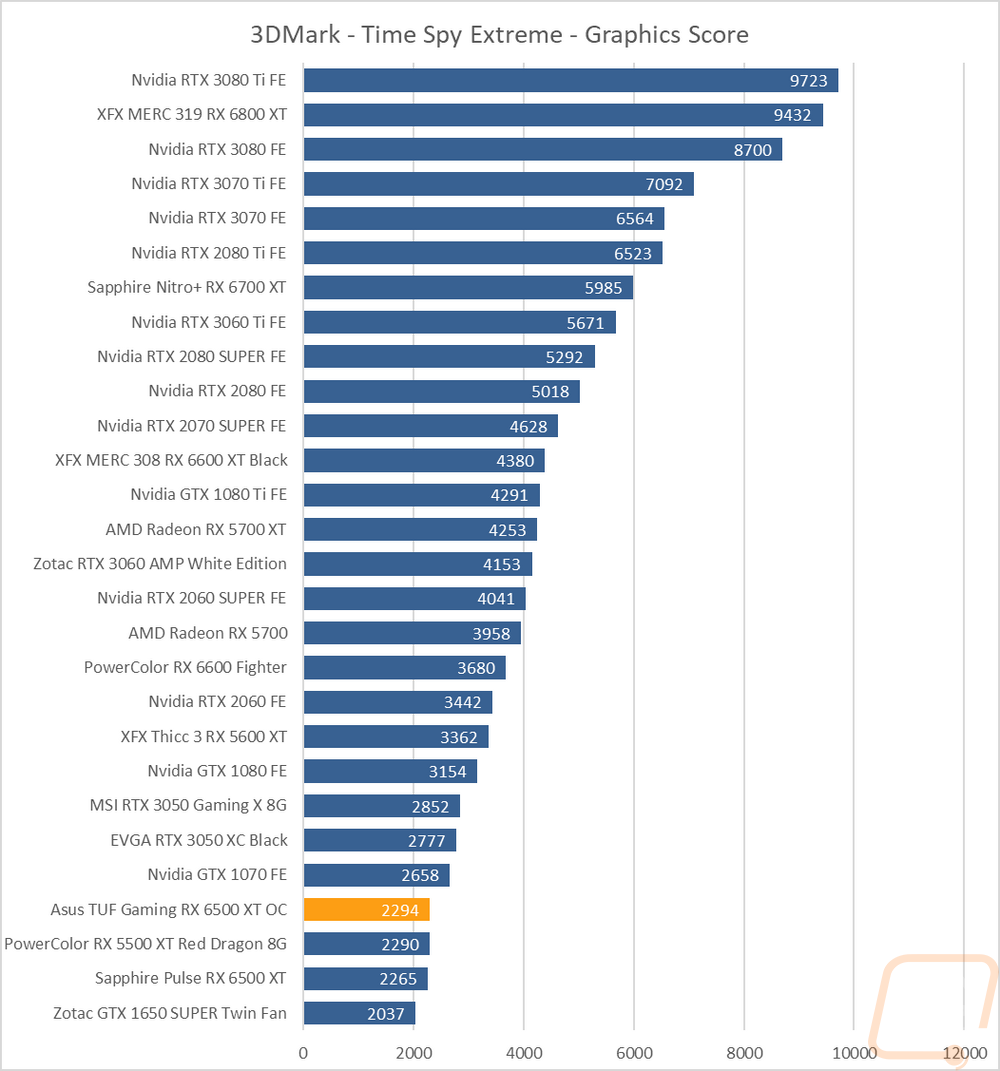
The next two were both based on the Time Spy benchmark. One is the standard test and then there is the extreme detail level. For Time Spy the TUF Gaming 6500XT did outperform the Sapphire 6500 XT as well as the 5500 XT but the RTX 3050 is in a different class out ahead of all three. Both the normal and extreme detail levels here had basically the same results.
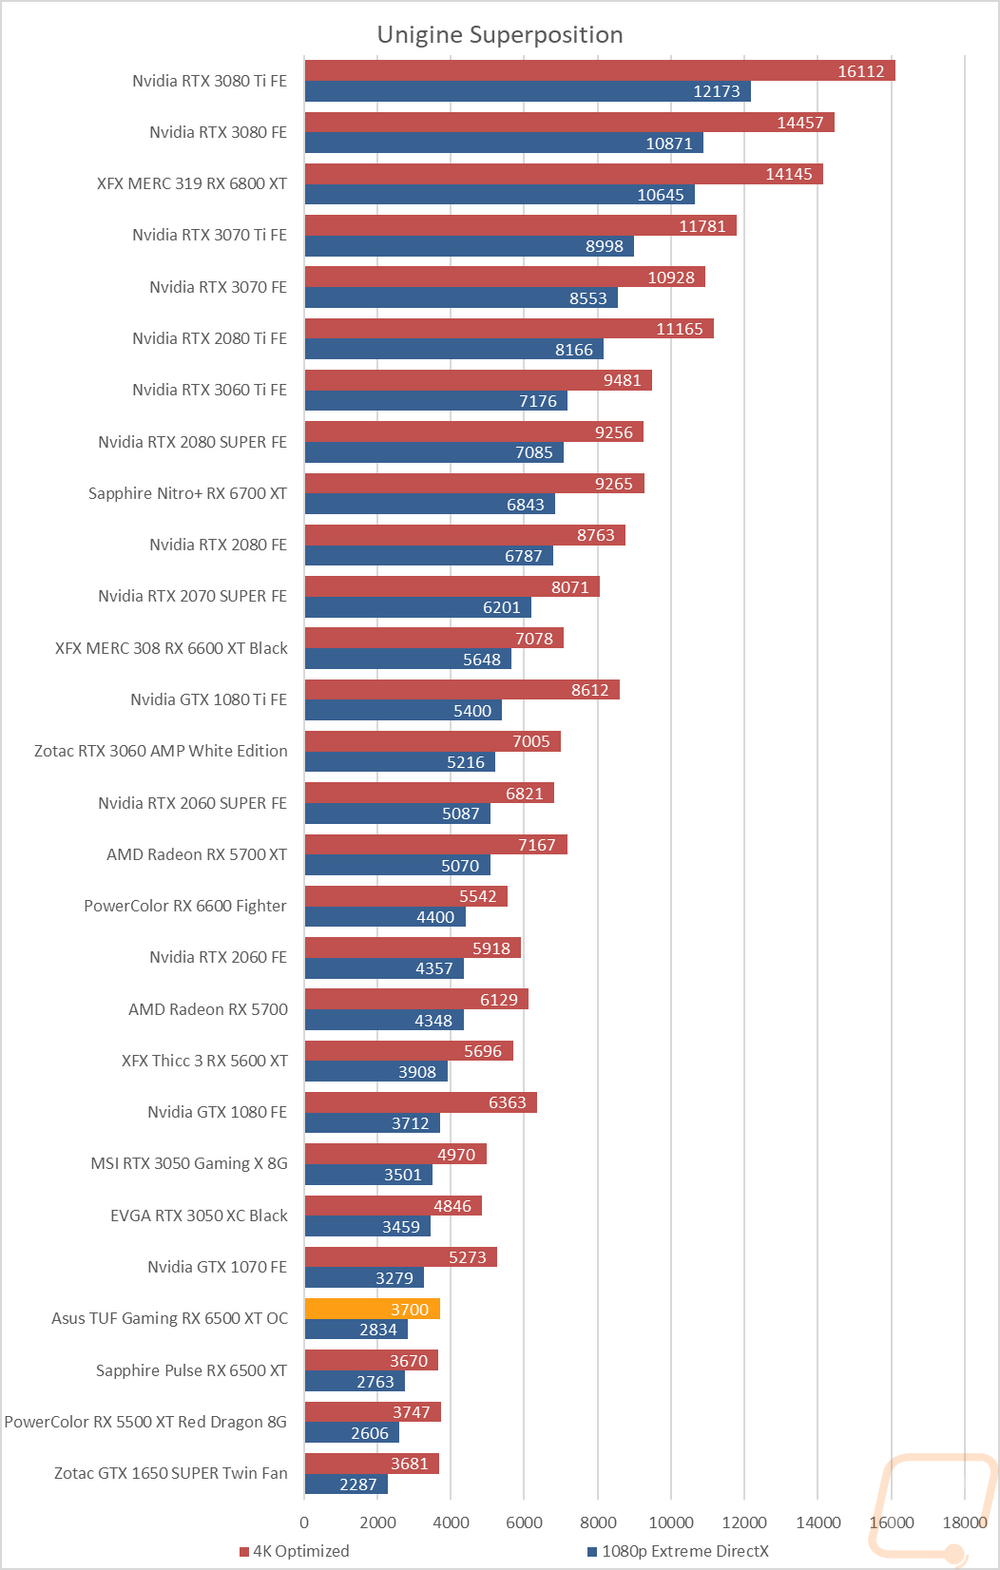
The last test was using the Unigine based Superposition benchmark and I tested at 1080p with the extreme detail setting as well as the 4K optimized setting. In the extreme detail setting the TUF Gaming 6500XT did come in ahead of the Sapphire 6500XT here but was still sitting behind the GTX 1070. Both 6500XT’s did well at 1080 against the older 5500XT but with the 4k test, they were both behind the 5500XT with 8GB of VRAM.
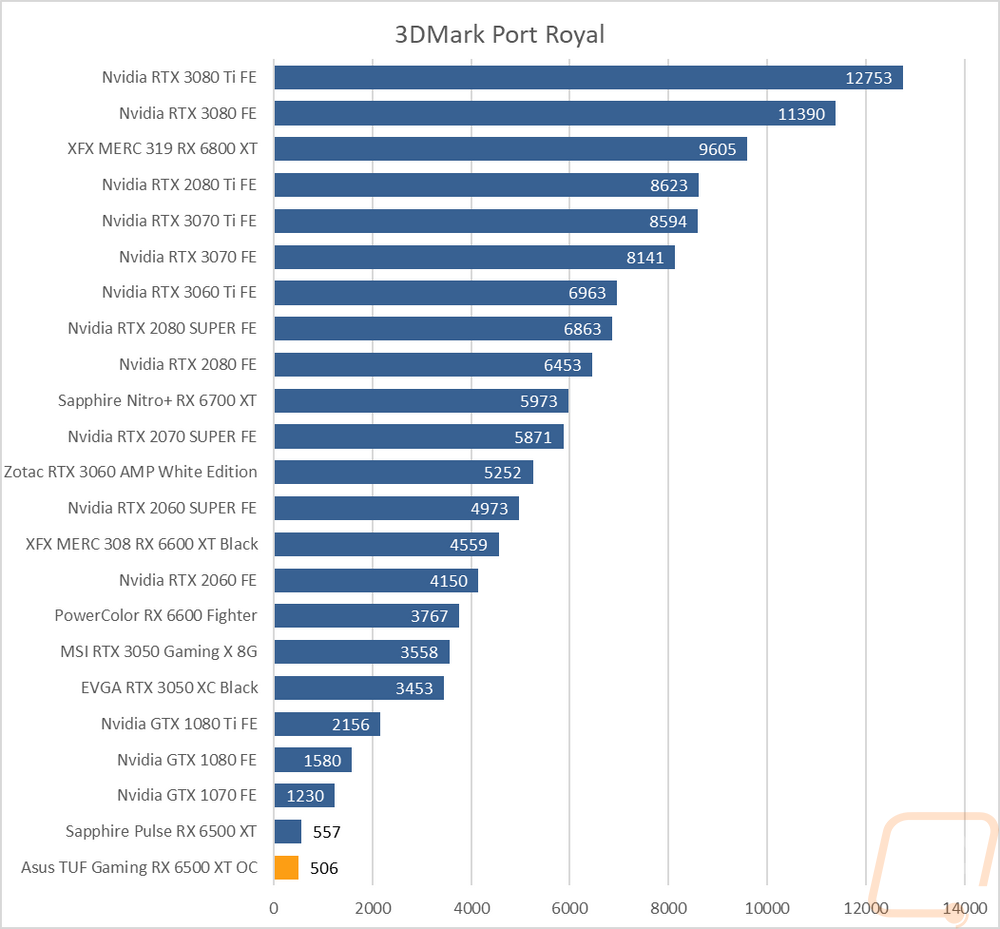
While testing in 3DMark I did also test the TUF Gaming 6500XT with the Ray Tracing focused Port Royal test which is mostly filled with Nvidia RTX cards, but with AMD including RT support on their latest cards I was able to finish the test. The 6500XT, however, doesn’t handle it well and on this test the TUF Gaming 6500XT came in behind the Sapphire 6500XT.
VR Benchmarks
As for Virtual Reality, I love it but it is more demanding than traditional gaming. This is partially because of the resolutions needed to render for two eyes and because they render more than what is immediately visible. But also because of post effects to get the proper “fisheye” effect for it to look proper in your eyes with the HMD. You also have to have much higher expectations for frame rates in VR, skipping frames or lower FPS can cause motion sickness in VR. Because of that, I ran a few tests.
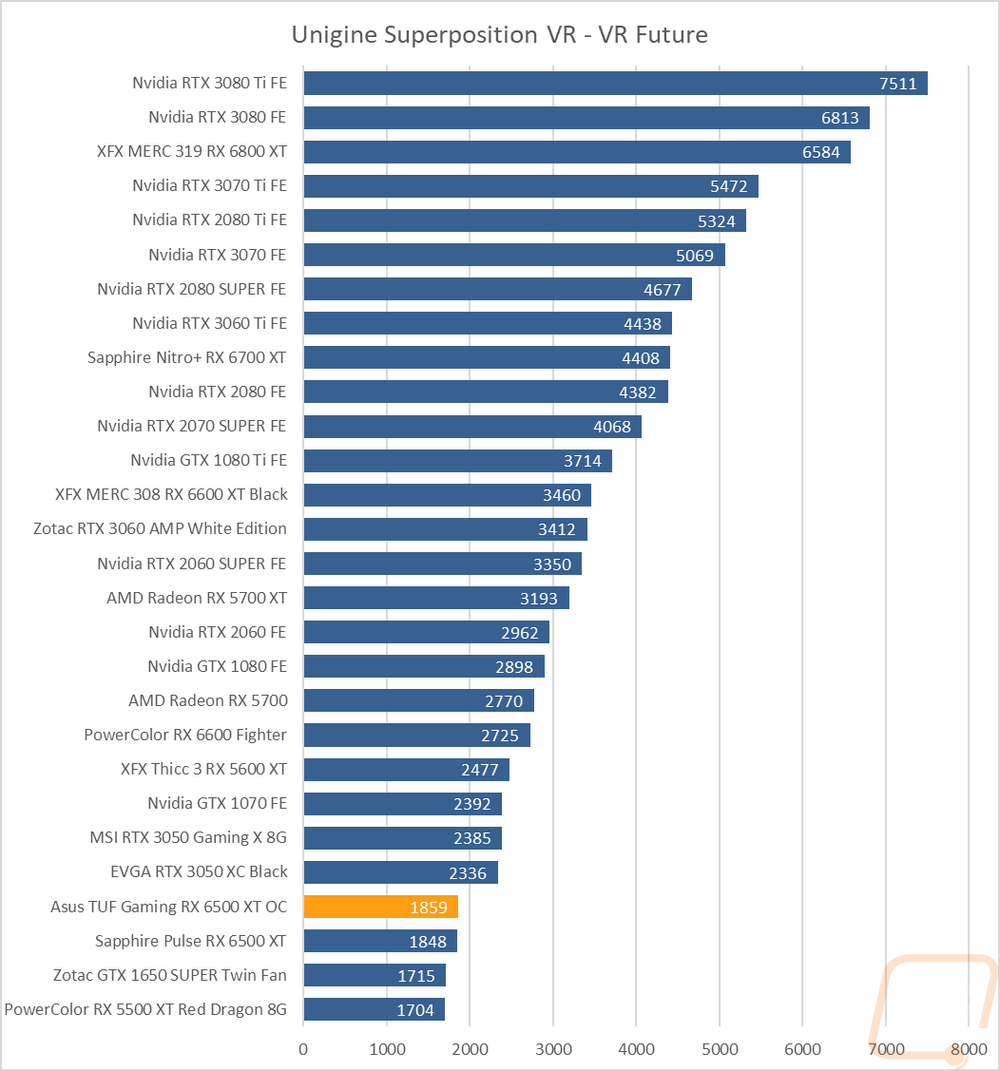
My first test was again in Superposition. This time I tested the VR Future test using the Oculus resolution. Here the TUF Gaming 6500XT was right with the Sapphire 6500XT but ahead by 11 points. The gap between the RTX 3050 and the TUF Gaming 6500XT was still a big step up. The 6500XT’s were both closer in performance with the older 5500XT and the GTX 1650 being around 150 points ahead of those cards.
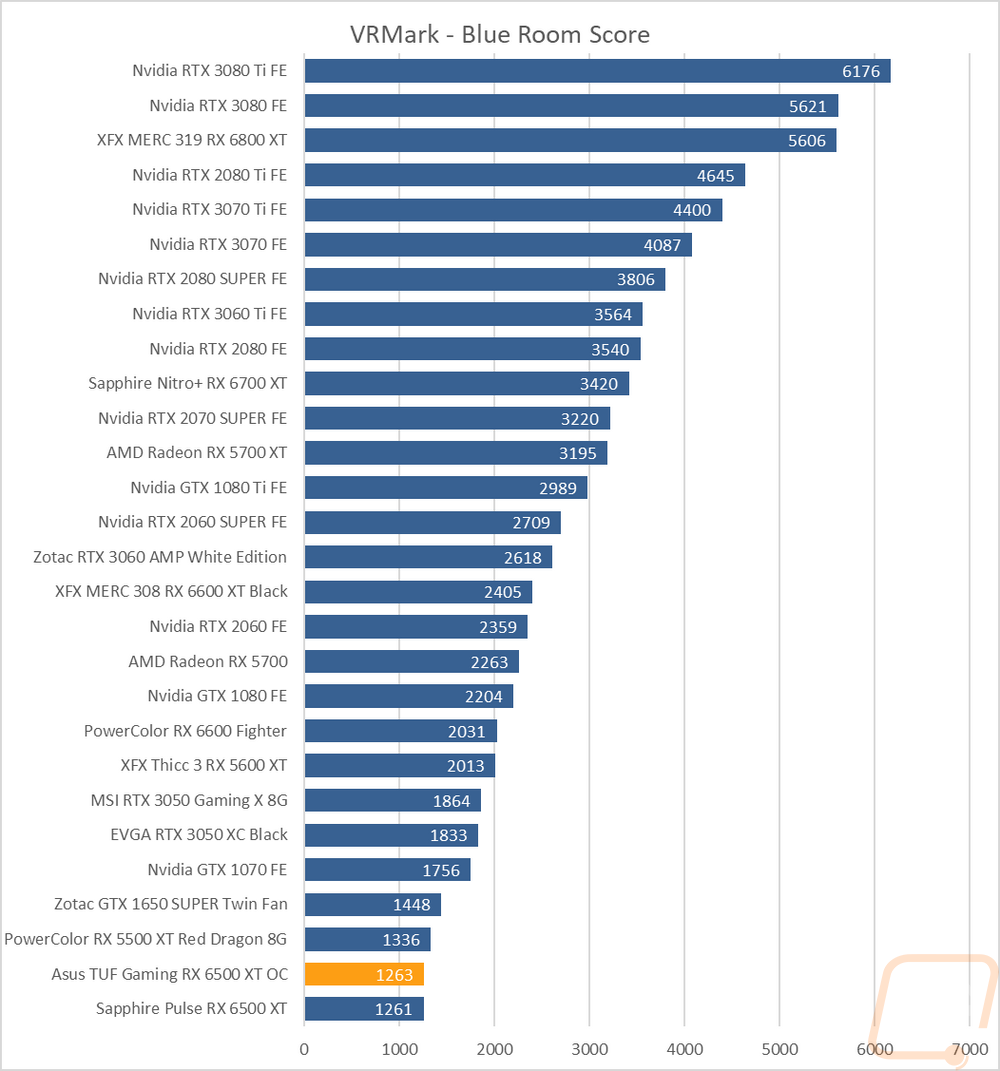
My second round of VR testing was in VRMark which has three tests that are similar to the VR tests in Superposition. I only focused on just the most demanding test called Blue Room that is looking more at future VR performance. The TUF Gaming 6500XT was right with the Sapphire 6500XT with just a 2 point difference between them and both were down at the bottom of the chart here with the 5500XT and even the GTX 1650 out ahead here.
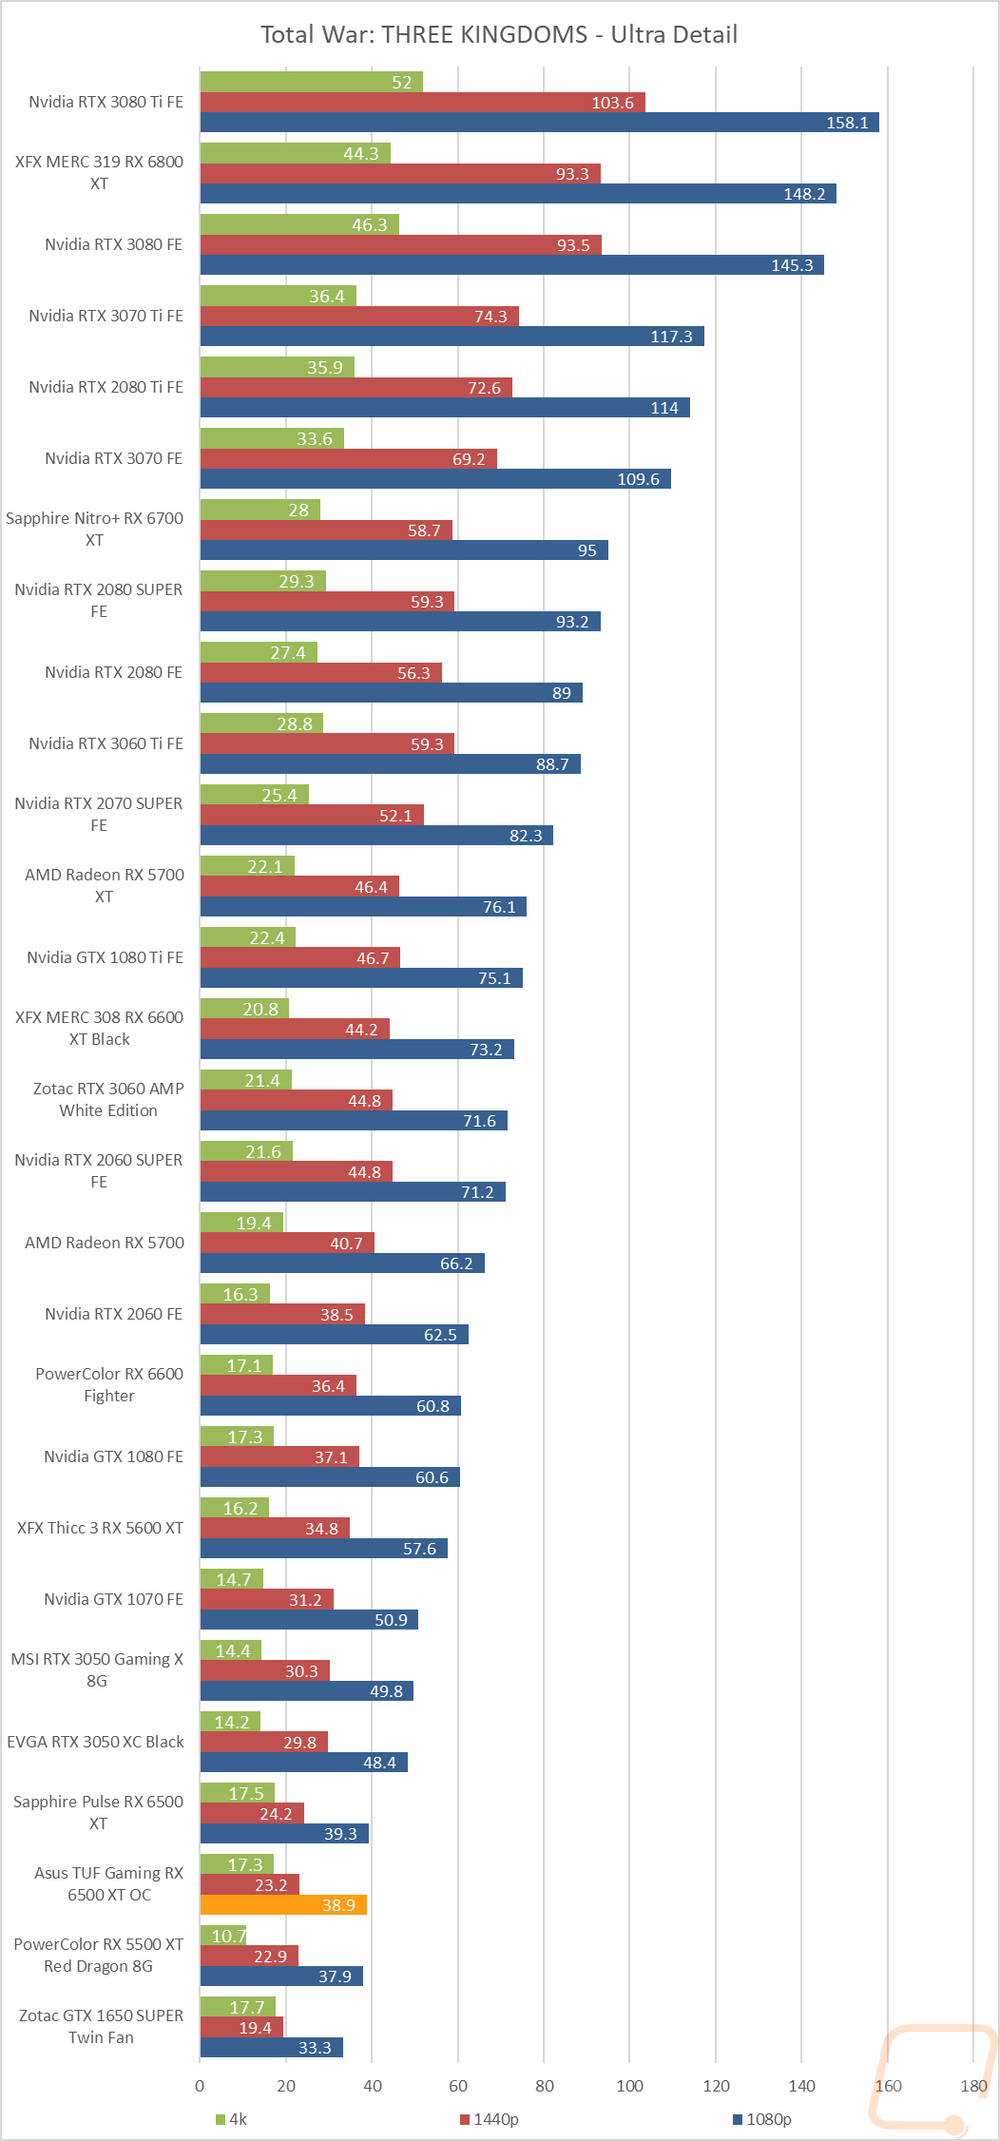
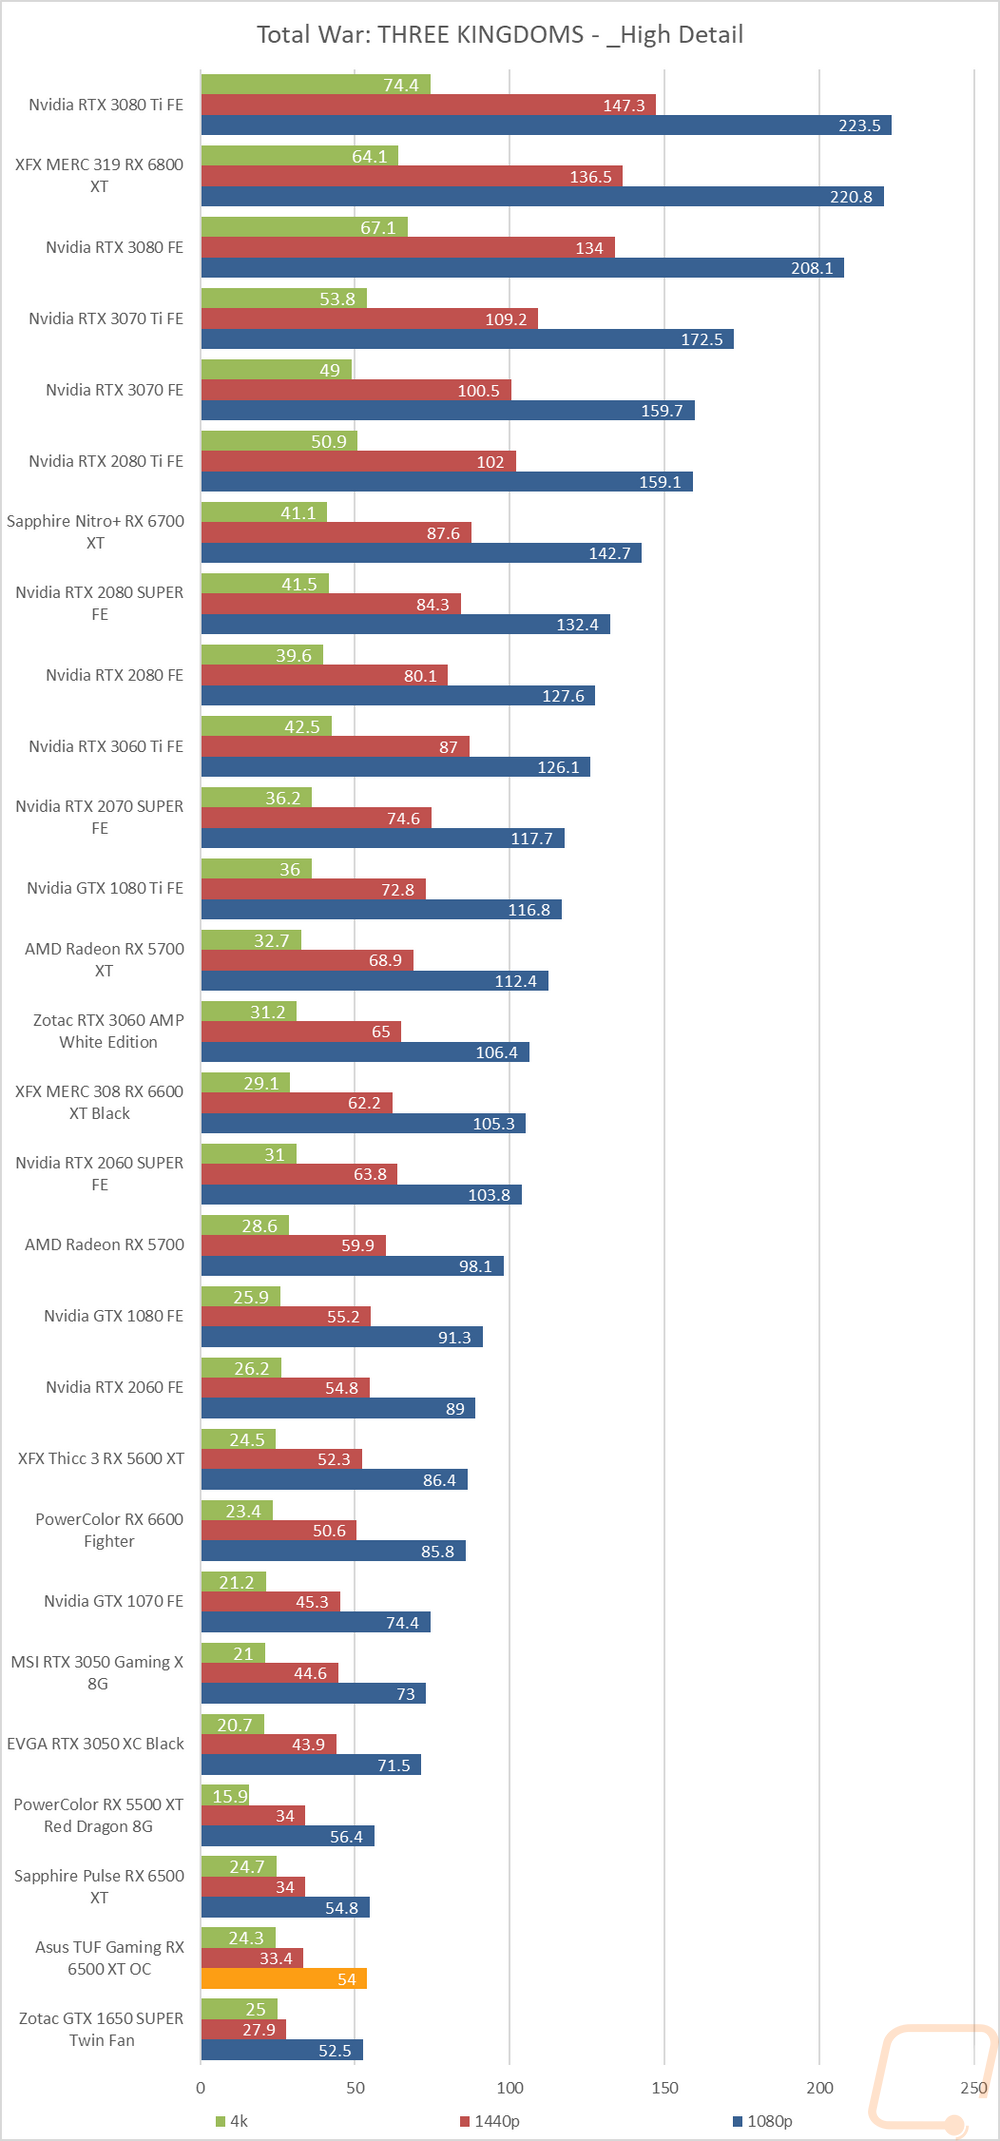
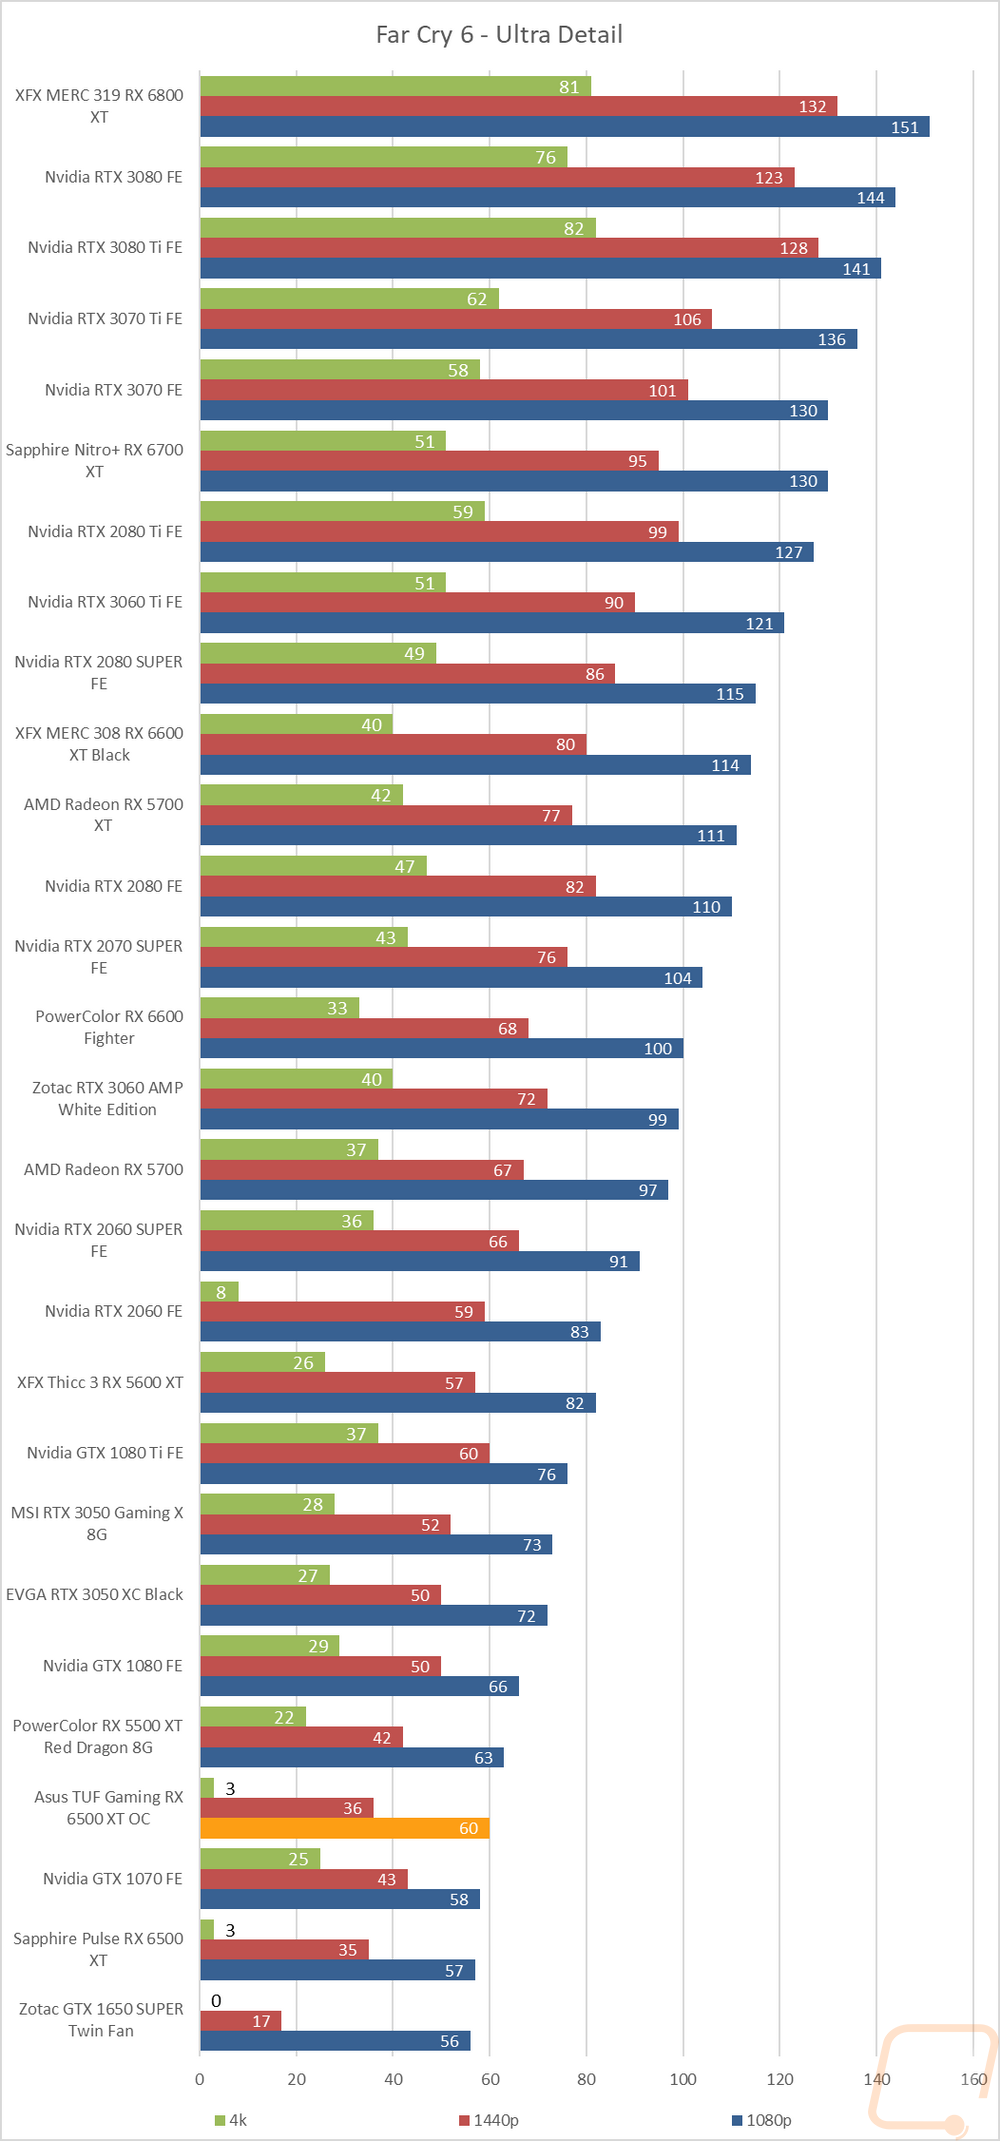
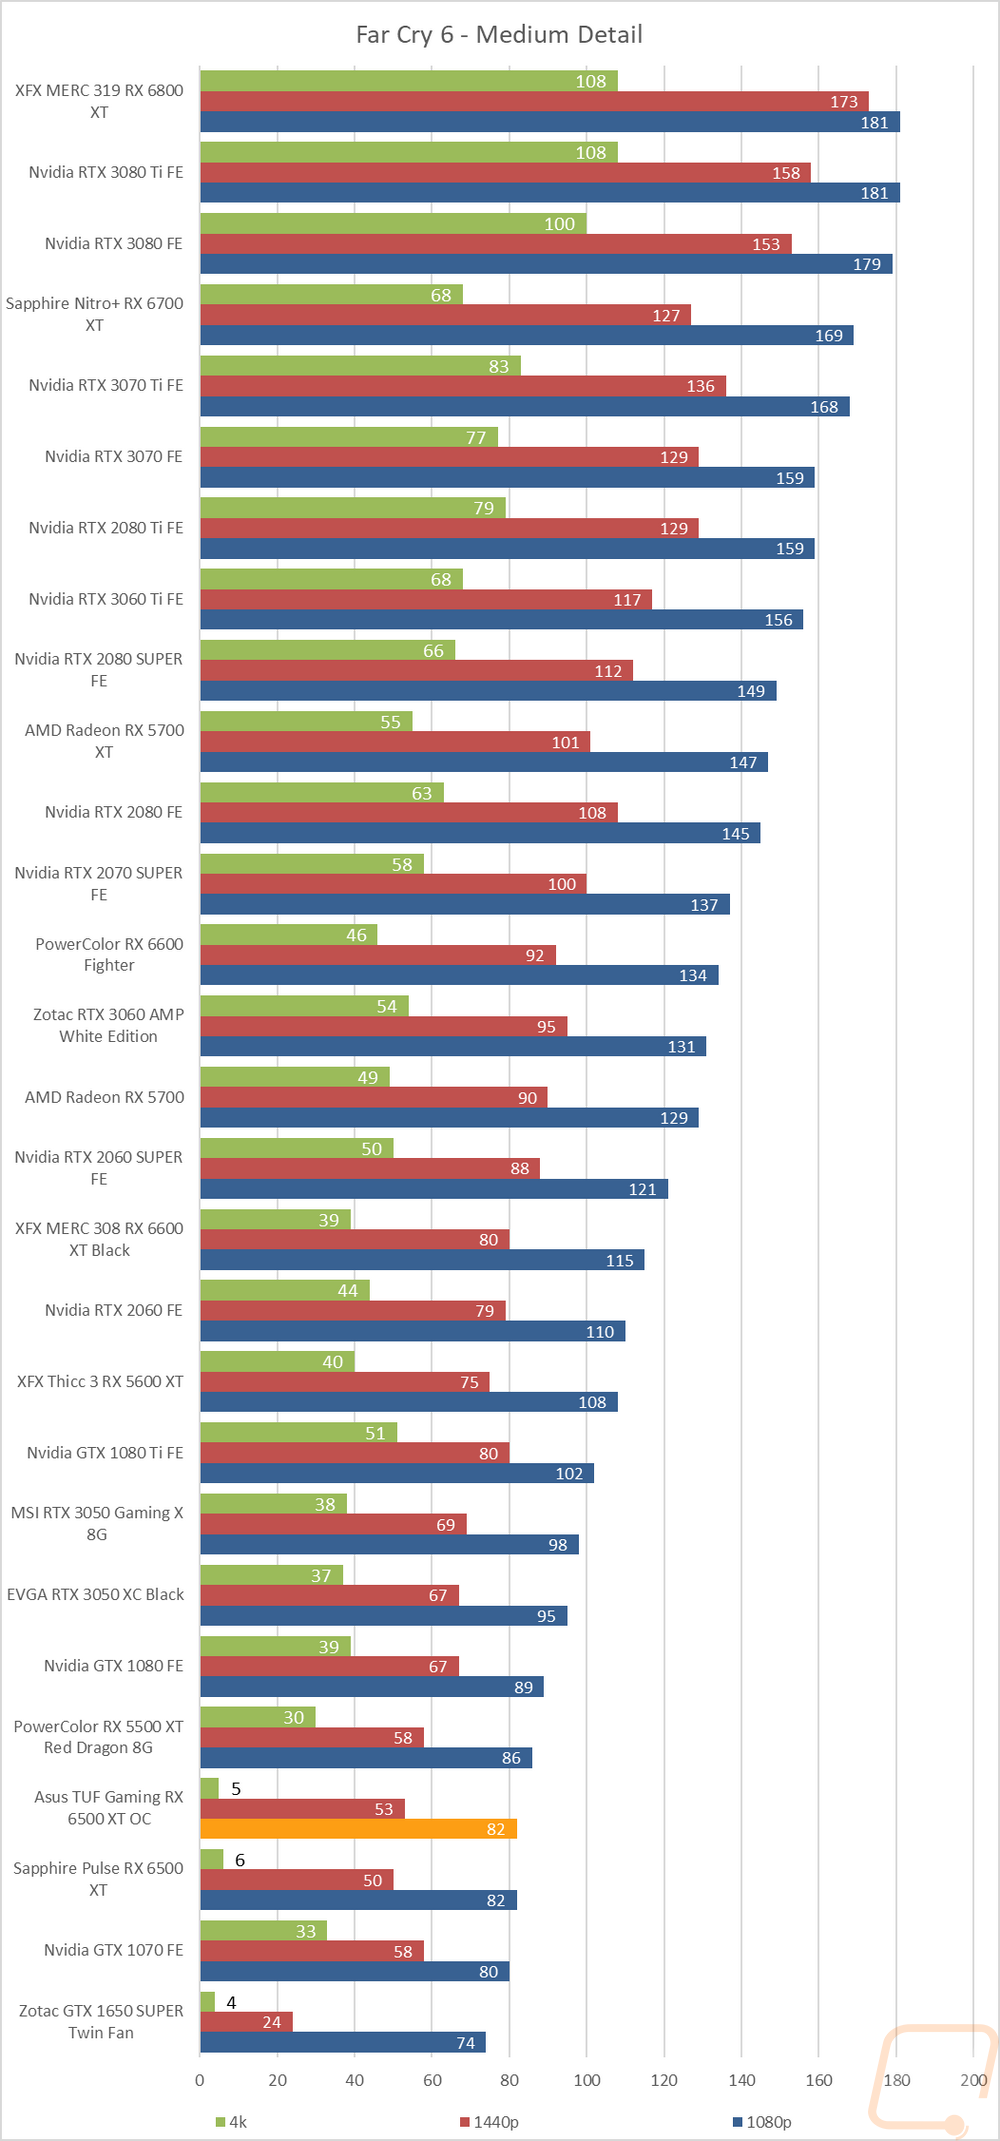
In-Game Benchmarks
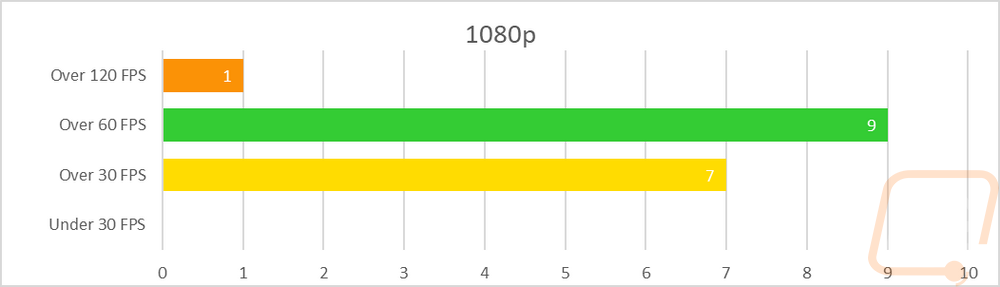
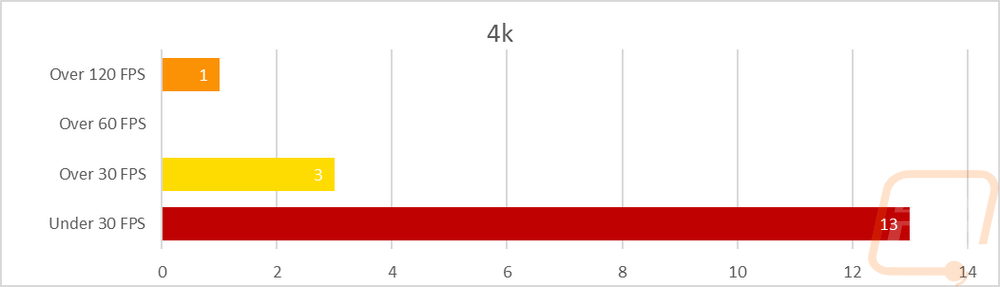
Now we finally get into the in game performance and that is the main reason people pick up a new video card. To test things out I ran through our new benchmark suite that tests 10 games at three different resolutions (1080p, 1440p, and 4k). Most of the games tested have been run at the highest detail setting and a mid-range detail setting to get a look at how turning things up hurts performance and to give an idea of if turning detail down from max will be beneficial for frame rates. In total, each video card is tested 54 times and that makes for a huge mess of results when you put them all together. To help with that I like to start with these overall playability graphs that take all of the results and give an easier-to-read result. I have one for each of the three resolutions and each is broken up into four FPS ranges. Under 30 FPS is considered unplayable, over 30 is playable but not ideal, over 60 is the sweet spot, and then over 120 FPS is for high refresh rate monitors.
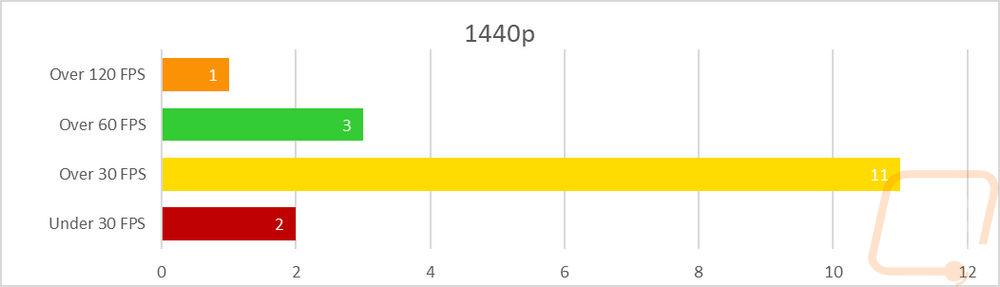
So how did the TUF Gaming 6500XT do? For 1080p which is where the 6500 XT was targeted and at 1080p each result was playable and a majority were smooth with 9 over 60 FPS and one over 120 FPS. Turning things up to 1440p the TUF Gaming 6500XT falls off but is still playable. There is one result (CS:GO) up over 120 FPS, three were over 60 FPS, but most were in the 30-59 FPS range with 11 in that range. Then two results were unplayable. Then at 4k, the 6500 XT falls on its face with CS:GO over 120 FPS and then only 3 other results were playable in that 30-59 FPS range. Most at 4k fall into the under 30 FPS unplayable range with 13 results in that range.
Of course, I have all of the actual in game results as well for anyone who wants to sort through the wall of graphs below. My main focus was seeing where the TUF Gaming 6500XT compared to the Sapphire 6500XT that I previously tested but I did also want to compare it with the older 5500 XT and GTX 1650 as well as the new RTX 3050 so I did average out all of the FPS results to get a better look at things. The TUF Gaming 6500XT somehow did manage to increase the average across all three resolutions compared to the Sapphire card with the same clock speed gaining 2 FPS at 1080p, 1 FPS at 1440p, and a half FPS at 4k. The CS:GO result increases the overall average. For example at 4k without that result, the average drops down to 20.03 FPS. The comparison with the GTX 1650, 5500XT, and 3050 still stand where our previous 6500XT was. The TUF Gaming 6500XT beats out the GTX 1650 handedly then for the 5500 XT the better performance I saw from the TUF card helped put it in front at 1080p but at 1440p and 4k, the 5500 XT performs significantly better. This is partially because that specific card had 8GB of VRAM, but also due to the limitations of the 6500 XT having that mobile-focused x4 PCIe lanes. Then for the RTX 3050, it is up in its own world. If you look through the individual results there are one or two results where the Sapphire card ends up on top over the TUF Gaming 6500XT like World War Z Aftermath where the TUF Gaming 6500XT lost 4 FPS and dropped that result down below 120 FPS. But most results have the TUF Gaming 6500XT being out in front as the average also shows.
|
1080p |
1440p |
4K |
|
|
GTX 1650 |
75.67 |
48.07 |
24.28 |
|
Sapphire RX 6500 XT |
85.47 |
55.34 |
25.52 |
|
TUF Gaming 6500XT |
87.41 |
56.54 |
26.03 |
|
RX 5500 XT |
85.64 |
59.43 |
31.17 |
|
RTX 3050 |
99.56 |
68.99 |
36.98 |
Compute Benchmarks
Now some people don’t need a video card for gaming, they need the processing power for rendering or 2D/3D production, or in some cases people who game also do work on the side. So it is also important to check out the compute performance on all of the video cards that come in. That includes doing a few different tests. My first test was a simple GPU Compute benchmark using Passmark’s Performance Test 10 and the TUF Gaming 6500XT once again came in faster than the Sapphire with the same overclock with a 5551 vs the Sapphires 5422. That improvement didn’t make any difference when compared with other cards, the GTX 1070 is still the next card up and by a big margin, and the 5500XT and GTX 1650 are down below the two 6500XT.
Blender is always my favorite compute benchmark because the open-source 3D rendering software is very popular and it isn’t a synthetic benchmark. Here I render all six scenes and combine the total time it takes in seconds using the provided Blender Benchmark on the 2.93.1 build. The TUF Gaming 6500XT came in slower than the Sapphire on this test, which is interesting because it has been faster on most other tests. But both 6500XT’s are worlds apart from any of the other cards tested here with the combination of the 4GB of VRAM and the x4 PCI lanes holding things back with high bandwidth situations like this. The older RX 5500 XT took less than half the time to run the same test. Do not plan on using any 6500XT for Blender.
Cooling Noise and Power
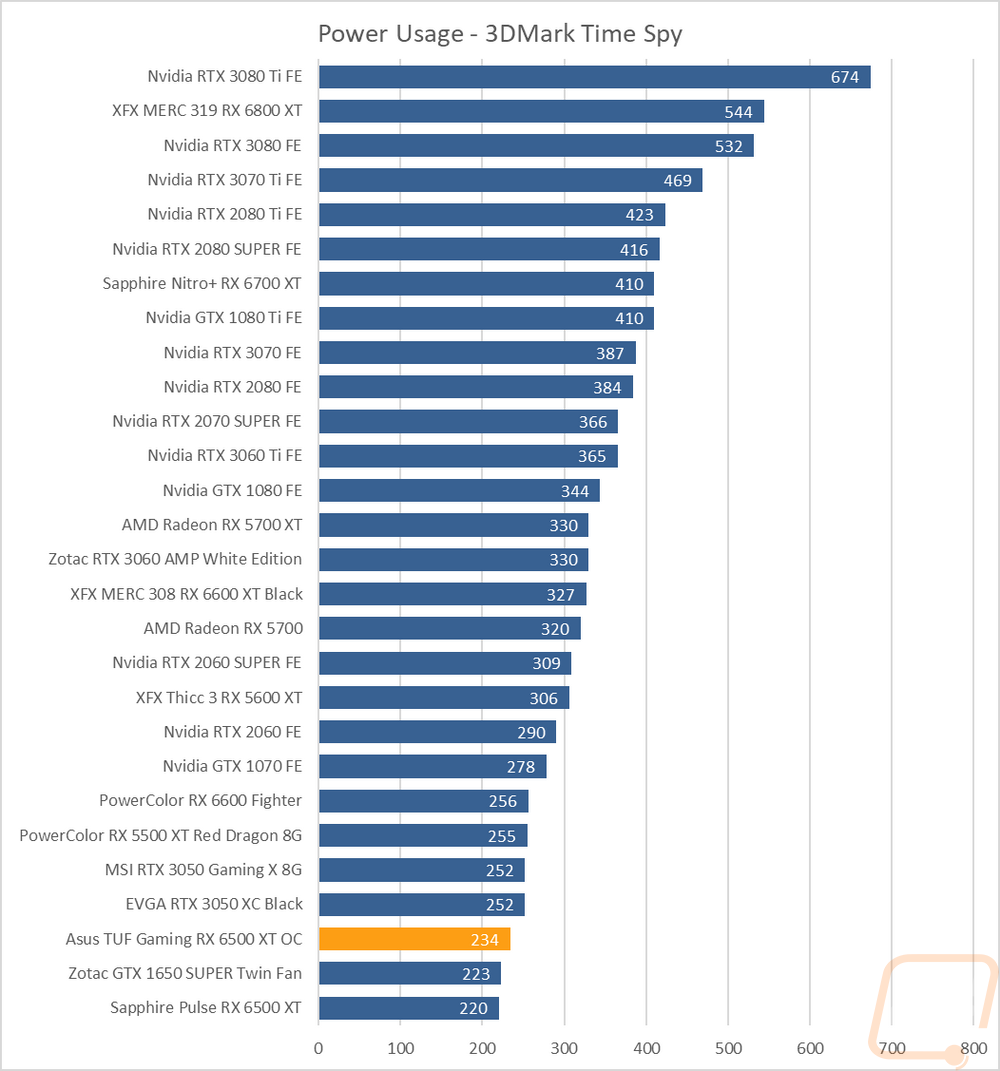
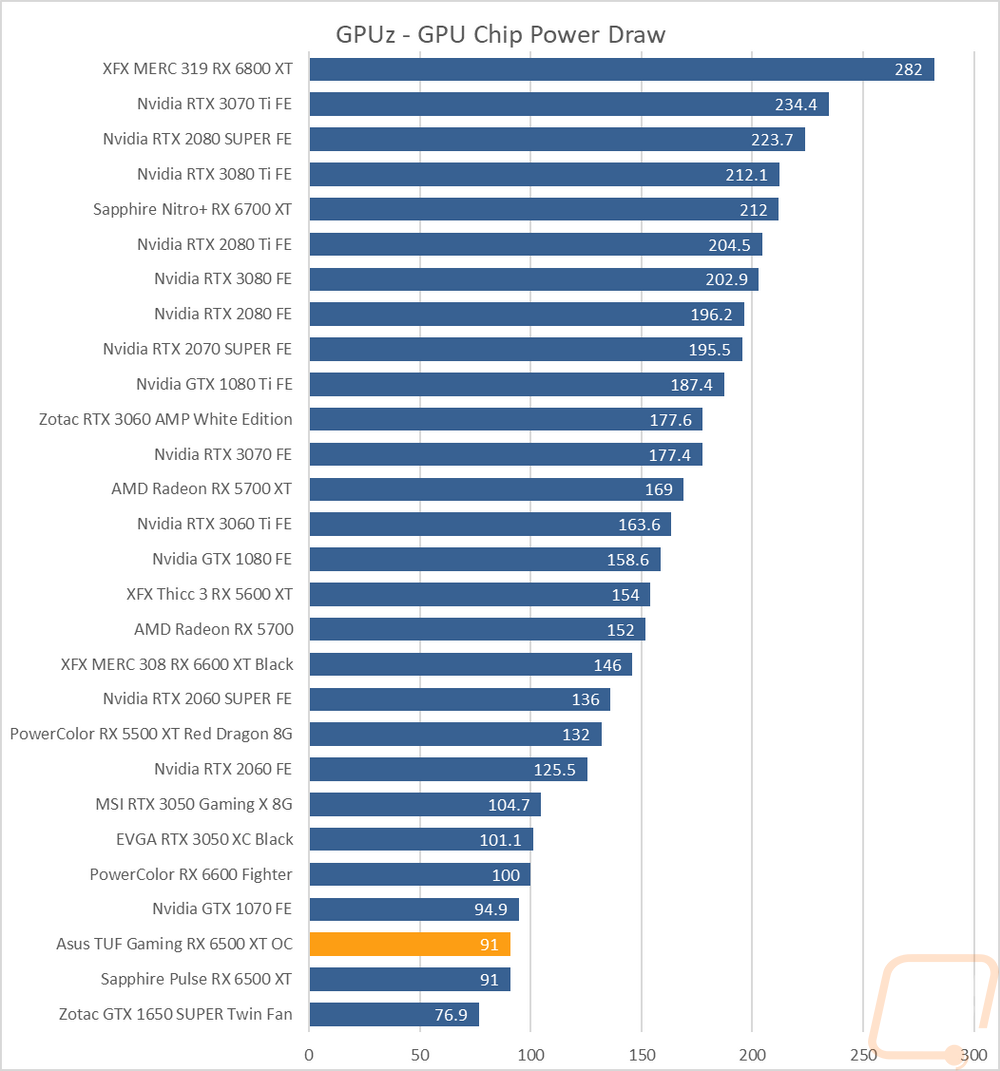
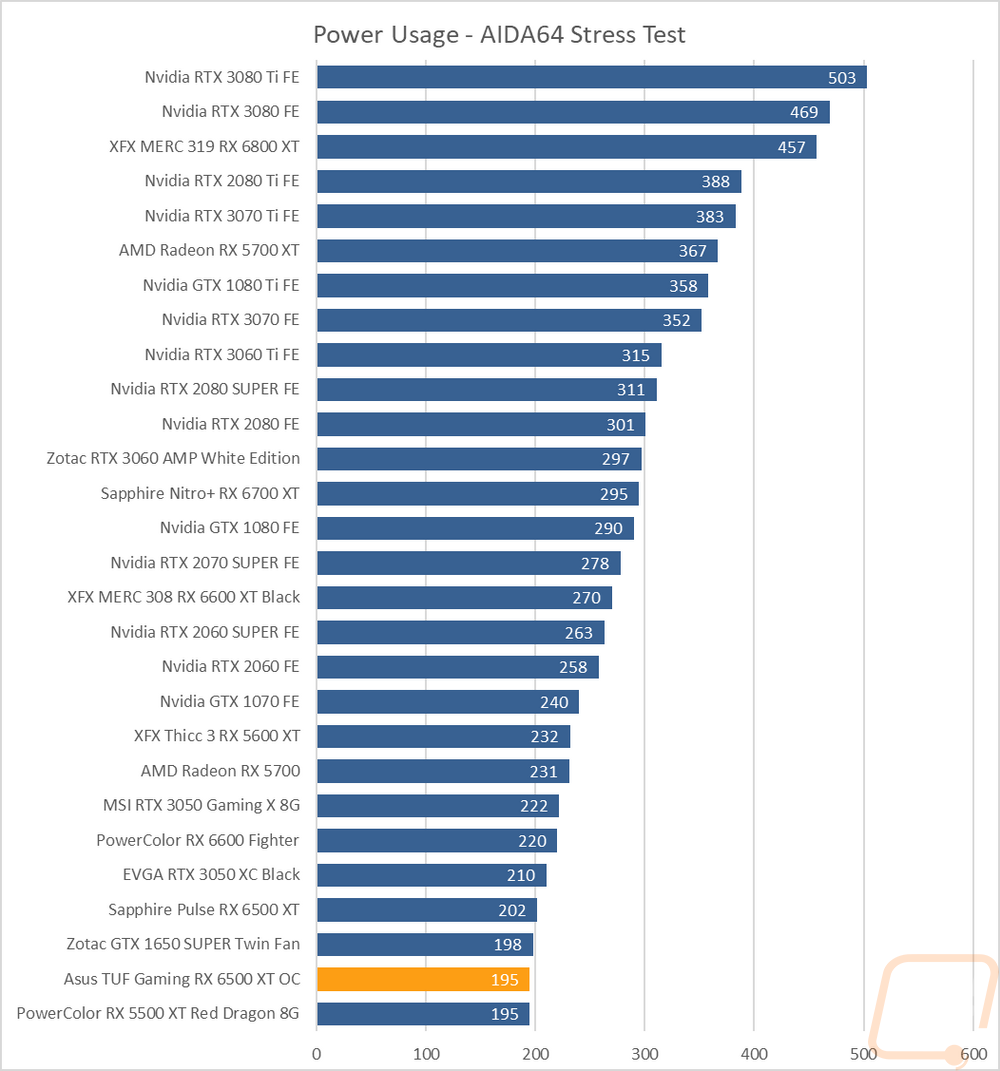
For my last few tests, rather than focusing on in game performance, I like to check out other aspects of video card performance. These are also the most important ways to differentiate the performance between cards that have the same GPU. To start things off I took a look at power usage. For this, I use our Kill-A-Watt hooked up to the test bench to record the total wattage of the system. I ran two tests with the first using 3DMark Time Spy to put the system under a load similar to normal in game performance. Here our test system with the TUF Gaming 6500XT pulled 234 watts which was 14 watts higher than the Sapphire card but still below the older 5500 XT and the RTX 3050’s which were all up in the 255 range. At the same time with Time Spy I also use GPUz to check out the onboard reading for GPU power draw at the chip. I was surprised to see that the TUF Gaming 6500XT was registering the same 91-watt limit as the Sapphire. I thought for sure with the power at the kill-a-watt being higher and with the TUF Gaming 6500XT performing better that we would see a small bump in the power going to the GPU. Lastly, I run AIDA64’s stress test on the video card to load up only the GPU, and using the Kill-A-Watt the test bench with the TUF Gaming 6500XT came in at 195 watts right with the 5500XT and 7 watts below the Sapphire 6500 XT.
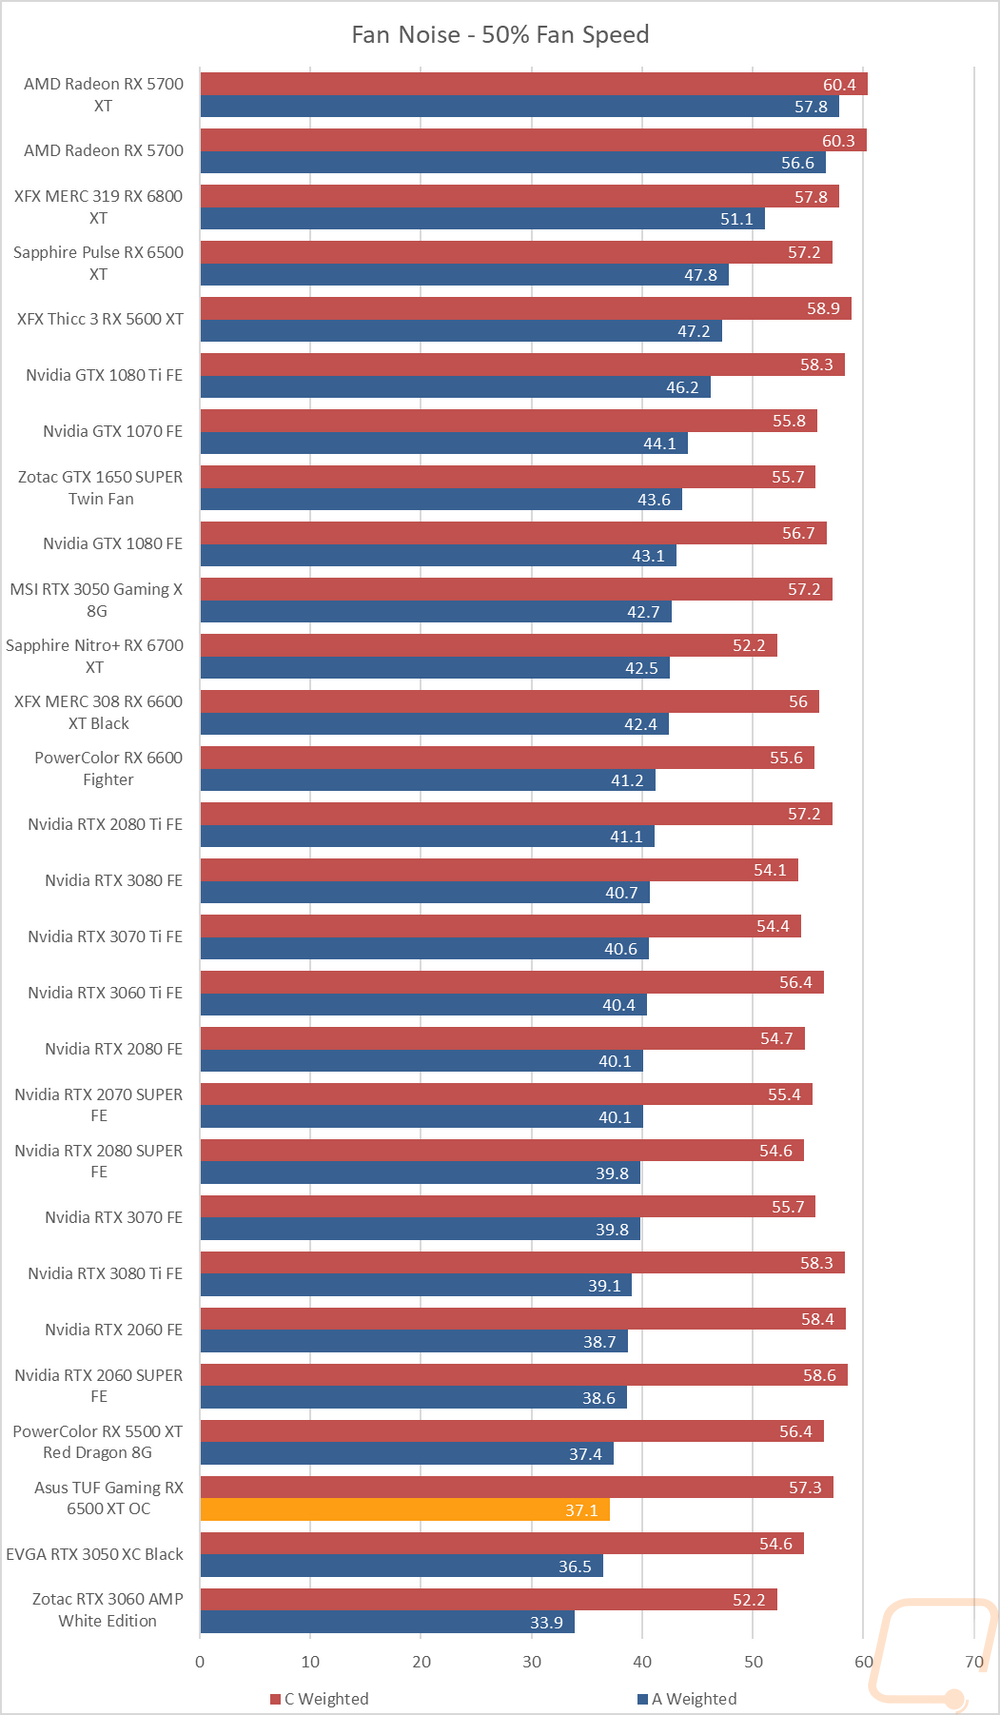
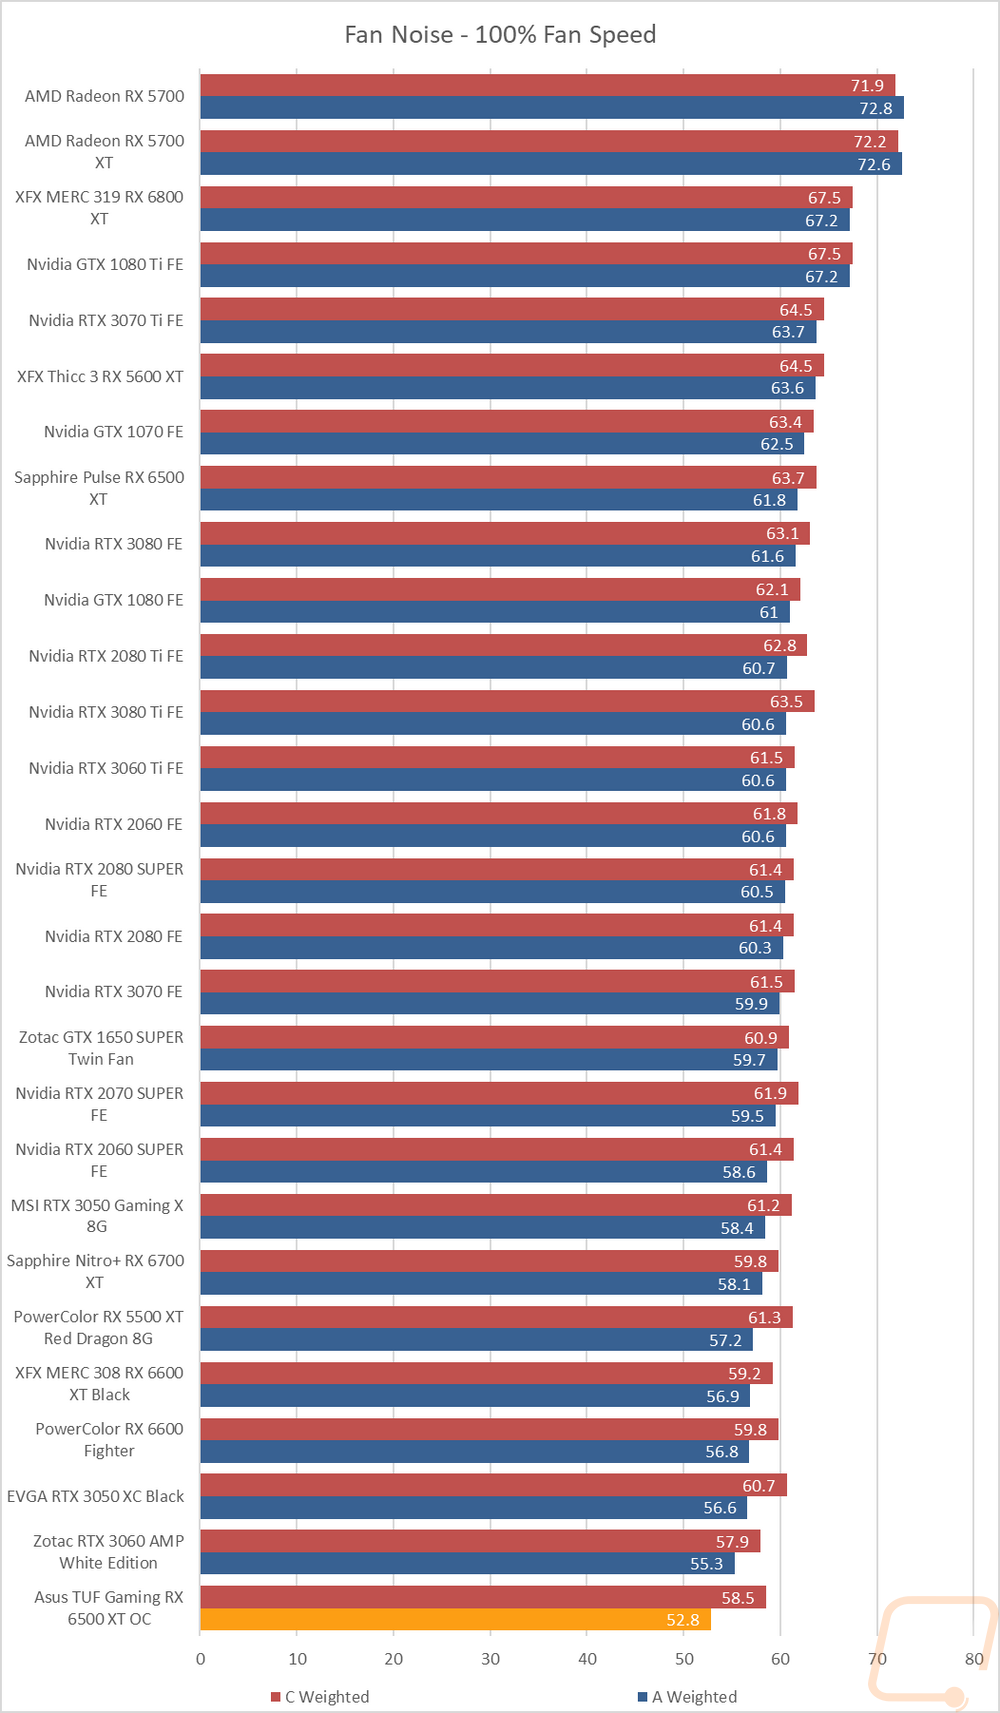
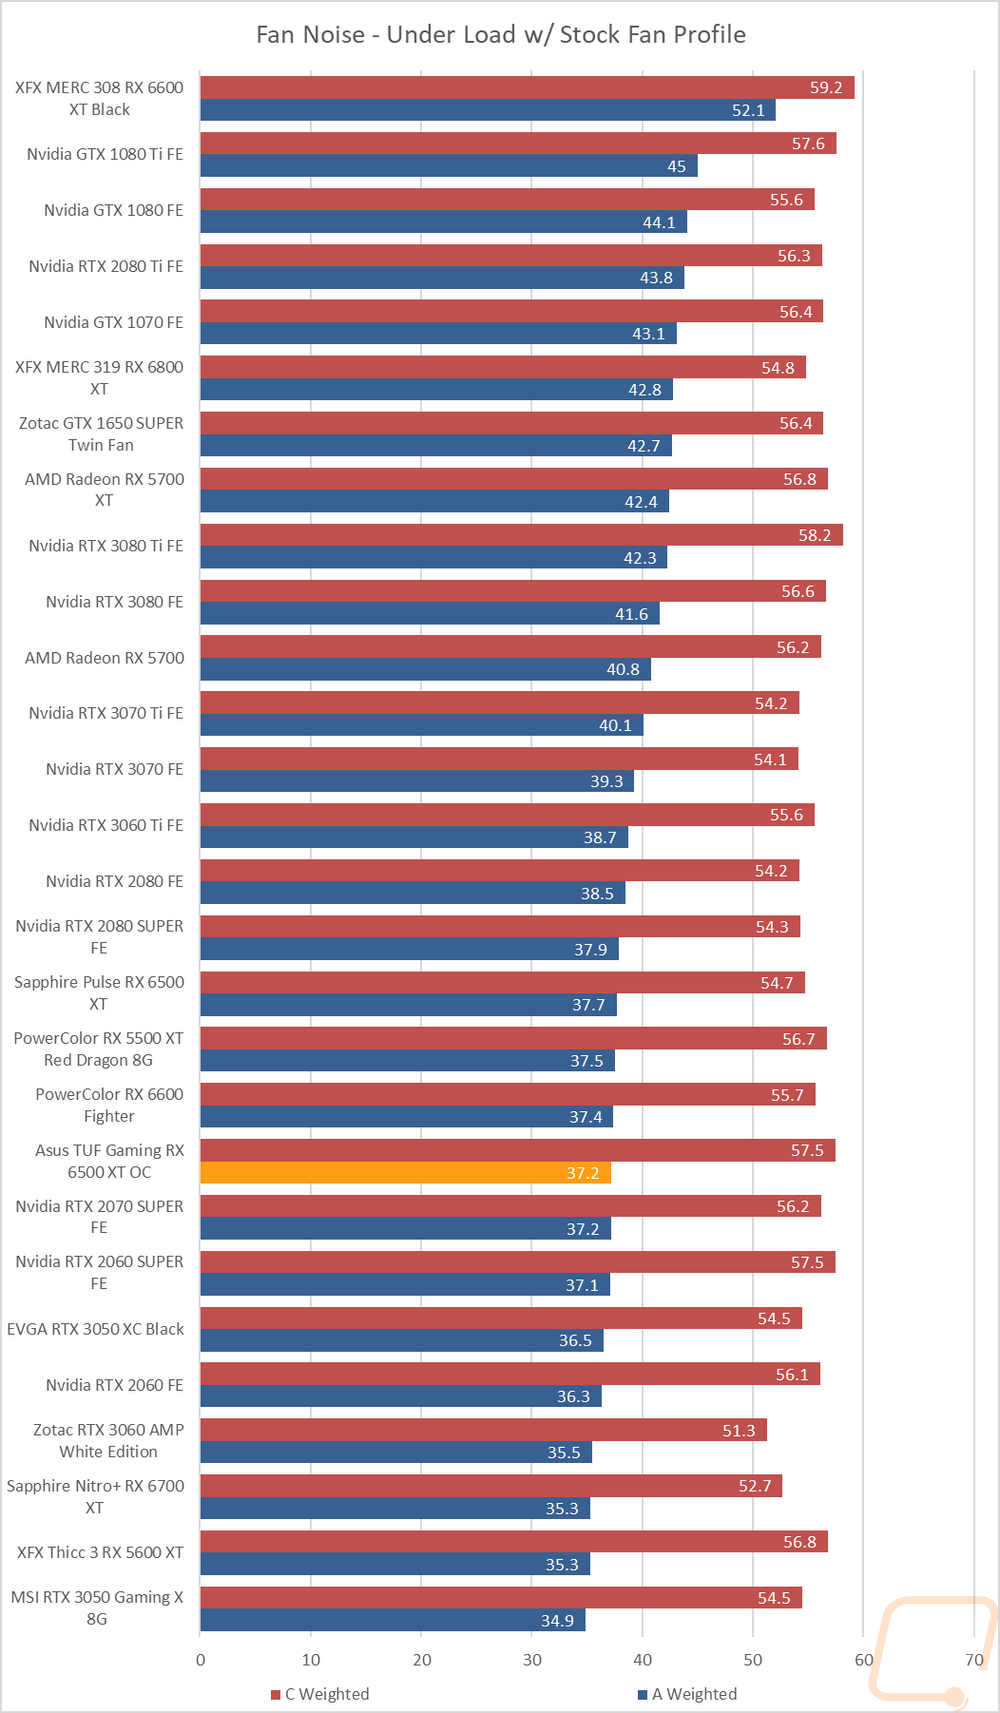
My next round of tests were looking at noise levels. These are especially important to me because I can’t stand to listen to my PC whirling. Especially when I’m not in game and other applications are using the GPU. For my testing, though I first tested with the fan cranked up to 100% to get an idea of how loud it can get, then again at 50% to get an idea of its range. I test using both A and C weighting, A is the standard way and C has a little more of the low end to check for low-level hums. The TUF Gaming 6500XT did really well in the A-weighted test with just two cards coming in lower at 50% and at the complete bottom at 100% fan speed. It was a little nosier on the c-weighted test showing it may have a little more low-end hum but that is normally in a range mostly unheard. At 100% fan speed, however, the C-weighted results were much better and near the bottom of the chart. I also take a look at noise performance while under load. For that when running AIDA64’s stress test I wait until the temperature of the card has leveled off and then measure how loud things are when the card is at its worst-case scenario with the stock fan profile. Here the TUF Gaming 6500XT was in the bottom 1/3 of the results. More importantly, here it was down below the Sapphire 6500 XT with the A-weight test but a little noisier on the c-weighted test similar to the 50% fan speed test. Overall the TUF Gaming 6500XT was well below the Sapphire 6500XT, especially with the fans cranked up to 100%.
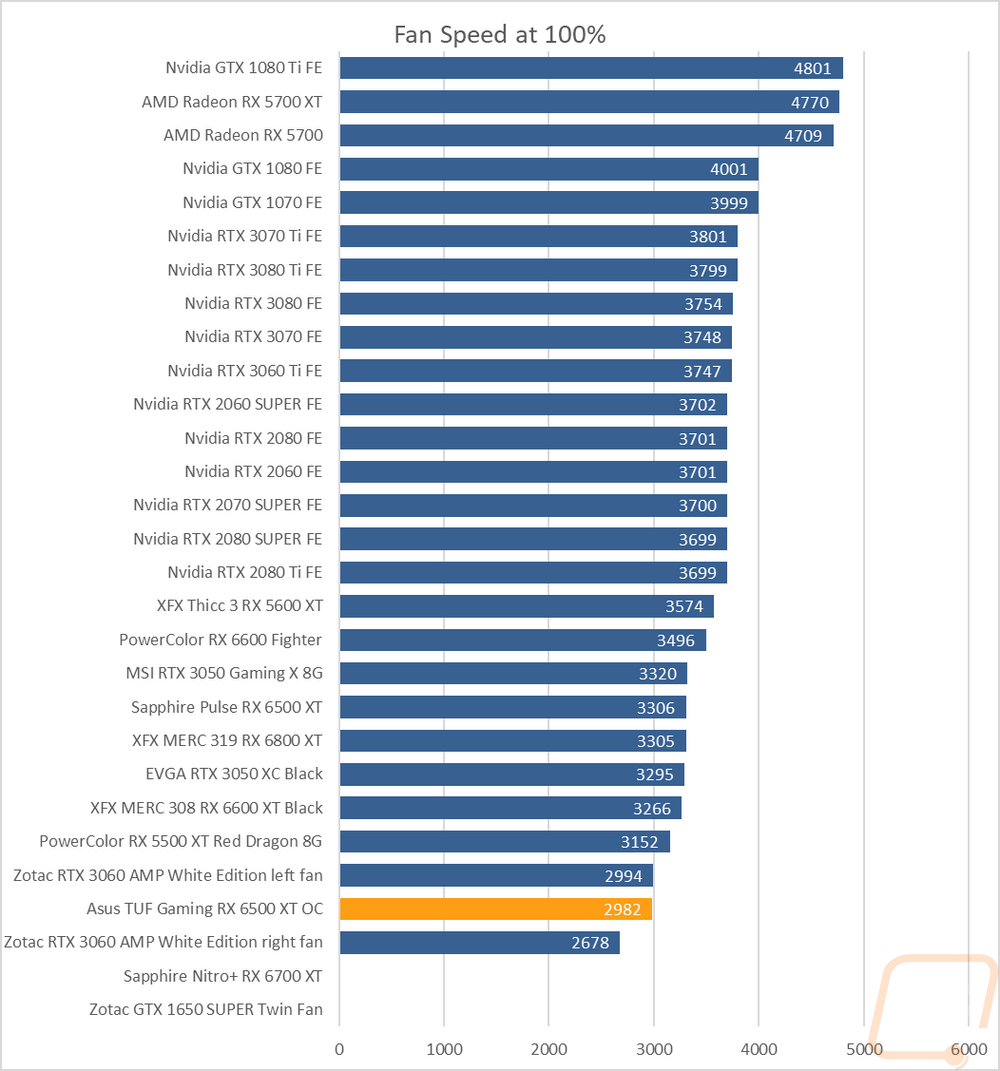
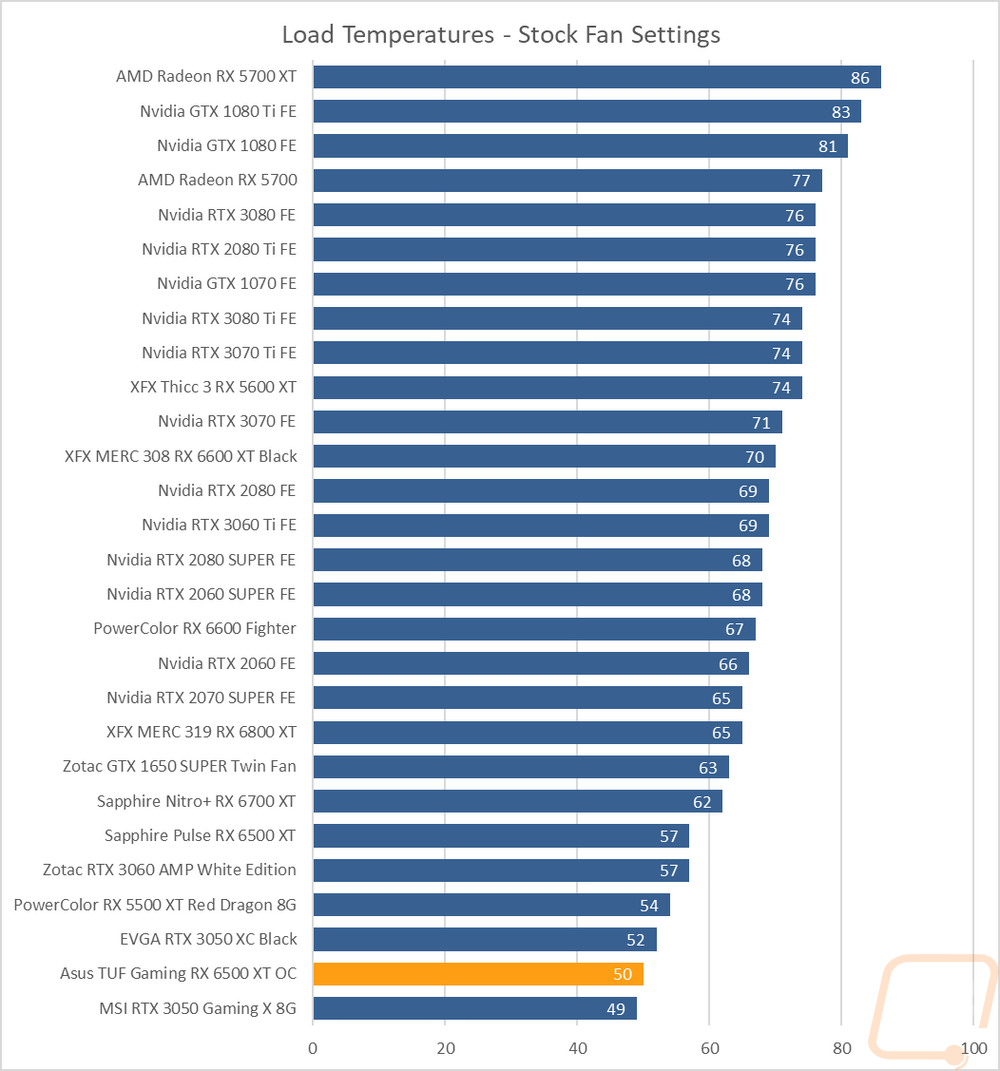
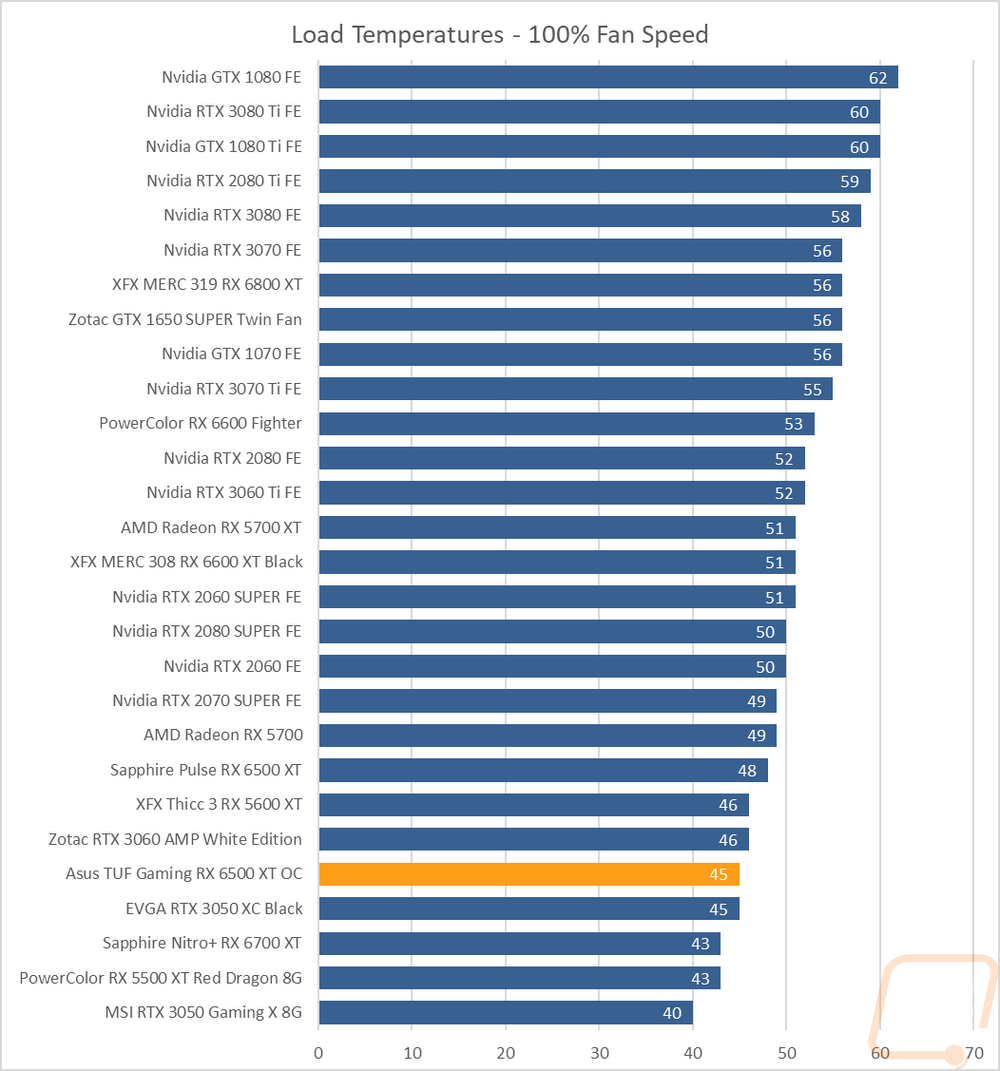
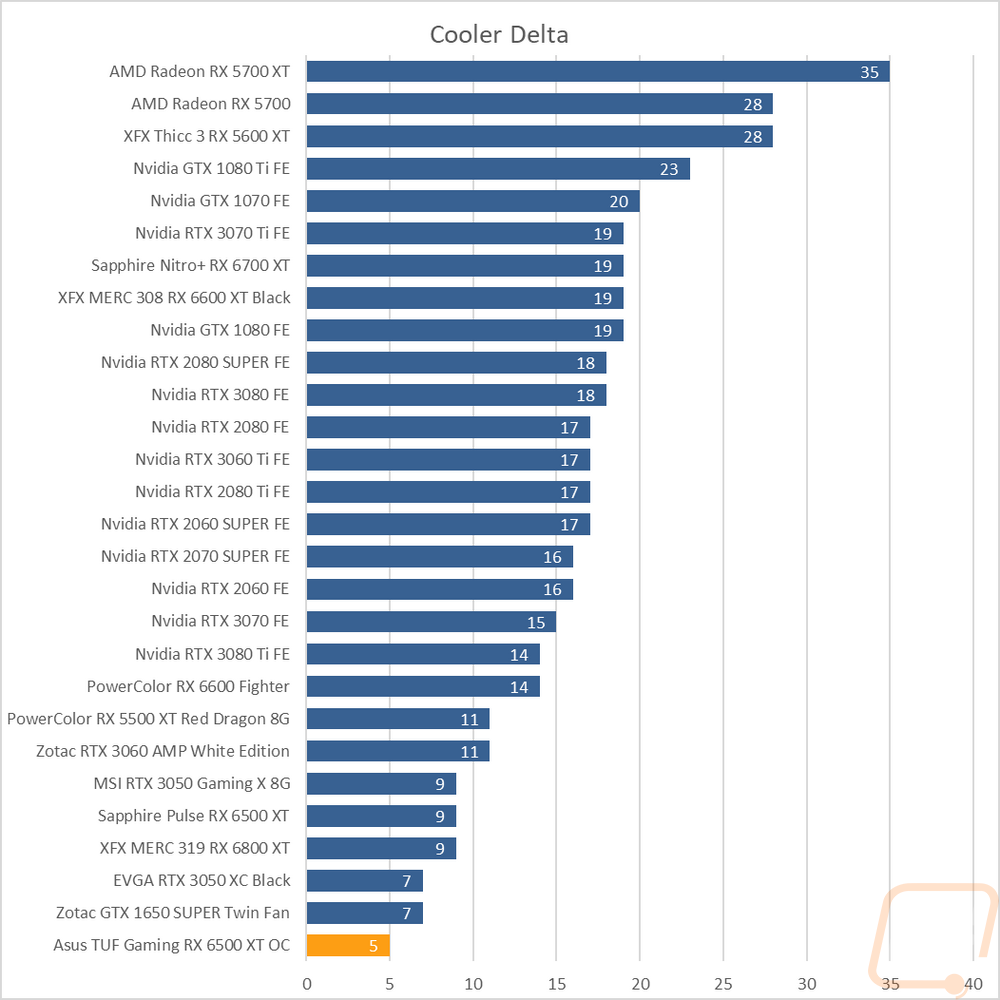
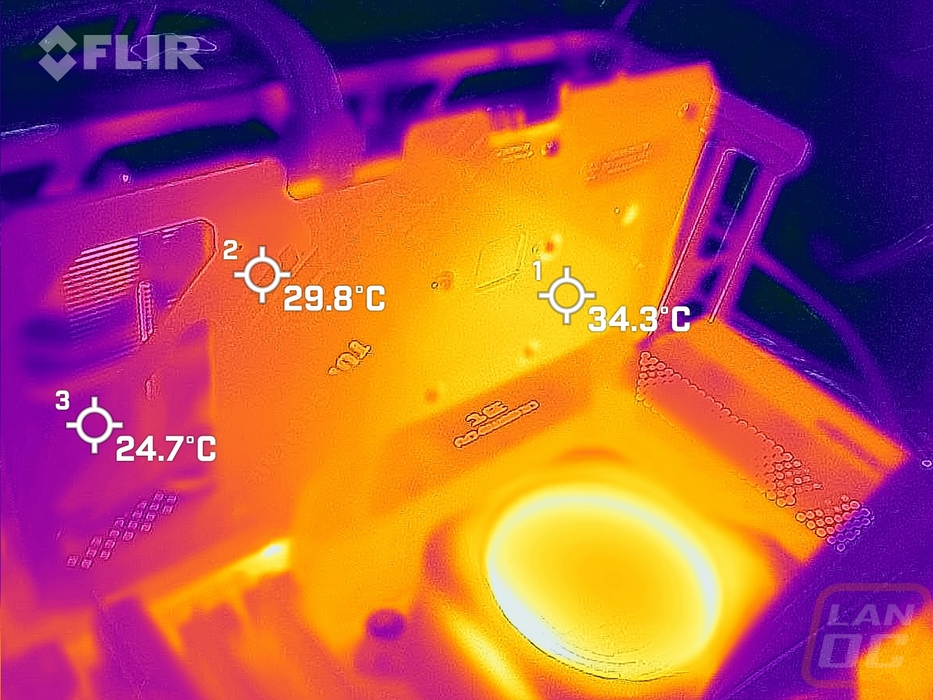
To finish up my testing I of course had to check out the cooling performance. To do this I ran two different tests. I used AIDA64’s Stress Test run for a half-hour each to warm things up. Then I documented what temperature the GPU leveled out at with the stock fan profile and then again with the fans cranked up to 100%. With the stock profile, the TUF Gaming 6500XT was running very cool at 50c. This is especially impressive given how quiet the TUF Gaming 6500XT was running and also the horizontal heatsink layout that is usually less efficient. For comparison, the Sapphire 6500 XT was running 7c warmer on this same test. Then with the fans cranked up, the TUF Gaming 6500XT ran at 45c. The Sapphire card closed the gap here with 3c between them. The TUF Gaming 6500XT’s two fans do run at a lower RPM at 100% fan speed. This put the delta between the stock fan profile and the 100% test at 5c which is on the low end. But we see that sometimes on lower-end cards where you can only cool things down so much.
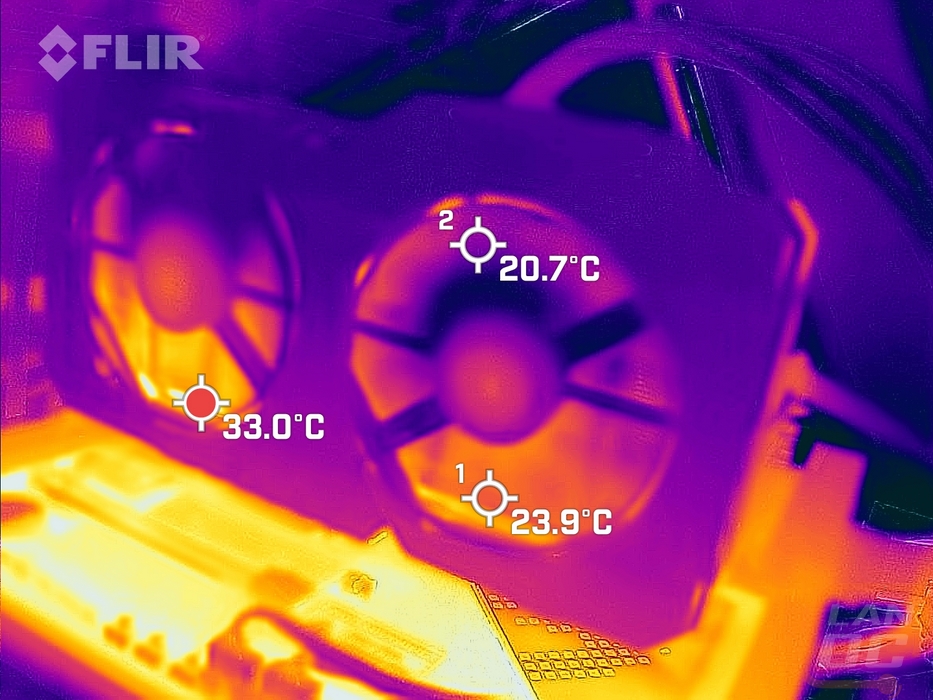
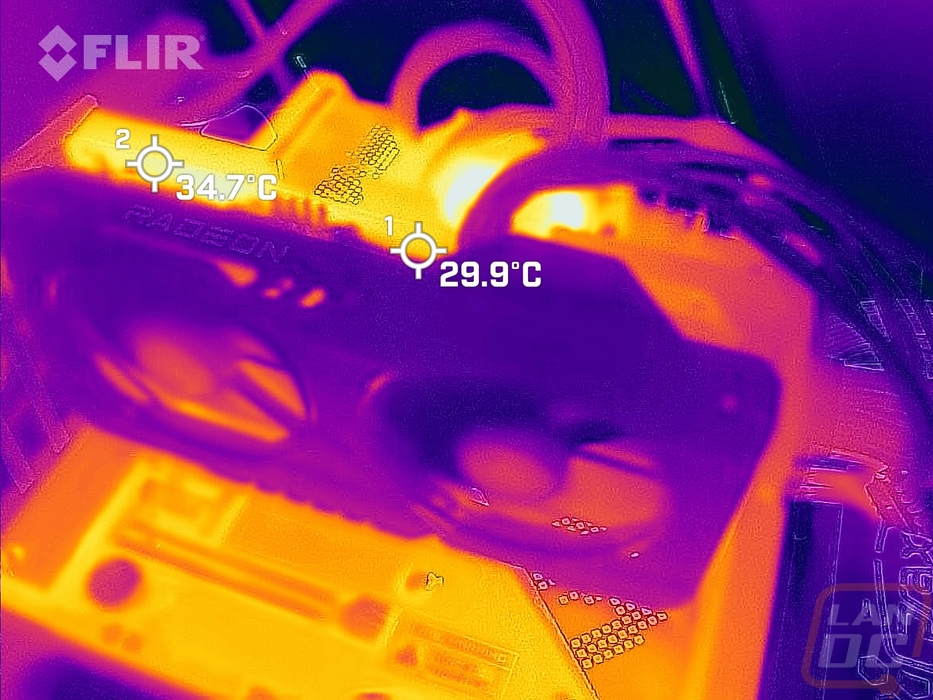
While running the stock fan profile testing I also took the time to get a few thermal images so we could see what is going on. I found it interesting that on the fan side there is a clear difference between the top half of the card and the bottom. But with the heatpipes on the bottom, this is showing the bottom half of the card pulling more heat from the heatpipes before they get up into the top half. The PCB peeking through on the top angle view shows the PCB not running too hot but it is warmer on the left side which has the VRM and GPU so that makes sense. That can also be seen on the backplate with that area being warmer and things being almost room temperature down on the end of the card where the TUF Gaming 6500XT has the openings for the fan to blow through.
Overall and Final Verdict
Coming in to testing the Asus TUF Gaming 6500 XT I at least had a good idea of what to expect from the 6500 XT. But I still managed to be surprised that the TUF Gaming 6500XT outperformed the previous 6500 XT that I tested while having the same overclock. Of course, the TUF Gaming 6500XT did have the same limitations that all 6500XT’s have with the 4GB of VRAM and the PCIe interface only using x4 lanes which really holds the card back at 1440p and 4k and even at times extremely high detail levels at 1080p. This can be seen a lot when you compare the performance of the older RX 5500 XT to the 6500 XT. The TUF Gaming 6500XT was able to edge out in front of that card in our 1080p testing with that performance improvement over the Sapphire but the 5500 XT was still out ahead at the higher resolutions and with Blender where all of the 6500XT’s fall on their face.
The TUF Gaming 6500XT however stands out in a few other ways, especially when compared to the direct competition. For starters, the TUF focus means the card has an all-metal fan shroud which I love, and a metal backplate that is all tied in together. The card is well protected and shouldn’t have any sagging issues in the future as well. Asus was proud of their cooling performance when they mentioned sending the card over and I can see why. The 6500XT doesn’t run too hot in general, but the TUF Gaming 6500XT outperformed the other 6500XT that I tested, even with it having a horizontal heatsink layout. Even more impressive to me was while having that cooling performance the card also ran very quiet. Even when the fans were cranked to 100% it was the quietest card I’ve tested this year.
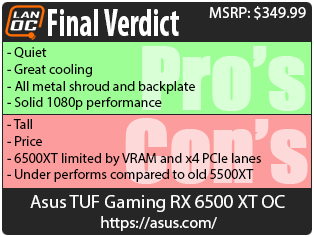
The only issue that I had with the TUF Gaming 6500XT itself was that this is a tall card with one section of the shroud sticking up higher than the rest. Beyond that, the only other concern is with the pricing. The TUF Gaming 6500XT has an MSRP of $349.99 which is a lot higher than the base MSRP of the 6500 XT cards. But it is more realistic to the market which can be seen with a lot of those $199 cards selling up near it in price. The Sapphire I tested for example is selling for $319.99 on Newegg right now. The TUF Gaming 6500XT on the other hand is in stock and available at that $349 price point. I do think it is still priced high, however. It is the second-highest 6500XT on Newegg right now even with the other cards being marked up or resold at higher prices. But if the price settles down this is a great card if the 6500XT is what you are looking for. Like with all of the 6500 XT’s, you need to make sure that you aren’t planning on gaming at higher than 1080p. But if that is the case, the 6500 XT is at least available and not used.
Live Pricing: HERE


