RTX and DLSS
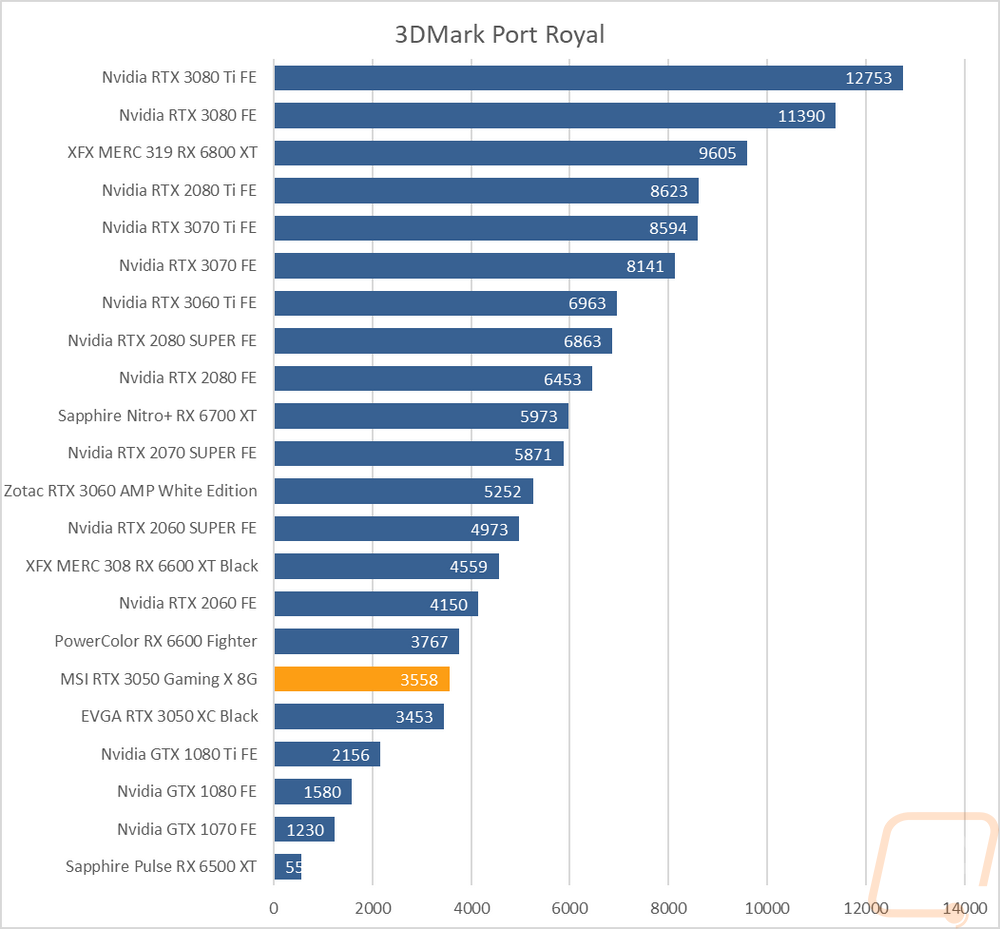
Being an RTX card I also like checking out the performance of some of Nvidia’s features. Namely the ray tracing performance and the performance improvements you can see by using DLSS combined with the tensor cores. My first test goes back to our synthetic benchmarks with 3DMark where I check out their Port Royal benchmark. This is the one test that does also have AMD Ray Tracing support which is great to get a look at how different cards including older non-RTX cards perform. The 3050 Gaming X gained 105 points on the stock clocked card which still wasn’t enough to overtake the 6600 or catch up to the RTX 2060.
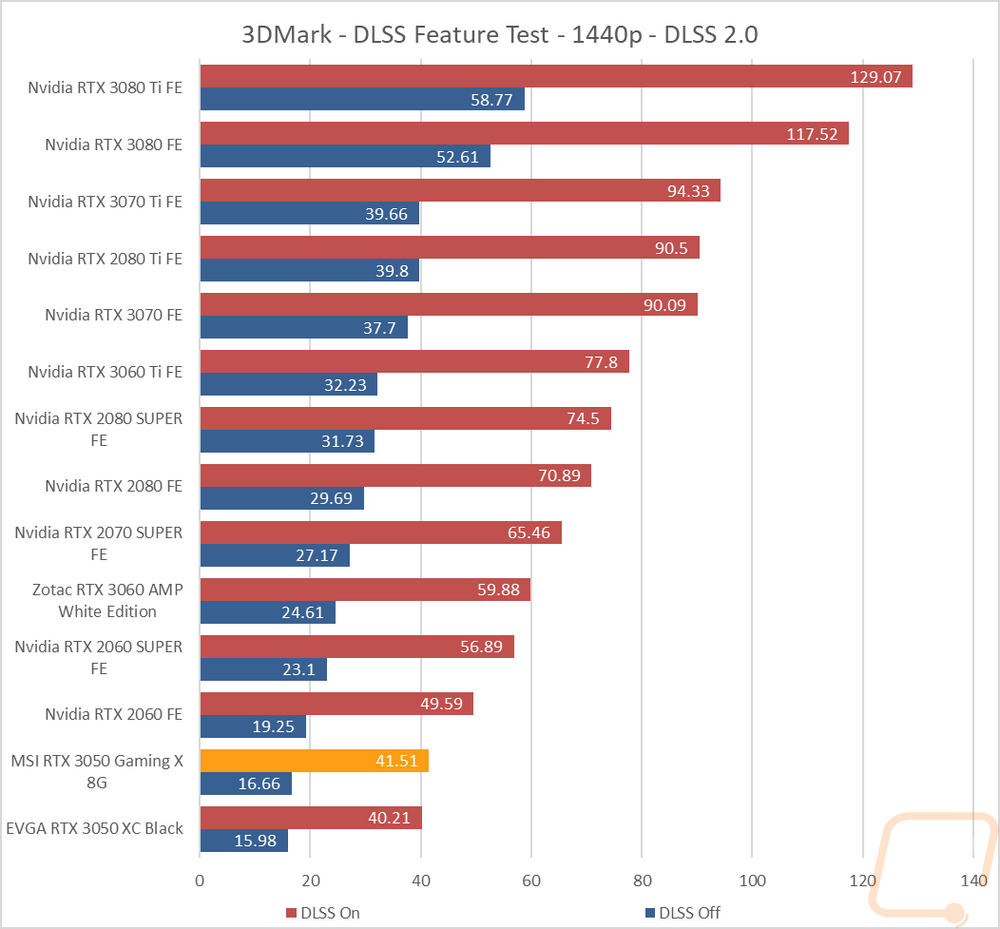
3DMark also has added in a few feature tests, one being a look at DLSS performance. For this one, I have the resolution set to 1440p and DLSS 2.0 turned on. I then have run the test on every card supported to get a comparison on how their test performs with and without DLSS. The 3050 Gaming X gained over 1 FPS with DLSS on over the stock card and over half an FPS without DLSS. More importantly, this shows just how much DLSS can help improve performance when it is optimized.
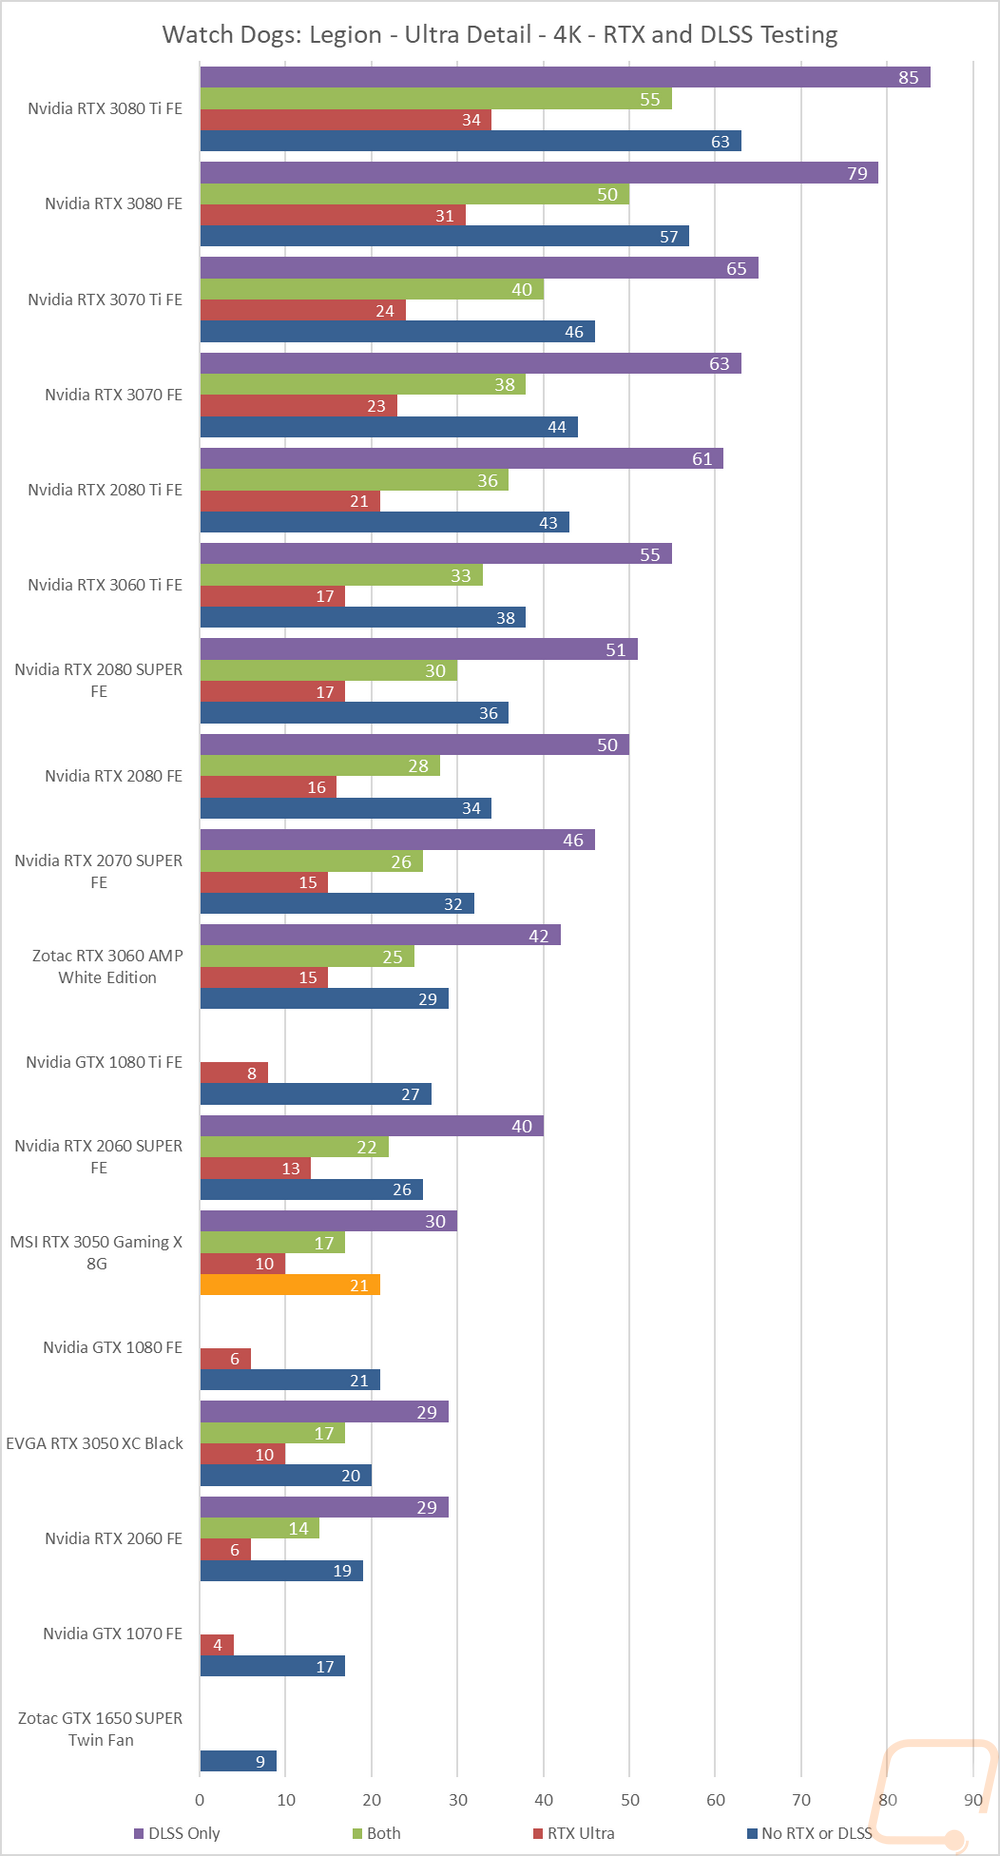
I then jumped into game tests, this time with Watch Dogs: Legion. For this one, I wanted to get an idea of the performance you will see when taking advantage of Nvidia’s RTX and DLSS features. I tested at 4k with the ultra detail setting and with ultra being the setting for DLSS and RTX when they are on as well. I then test with no RTX or DLSS on and then with RTX DLSS on and off and on together. Here the 3050 Gaming X started with one more FPS in the no-RTX and no-DLSS test and it also had one more FPS in the DLSS result compared to the stock clocked card.
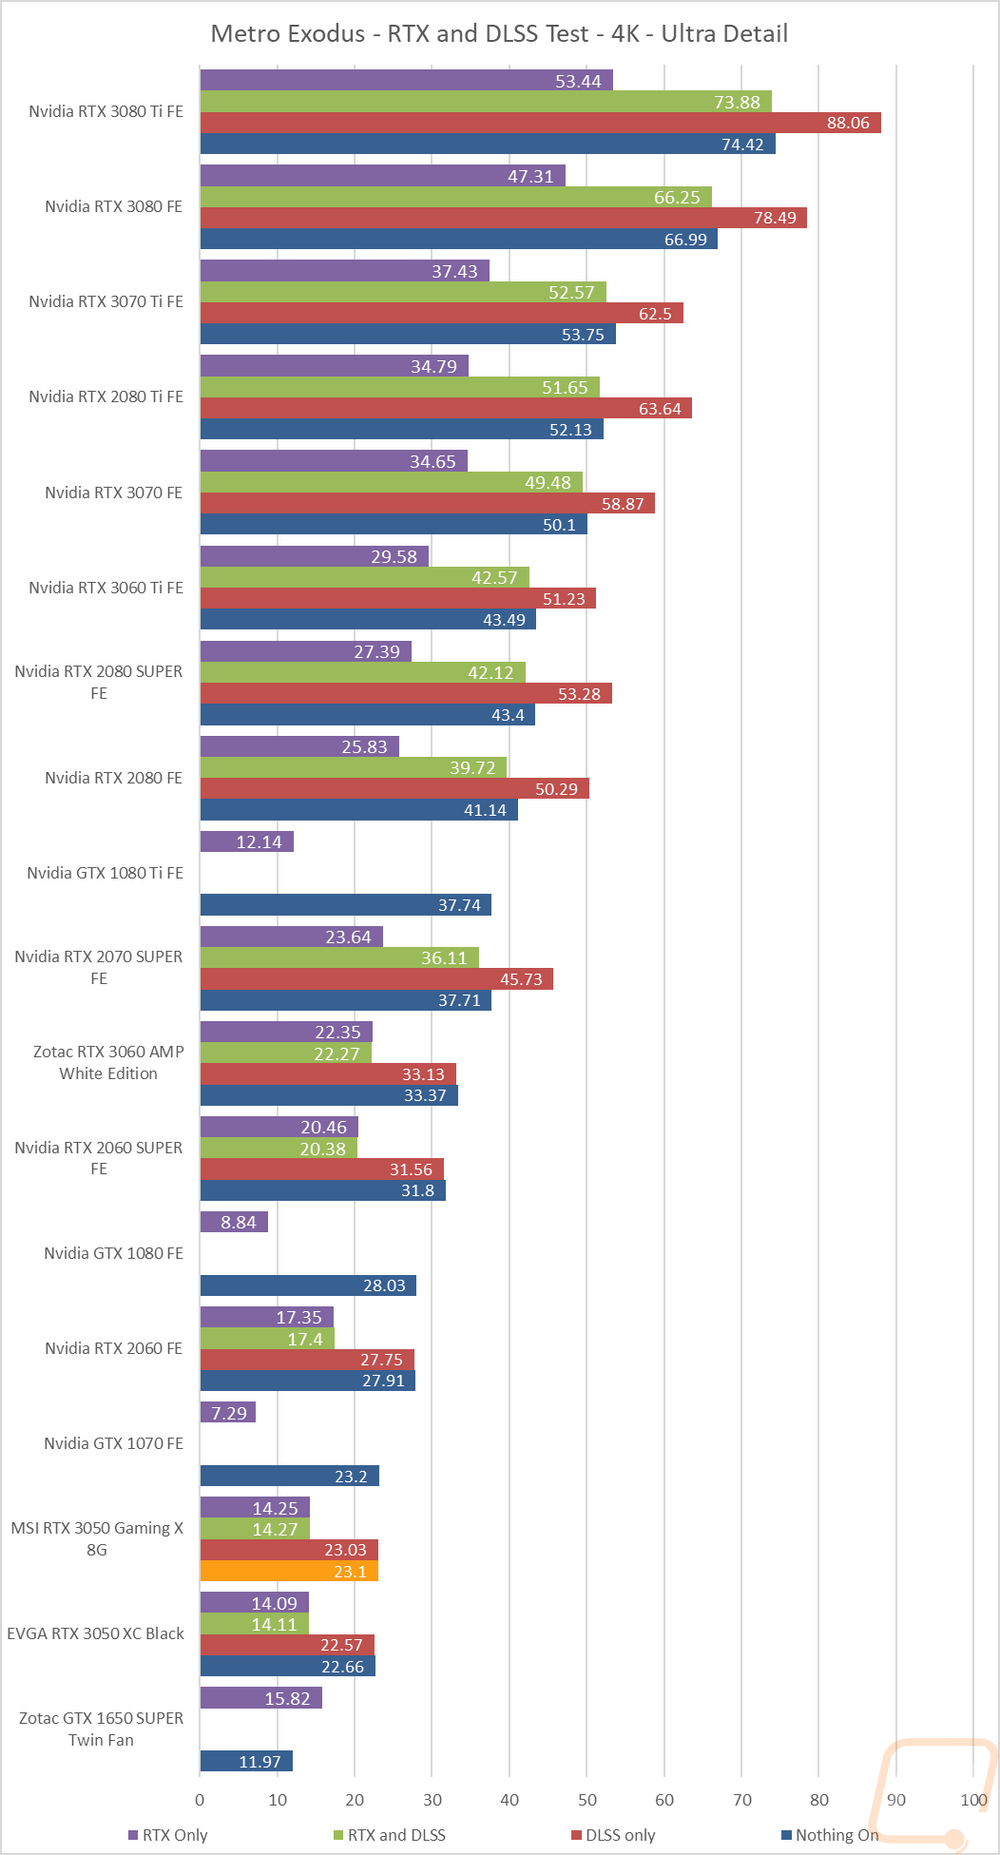
Next, I wanted to check out the performance in Metro Exodus which we have used for testing for a long time now. This test is similar as well with it set to 4K and Ultra detail, I use the included benchmark to test DLSS and RTX individually and then with them both on and both off to give us a look at overall frame rates depending on which direction you go. The 3050 Gaming X did gain on the stock clocked card a little here but not by anything to be concerned with. Overall though both 3050’s struggled with the DLSS result on this one, basically matching the speed of the non-DLSS tests.
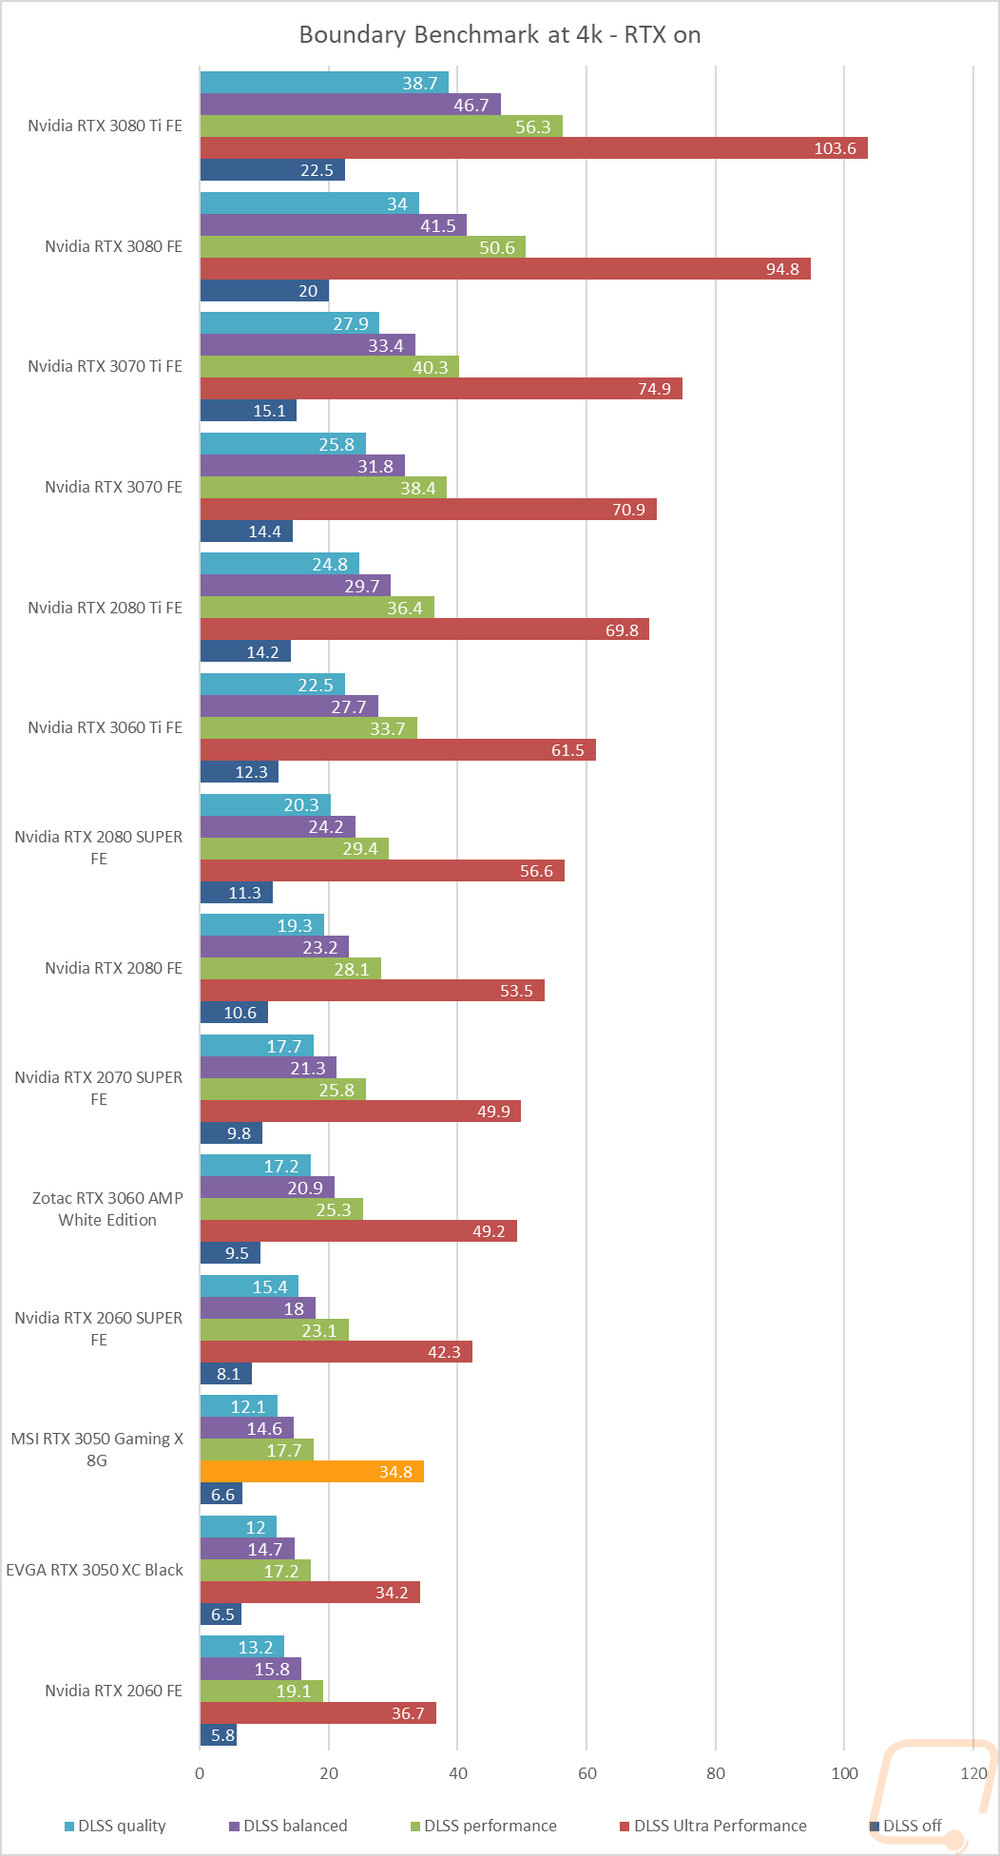
Next, I tested using a benchmark based on the game Boundary. For this one, I wanted to see how all of the different DLSS settings would perform, including turning it off completely. This is run using the free benchmark and with the resolution set to 4k and RTX on. In the Boundry Benchmark, the 3050 Gaming X shows just how much DLSS can help, especially when running at DLSS Ultra Performance where the 3050 Gaming X jumped from 6.6 up to 34.8.
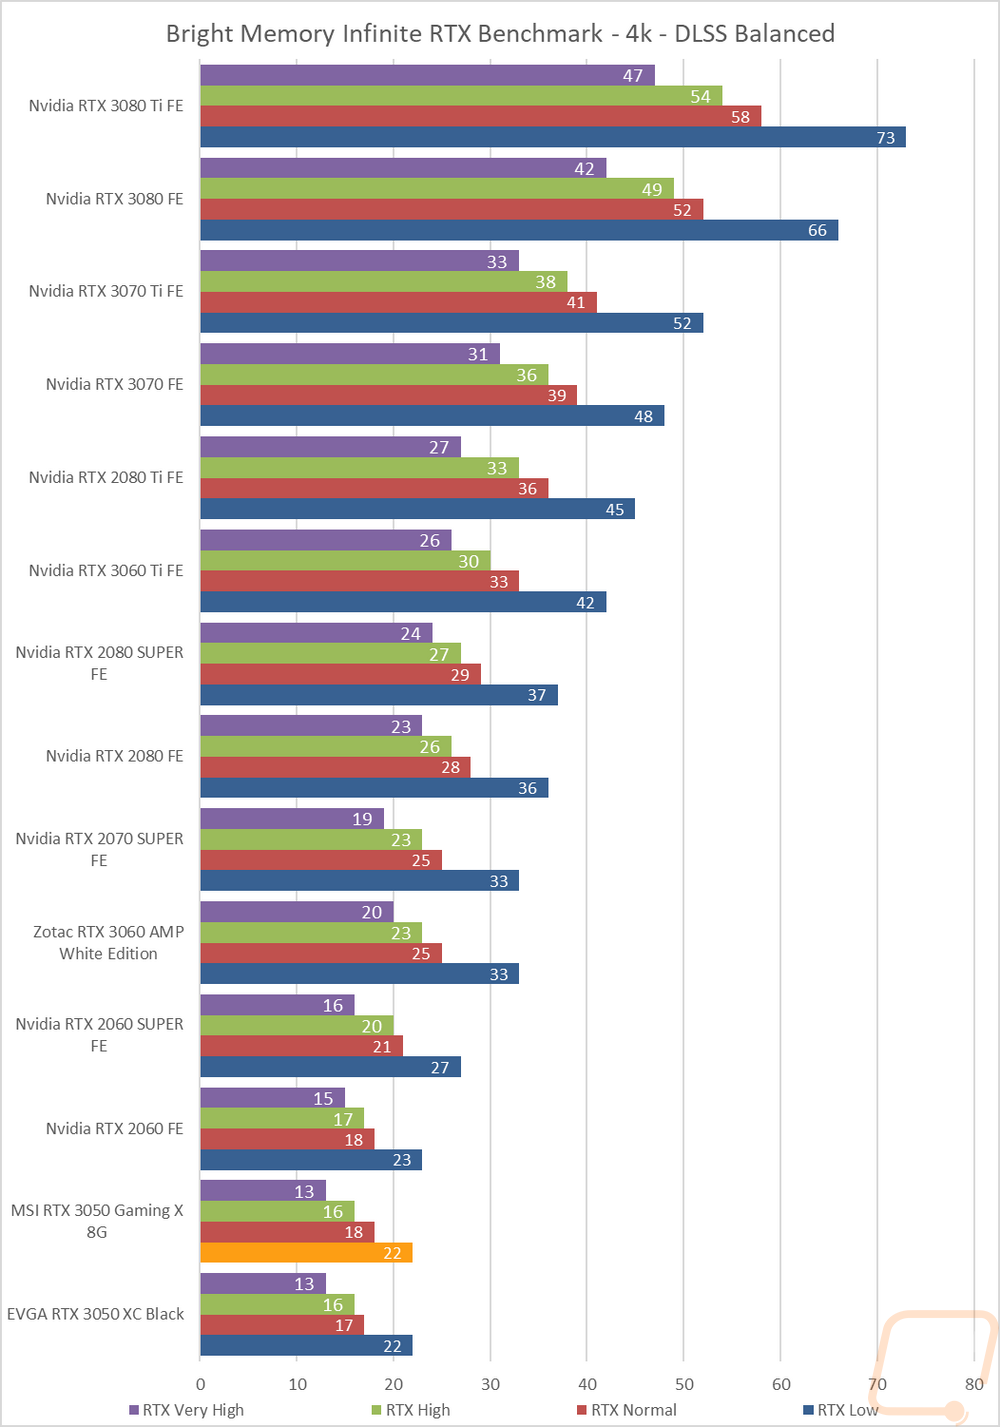
The last tests were done in a benchmark based on the game Bright Memory with their free steam benchmark. This is similar to the previous Boundary test only it is looking at RTX settings individually with the resolution set to 4K and DLSS is set to the balanced setting. The 3050 Gaming X isn’t designed for 4k gaming, especially with RTX on but this test does show the performance difference between the different RTX detail levels. The very high RTX test came in at 13 FPS, going to the high detail jumps up to 16 FPS and 18 on the normal settings.