In-Game Benchmarks
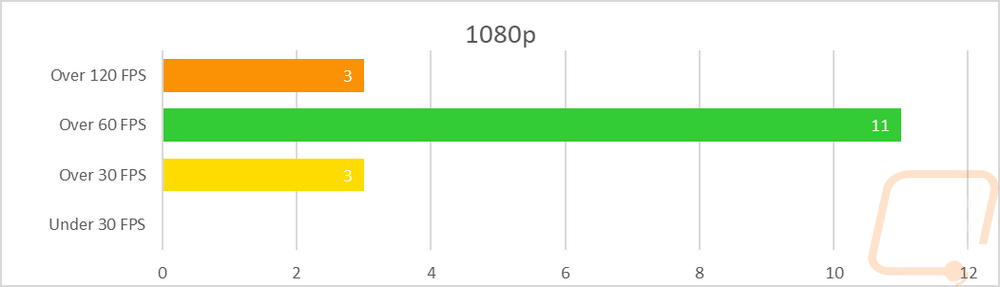
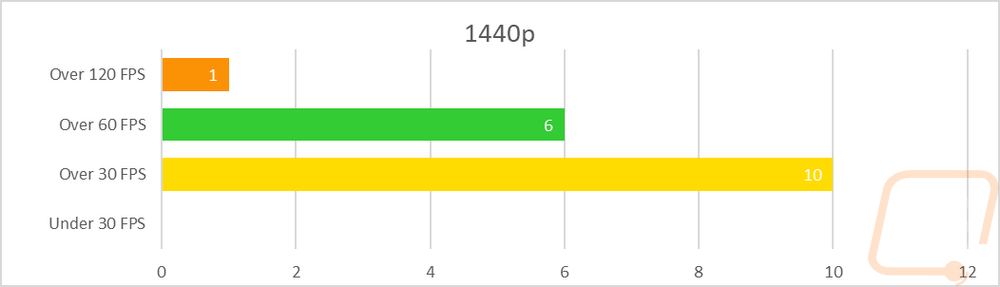
Now we finally get into the in game performance and that is the main reason people pick up a new video card. To test things out I ran through our new benchmark suite that tests 10 games at three different resolutions (1080p, 1440p, and 4k). Most of the games tested have been run at the highest detail setting and a mid-range detail setting to get a look at how turning things up hurts performance and to give an idea of if turning detail down from max will be beneficial for frame rates. In total, each video card is tested 54 times and that makes for a huge mess of results when you put them all together. To help with that I like to start with these overall playability graphs that take all of the results and give an easier-to-read result. I have one for each of the three resolutions and each is broken up into four FPS ranges. Under 30 FPS is considered unplayable, over 30 is playable but not ideal, over 60 is the sweet spot, and then over 120 FPS is for high refresh rate monitors.
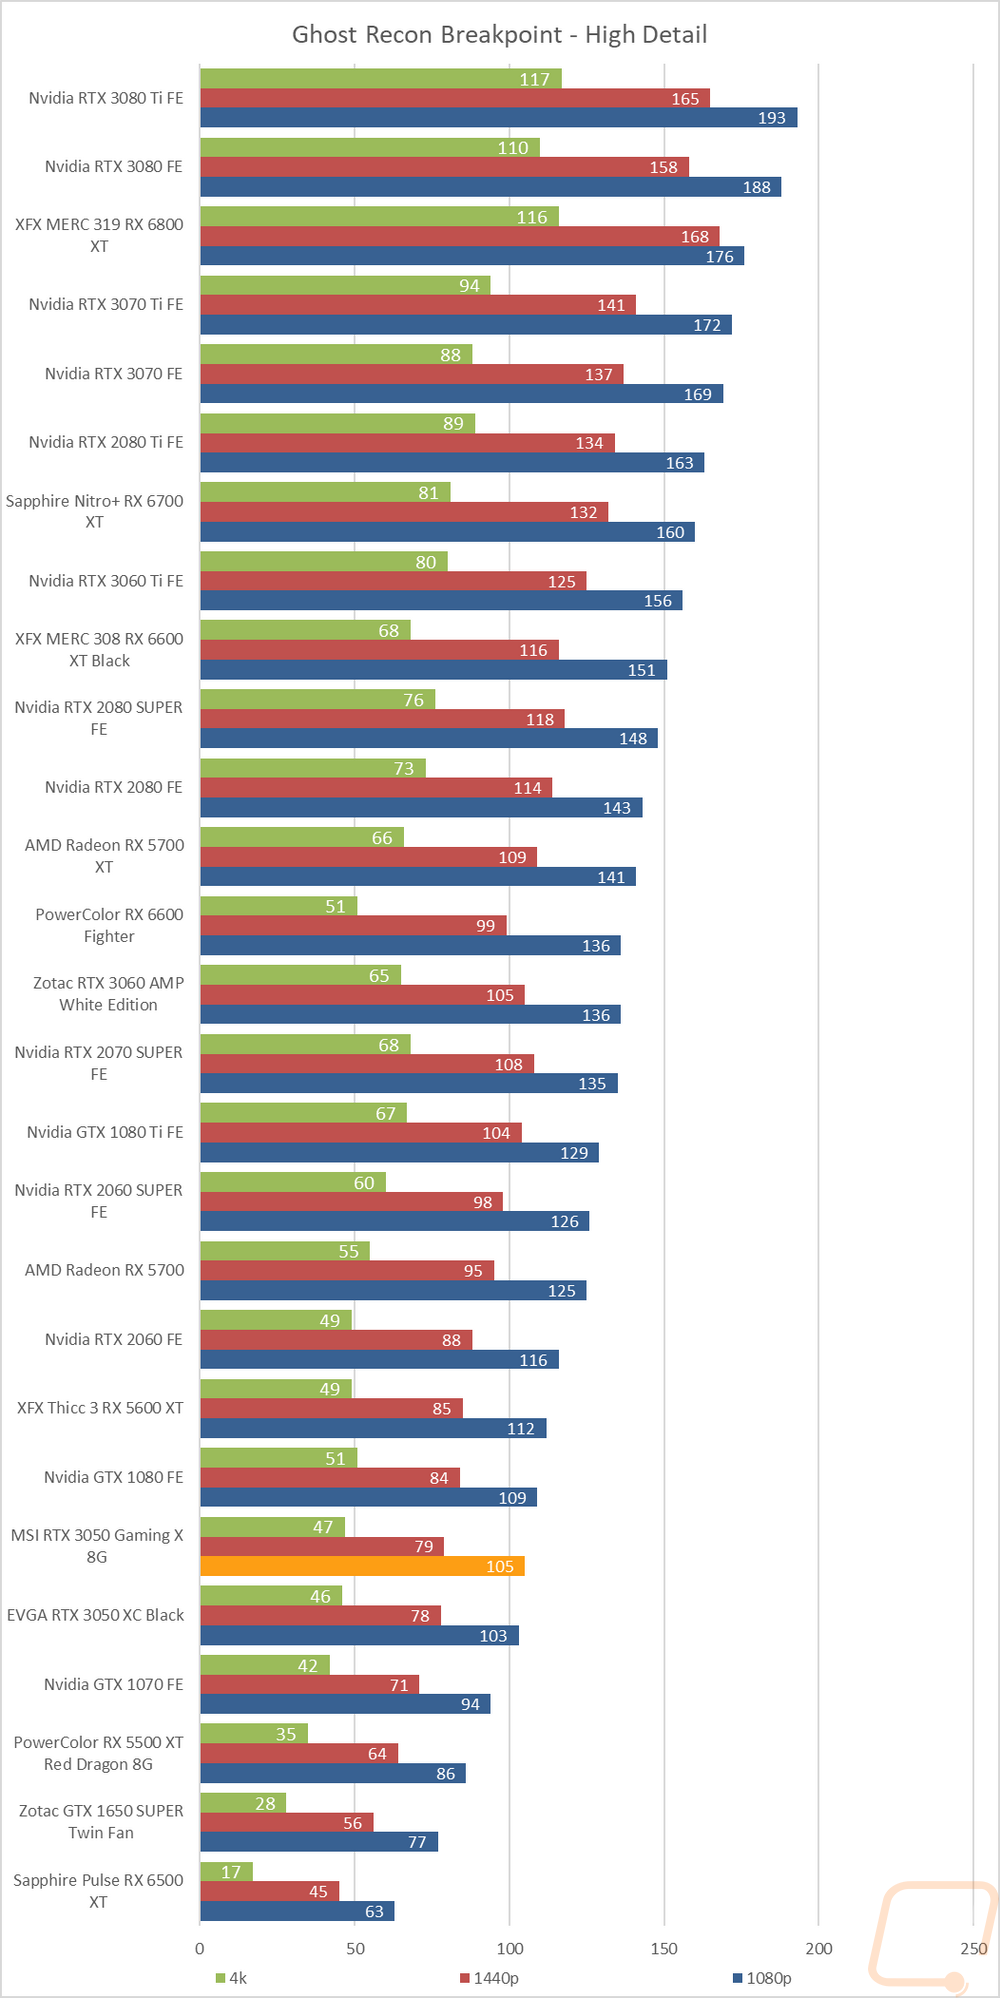
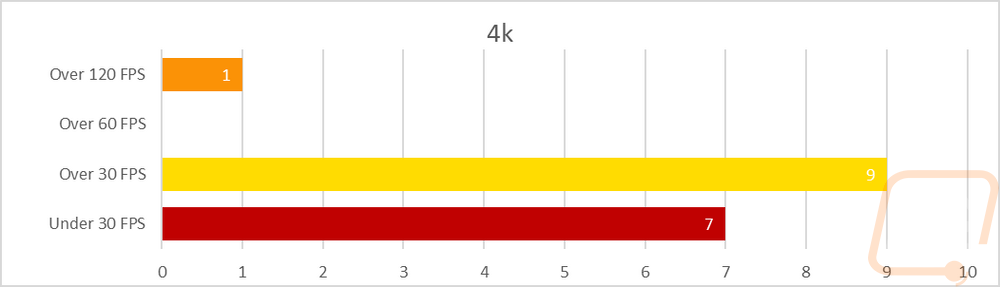
So how did the 3050 Gaming X do? Starting with the 1080p results which is where the RTX 3050 is designed, the 3050 Gaming X didn’t have any results in the sub 30 FPS range and like the stock clocked 3050 it had just 3 in the 30-59 FPS range. A majority of the results were once again over 60 FPS but the overclock on the 3050 Gaming X was able to bump one result from the 60-119 range up to 120+ FPS making for 3 over 120 in total. At 1440p the 3050 Gaming X also didn’t have any under 30 FPS which was an improvement over the stock 3050 which did have one in that range. Beyond that nothing else changed with a majority of the results in the playable but not smooth 30-59 FPS range. There were still 6 up over 60 FPS and CS:GO of course up over 120 FPS. Then at 4K, there weren’t any big surprises, the 3050 Gaming X fell off hard at that high of a resolution with 7 of the tests in the unplayable range and all but one of the rest were in that 30-59 range which isn’t really great but playable. CS:GO did what CS:GO does with it being the sole result still up over 120 FPS and zero between 60-119.Graph30
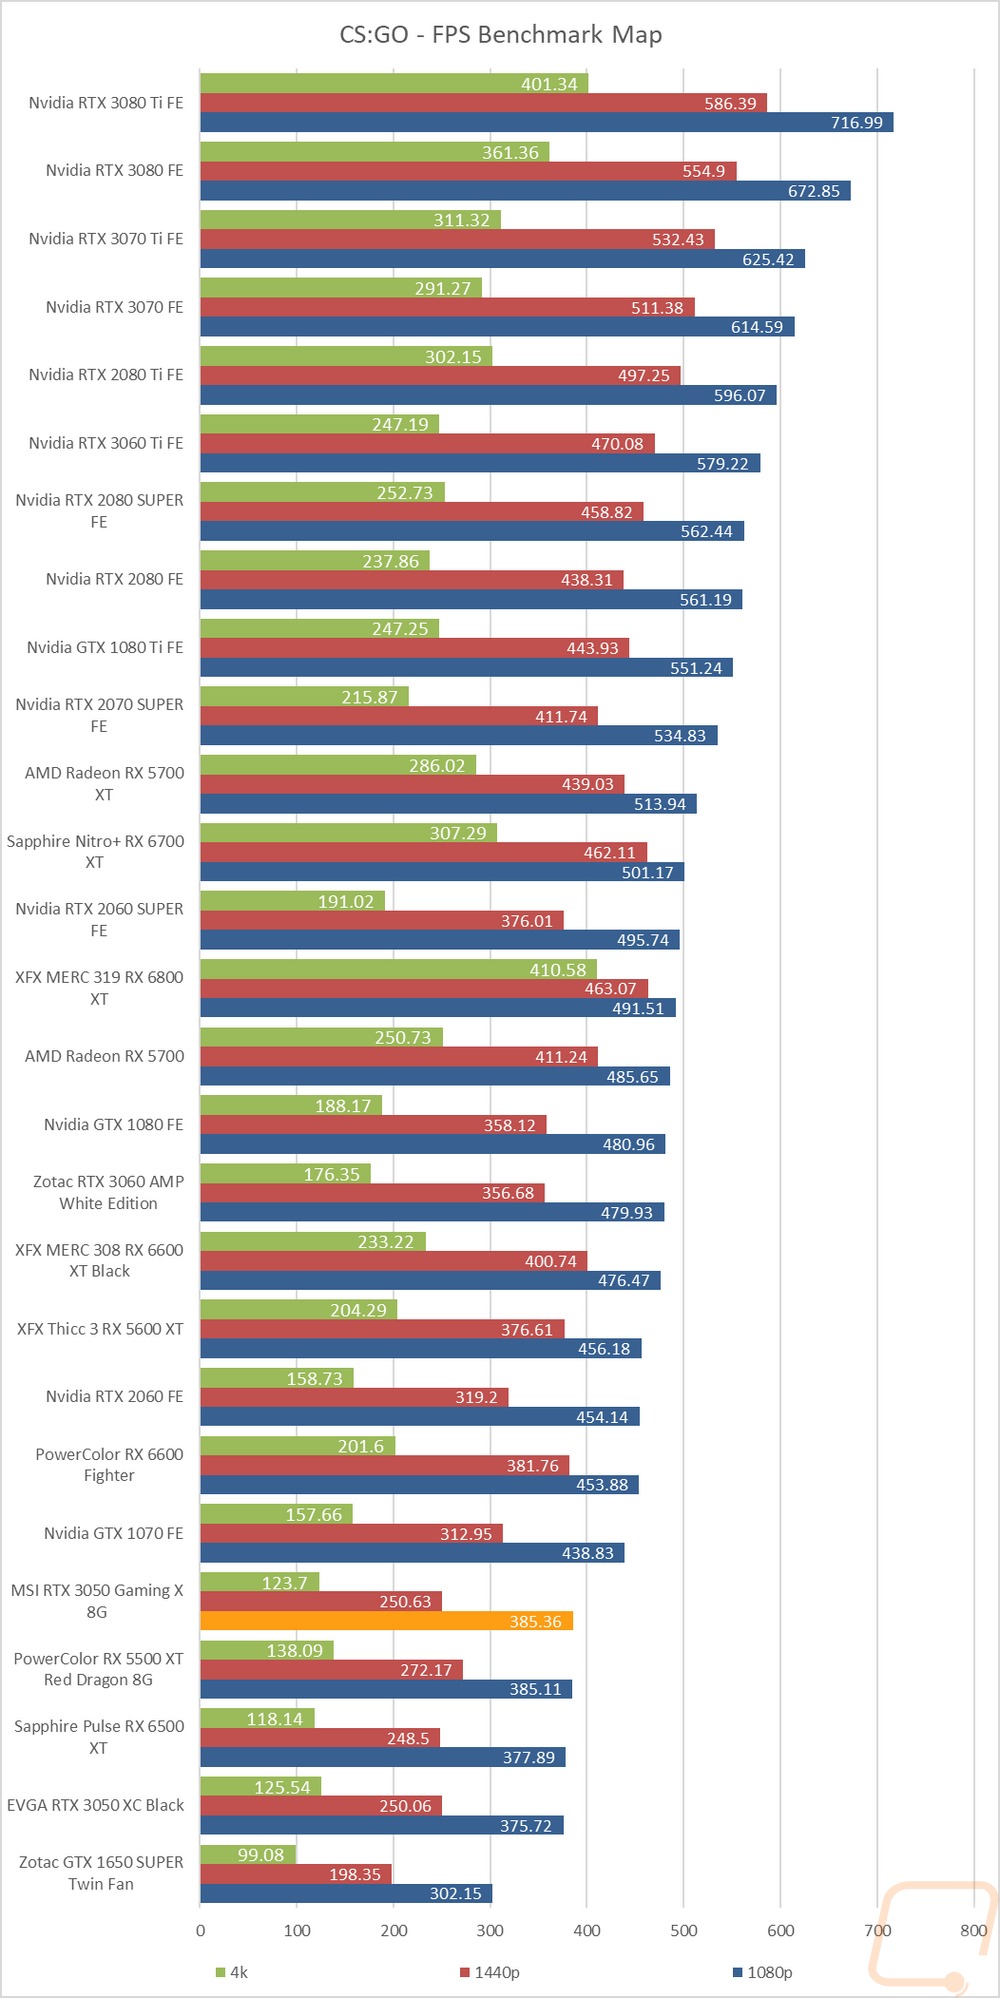
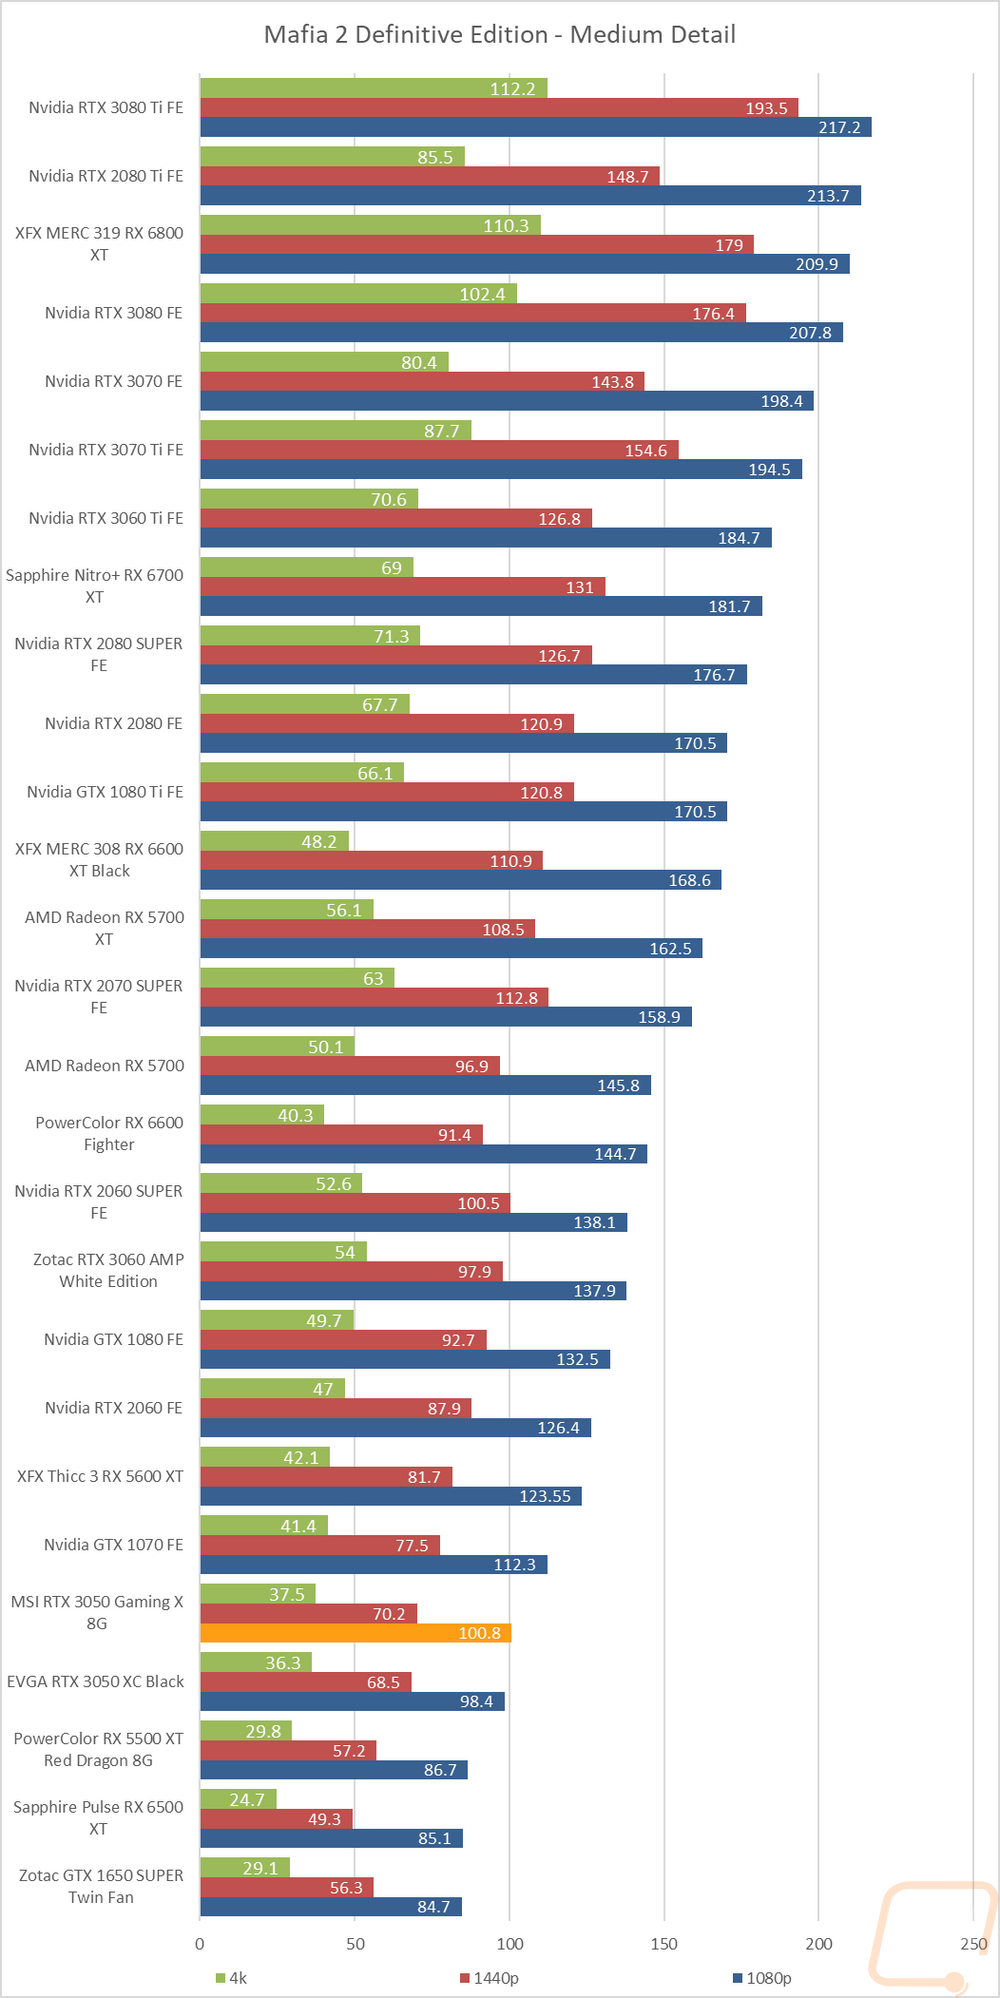
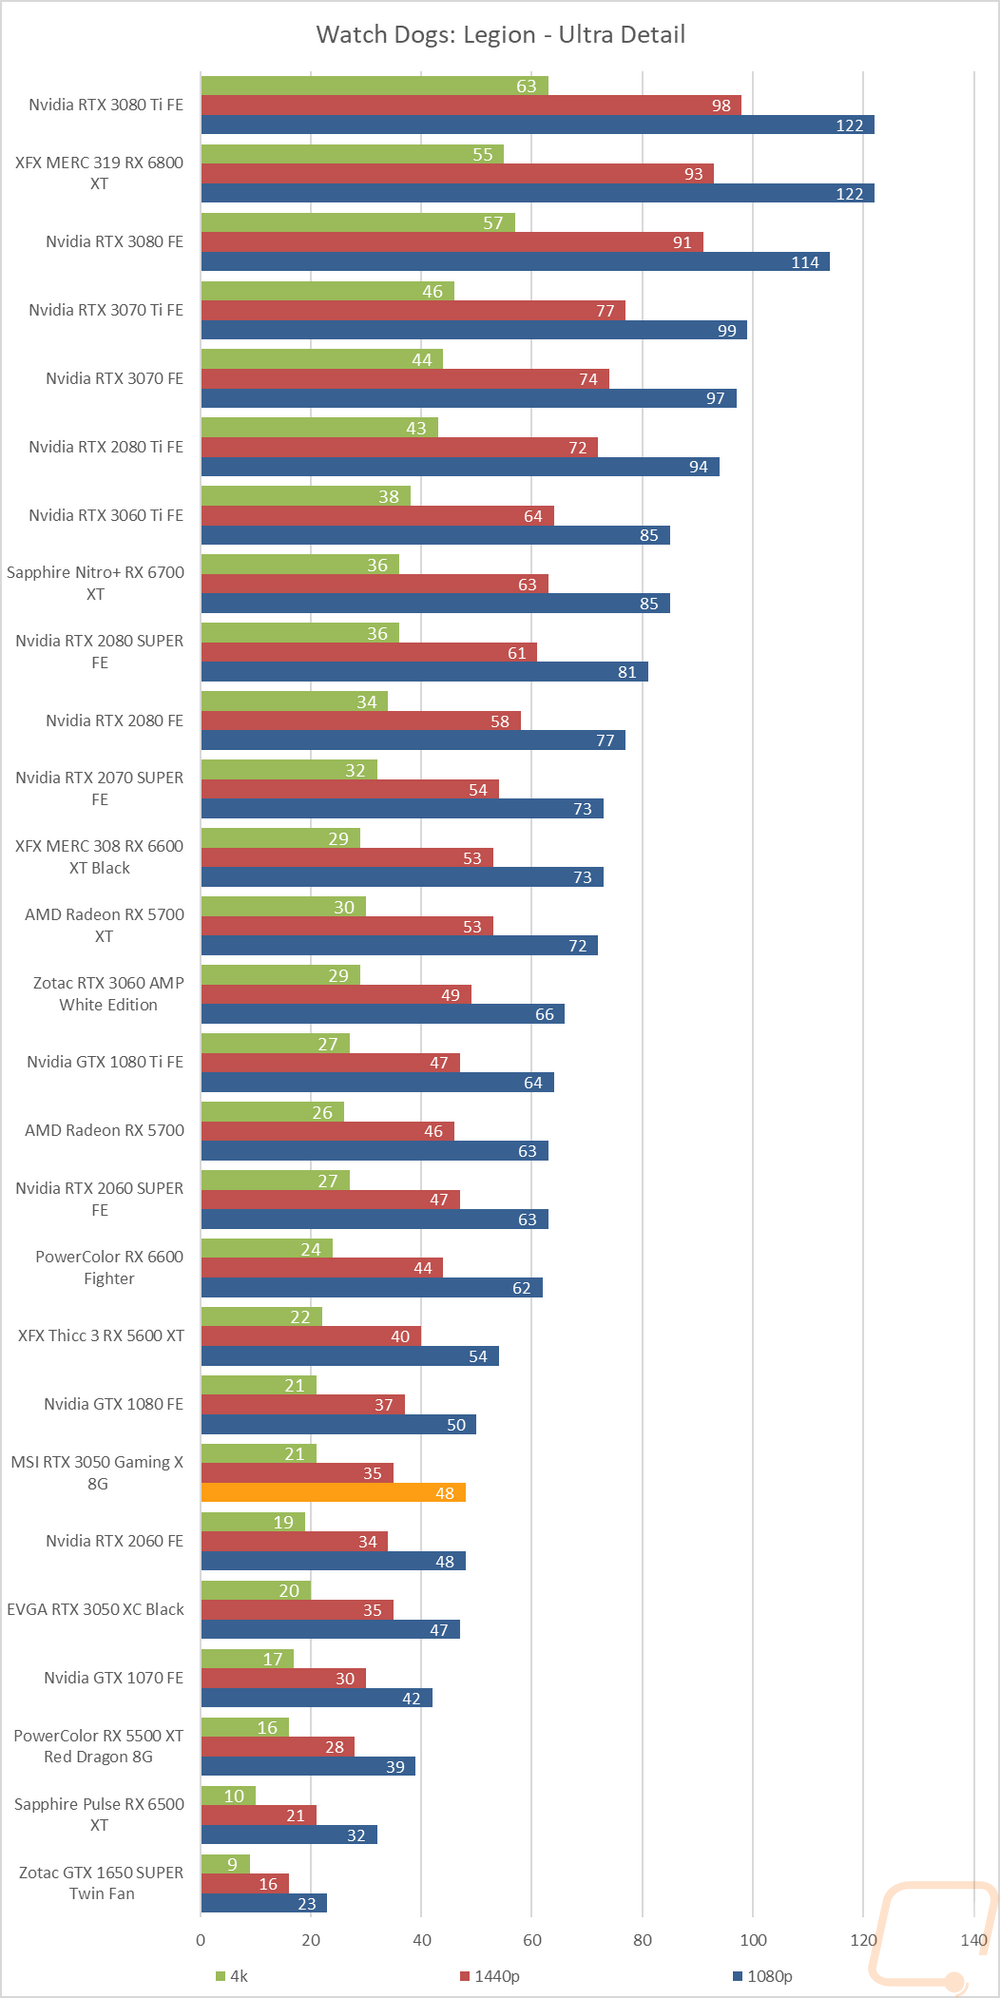
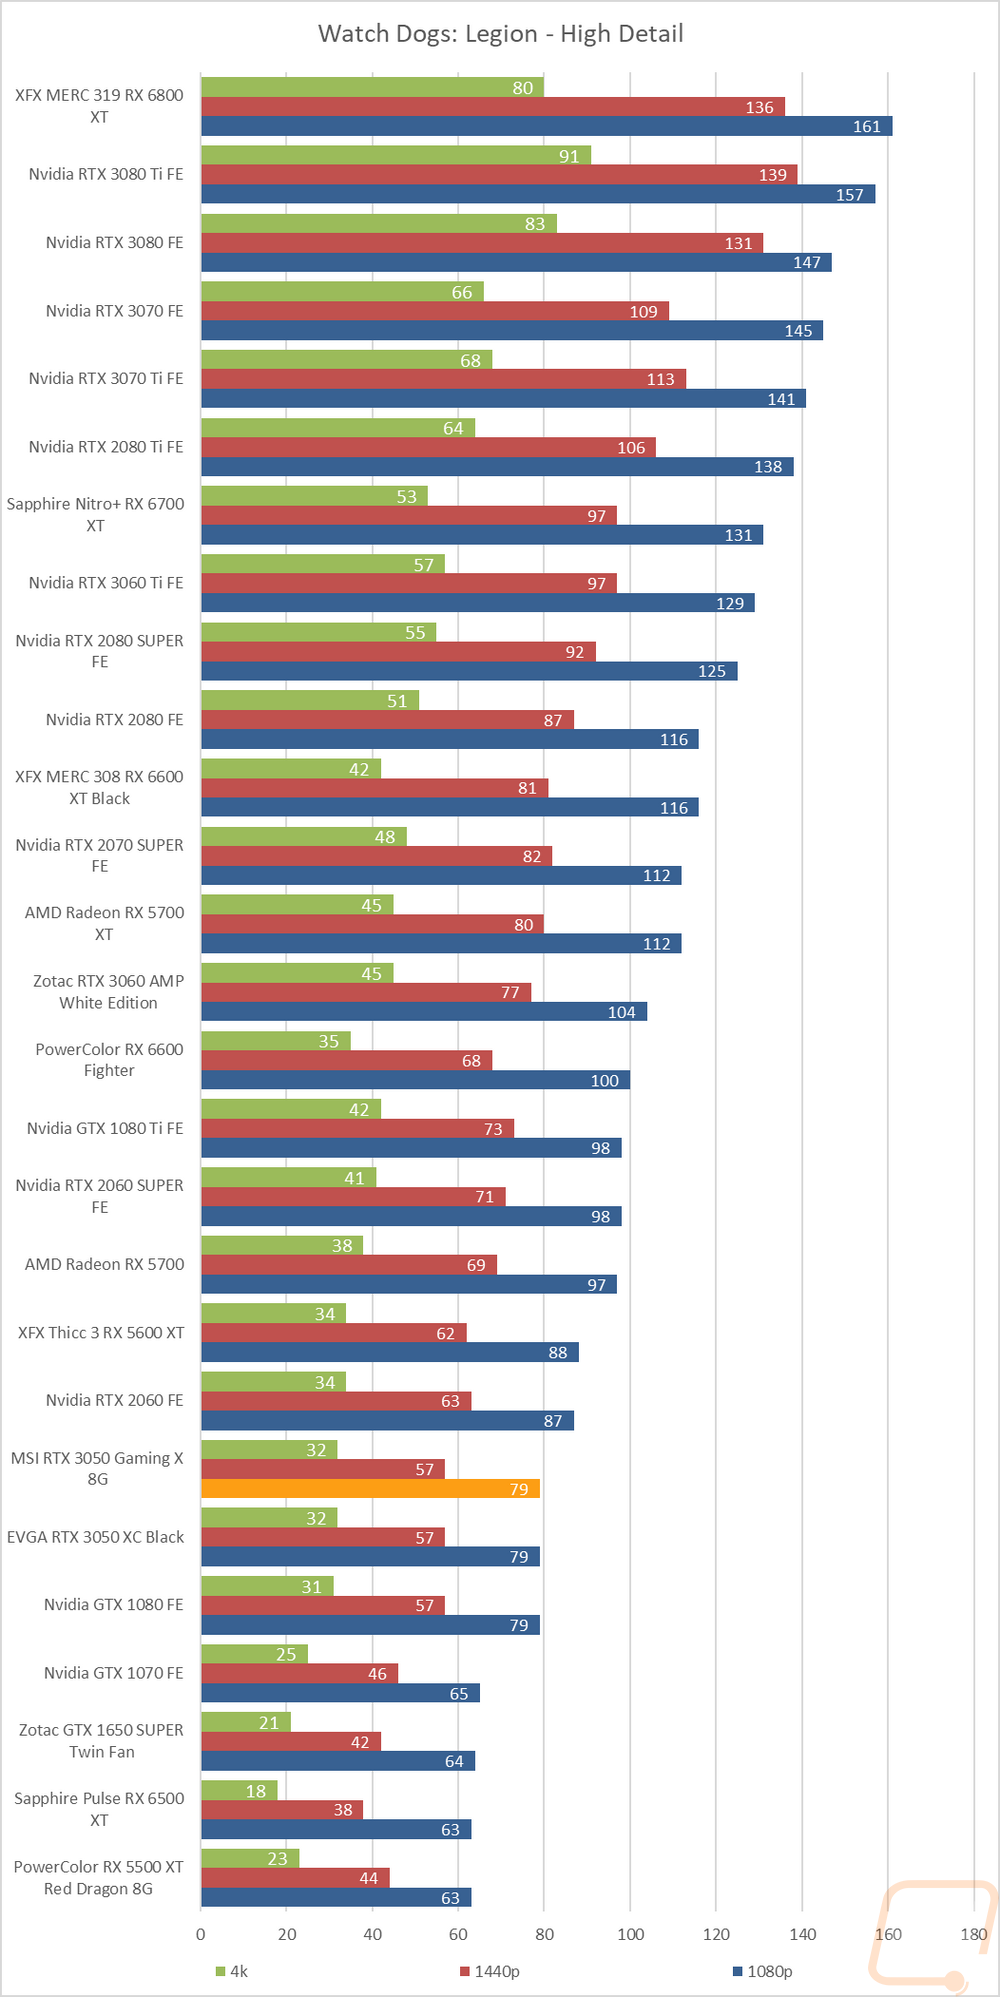
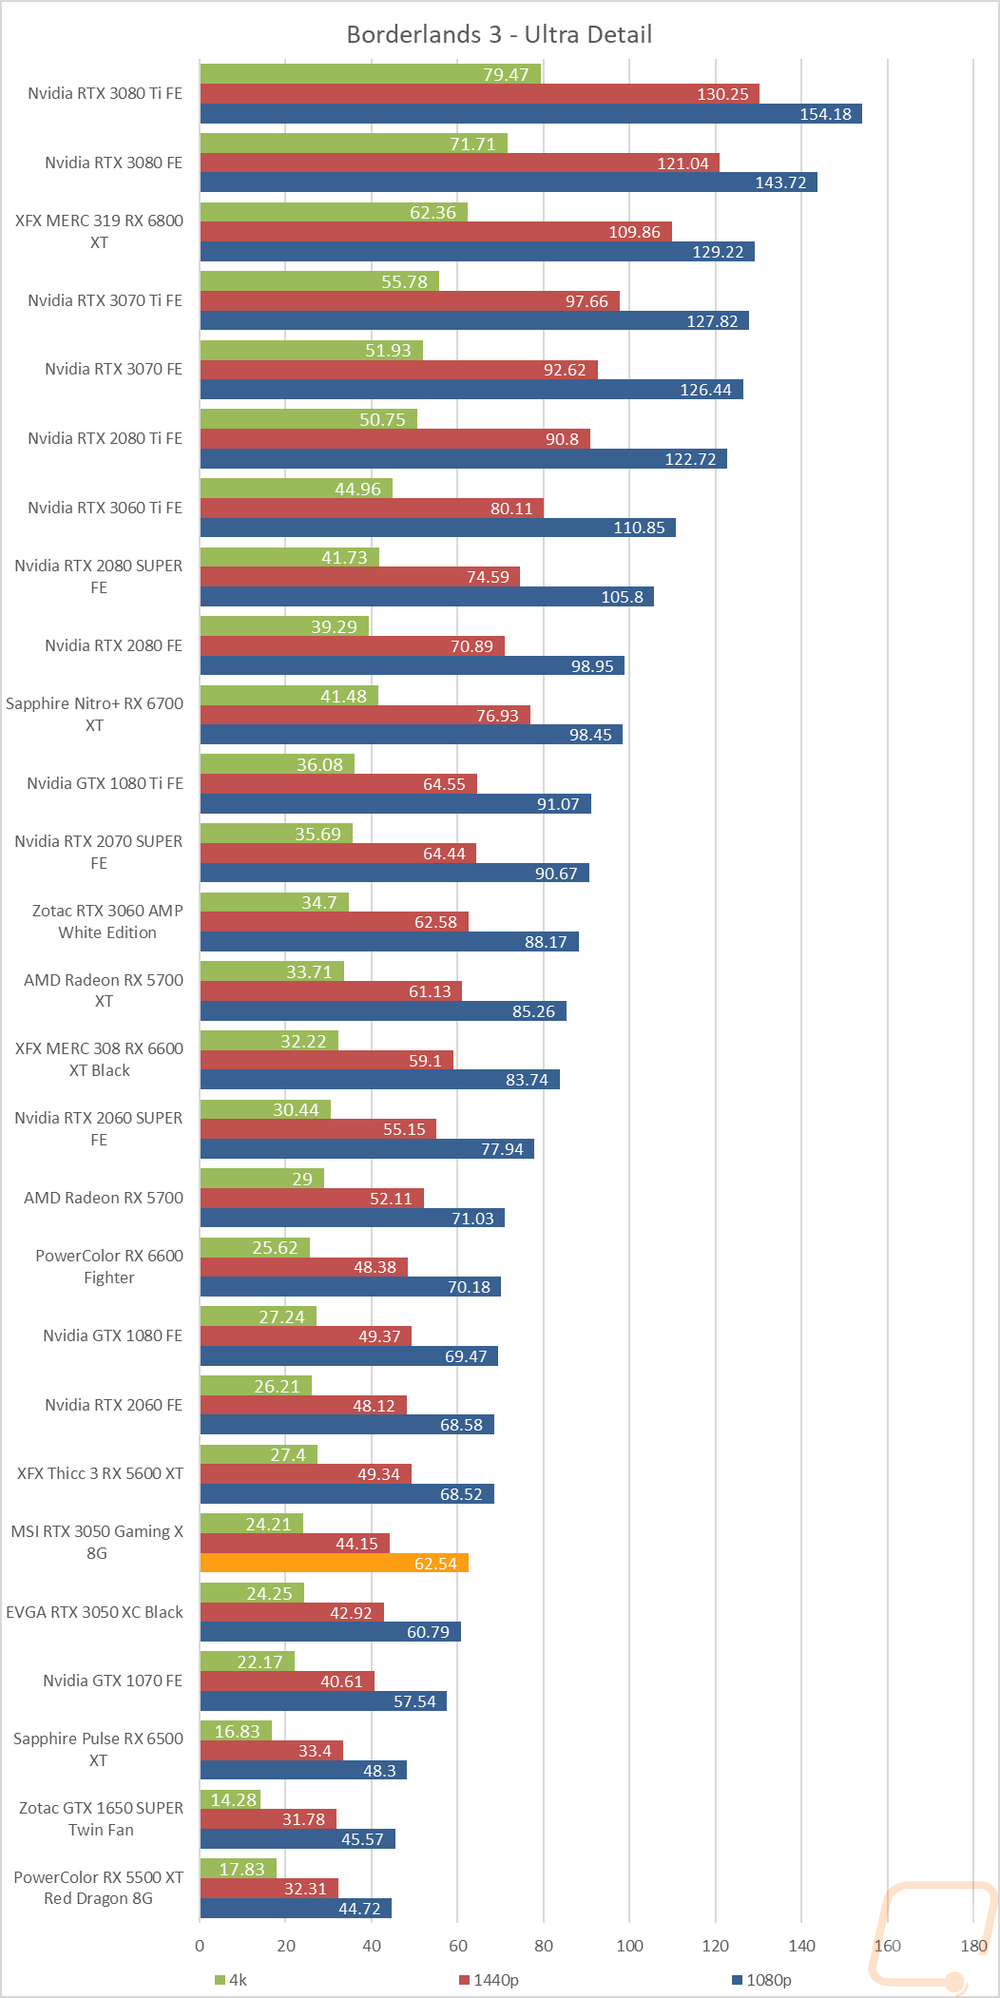
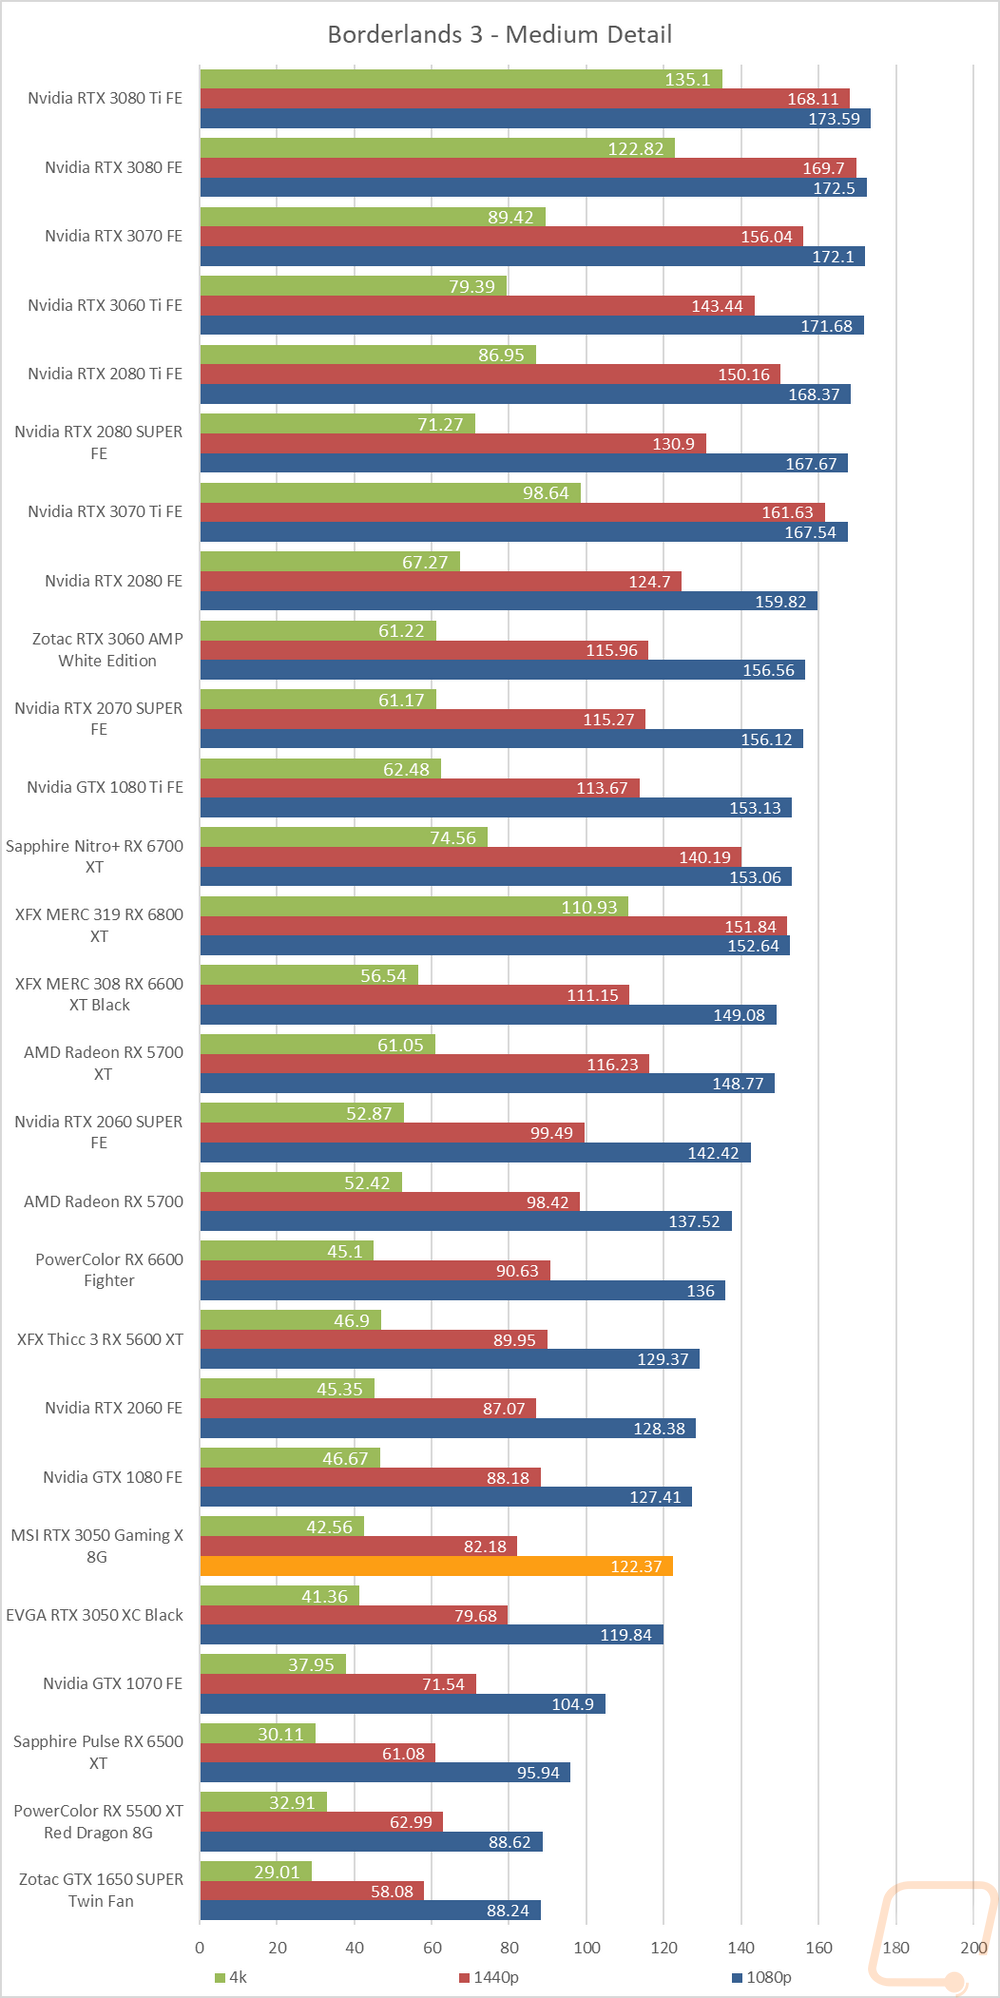
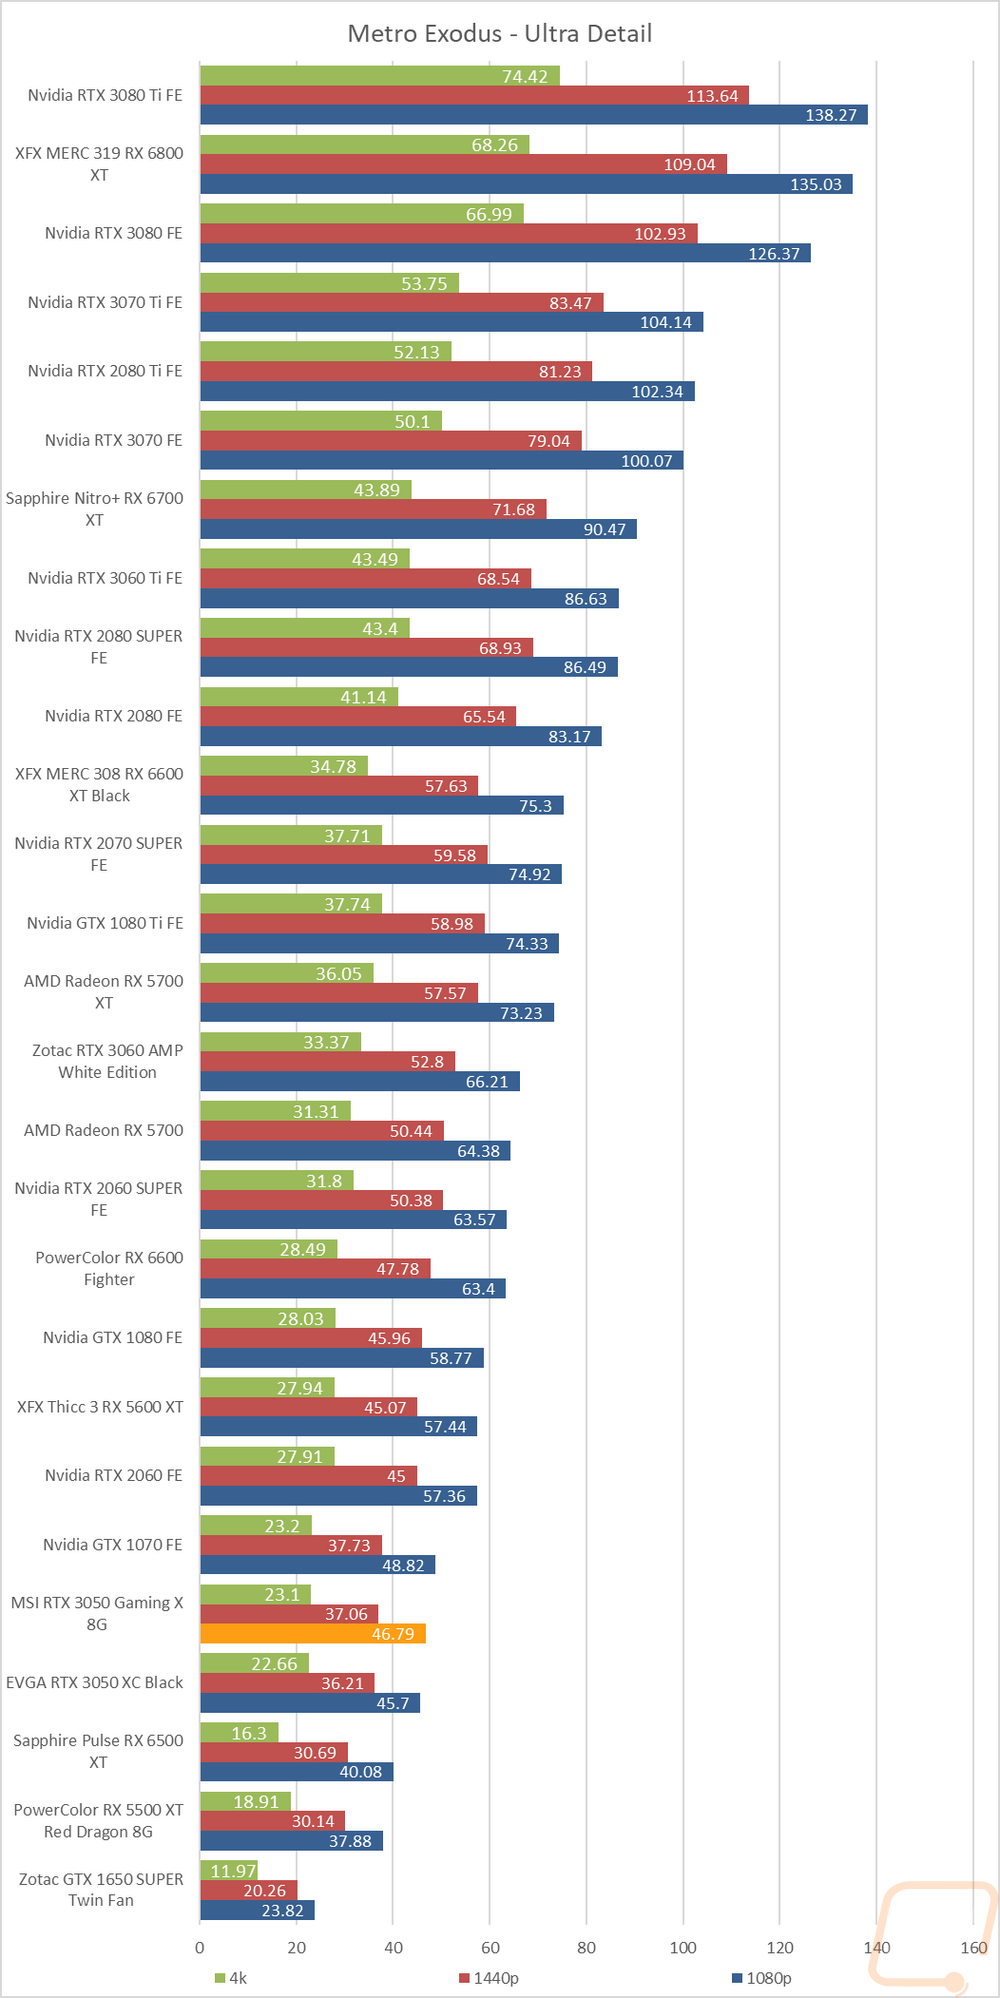
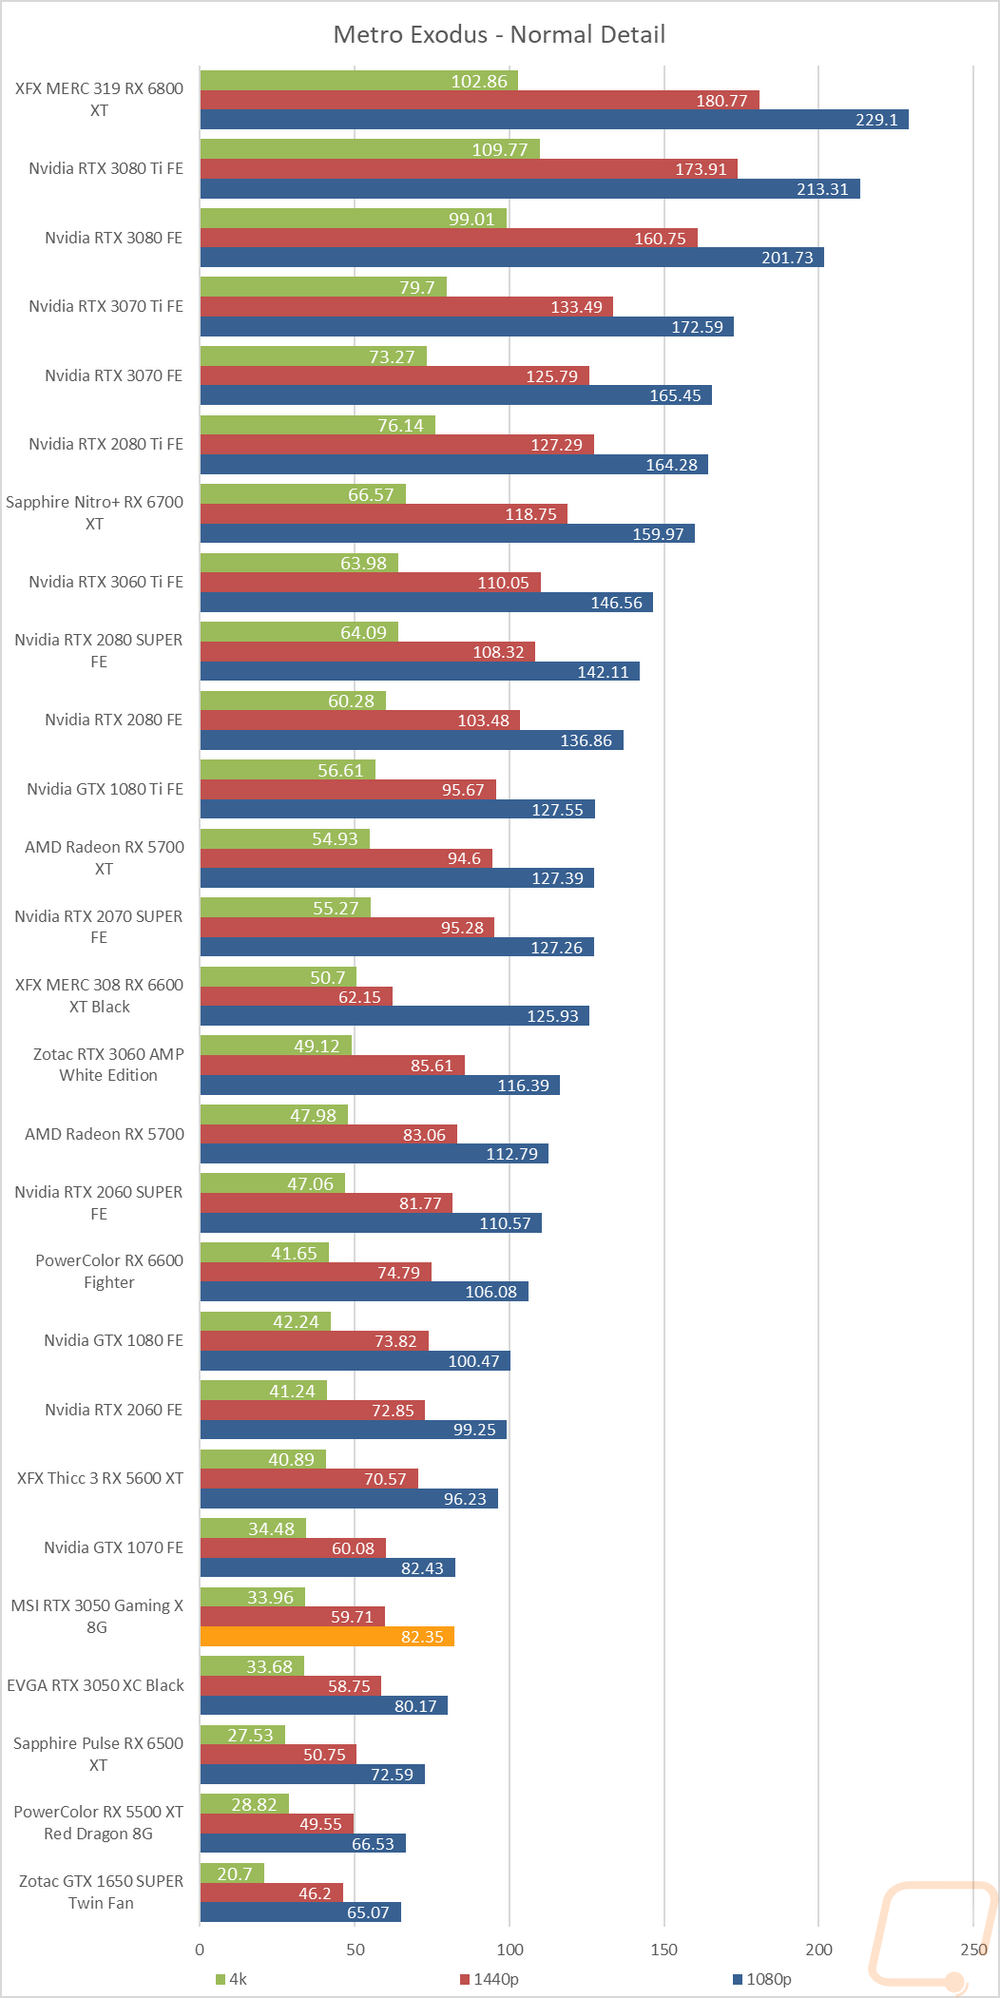
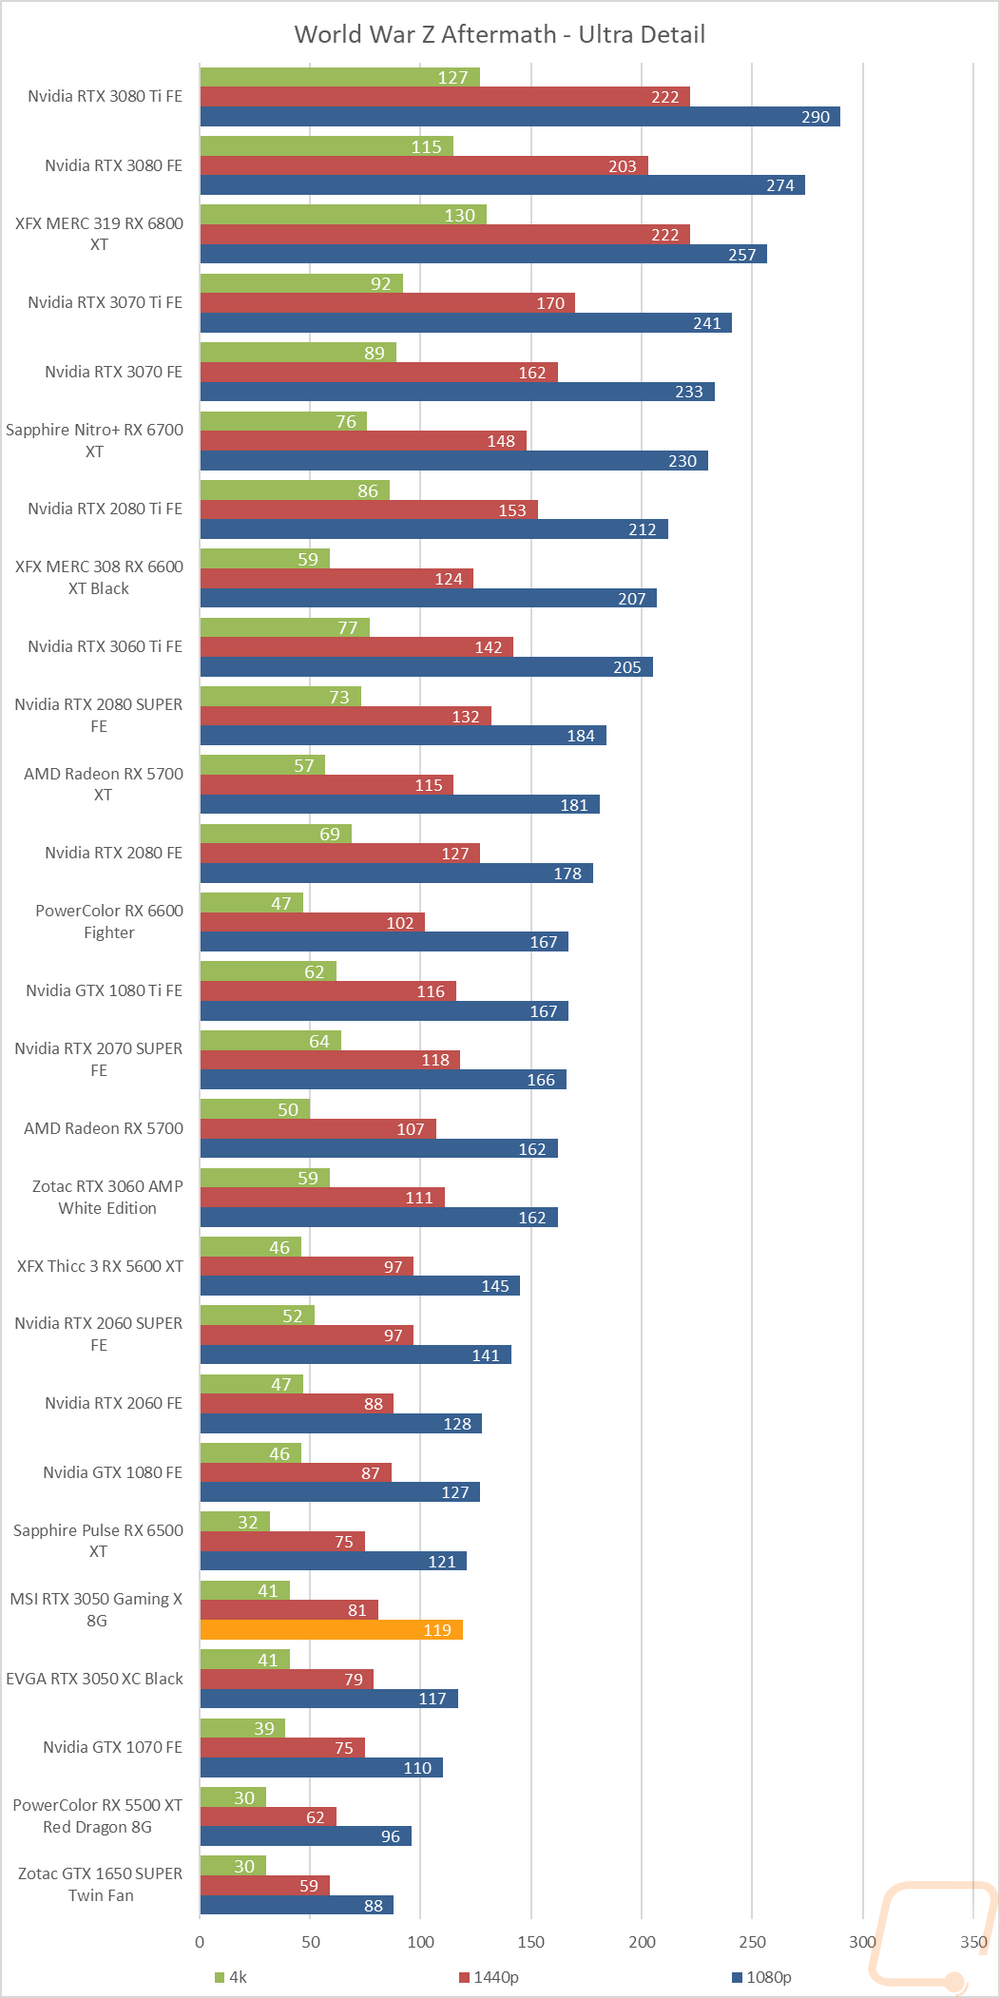
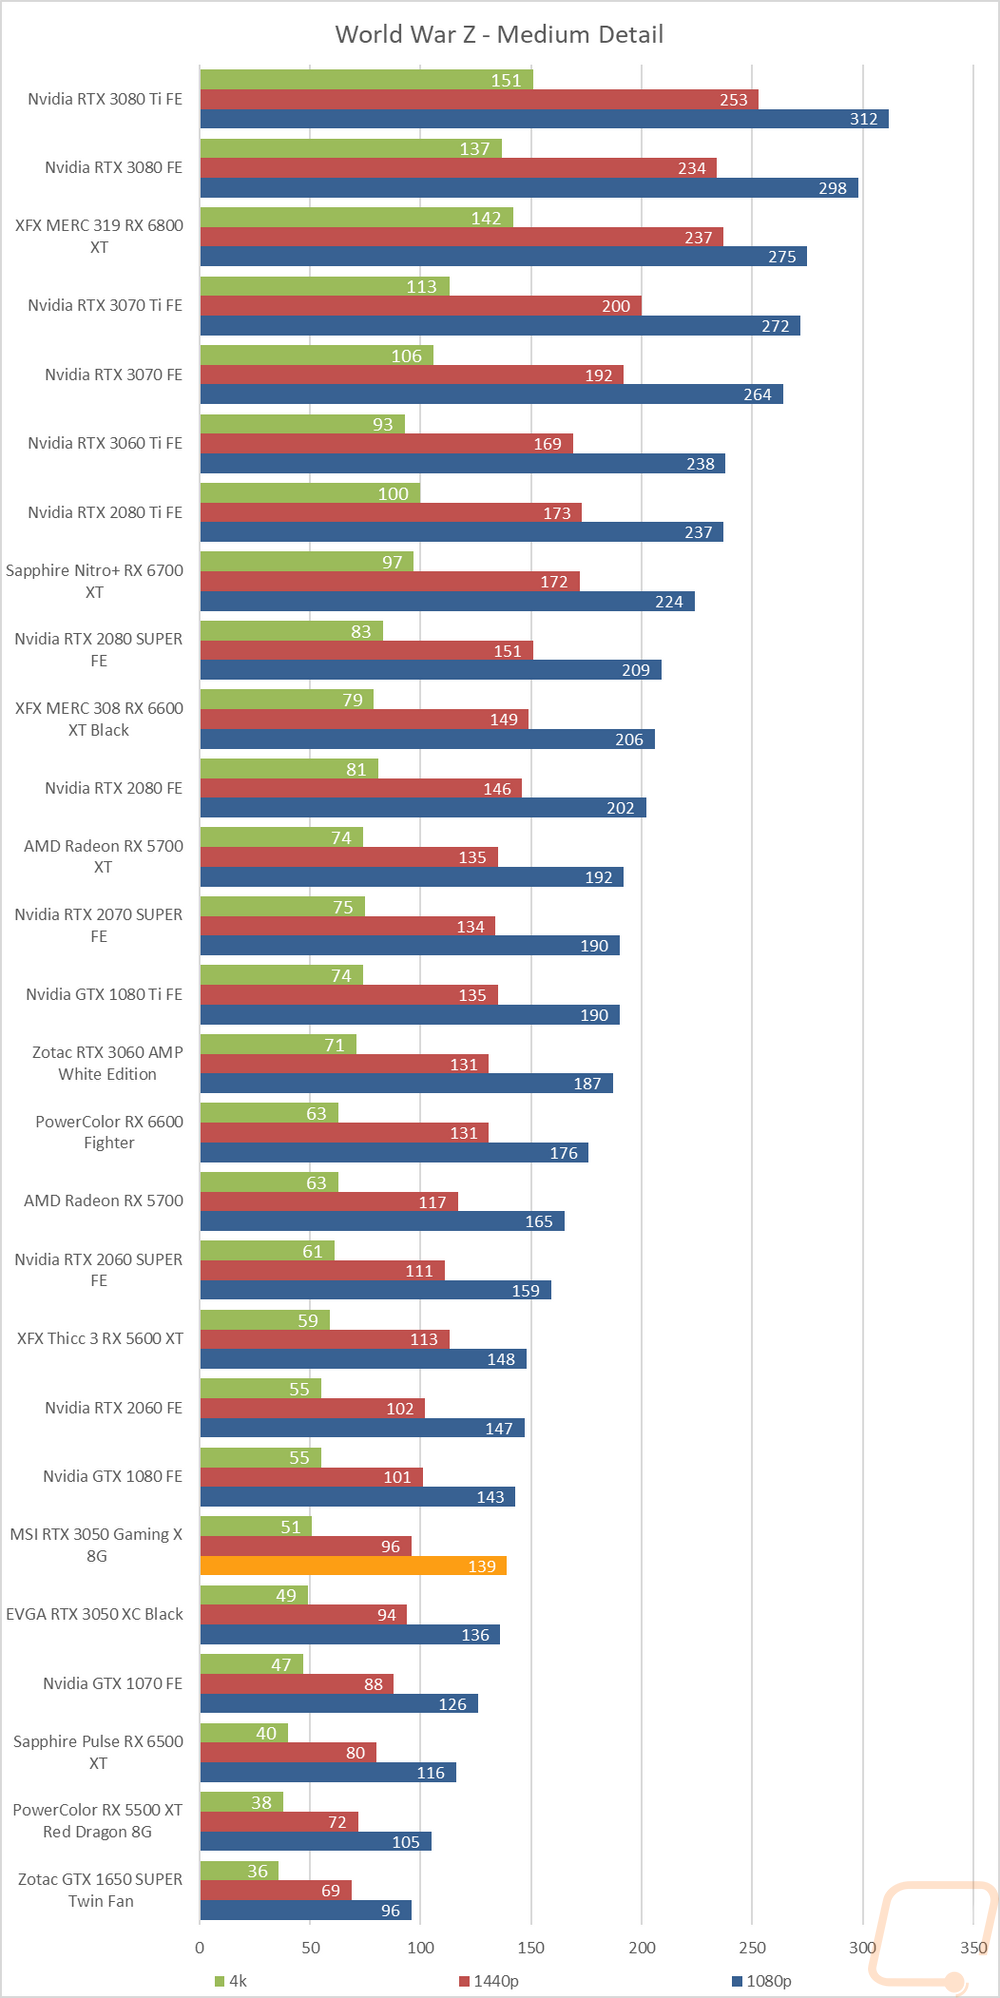
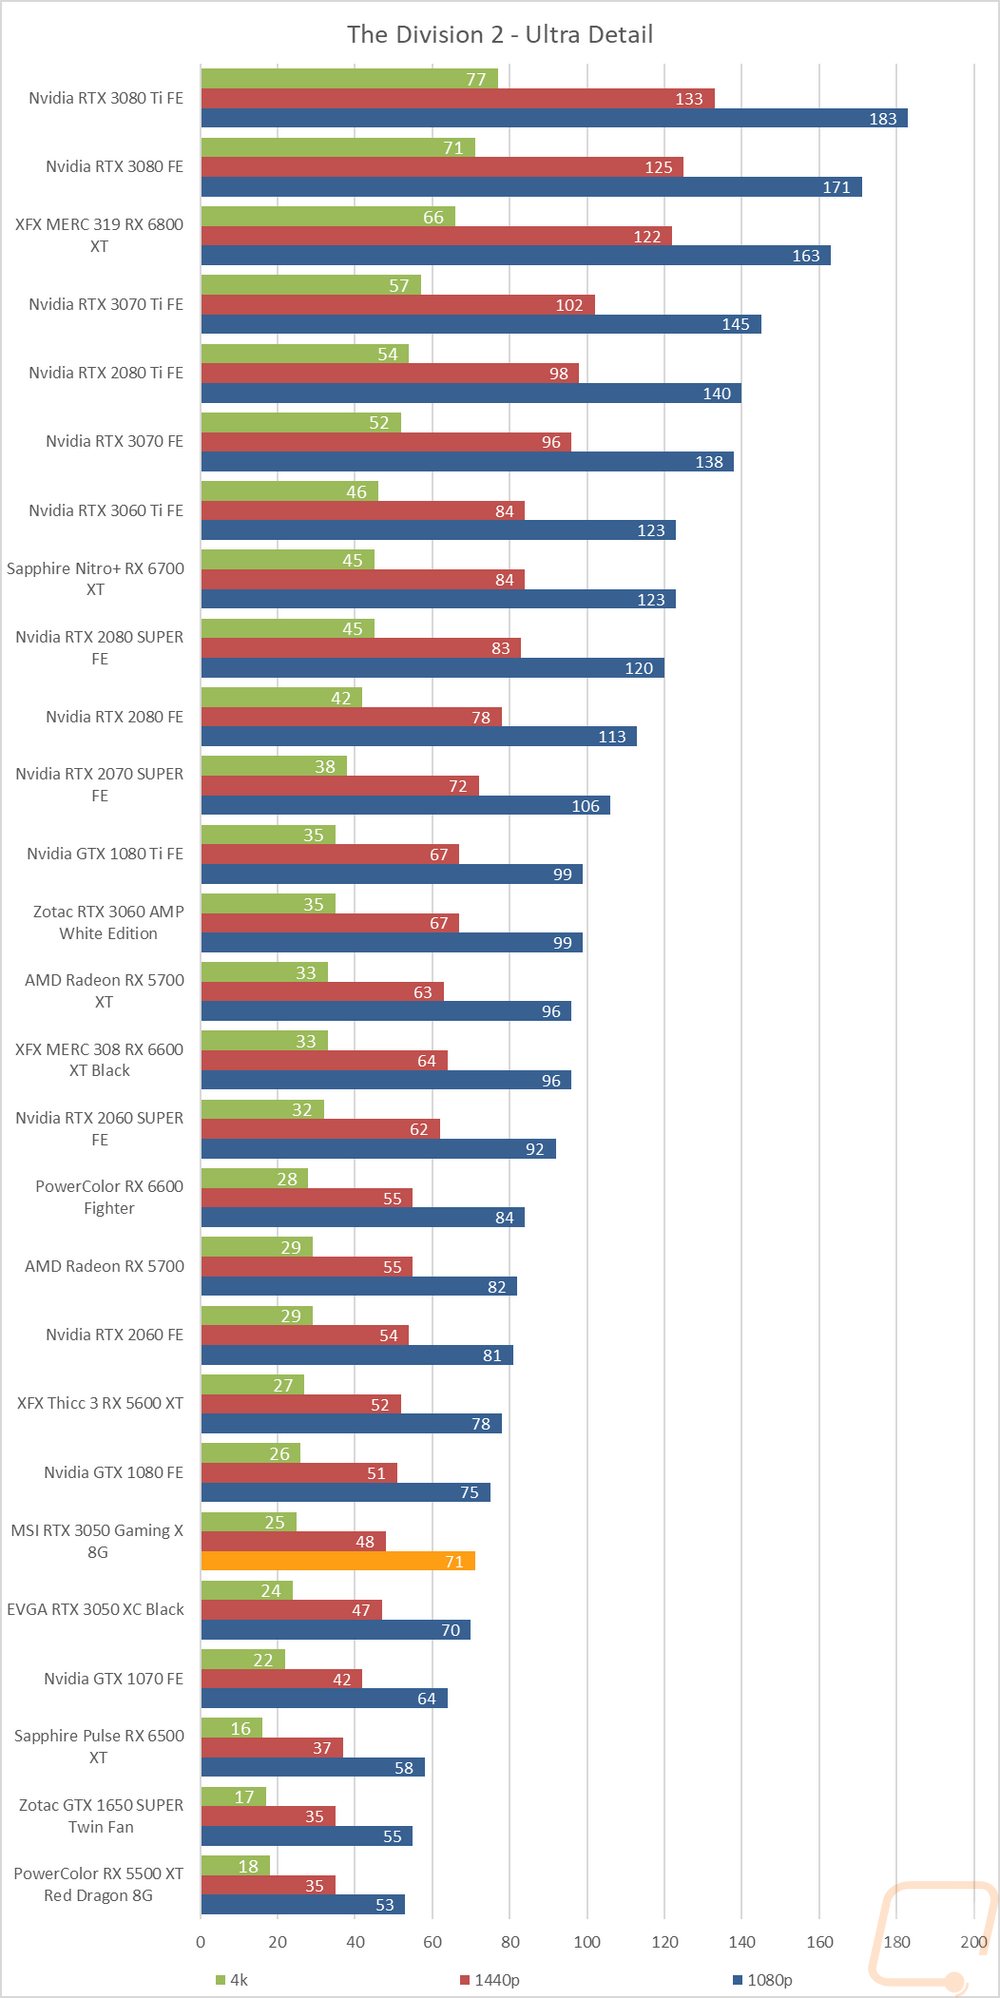
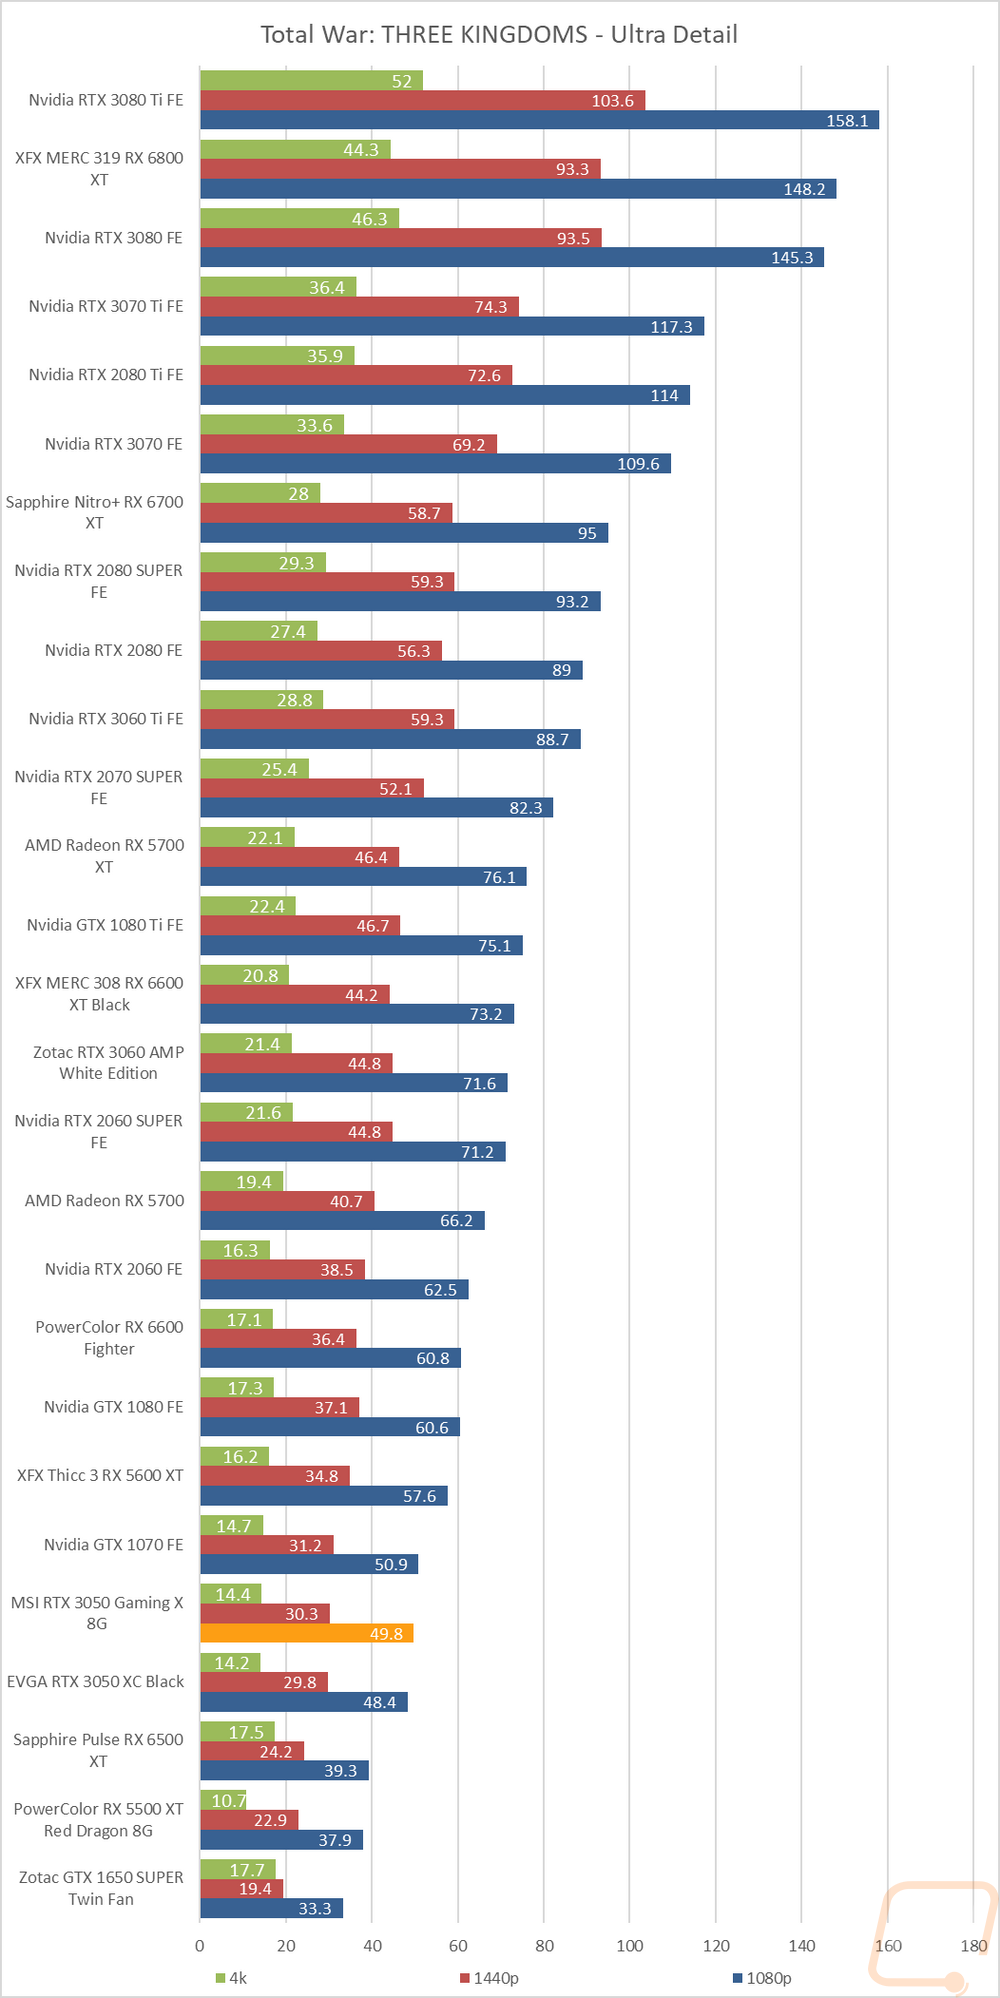
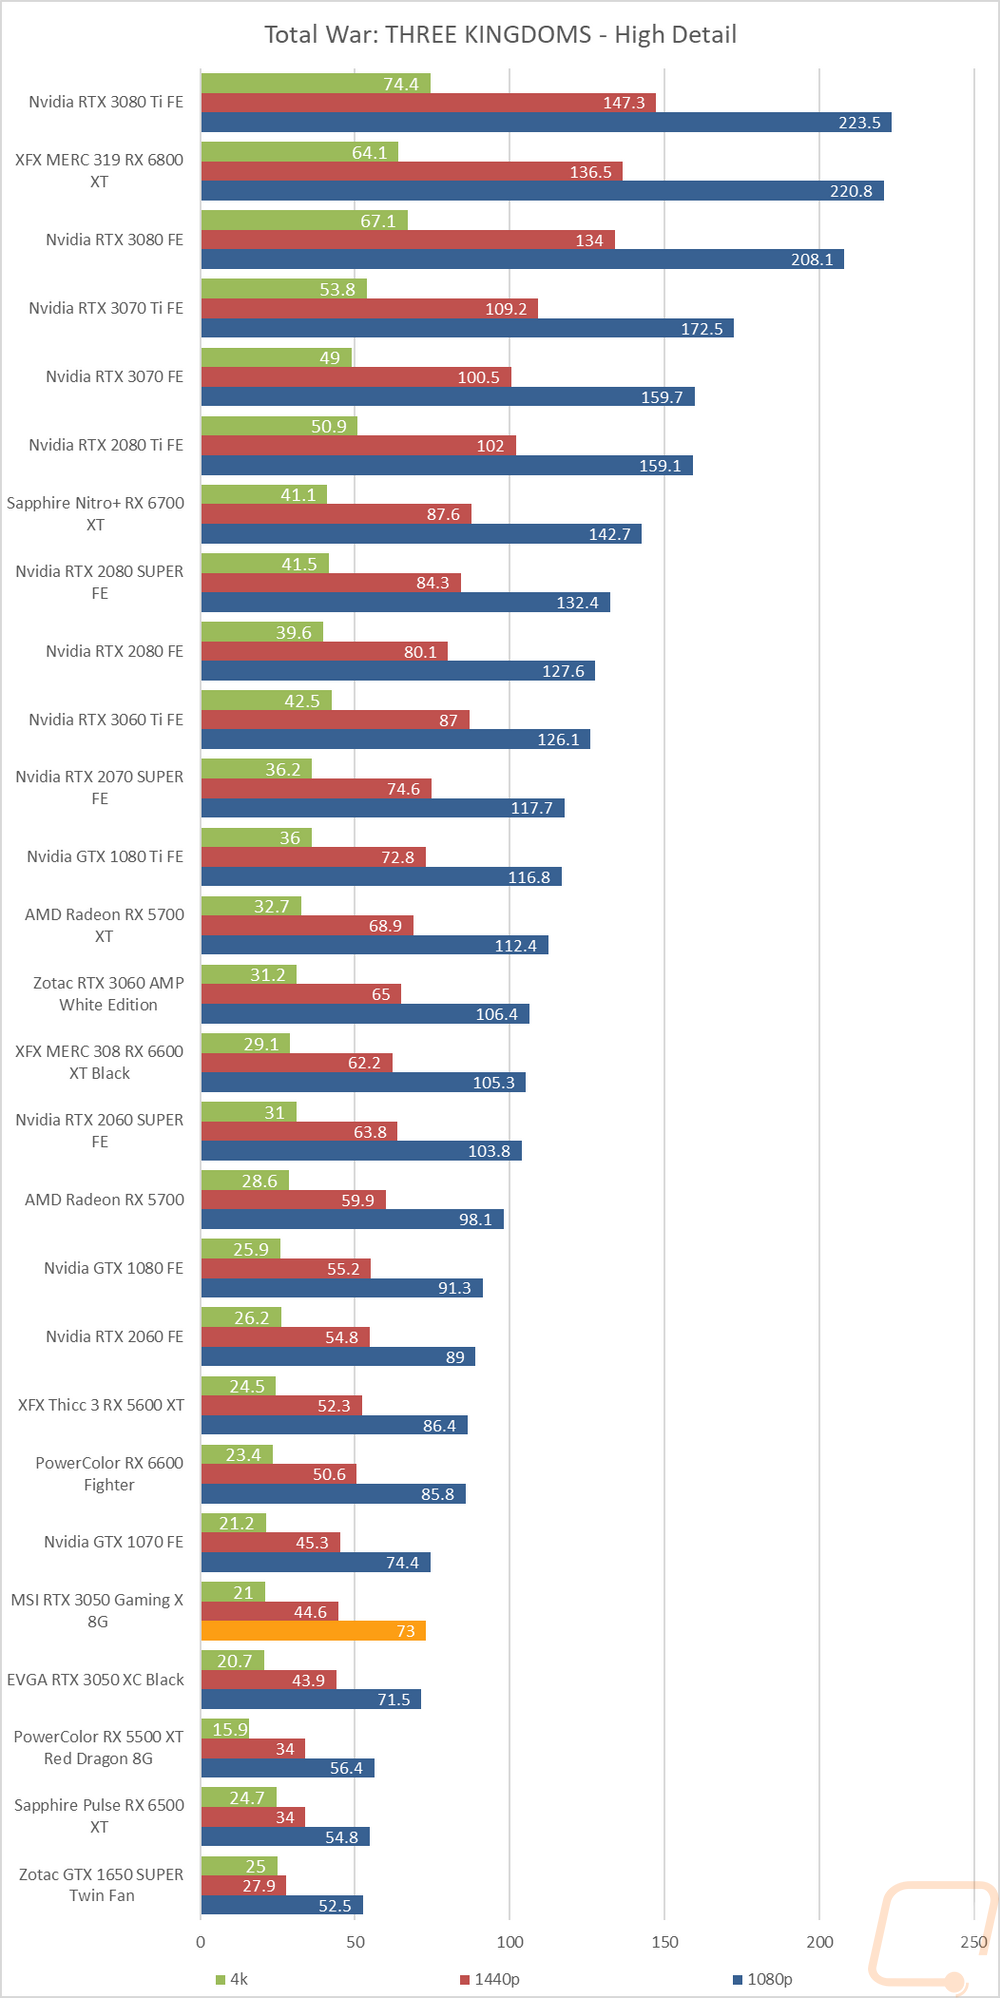
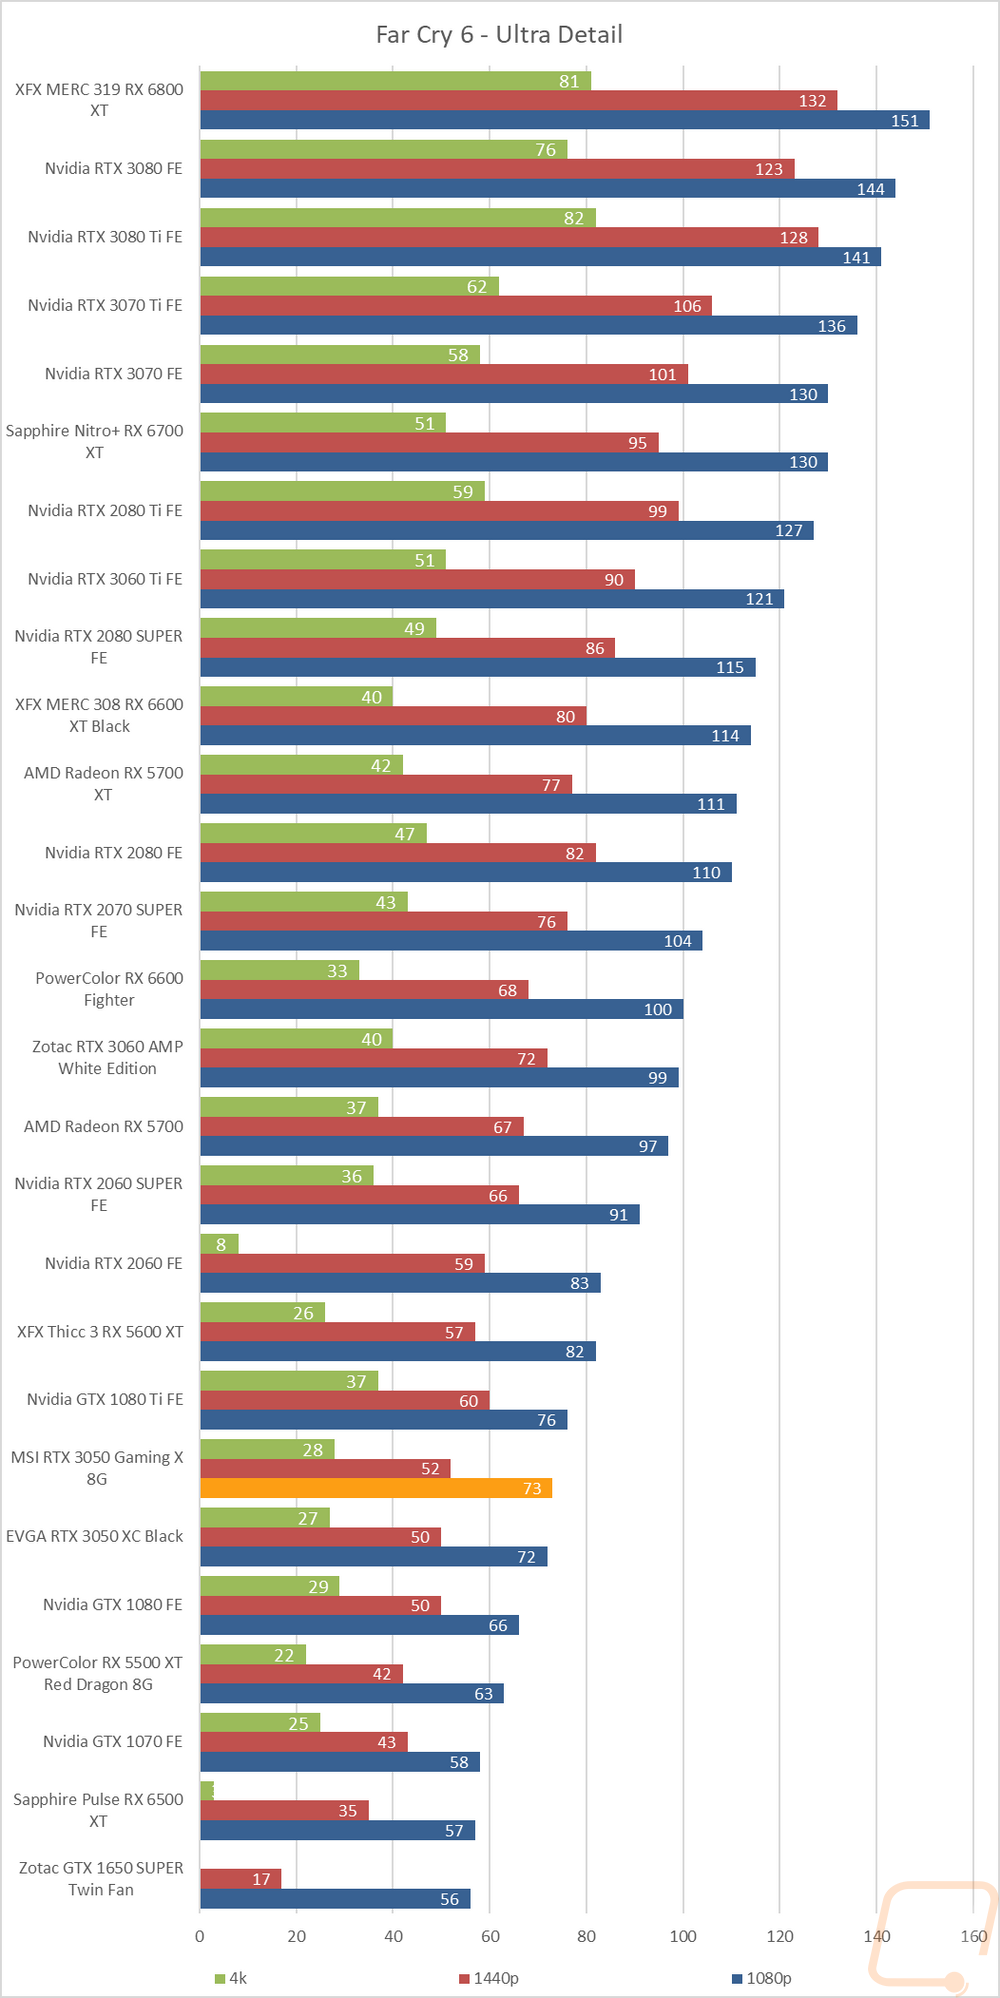
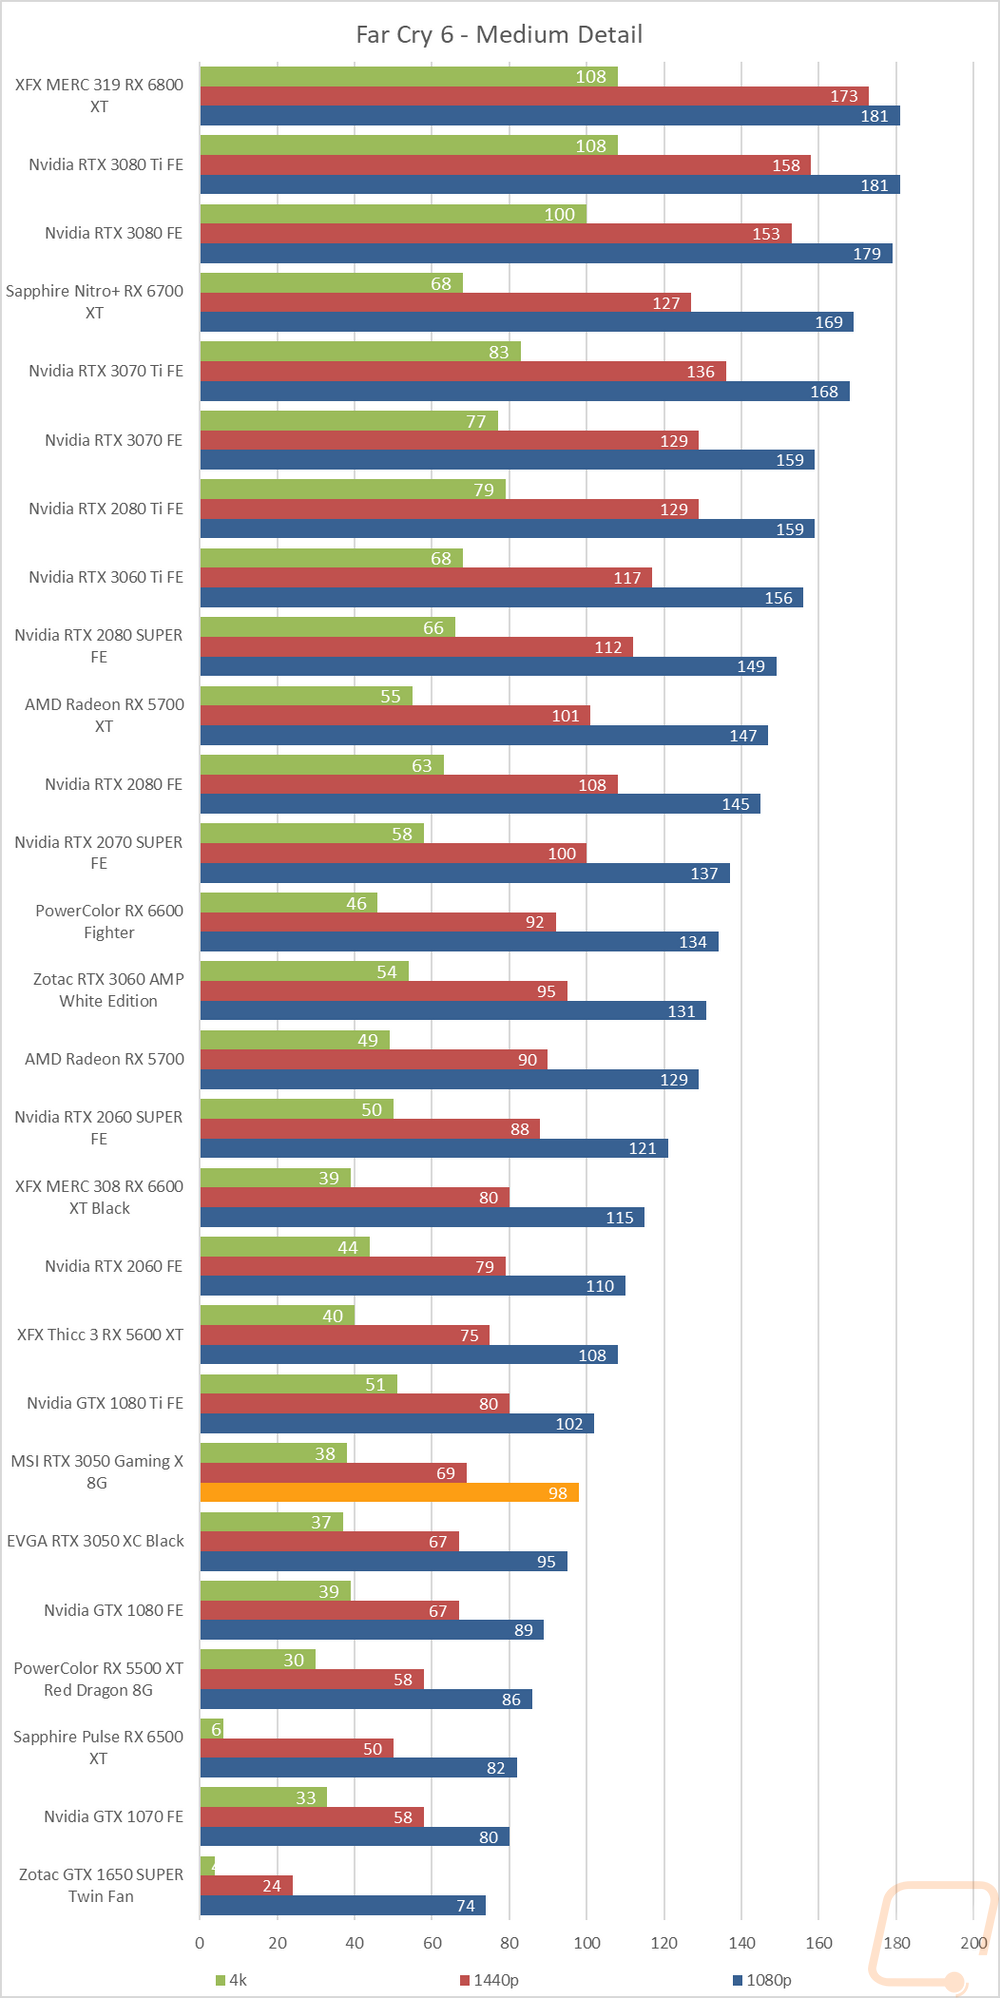
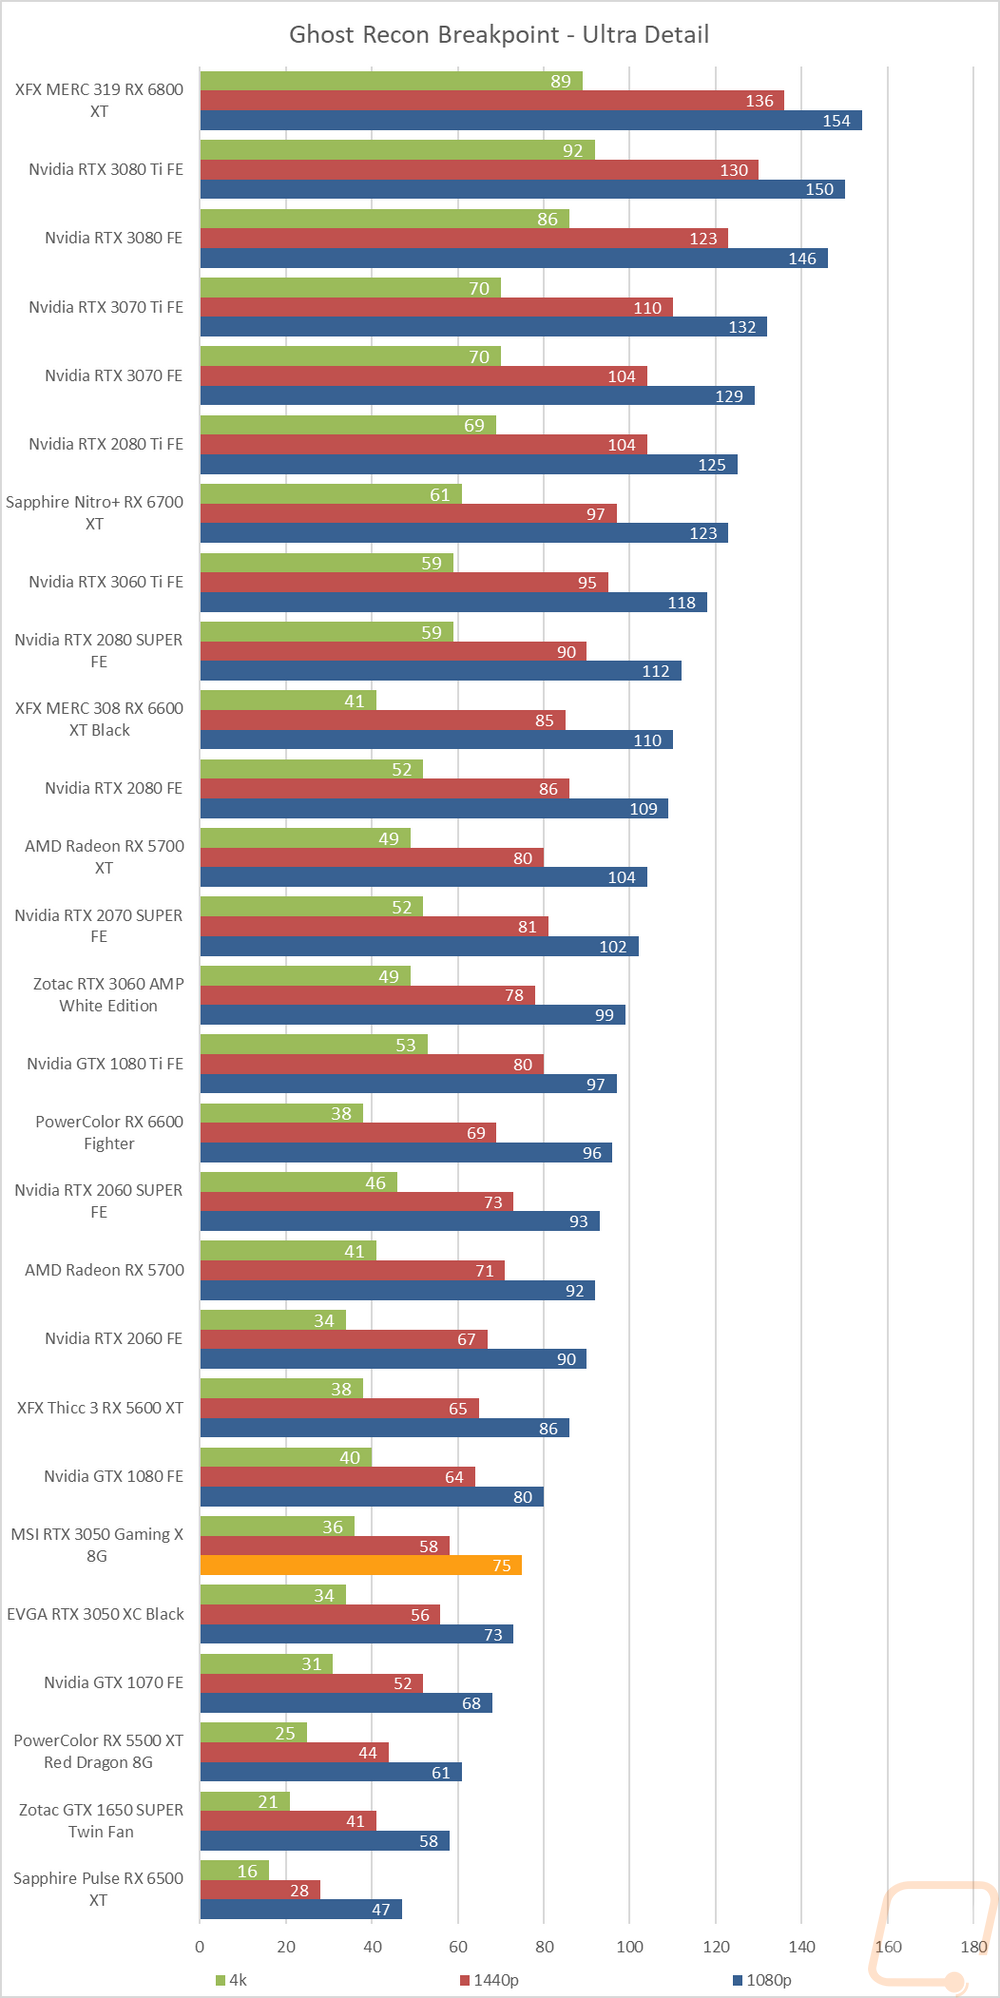
Of course, I have all of the actual in game results as well for anyone who wants to sort through the wall of graphs below. Right away on CS:GO we can see that the small overclock was enough to bump the 3050 Gaming Xup past the RX 5500 XT and RX 6500 XT when compared to the stock 3050 at 1080p. at 1440p it was only a fraction of an FPS faster and at 4K it came in 2 FPS slower. In Watch Dogs at Ultra detail, the 1 FPS jump pushed the 3050 Gaming X up in with the 2060. Beyond that, though the 3050 Gaming X did stay just right above the EVGA 3050 but there was a noticeable jump in FPS in almost every test. To see exactly where that put things I did put the numbers together for both RTX 3050’s to see how much the small overclock helped. The biggest improvement was at 1080p at 2.21 FPS but at all three resolutions, the overclock did help.
|
|
1080p |
1440p |
4K |
|
EVGA RTX 3050 XC Black |
99.56 |
68.99 |
36.98 |
|
MSI RTX 3050 Gaming X |
101.77 +2.21 |
70.26 +1.27 |
37.61 +.63 |