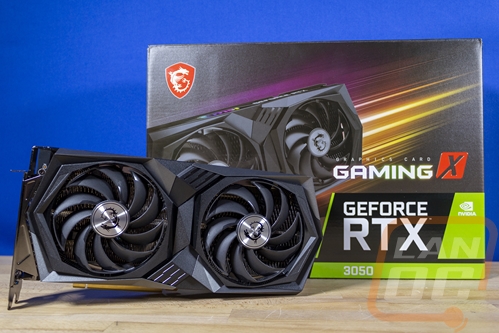
With the RTX 3050 launch I had a stocked clocked card come in and I had originally planned to also cover an overclocked card as well but shipping issues put a stop to that. Things have finally come in including this card from MSI and today I can take a look at MSI’s new RTX 3050 Gaming X 8G. They have this model cranked up to 1845 MHz over the stock 1777 MHz. The card also has a significantly larger cooler attached so I am curious to see how the overclock helps performance and if the larger cooler is worth going over a compact stocked clocked card.
Product Name: MSI RTX 3050 Gaming X 8G
Review Sample Provided by: MSI
Written by: Wes Compton
Amazon Affiliate Link: HERE
|
Specifications |
|
|
Model Name |
GeForce RTX™ 3050 GAMING X 8G |
|
Graphics Processing Unit |
NVIDIA® GeForce RTX™ 3050 |
|
Interface |
PCI Express® Gen 4.0 x8 |
|
Cores |
2560 Units |
|
Core Clocks |
Boost: 1845 MHz |
|
Memory Speed |
14 Gbps |
|
Memory |
8GB GDDR6 |
|
Memory Bus |
128-bit |
|
Output |
DisplayPort x 3 (v1.4a) HDMI x 1 (Supports 4K@120Hz as specified in HDMI 2.1) |
|
HDCP Support |
Y |
|
Power Consumption |
130 W |
|
Power Connectors |
8-pin x1 |
|
Recommended PSU |
550 W |
|
Card Dimension (mm) |
278 x 130 x 49 mm |
|
Weight (Card / Package) |
939 g / 1540 g |
|
DirectX Version Support |
12 API |
|
OpenGL Version Support |
4.6 |
|
Maximum Displays |
4 |
|
G-Sync® Technology |
Y |
|
Adaptive Vertical Sync |
Y |
|
Digital Maximum Resolution |
7680x4320 |
|
Warranty |
Limited Warranty period (parts): 3 years Limited Warranty period (labor): 3 years |
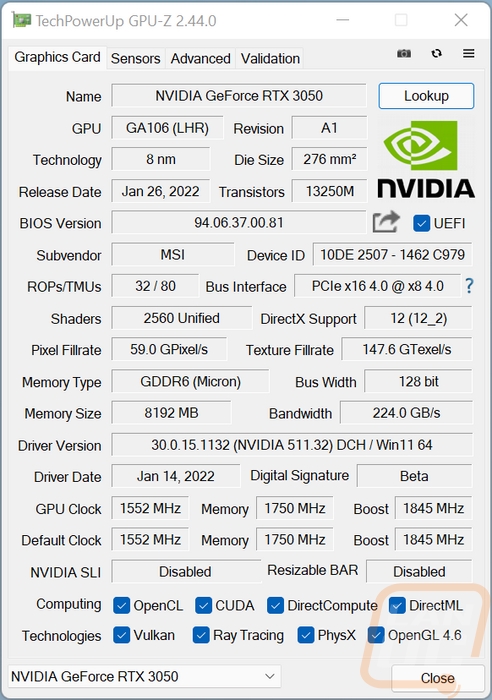
Before getting into testing I did also run GPUz to double-check that our clock speeds match up with the specifications. For the 3050 Gaming X that means CPUz needs to show the clock speed at 1845 MHz and it does. I also document the GPUz for future reference so we can see which BIOS revision testing was done with and the driver used which in this case was the Nvidia 511.32 beta driver provided to the press for the launch.
Packaging
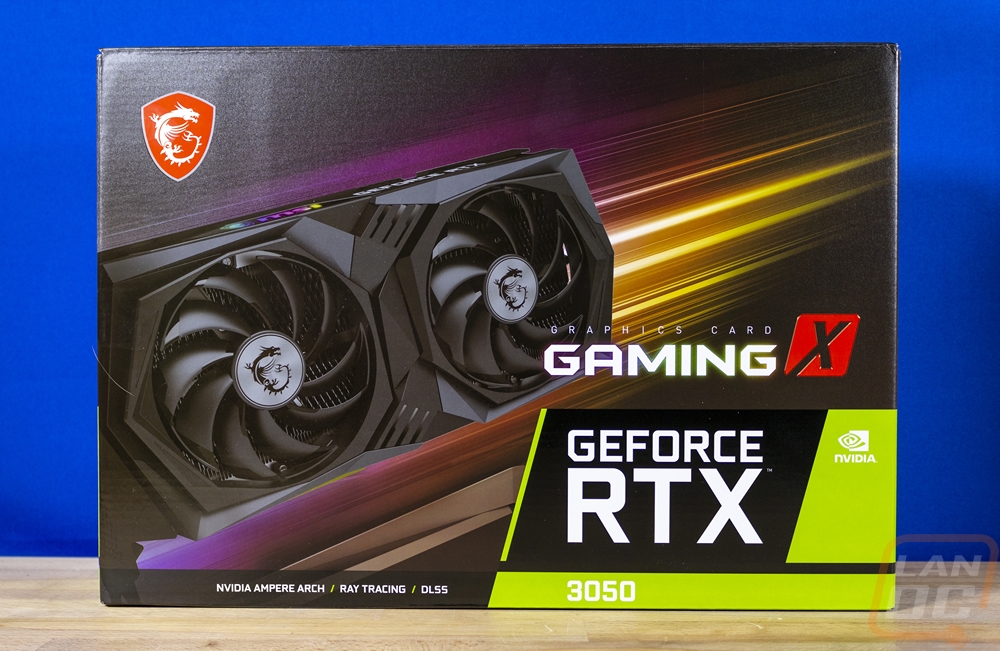
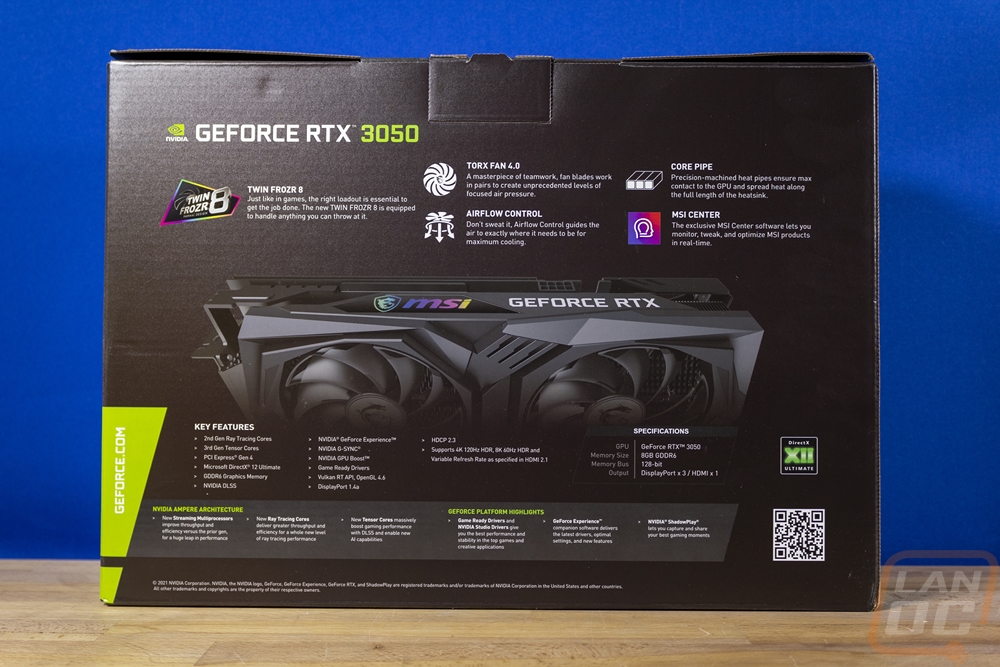
The box for the 3050 Gaming X 8G sticks exactly with the same look as other current MSI Gaming X cards. It has a black background with a large picture of the card on the front and streaks of colors going from the card like it is at speed. MSI deserves credit for getting an actual card picture right up on front, too many companies hide a picture on the back or don’t let you know what the card looks like at all. They have the MSI Gaming dragon badge up in the top left corner and then on the bottom right it has the standard Nvidia wrap around with the RTX branding and the model name. Above that, they then put the card model aka the Gaming X brand. The back of the box expands on the picture from the front with one that focuses on the top half of the card including having an angle enough to see the top edge of the card. They list out five key features and each has a description. Then down on the bottom they have the Nvidia-based feature list. There is a specification listing but it only hits a few things. It still needs the card dimensions and the clock speeds which are the other two things that are helpful when comparing card to card of the same GPU.
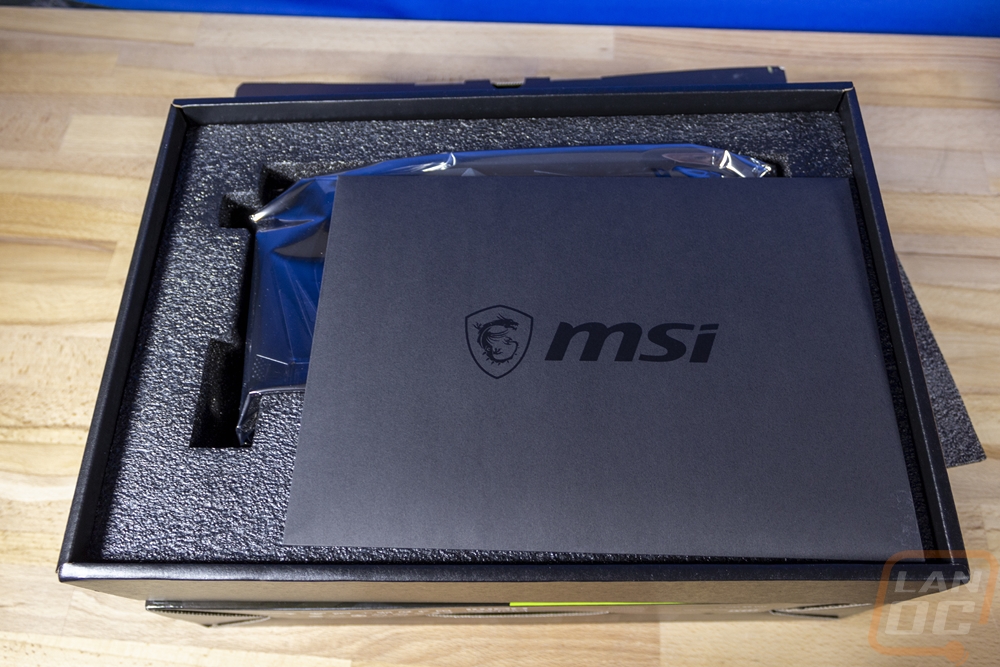
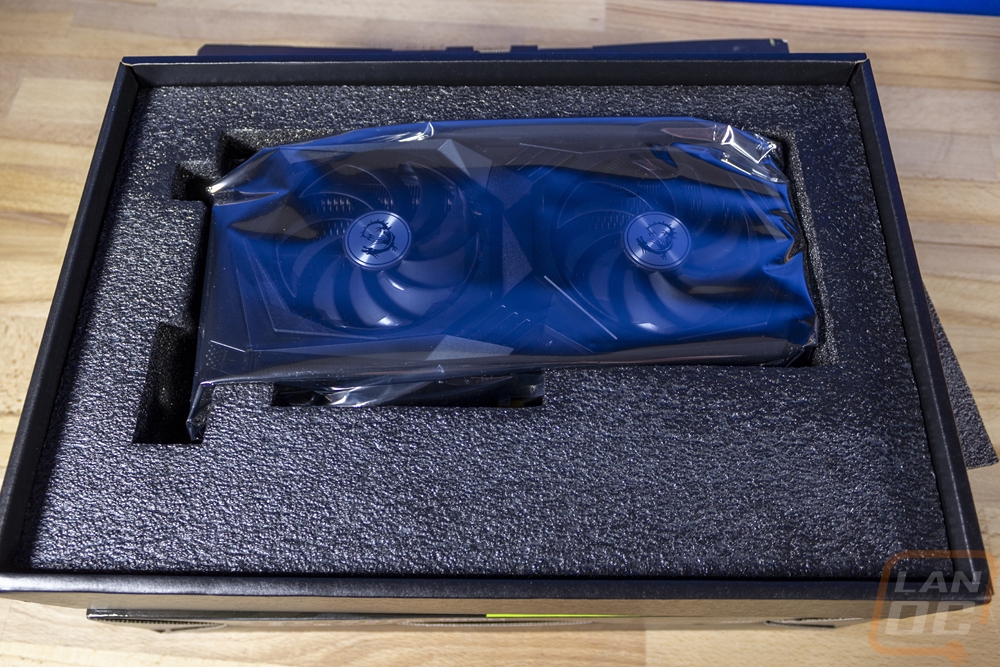
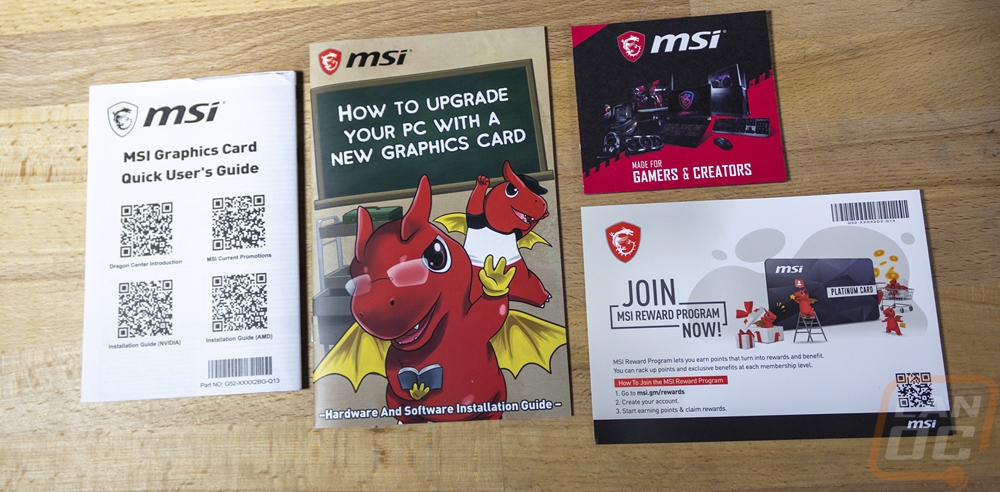
When you open the box up there is a cardboard tray inside that slides out. This has an envelope sitting on top as well as a thin foam layer that you can pull off. Then under that, the 3050 Gaming X is inside of a static protective bag and sits in a thick foam tray cut to fit it. Inside of the envelope, you get the standard documentation pack. This includes a user guide and MSI’s dragon in a comic that shows you how to install your video card. They also have a card for their reward program and a card with info on other MSI products. The 3050 Gaming X doesn’t come with any of the crazy accessories that some of the MSI cards come with. But you get what you need so to speak with the card.
Card Layout and Photos
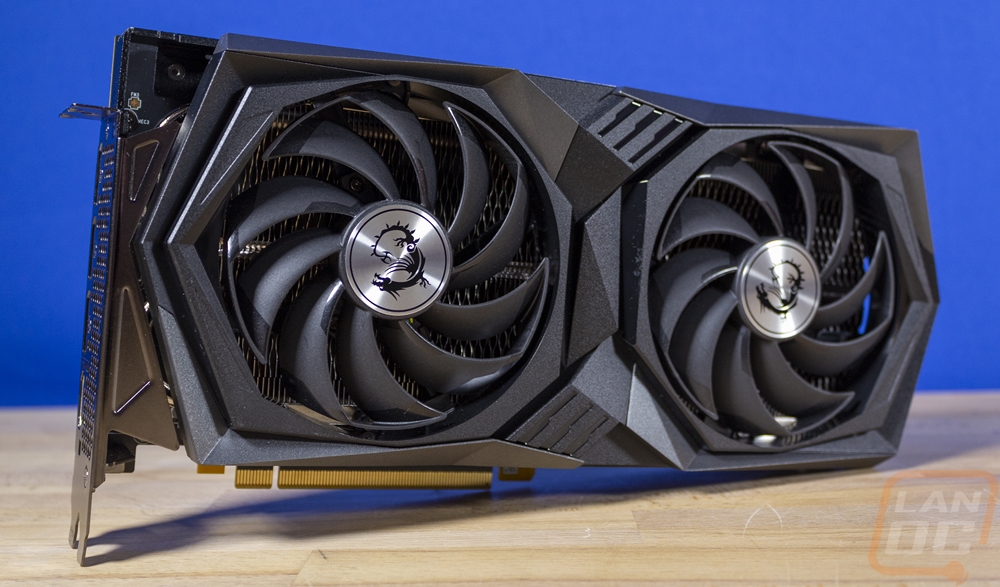
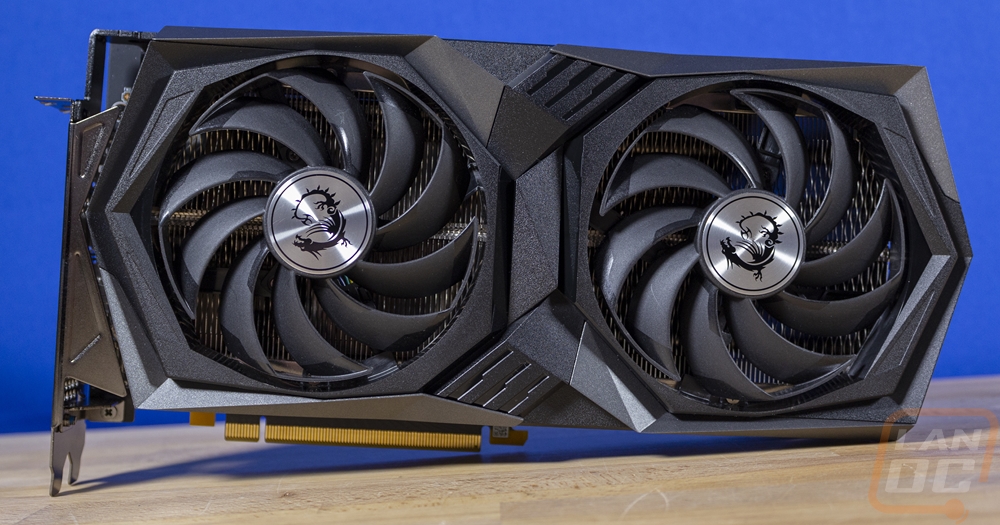
If you have seen one of MSI’s Gaming line of cards for any of the AMD 6000 series or Nvidia 3000 series of cards, then the 3050 Gaming X is going to look familiar. This look is also similar to the Nvidia 2000 series of Gaming cards from MSI as well but with a few changes. The 3050 Gaming X has what I like to can an angular design where MSI has given the front fan shroud has almost no rounded shapes in it. The only exception to that is on the right side of the left fan hole and the left side of the right fan hole. Even the rest of the fan holes have a pointed shape. They use this angular design to create extra 3d shapes all across the card to give the shroud more depth. I like the design when they use some of that depth to hide some of the accent lighting like around the fans and in the three stripes at the top and bottom between the fans, but with the 3050 Gaming X it doesn’t have any of that lighting and it does start to look extra busy. MSI does break things up slightly with grey to contrast the rest of the black shroud in a few areas. But overall it is a very aggressive look.

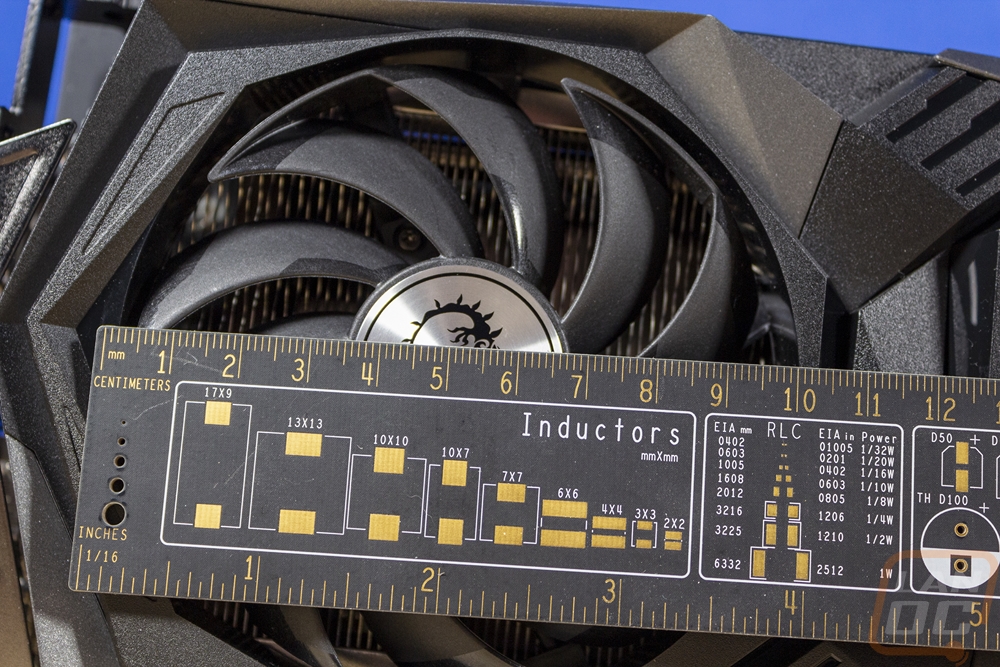
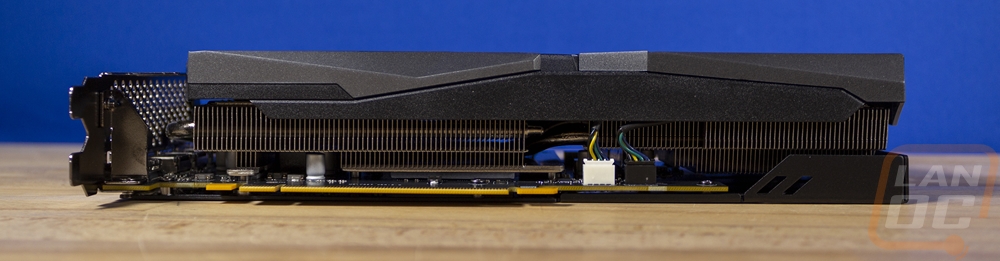
The 3050 Gaming X isn’t a small card, especially when compared to the EVGA 3050 XC Black that I previously took a look at. This card comes in at 278 mm long, 130 mm tall, and 49 mm thick. Lengthwise it is similar to the high-end cards from a few generations ago and the card height means it does stick up past the top of the PCI bracket by around 25 mm. As for its thickness, it is 9 mm past the standard 2 slot size, so you will need to leave a space between this and any other card. That is nice for airflow either way, but for some SFF cases that extra thickness could make or break things.
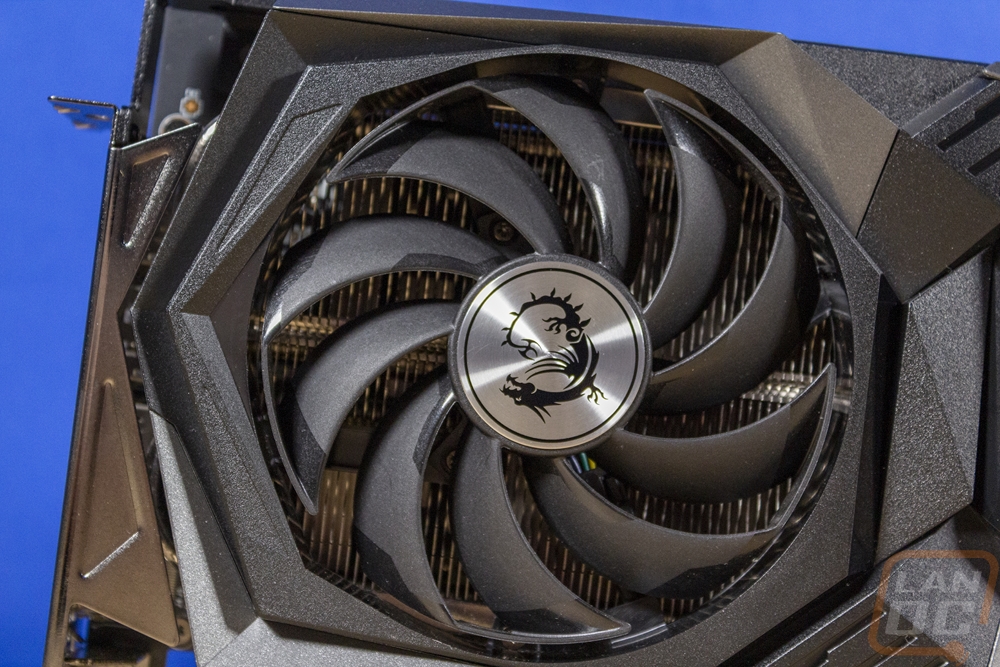
The fan layout for the 3050 Gaming X is a standard dual fan design with axial fans that blow down into the Twin Frozr 8 cooler. When looking at it, the fans look like they would be two different sizes, but they are both the same size. These are their Torx Fan 4.0’s and what MSI has done with this fan design is paired up fan blades and linked them together at the end of the blade with a partial ring design that helps give the blades additional strength and I imagine doing this rather a full ring also still helps keep fan weight down as well. This helps focus the air down and not out as much as they can to keep things blowing down into the heatsink. The fans have a 10 blade design and the blades have a heavy twist to that as well. Then in the center, they have a metal finish sticker with a black MSI gaming dragon printed on it. I like this a lot better than using the full red bad and it helps keep the card neutral so it should match most builds. Looking through the fan we can see that the Twin Frozr 8 design has small waves on the fan side of the heatsink. MSI says that this design helps keep noise down but I would imaging it also helps each part of the heatsink get some airflow as well. The heatsink layout is horizontal which means a shorter distance for the air to flow through the heatsink which normally means better cooler but it also pushes air out the top and bottom which can add extra heat up against your motherboard and sometimes your SSD if it is in that area.
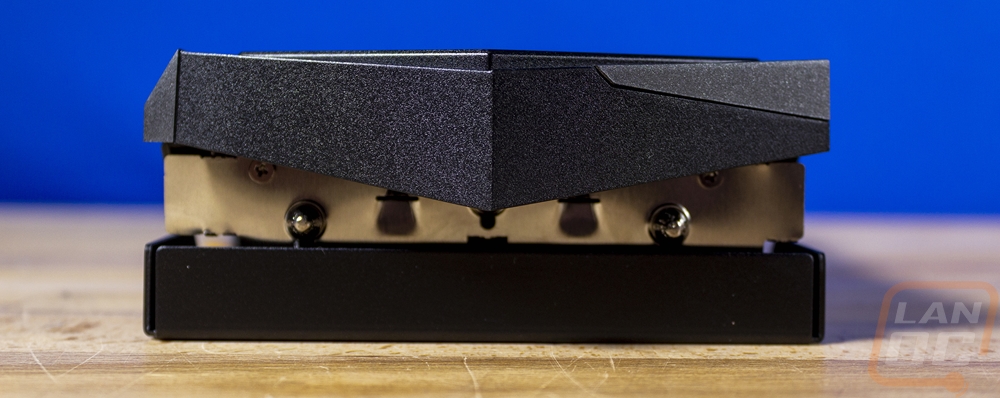
When looking around the top, bottom, and end edges of the 3050 Gaming X you can see that MSI has designed the heatsink to fit tightly up against the PCB and around each component on the PCB. This isn’t a generic heatsink design. It also uses heatpipes which are squared off on top of the GPU to pull heat out across the heatsink to spread the heat around. The bottom of the card has a very open design to push that warmed air out. The top edge does have the shroud wrap around a little more with the branding area, but they were careful to keep it open on any other area beyond that. Down at the end, the card has a bit of a beak design where the shroud sticks out well past the heatsink and even past the backplate. This is also past the fan as well so I’m not entirely sure why they would add that much more to the card length just to continue that angular styling.
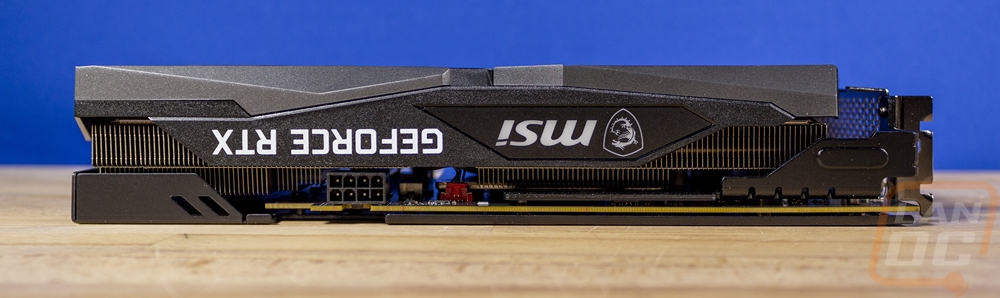
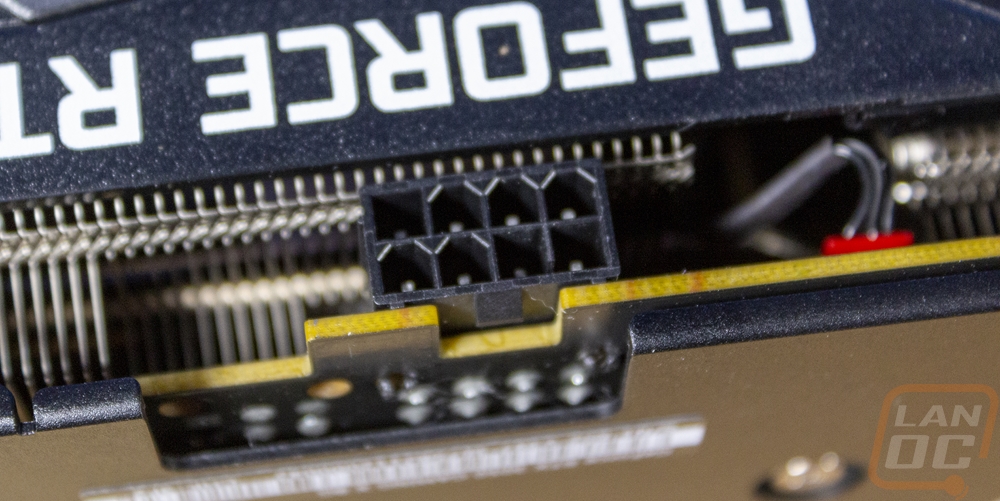
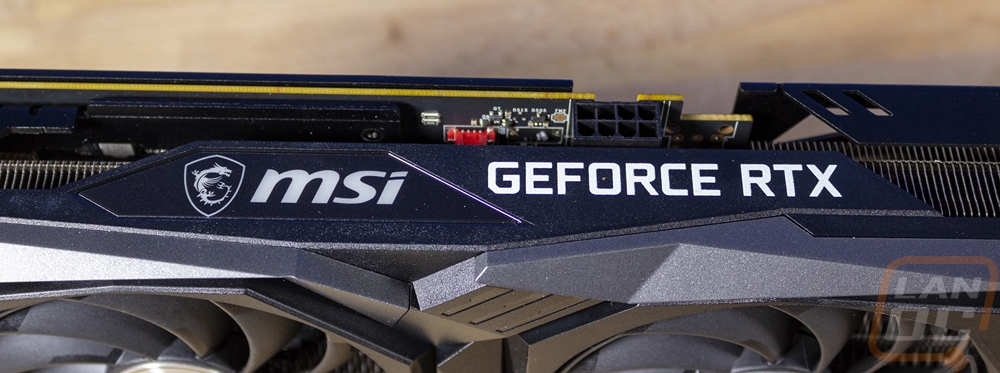
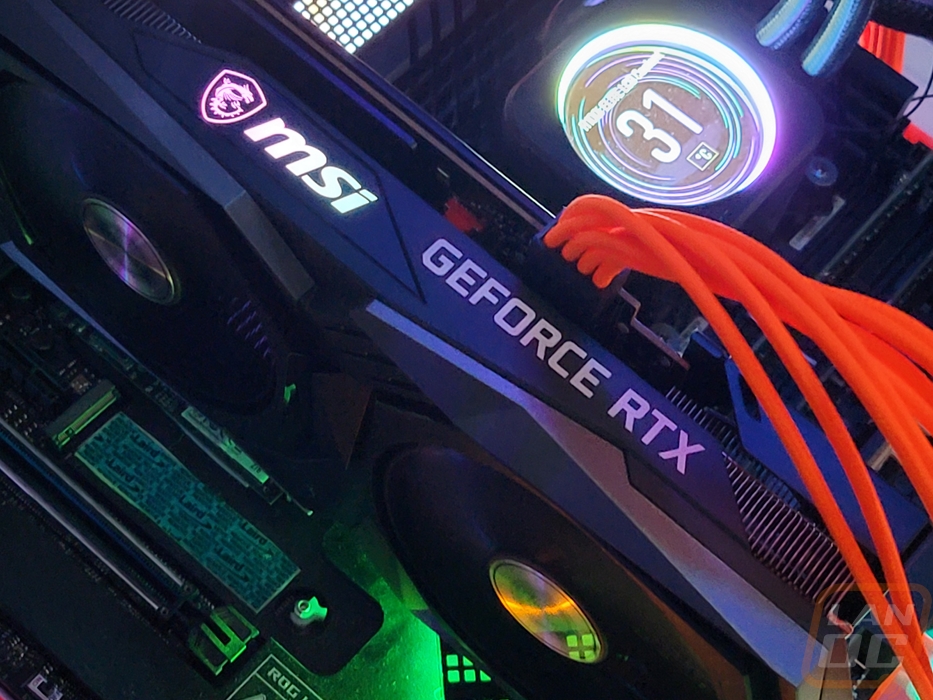
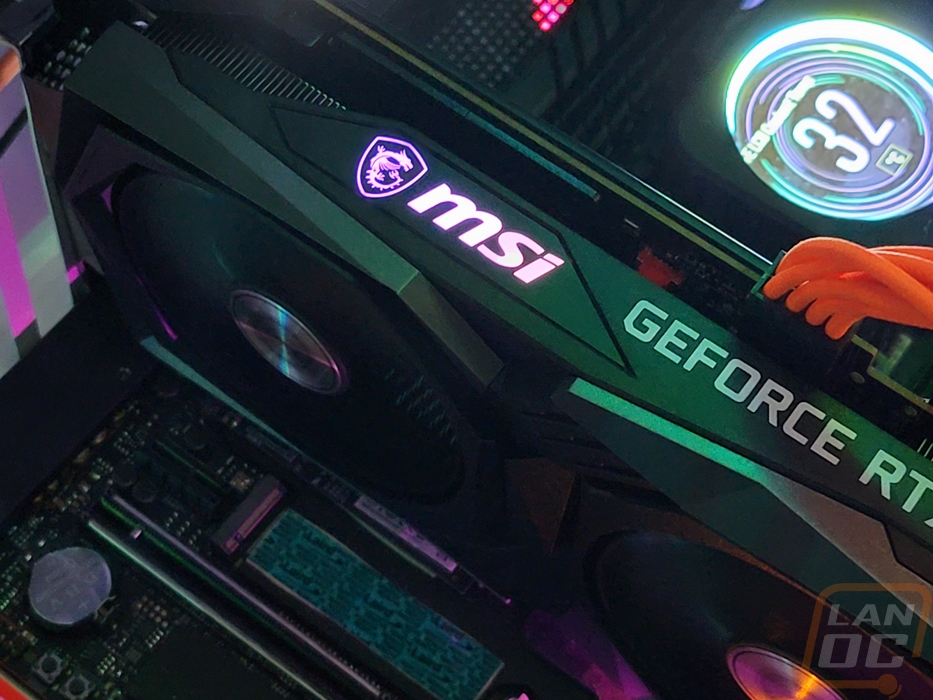
The top edge of the 3050 Gaming X has a few things going on. For starters, it has the front fan shroud wrapping around the top in one area so they could fit MSI branding and the GeForce RTX branding. I would love this to have the RTX 3050 branding personally, which would be a little less generic. The MSI logo is backlit with MSIs mystic light addressable RGBs. If you look closely on the right side you can see that the backplate of the card also wraps around as well. Then between those two close to the end of the PCB (but not at the end of the card) is the power connection. The 3050 Gaming X requires an 8-pin PCIe power plug to keep things running. That plug is flipped around with the clip on the PCB side with the PCB notched to fit it so the heatsink can fit close to the plug without having to account for fitting fingers in to unclip it.
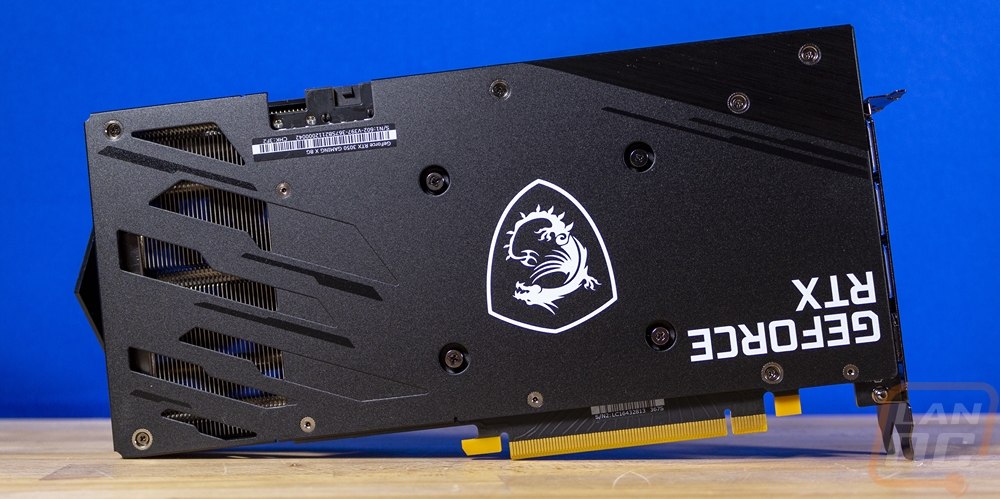
The back of the 3050 Gaming X does have an all-metal backplate. MSI went with a thick gauge as well but what makes this backplate strong is because at the top and bottom and on the end of the card they have the backplate bent around to wrap around to those sides. There isn’t going to be any way for the 3050 Gaming X to flex later in life. The backplate has a textured black finish with the exception of the top right corner. It looks like it might be painted in this photo but it is machined with a brushed finish in that area. There are a few other accents including below that corner which was printed on that give a darker black look. They also have the GeForce RTX branding and the MSI Gaming logo in the center which are both in bright white and upside down so they are better seen when installed in a normal case. The backplate has the serial number sticker on it just under the power connection which should make it easy to see if you need to get to it without removing the card. Then down at the end, we can see the large holes in the backplate which let us see the heatsink where the one fan can blow through in all of that space past the end of the PCB when ends about an inch past the power connection.
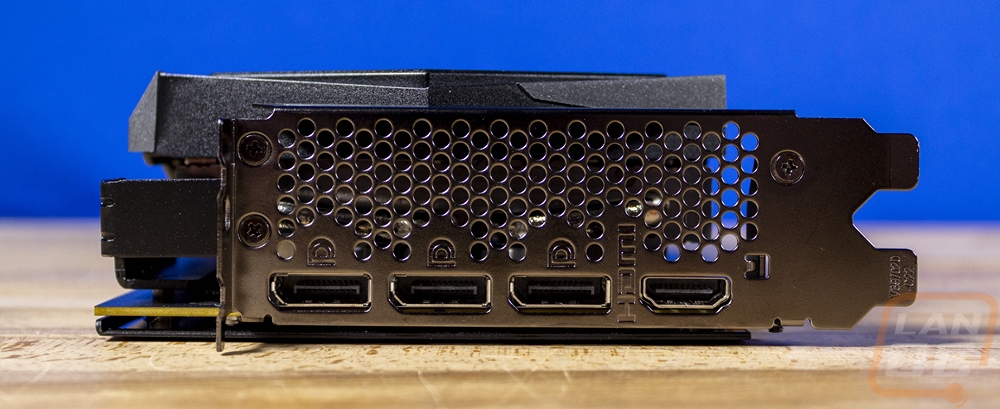
At the end of the card, the PCI bracket for the 3050 Gaming X is filled with small round holes which give a little bit of ventilation but are far from the airflow that brackets with the large holes would have. The bracket itself has the standard plated steel finish with a tiny bit of tint. With the 3050 Gaming X being so black, a blacked-out bracket would have been a good match. For connections, the 3050 Gaming X has the standard three DisplayPort connections with one HDMI. I like that MSI has the HDMI down at the bottom so it is easier to find, most cards have it right in the middle of the other DisplayPorts.
So the 3050 Gaming X doesn’t have a crazy amount of lighting. In fact, it has less lighting than the RX 6700 Gaming X that I previously took a look at which had accent lights on the fan side as well. For the 3050 Gaming X, the lighting is limited just to the MSI logo up on the top edge. I’ve talked before about how I’m not a big fan of just having backlit branding all over in builds and this does fit that. I like having the RGB lighting but would prefer cool accents that light the card up without making your case look like times square. But it is nice that with the addressable RGB lighting here you can at least match the lighting with the rest of your build.
Test Rig and Procedures
Test System
CPU: Intel Core-i9 12900K – Live Pricing
Motherboard: Asus ROG Maximus Z690 Extreme – Live Pricing
Cooling: Corsair H100i Elite LCD Display - Live Pricing
Noctua NT-H1 Thermal Paste - Live Pricing
Memory: Micron Pre Launch DDR5 2x32GB – Live Pricing
Storage: Sabrent Rocket Q4 2TB – Live Pricing
Power Supply: Corsair AX1200 - Live Pricing
Case: Primochill Wetbench - Live Pricing
OS: Windows 11 Pro 64-bit - Live Pricing
|
Our Testing Procedures |
|
|
3DMark |
All 3DMark based tests are done using the most recent version. We test using all three versions of Fire Strike and both Time Spy and Time Spy Extreme. Tests to look at ray tracing performance is done with Port Royal when supported and for Nvidia cards that support DLSS, the DLSS subtest is also done at 1440p with the performance setting and DLSS 2.0. |
|
Unigine Superposition |
1080p Extreme and 4k Optimized benchmarks along with the VR Future test are done. The VR test is done at the Oculus resolution |
|
VRMark |
Only the Blue room test is run |
|
CS:GO |
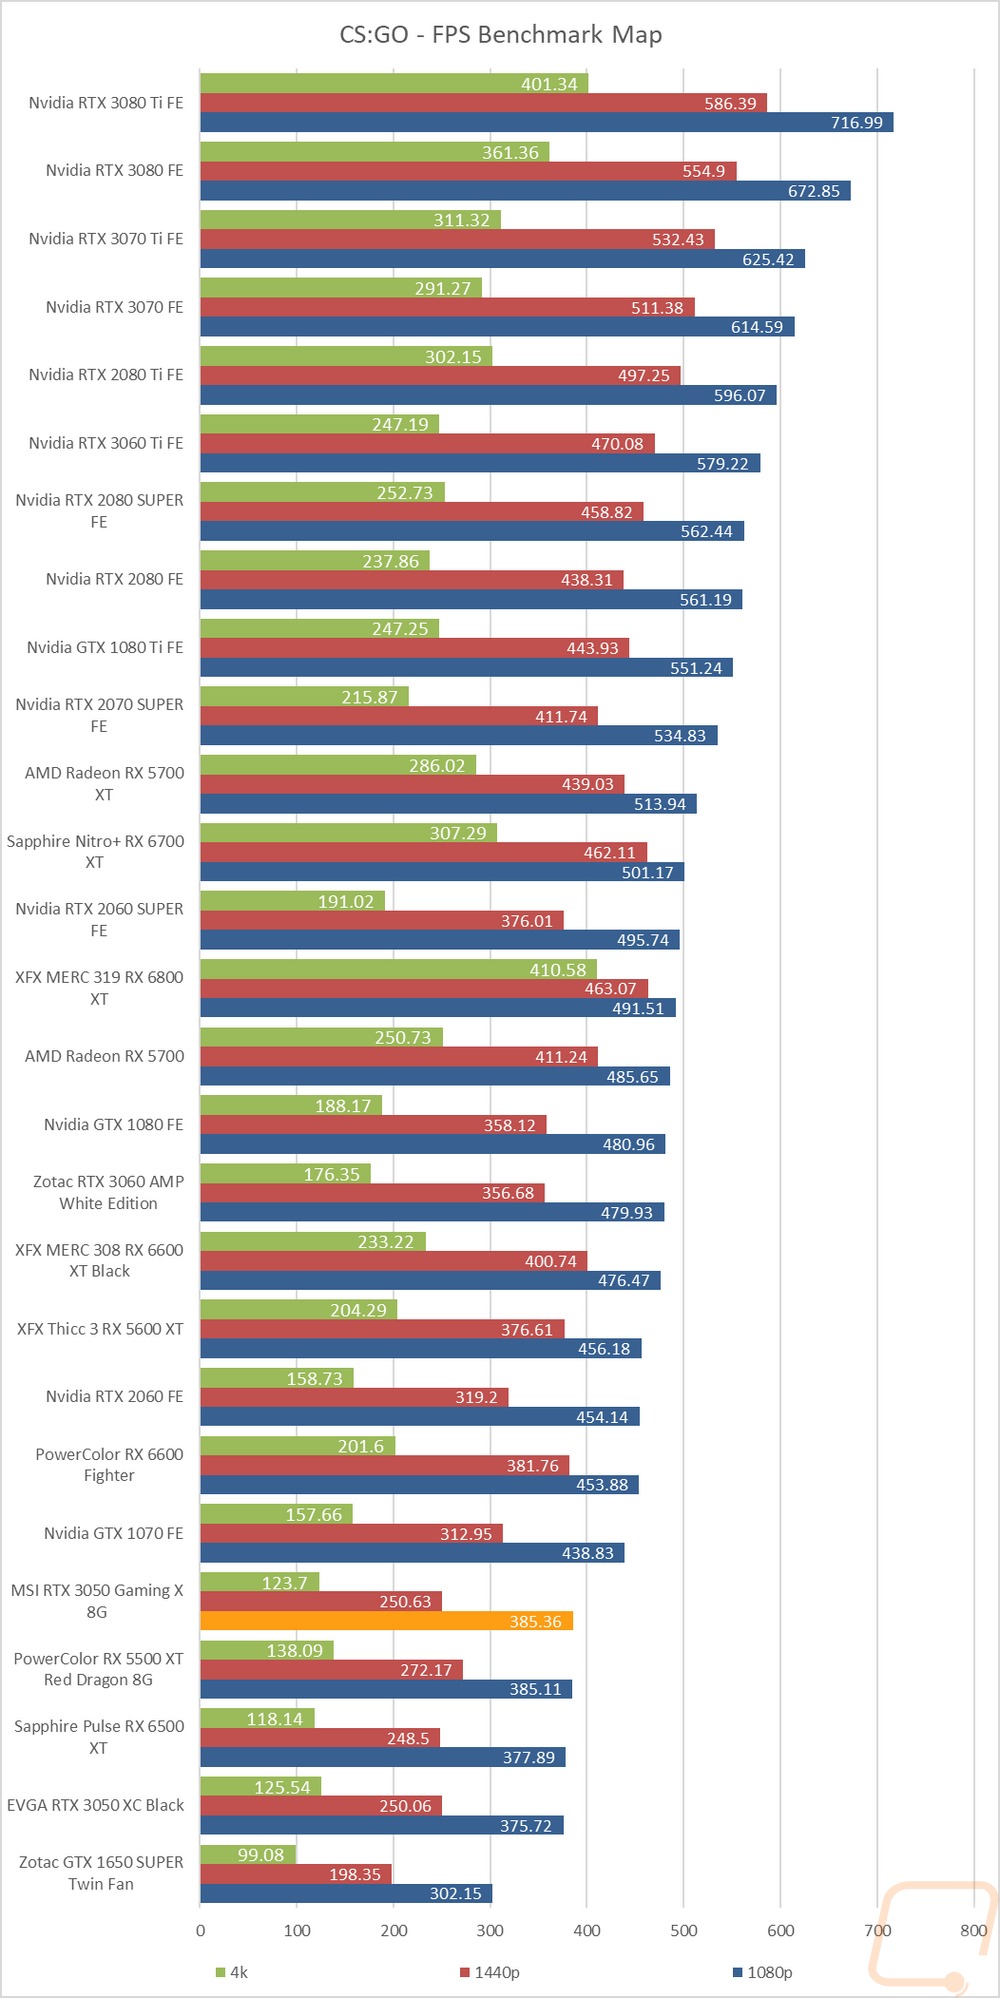
This test is done using the workshop map called CS:GO Benchmark. You can find more information at this link. https://www.gamingpcbuilder.com/how-to-install-csgo-fps-benchmark-map/ I test at 1080p, 1440p, and 4K resolutions. All auto settings are turned off and detail is set to their highest settings. shadow quality high, model texture detail high, shader detail very high, AA set to 16x, uber shaders enabled |
|
Mafia 2 Definitive Edition |
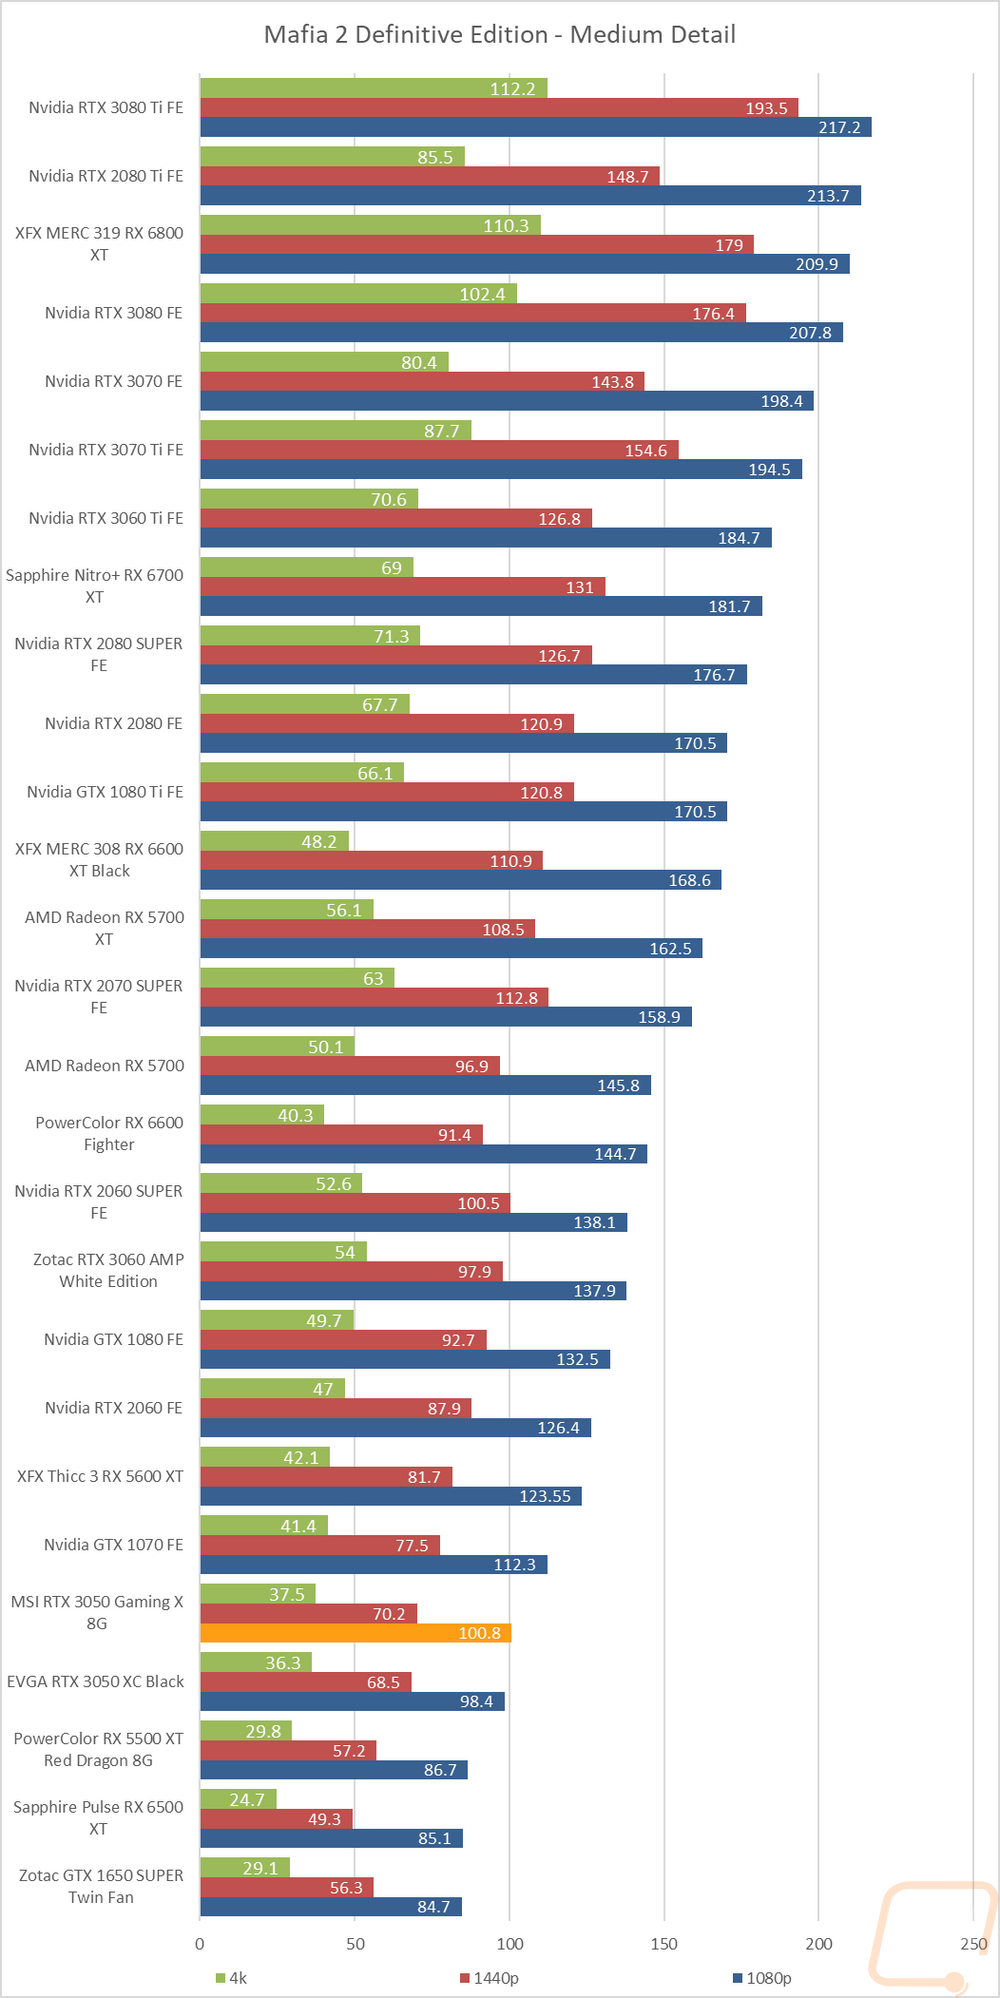
This uses the built-in benchmark to test at High and Medium detail presets at 1080p, 1440p, and 4K resolutions |
|
Watch Dogs: Legion |
Built-in benchmark testing at ultra and high details. Tested at 1080p, 1440p, and 4k. I also do RTX and DLSS testing on Nvidia cards at 4K using the Ultra detail settings as a base as well. |
|
Borderlands 3 |
Built-in benchmark testing with the ultra detail setting and medium detail setting, done at full screen with default settings at 1080p, 1440p, and 4k on DX11 |
|
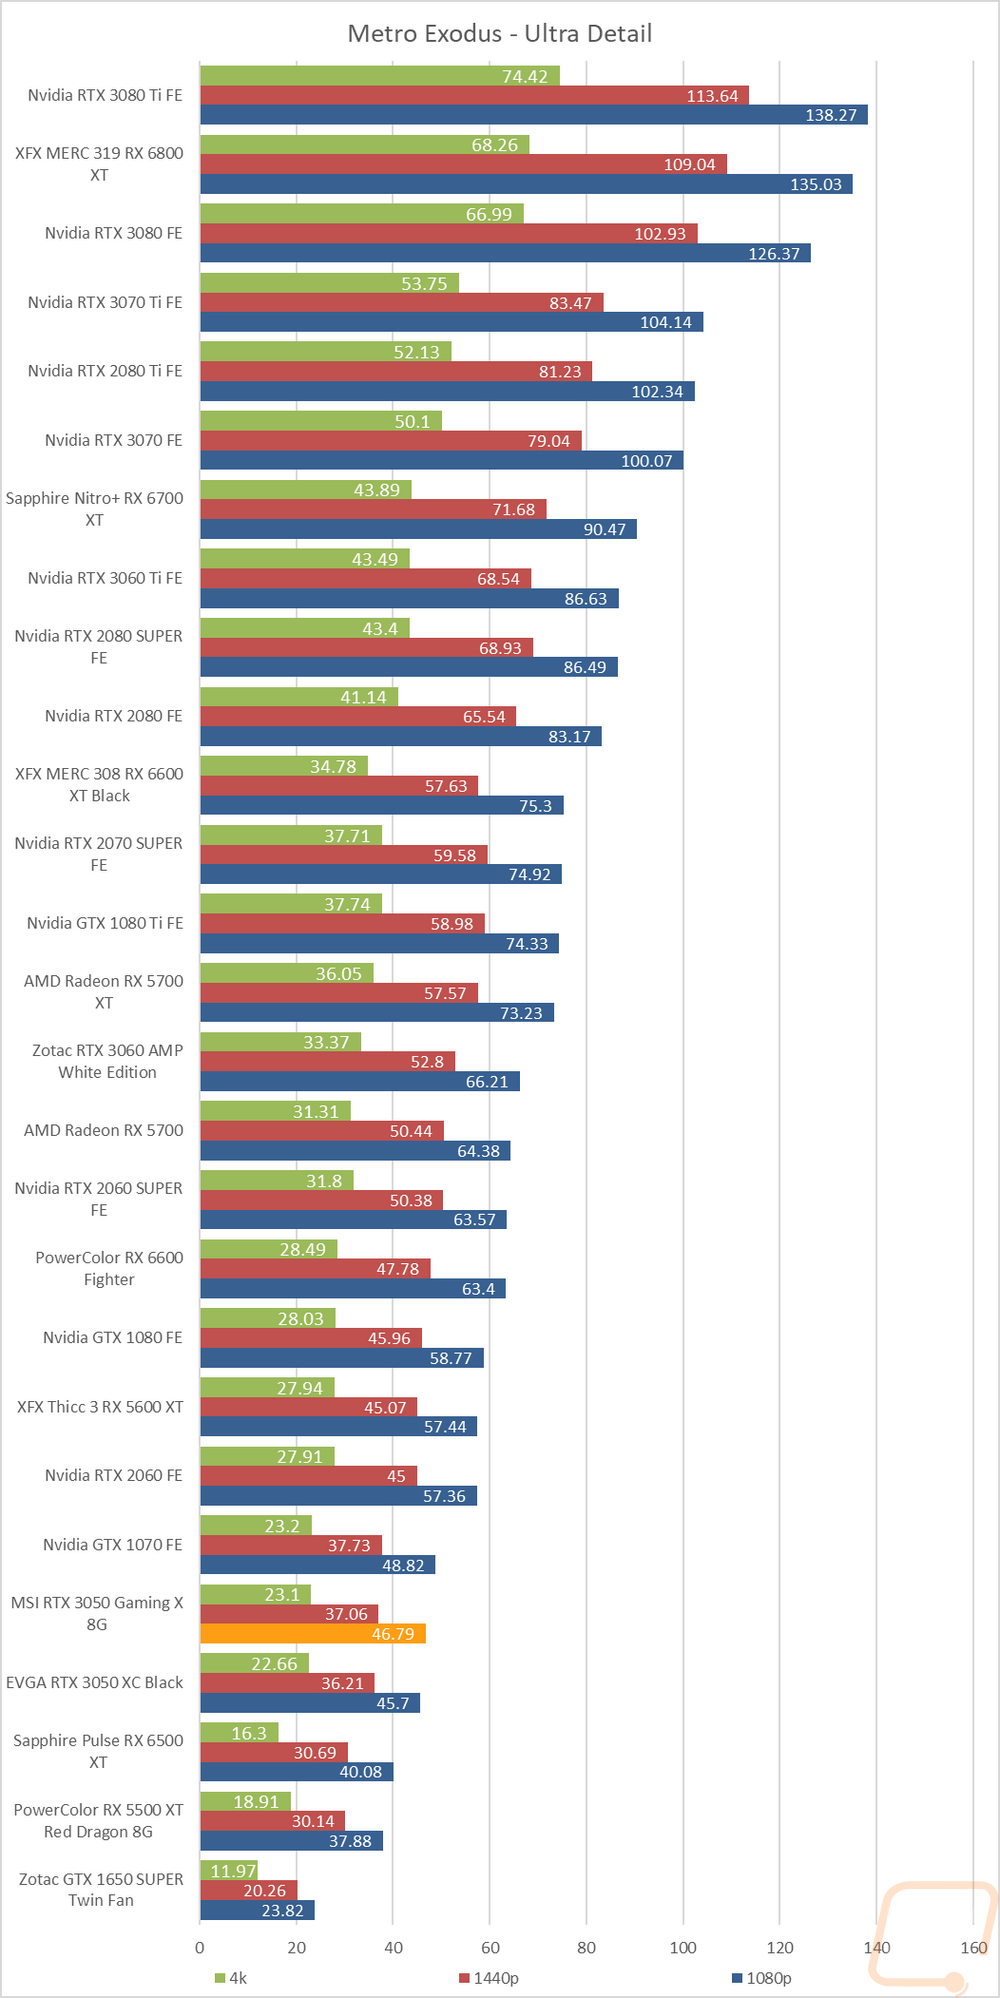
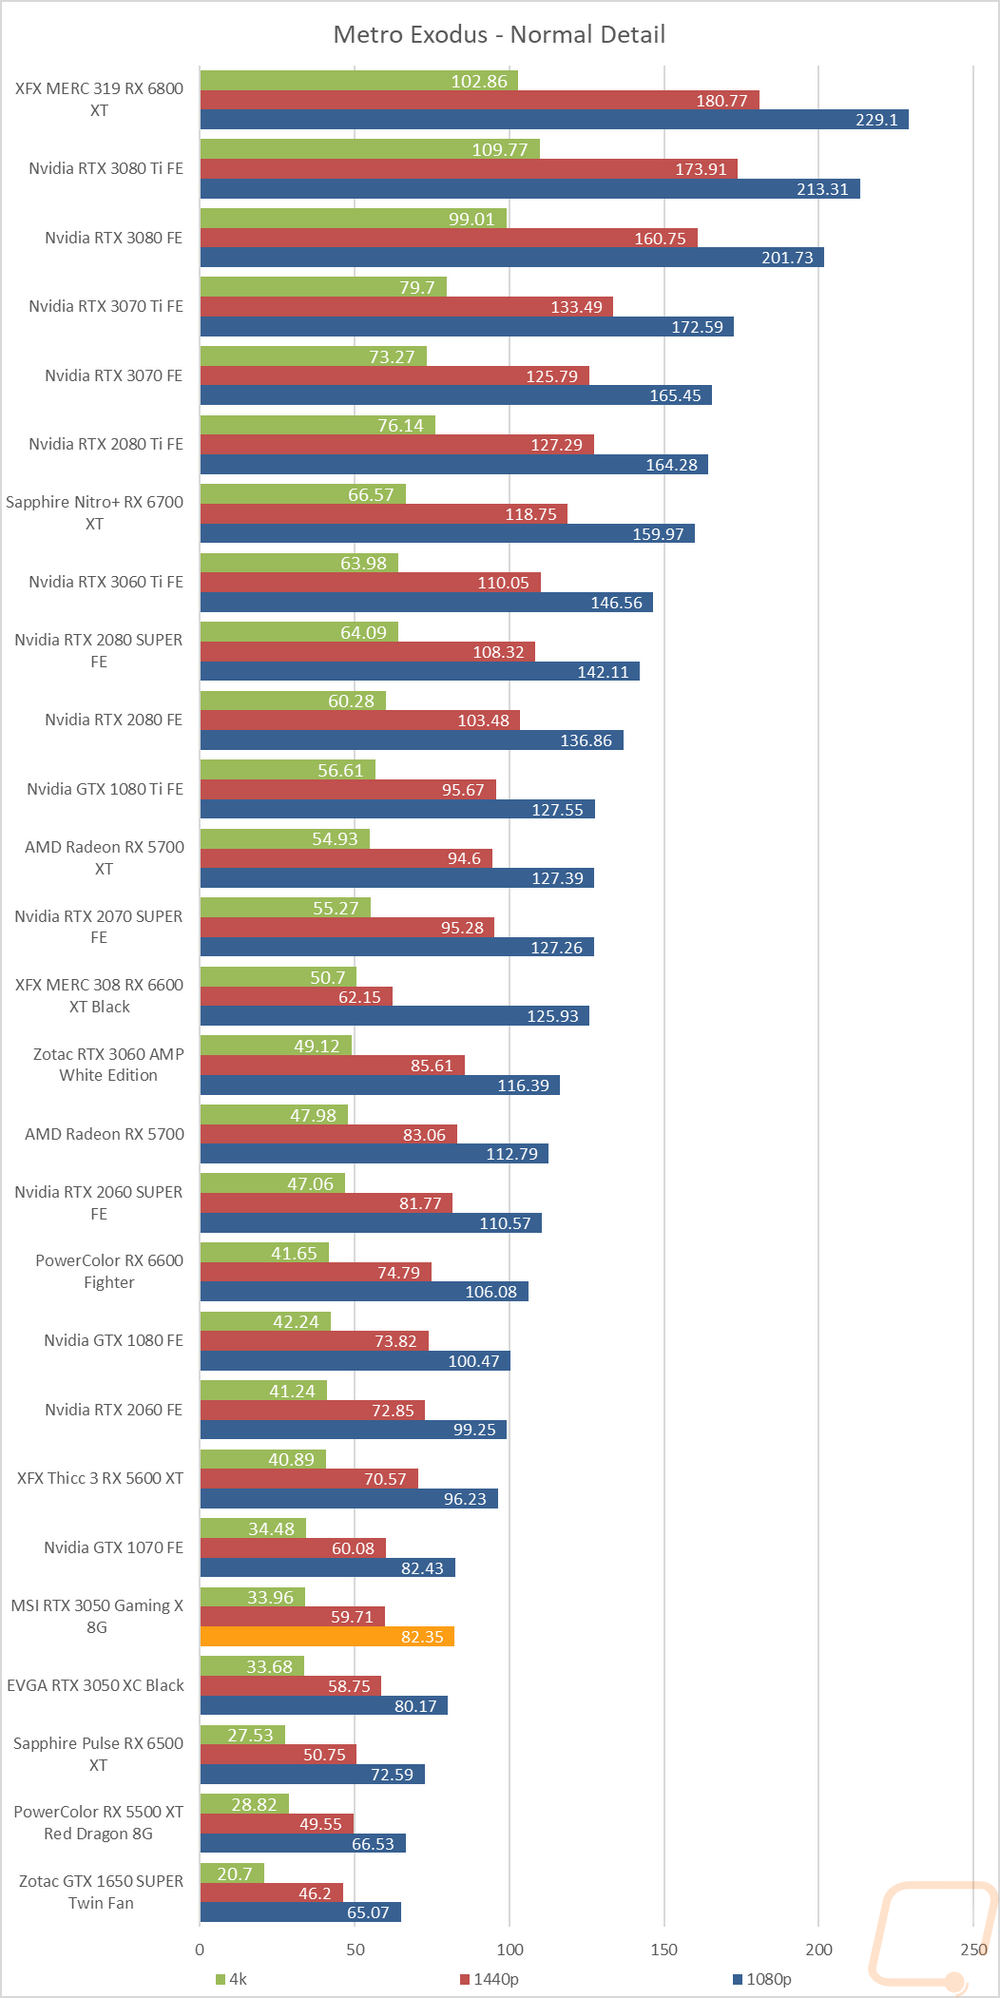
Metro Exodus |
Using built-in benchmark, testing at ultra and normal details at 1080p, 1440p, and 4k. I also do RTX and DLSS testing at 4K with the ultra detail base settings for Nvidia cards as well. |
|
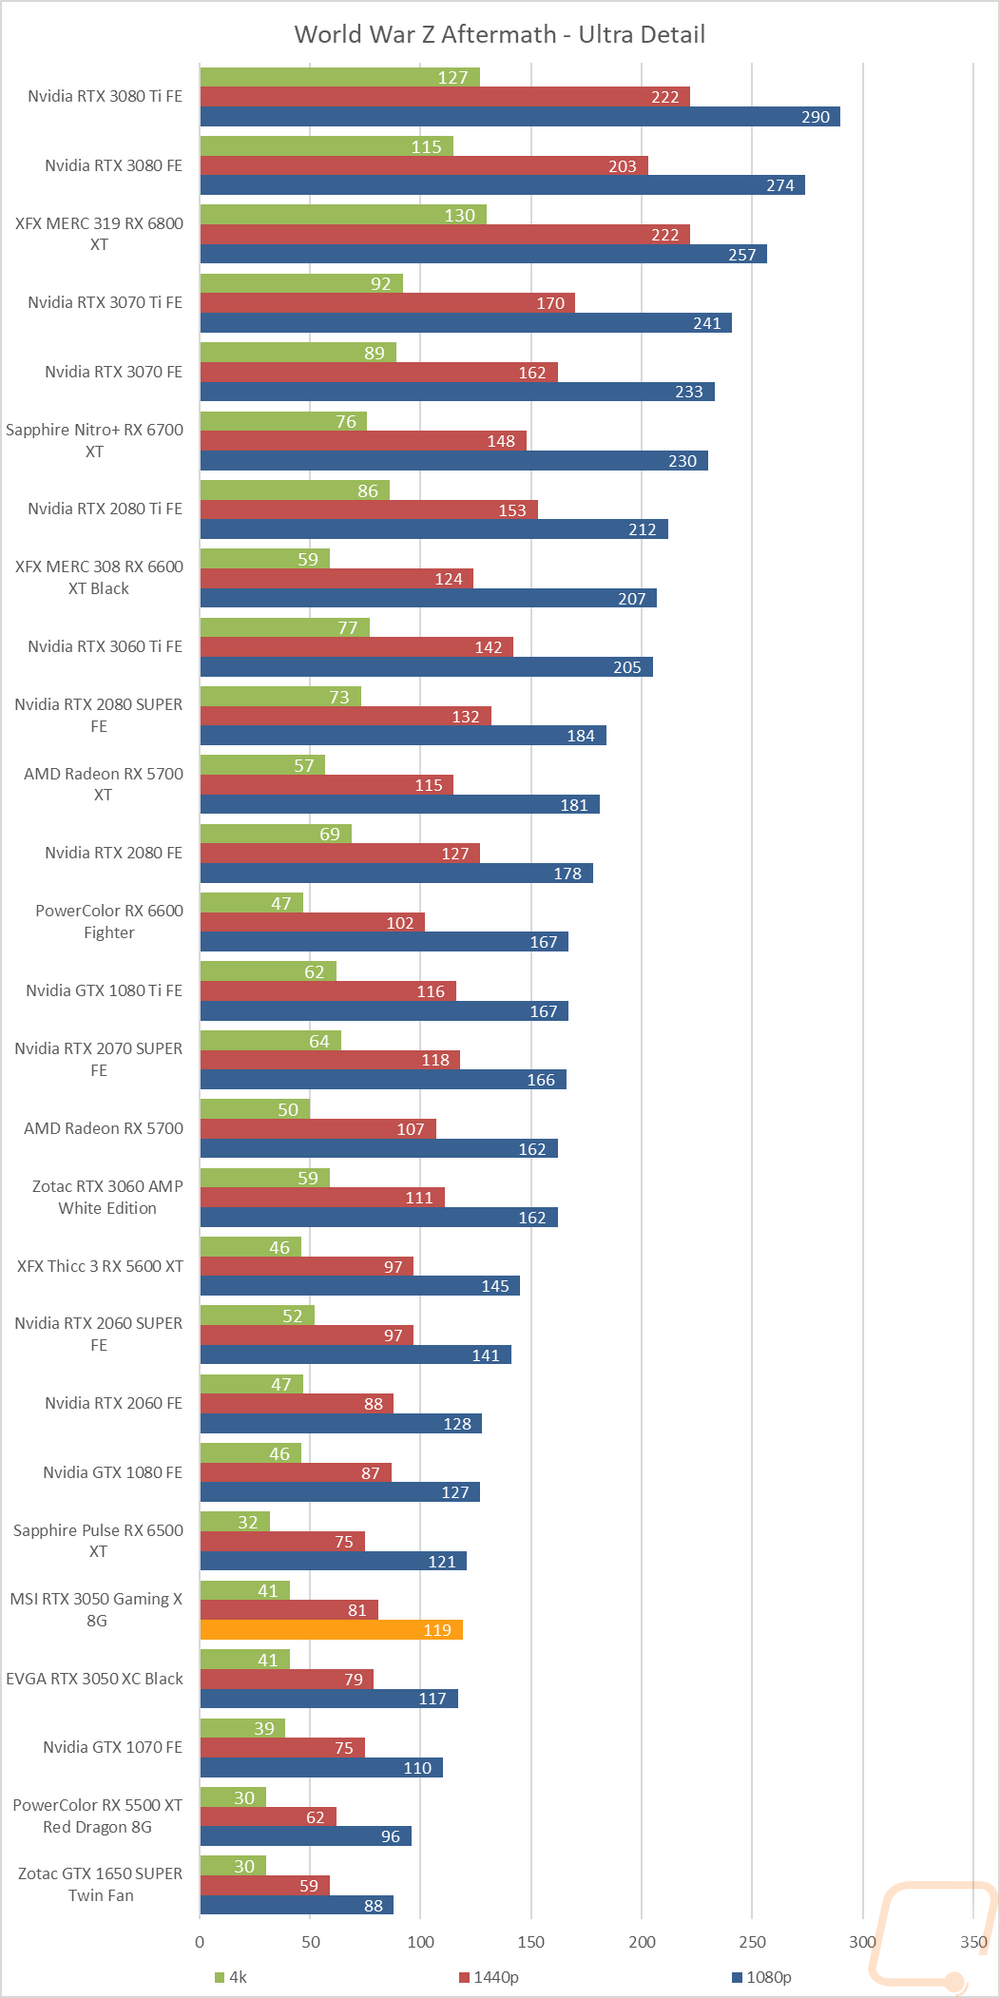
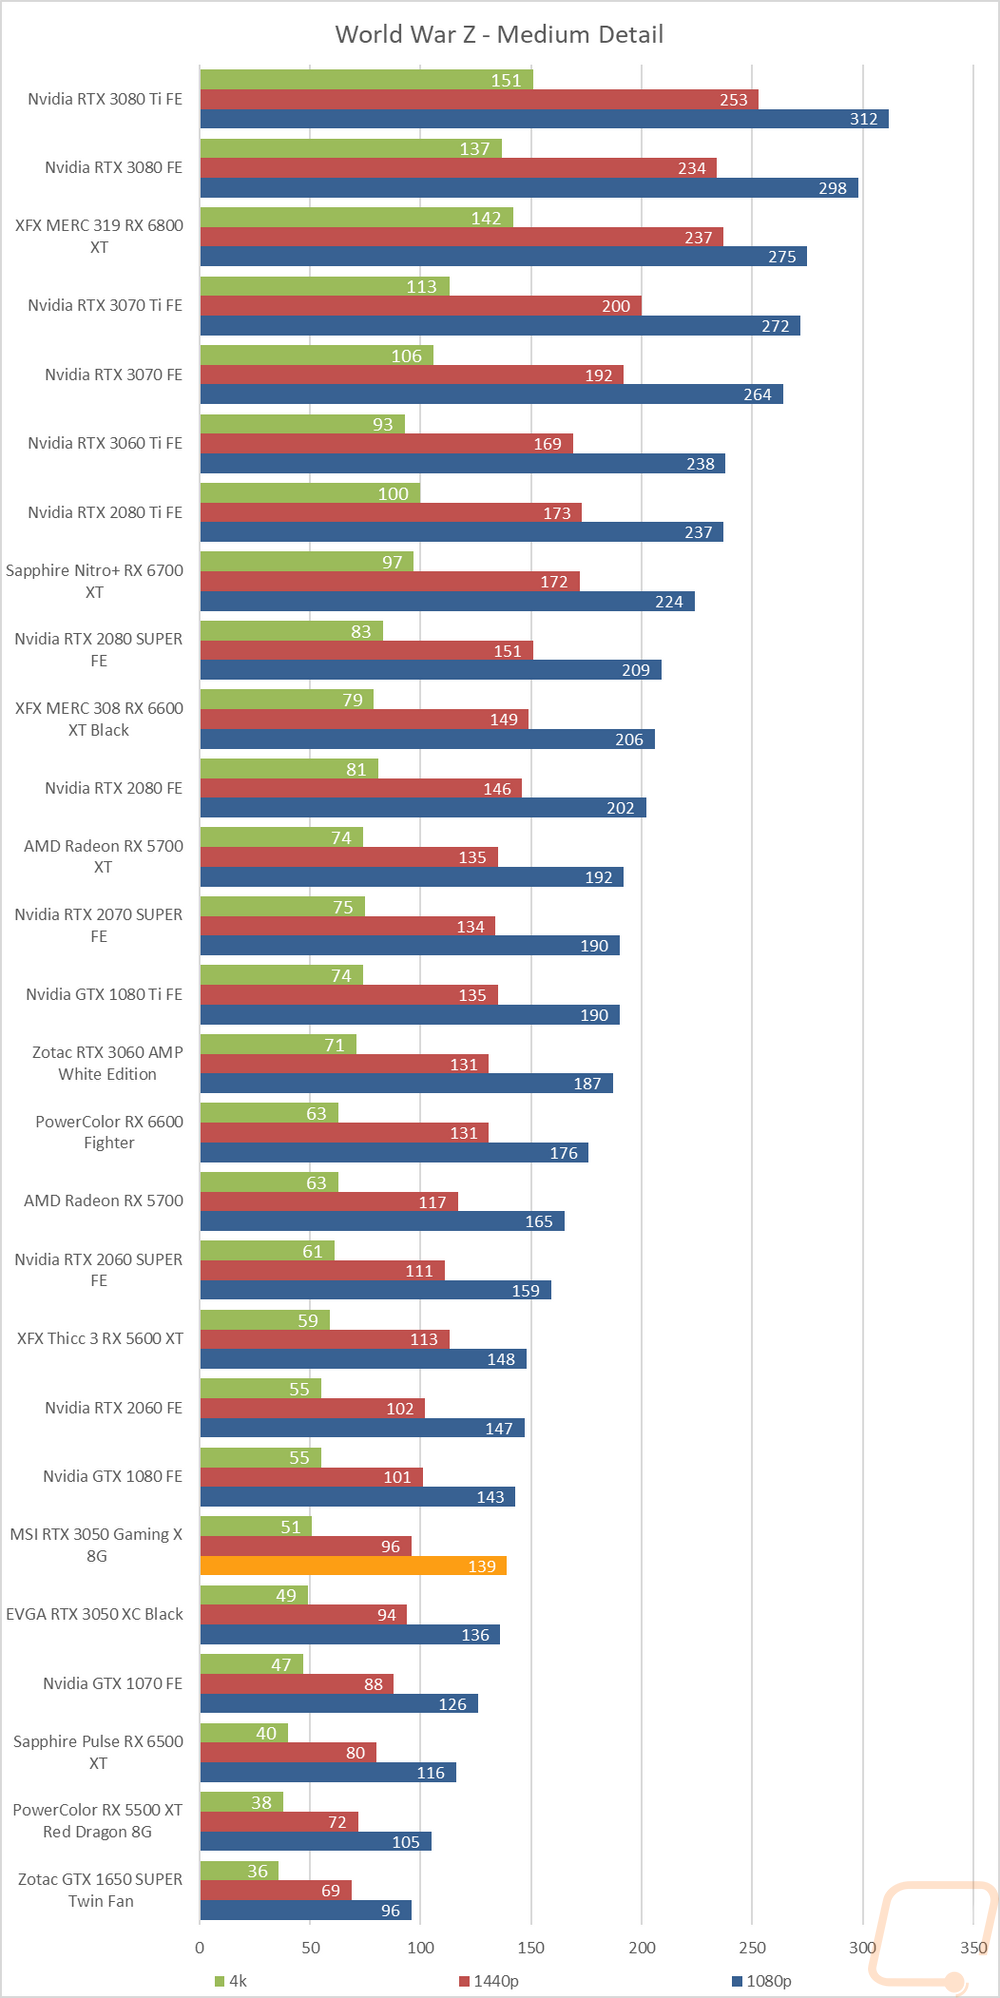
World War Z Aftermath |
Built-in benchmark in DX11 testing both the Ultra detail and Medium detail levels at 1080p, 1440p, and 4K resolutions |
|
The Division 2 |
Built-in benchmark at Ultra detail with V-Sync turned off at 1080p, 1440p, and 4k resolutions. |
|
Total War: Three Kingdoms |
Built-in benchmark using the Battle Benchmark setting. Tested at 1080p, 1440p, and 4k at both high and ultra detail settings |
|
Far Cry 6 |
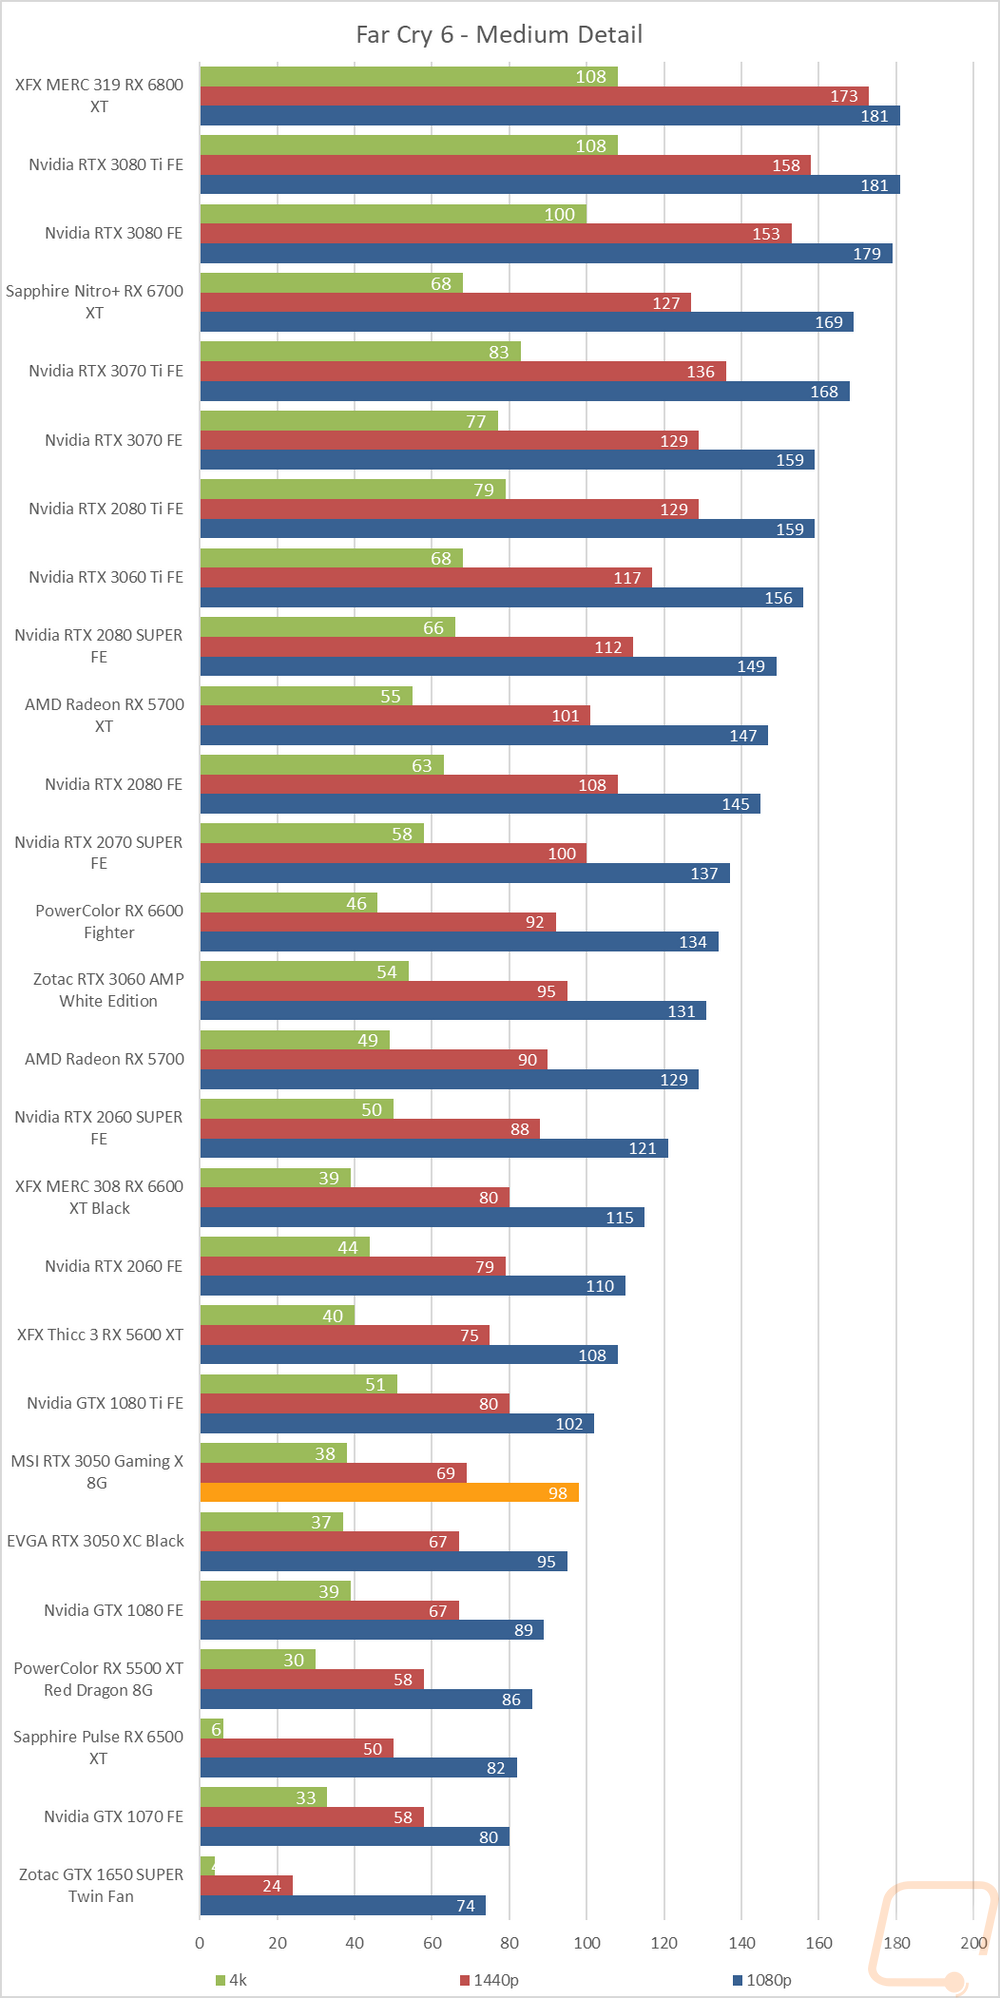
Built-in benchmark, tested at 1080p, 1440p, and 4k with the Ultra and Medium detail settings |
|
Ghost Recon Breakpoint |
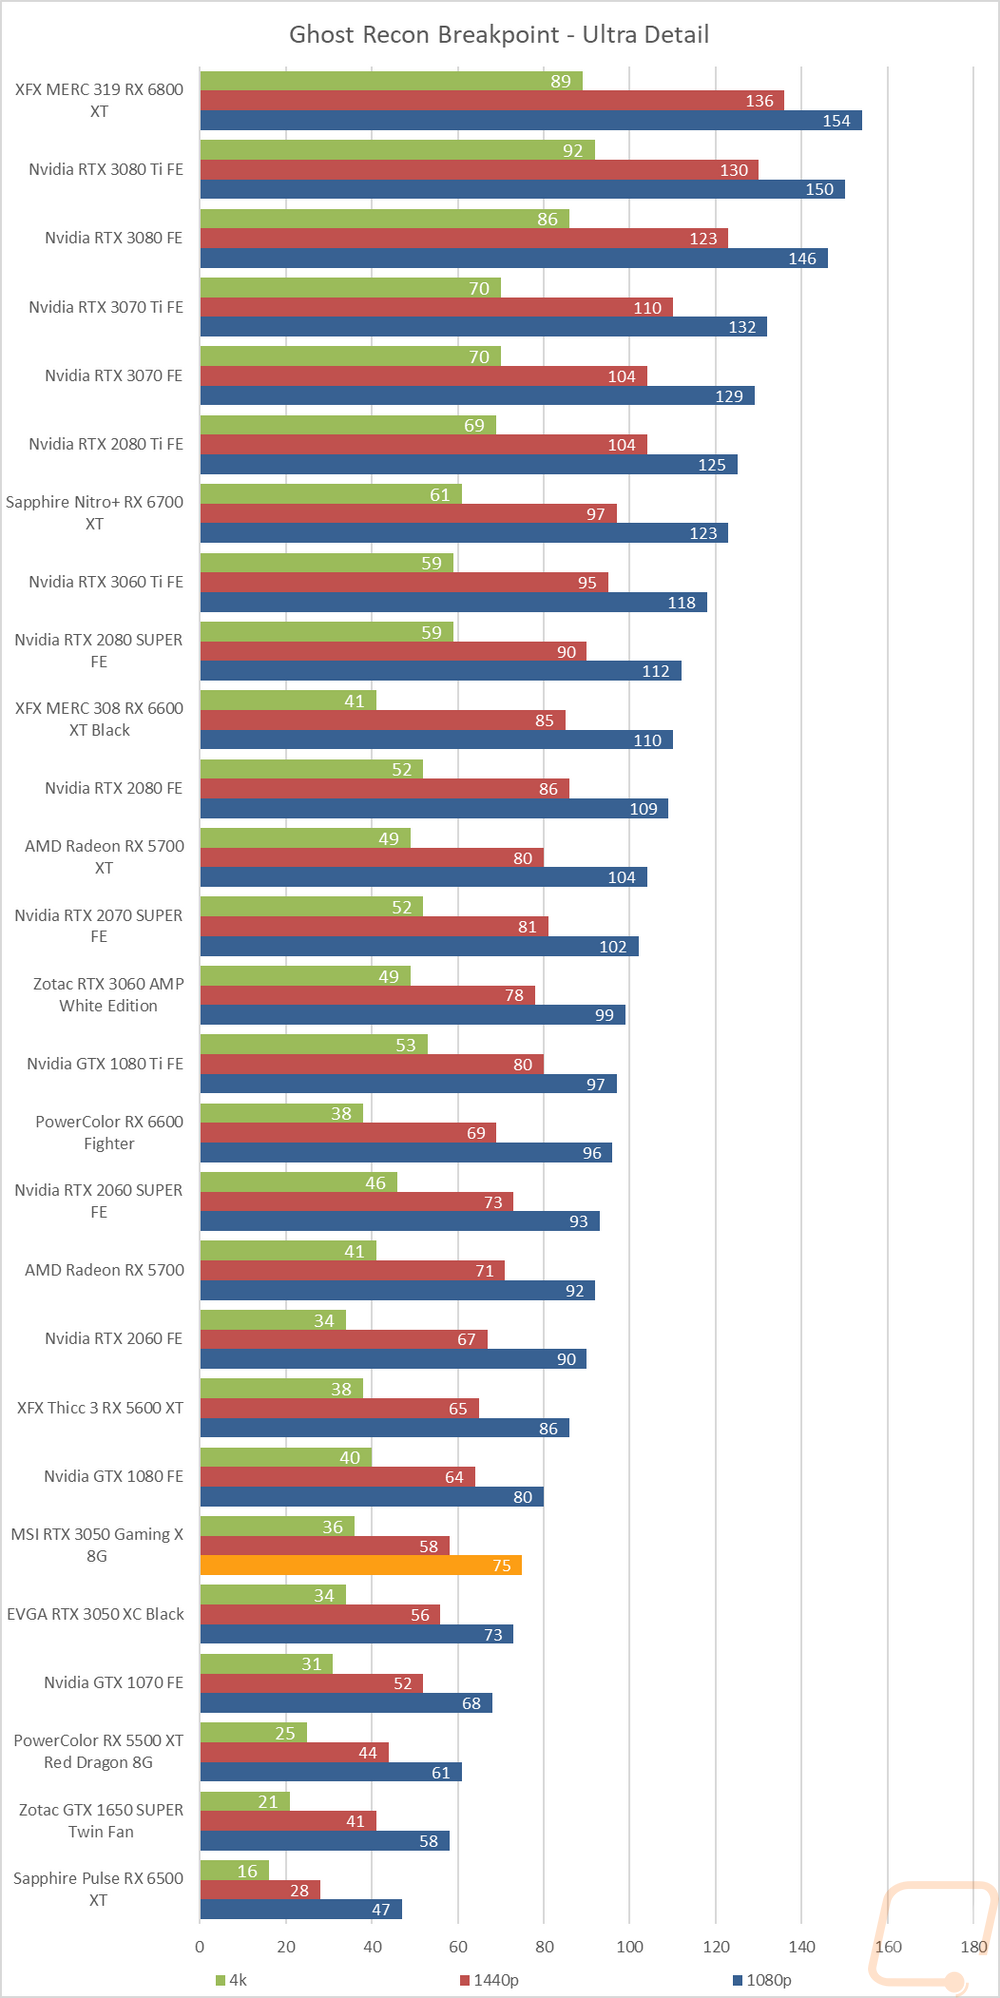
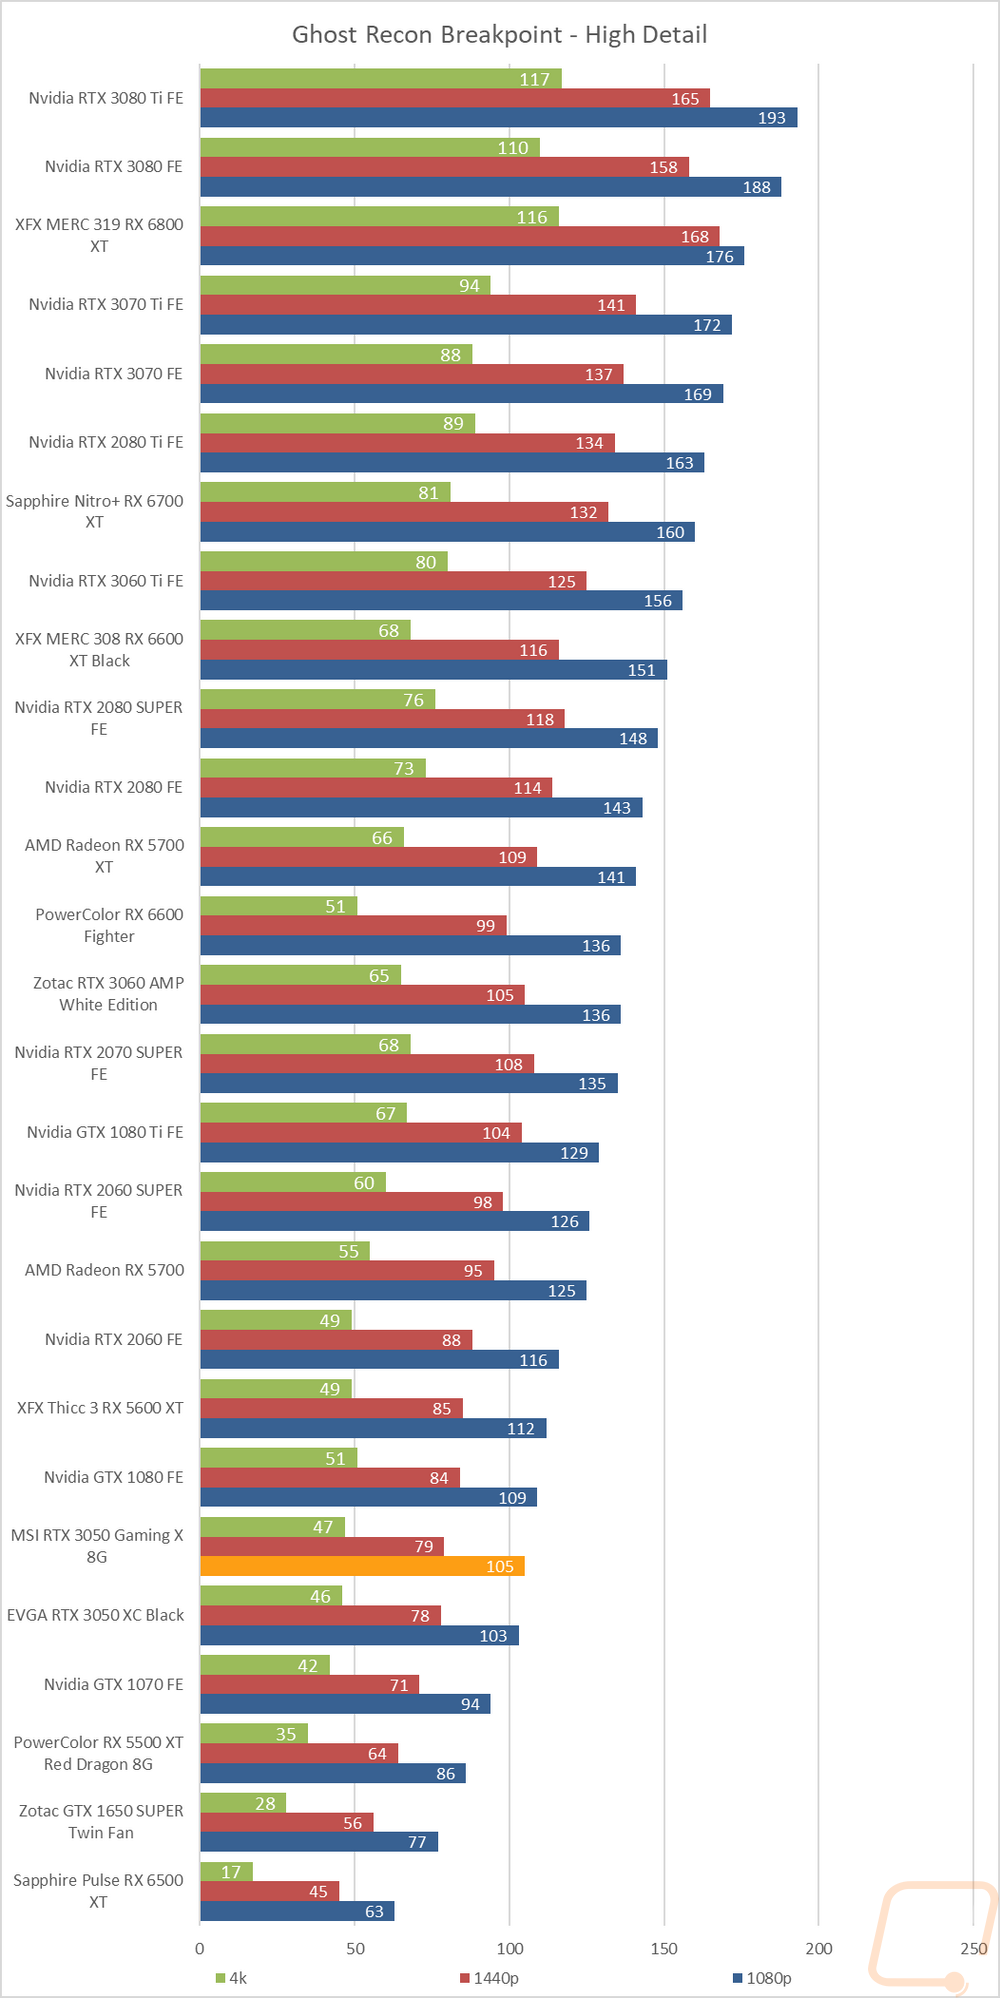
Built-in benchmark, tested at 1080p, 1440p, and 4k with the Ultra and Medium detail settings |
|
Boundary Benchmark |
Testing different DLSS detail levels on cards that support it. All testing is done at 4k with RTX on |
|
Bright Memory Infinite RTX Benchmark |
Benchmark all of the different RTX detail levels. Resolution at 4k and DLSS on balanced for each test |
|
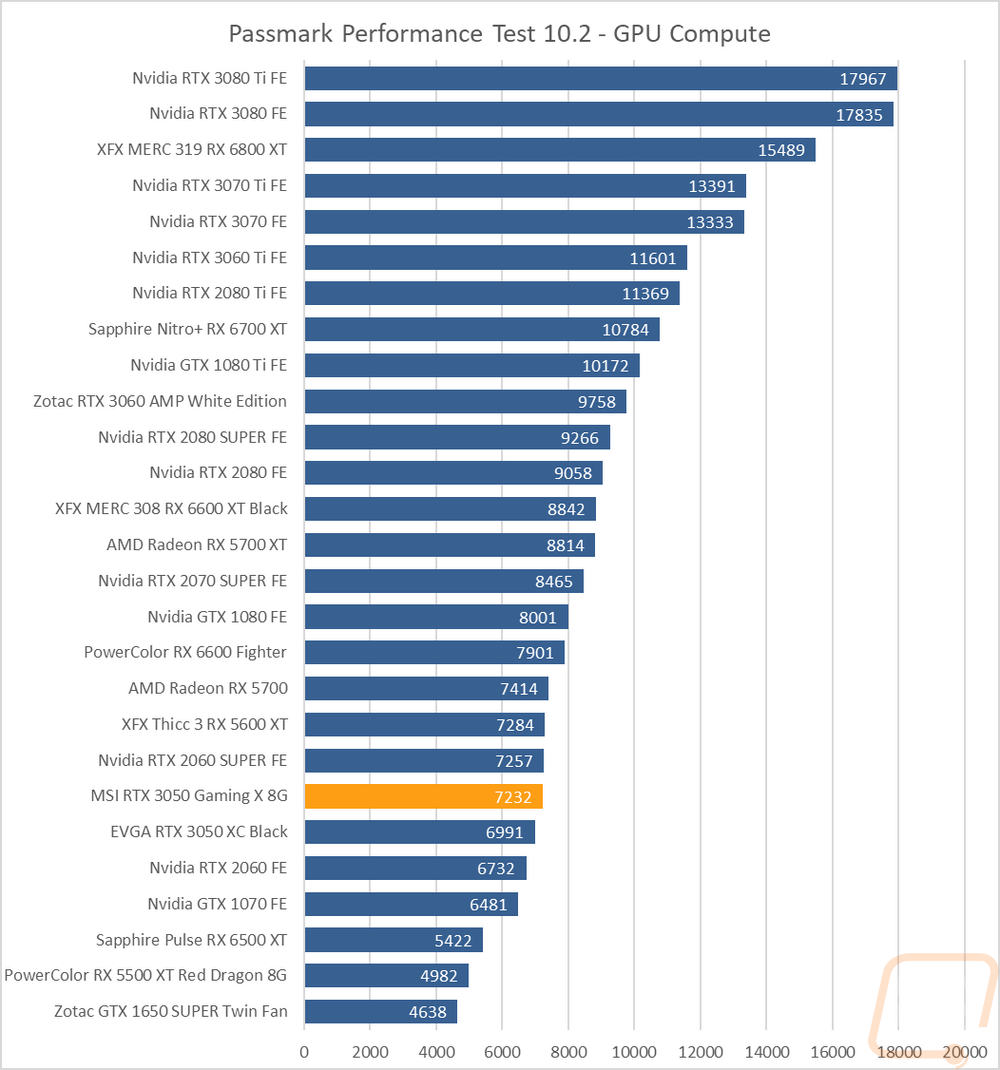
Passmark Performance Test 10.2 |
Test using the GPU Compute Score inside of Passmark’s Performance Test 10.2 |
|
Blender |
Using the new Blender Benchmark with the Quick Benchmark setting set to use the GPU, not the CPU. Nvidia cards are tested twice, once with CUDA and the other with Optix, and AMD cards are run on OpenGL. The result is in total seconds the test took, lower is better. The 2.93.1 build is used and I run all six tests, BMW27, Koro, Classroom, Pavillon, Fishy cat (my favorite), and Victor |
|
OctaneBench 2020.1 |
OctaneBench is designed to test rendering in OctaneRender. RTX and non-RTX are both run. This is a CUDA only test so only Nvidia cards are tested |
|
Power Testing |
I run three power tests. Two I use a Kill-A-Watt hooked up in line with the power cord for the test rig. Two tests are done, one using the AIDA64 Stress Test and the second uses the 3DMark Time Spy benchmark on the second test. I also use GPUz to document the GPU only reading off the card itself for wattage when doing the Time Spy test. The Time Spy test uses only the second test here because the3rd test is the combined test that loads the CPU as well. |
|
Noise Testing |
Our Noise testing is done using a decibel meter 18 inches away from the video card on the bottom/fan side of the card. We test at 50% and 100% fan speeds as well as a third test while under load using AIDA64's stress test. This is done using a Protmex PT02 Sound Meter that is rated IEC651 type 2 and ANSI S1.4 type 2. Tests are done set weighted to A and set to a slow response using the max function and tested a second time with C weighting as well. The ambient noise level in the testing area is 33.3 decibels using A weight and 50.0 using C weight. |
|
Temperature Testing |
Using AIDA64, the GPU stress test is run for 30 minutes or until the result has leveled off. The test is run twice, once with the stock fan profile and a second time with 100% fan speed. During this, I also document the 100% fan speed RPM and document the delta between the fan profile and 100% fan speed as well. |
Synthetic Benchmarks
As always I like to start my testing with a few synthetic benchmarks. 3DMark especially is one of my favorites because it is very optimized in both Nvidia and AMD drivers. It's nice to not have to worry about it being favored too much either way and the repeatability of the results makes it a nice chance to compare from card to card, especially when comparing with the same GPU. In this case, I’ve already taken a look at the EVGA RTX 3050 XC Black which was a stock clicked 3050so it will be interesting to see how the extra clock speed helps the 3050 Gaming X. I also want to keep an eye out on the 6500 XT performance in comparison now that we have that coverage up and of course the 5500 XT and the GTX 1070.
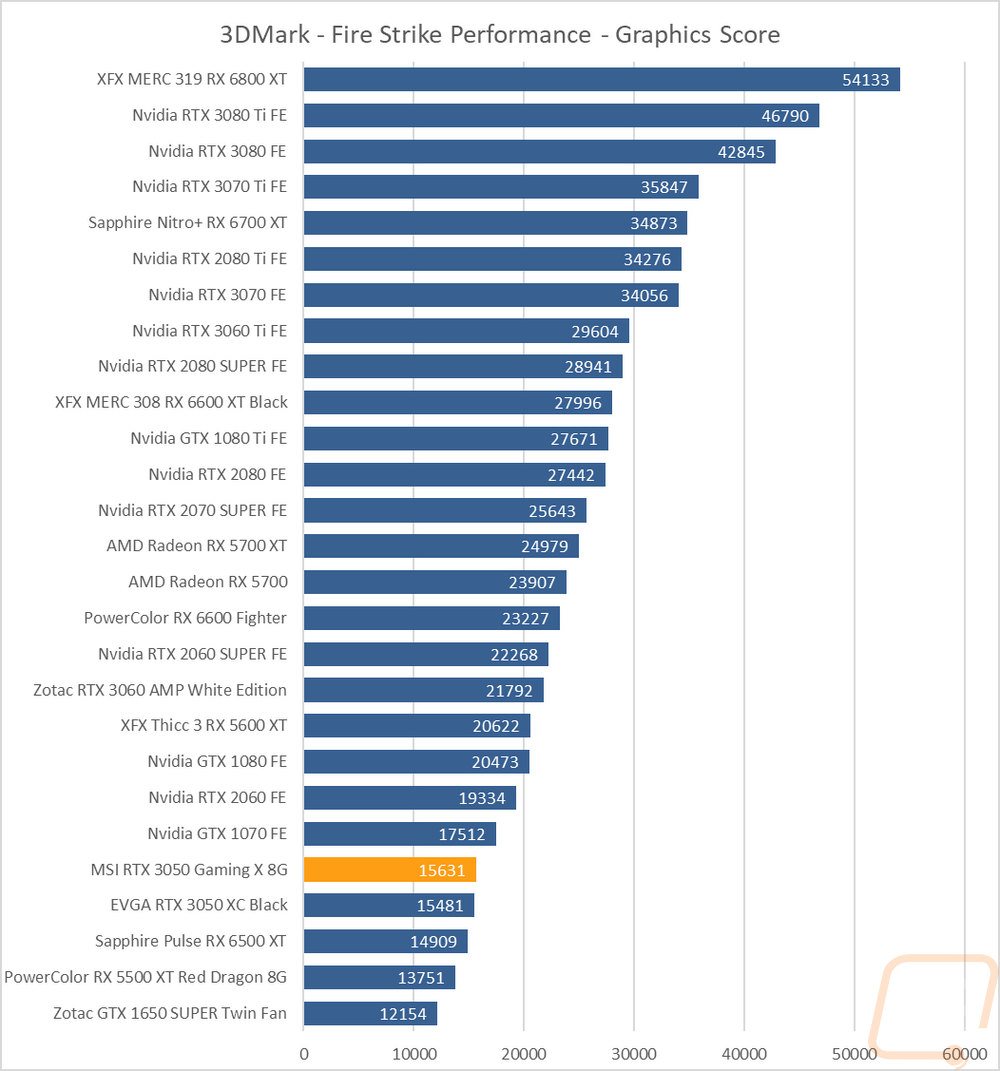
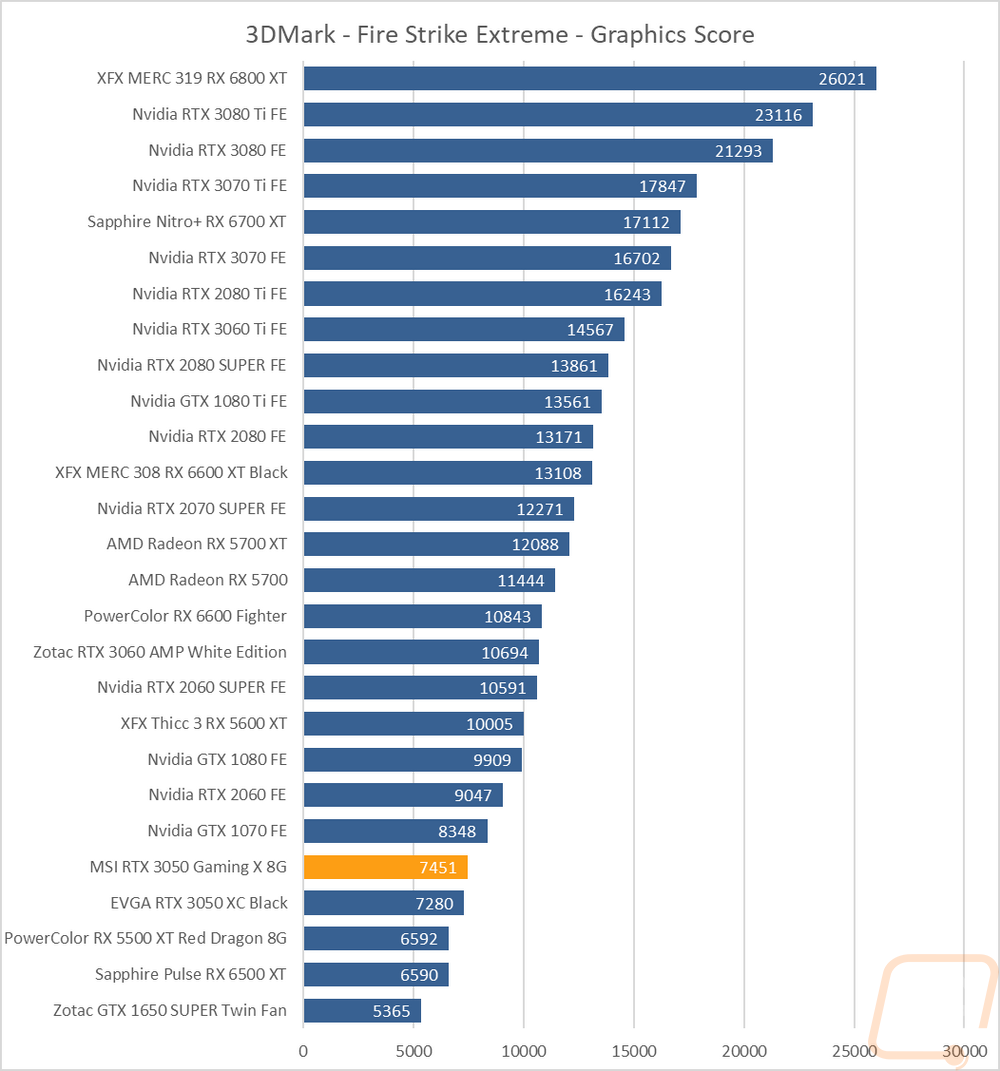
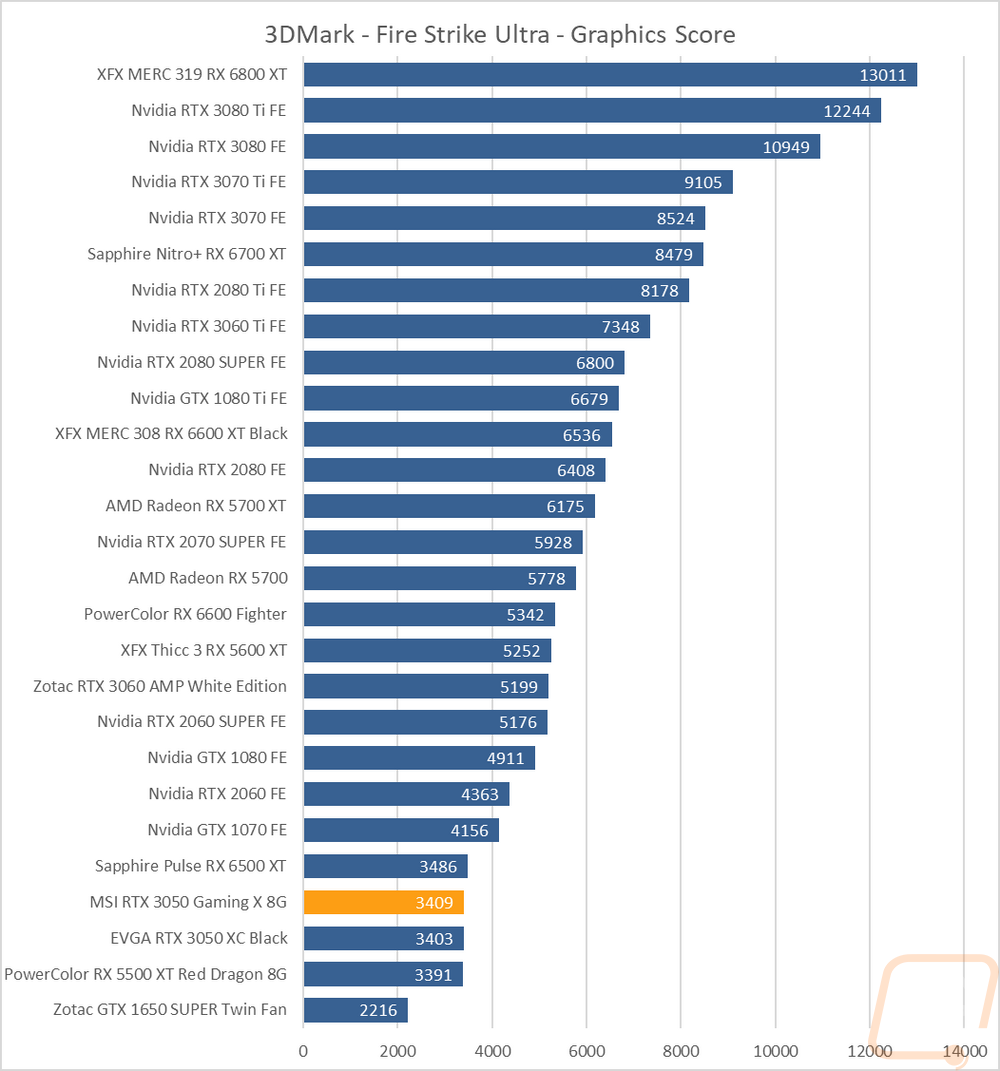
The first round of tests were done in the older Fire Strike benchmark which is a DX11 test. There are three detail levels, performance, extreme, and ultra. The 3050 Gaming X is still close to the stock clocked 3050, but on all three tests it does come in higher in each test but not enough of a difference to put it up in the range of the 1070.
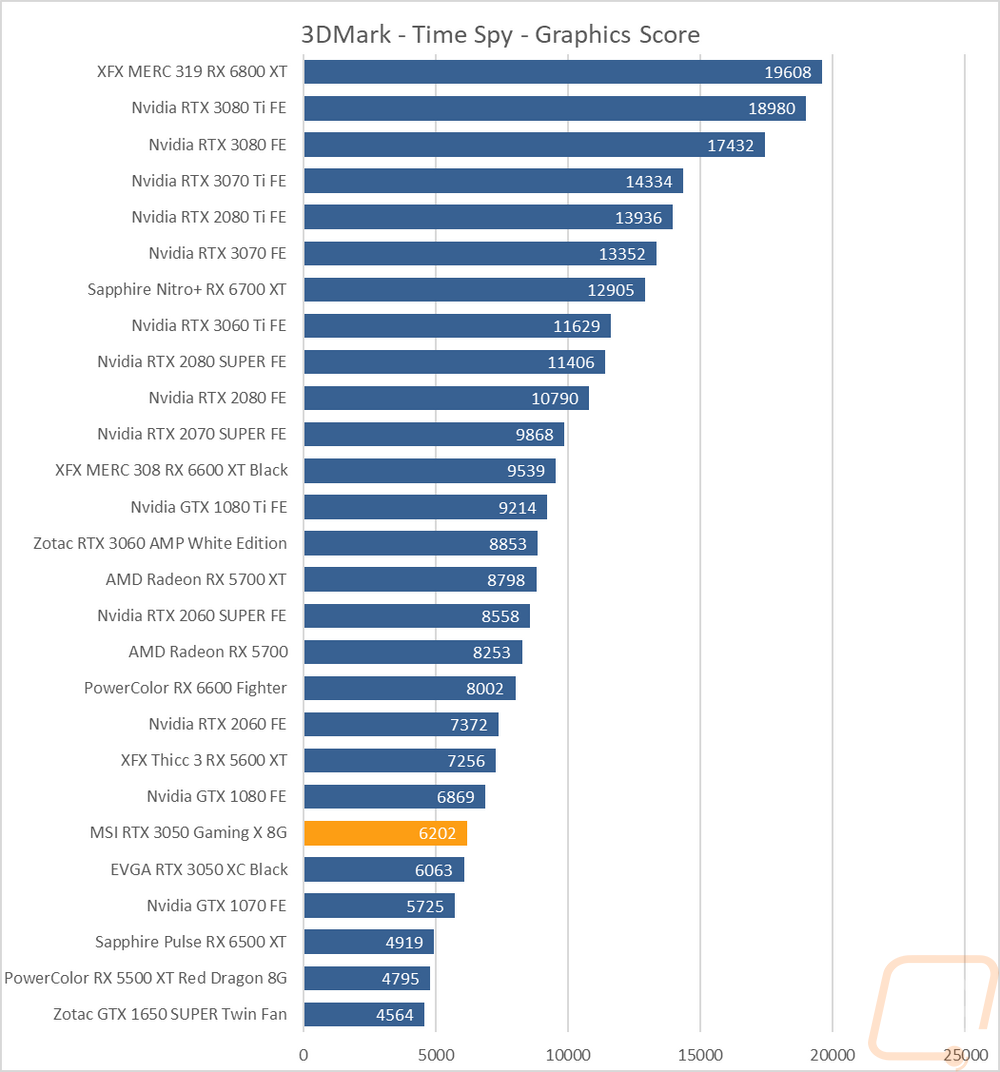
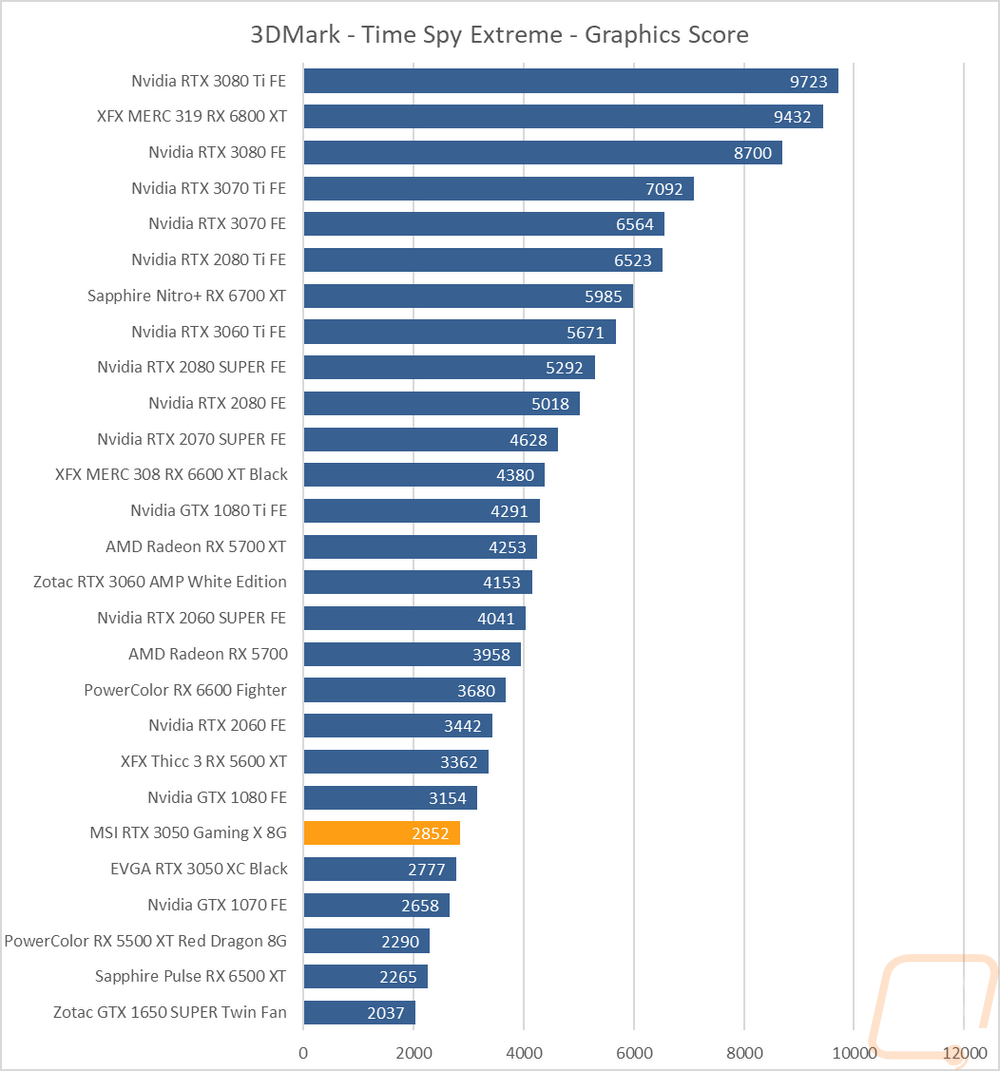
The next two were both based on the Time Spy benchmark. One is the standard test and then there is the extreme detail level. Here the RTX 3050’s jump up in performance, the RTX cards as a whole do better with the DX12 based time spy. The 3050 Gaming X itself gained 139 points on the stock clocked card on the base Time Spy. Then on the Time Spy extreme test, it came out ahead of the stock 3050 by 75 points.
The last test was using the Unigine based Superposition benchmark and I tested at 1080p with the extreme detail setting as well as the 4K optimized setting. In the extreme detail setting the 3050 Gaming X didn’t gain much on the stock card being two points higher. This did still keep it out ahead of the GTX 1070. The 4k result saw a bigger improvement with the overclock going from 4846 to 4970 but it was still way behind the GTX 1070 at that resolution.
VR Benchmarks
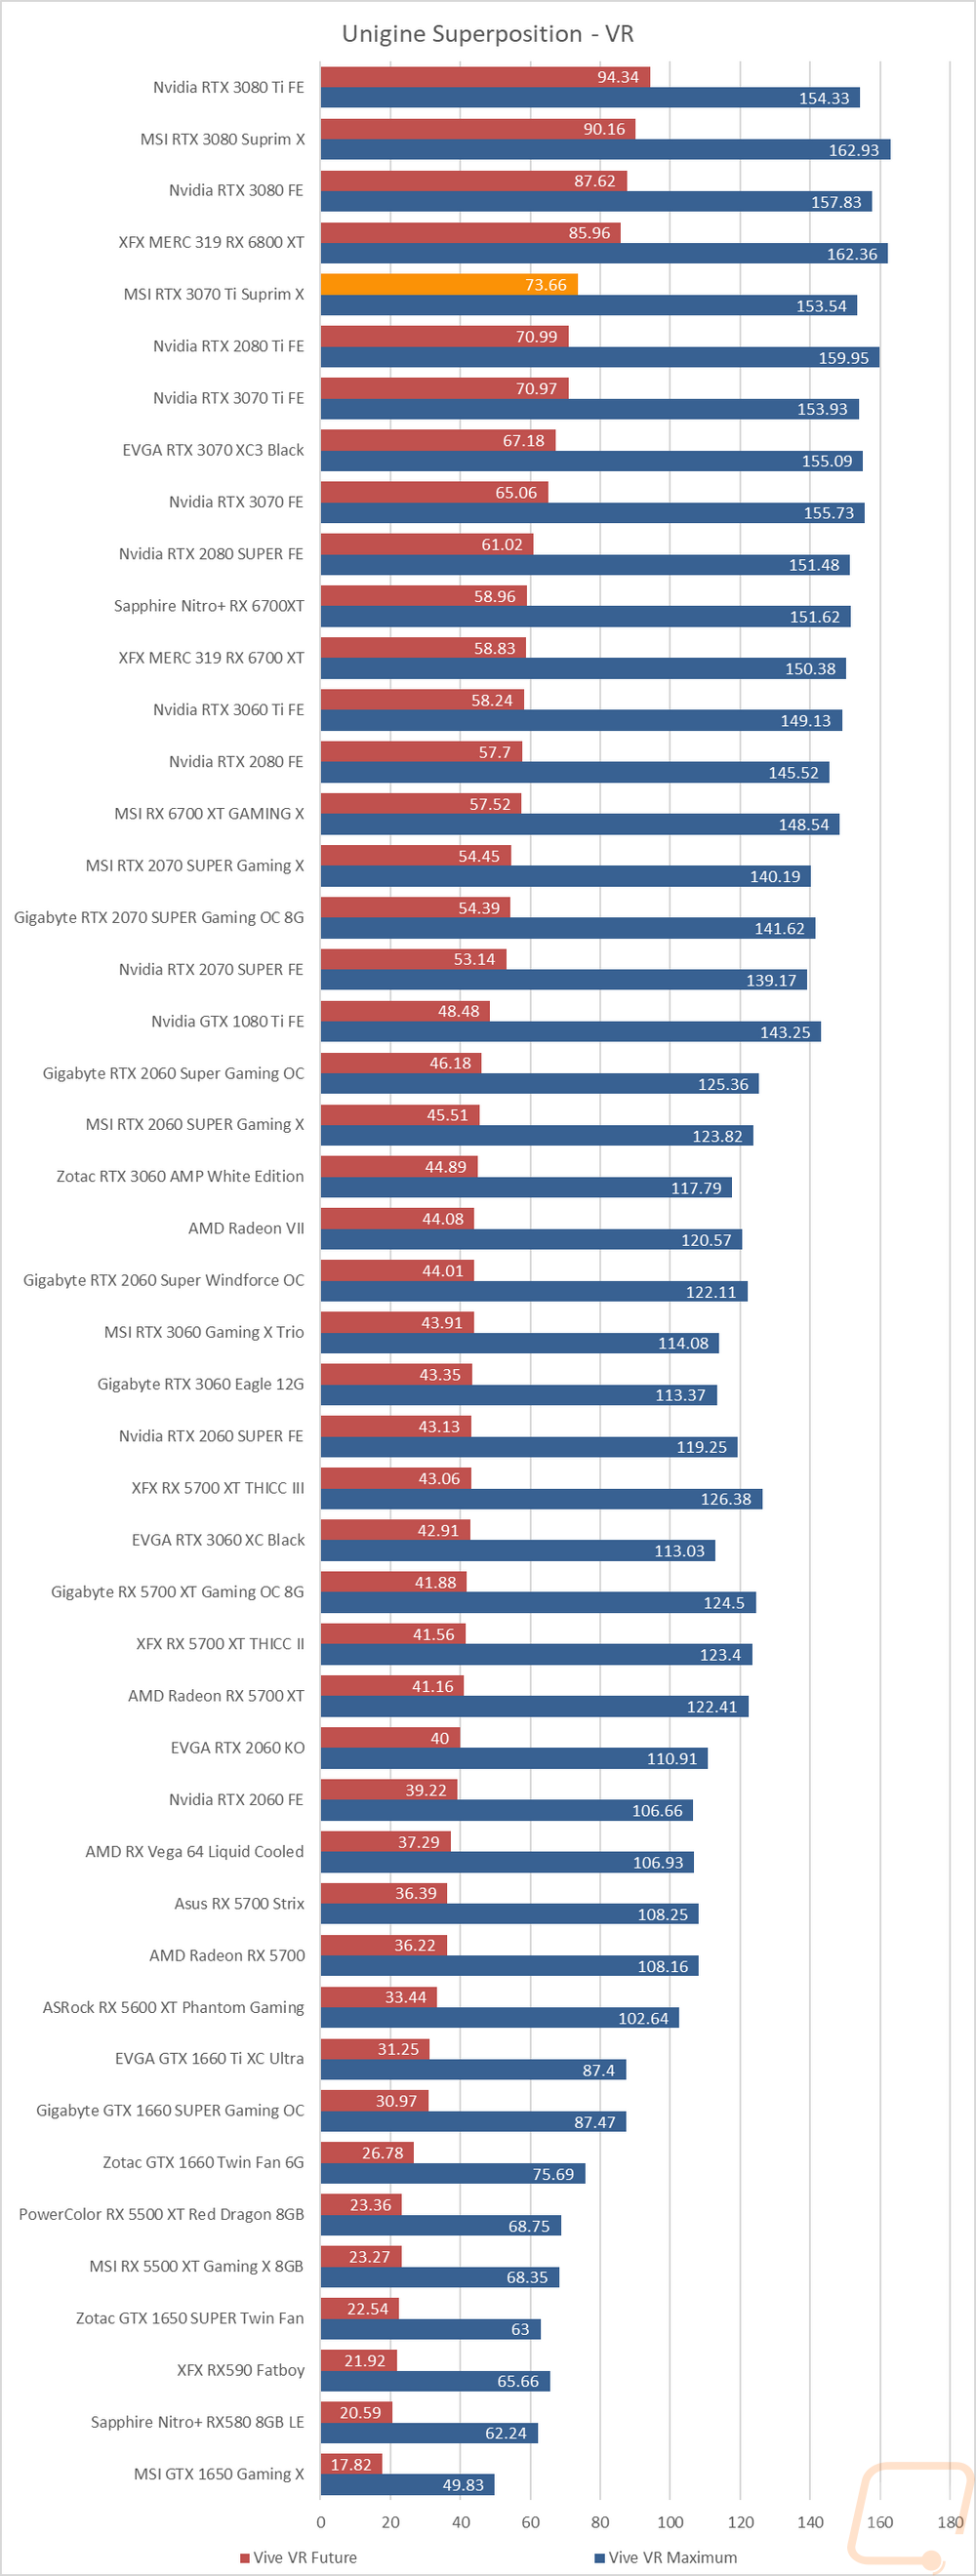
As for Virtual Reality, I love it but it is more demanding than traditional gaming. This is partially because of the resolutions needed to render for two eyes and because they render more than what is immediately visible. But also because of post effects to get the proper “fisheye” effect for it to look proper in your eyes with the HMD. You also have to have much higher expectations for frame rates in VR, skipping frames or lower FPS can cause motion sickness in VR. Because of that, I ran a few tests.
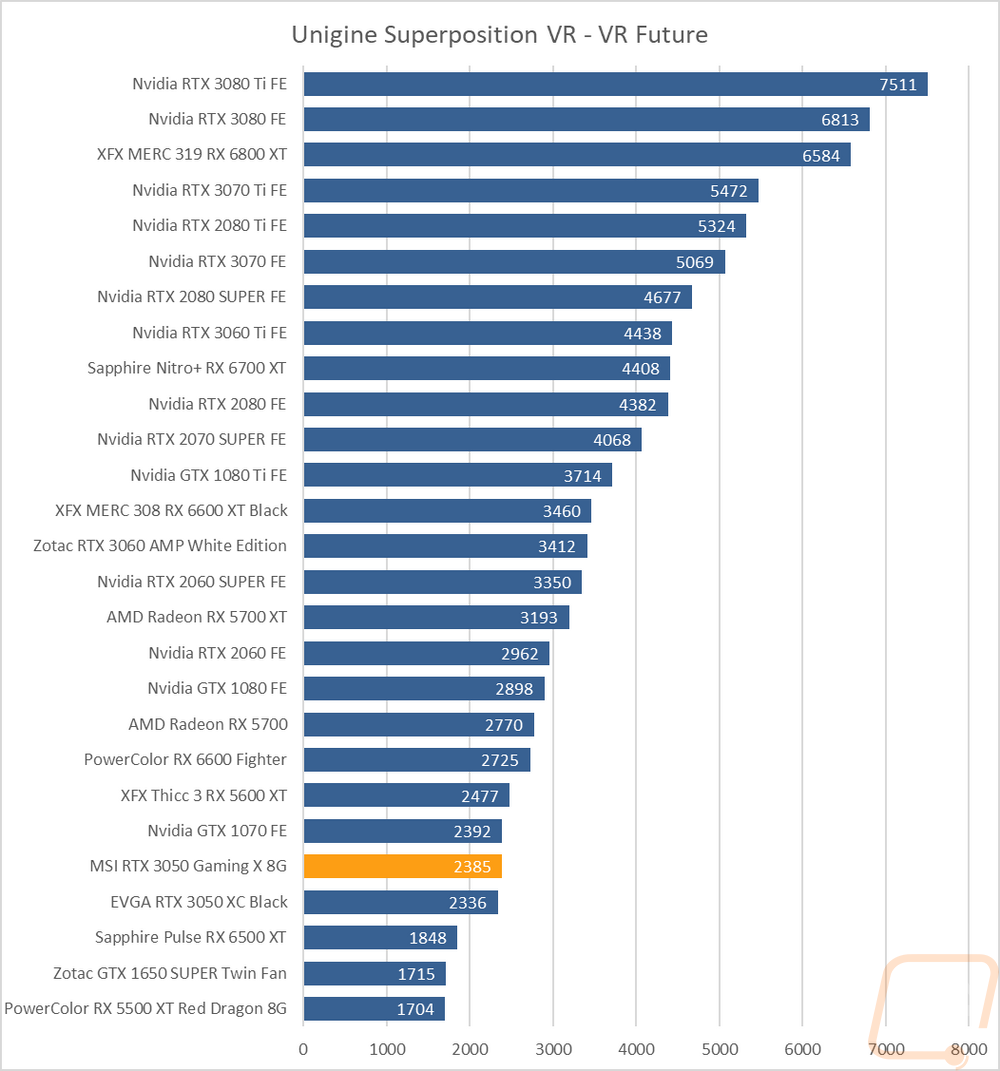
My first test was again in Superposition. This time I tested the VR Future test using the Oculus resolution. Here the 3050 Gaming X gained 49 points on the stock RTX 3050.
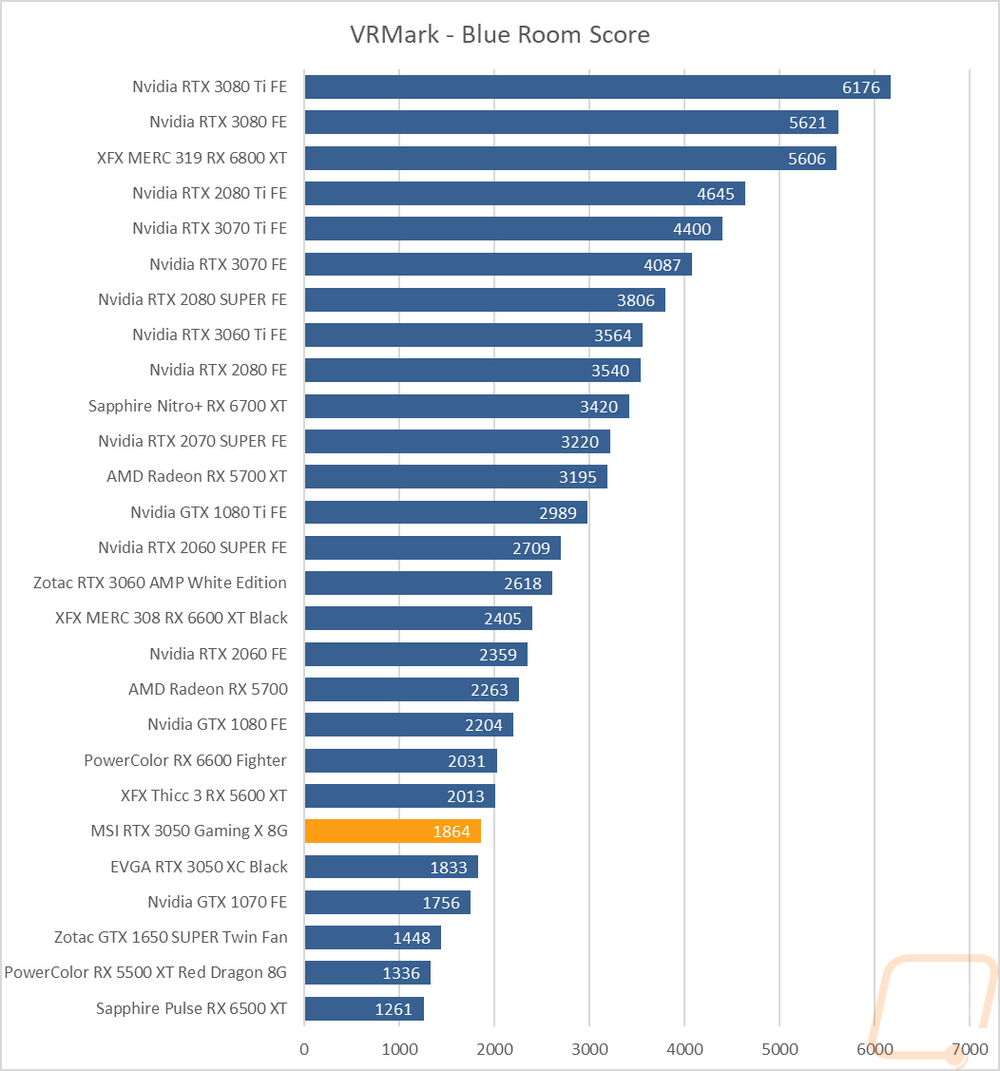
My second round of VR testing was in VRMark which has three tests that are similar to the VR tests in Superposition. I only focused on just the most demanding test called Blue Room that is looking more at future VR performance. The 3050 Gaming X gained 11 points, still keeping the 3050 Gaming X only just barely ahead of the stock RTX 3050.
In-Game Benchmarks
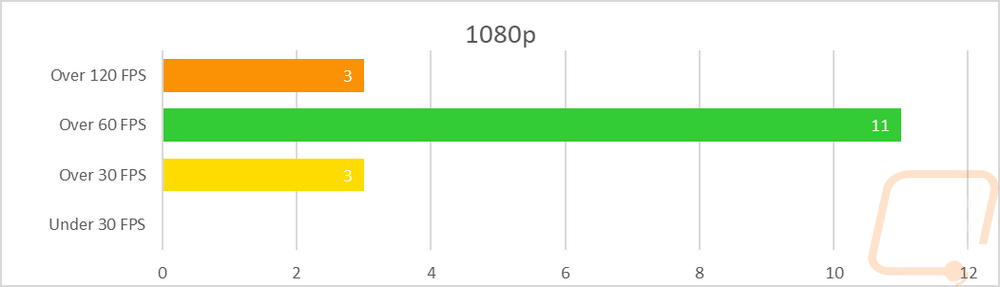
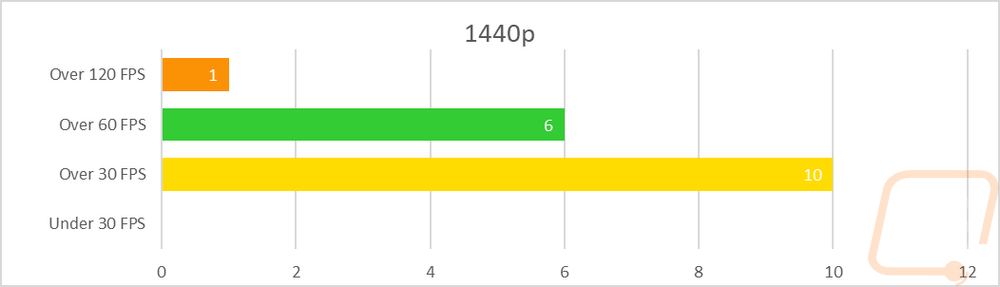
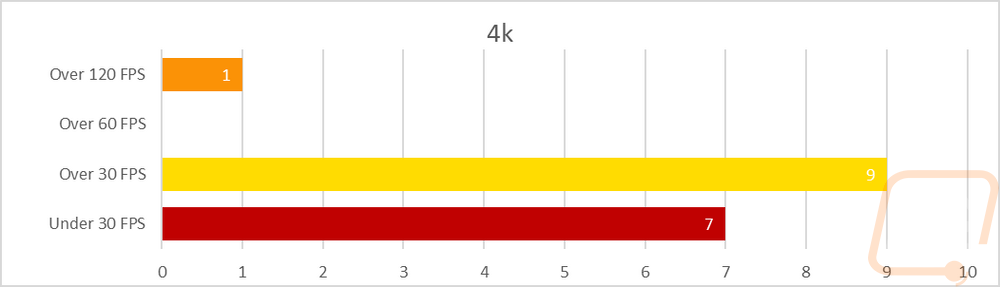
Now we finally get into the in game performance and that is the main reason people pick up a new video card. To test things out I ran through our new benchmark suite that tests 10 games at three different resolutions (1080p, 1440p, and 4k). Most of the games tested have been run at the highest detail setting and a mid-range detail setting to get a look at how turning things up hurts performance and to give an idea of if turning detail down from max will be beneficial for frame rates. In total, each video card is tested 54 times and that makes for a huge mess of results when you put them all together. To help with that I like to start with these overall playability graphs that take all of the results and give an easier-to-read result. I have one for each of the three resolutions and each is broken up into four FPS ranges. Under 30 FPS is considered unplayable, over 30 is playable but not ideal, over 60 is the sweet spot, and then over 120 FPS is for high refresh rate monitors.
So how did the 3050 Gaming X do? Starting with the 1080p results which is where the RTX 3050 is designed, the 3050 Gaming X didn’t have any results in the sub 30 FPS range and like the stock clocked 3050 it had just 3 in the 30-59 FPS range. A majority of the results were once again over 60 FPS but the overclock on the 3050 Gaming X was able to bump one result from the 60-119 range up to 120+ FPS making for 3 over 120 in total. At 1440p the 3050 Gaming X also didn’t have any under 30 FPS which was an improvement over the stock 3050 which did have one in that range. Beyond that nothing else changed with a majority of the results in the playable but not smooth 30-59 FPS range. There were still 6 up over 60 FPS and CS:GO of course up over 120 FPS. Then at 4K, there weren’t any big surprises, the 3050 Gaming X fell off hard at that high of a resolution with 7 of the tests in the unplayable range and all but one of the rest were in that 30-59 range which isn’t really great but playable. CS:GO did what CS:GO does with it being the sole result still up over 120 FPS and zero between 60-119.Graph30
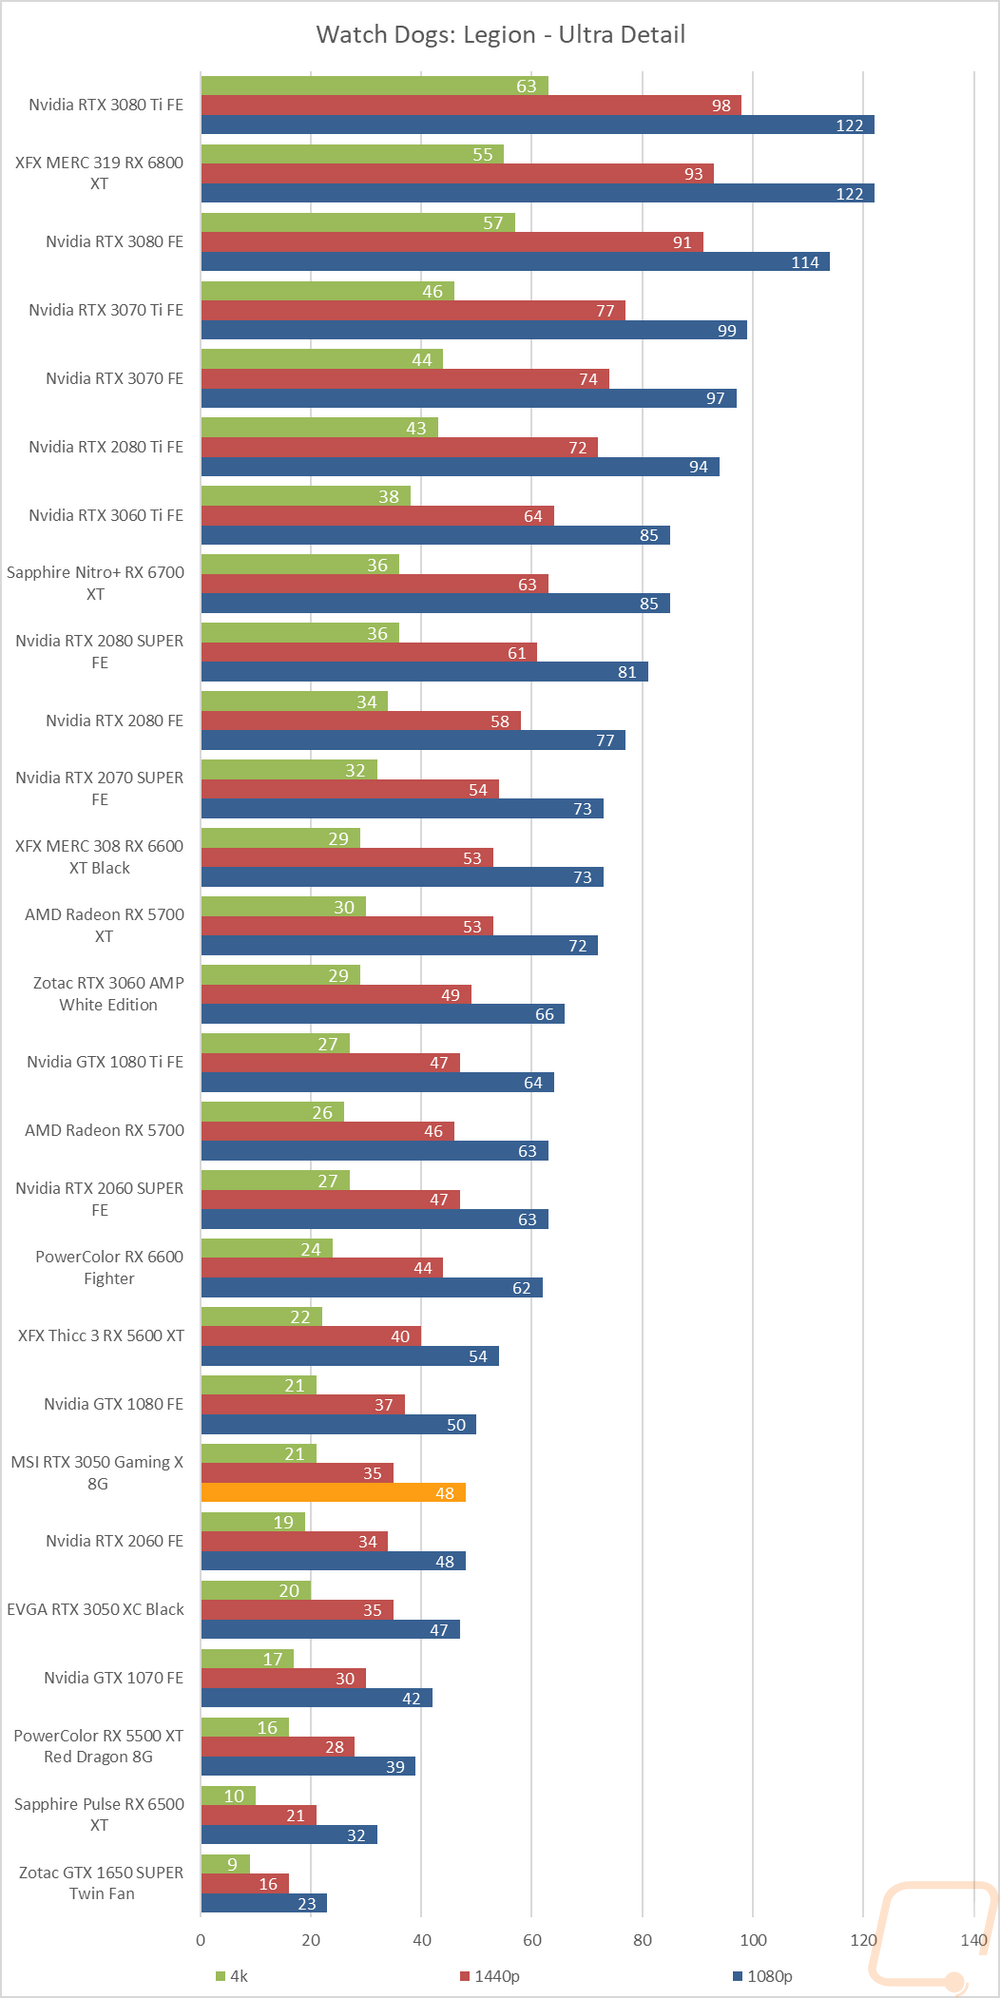
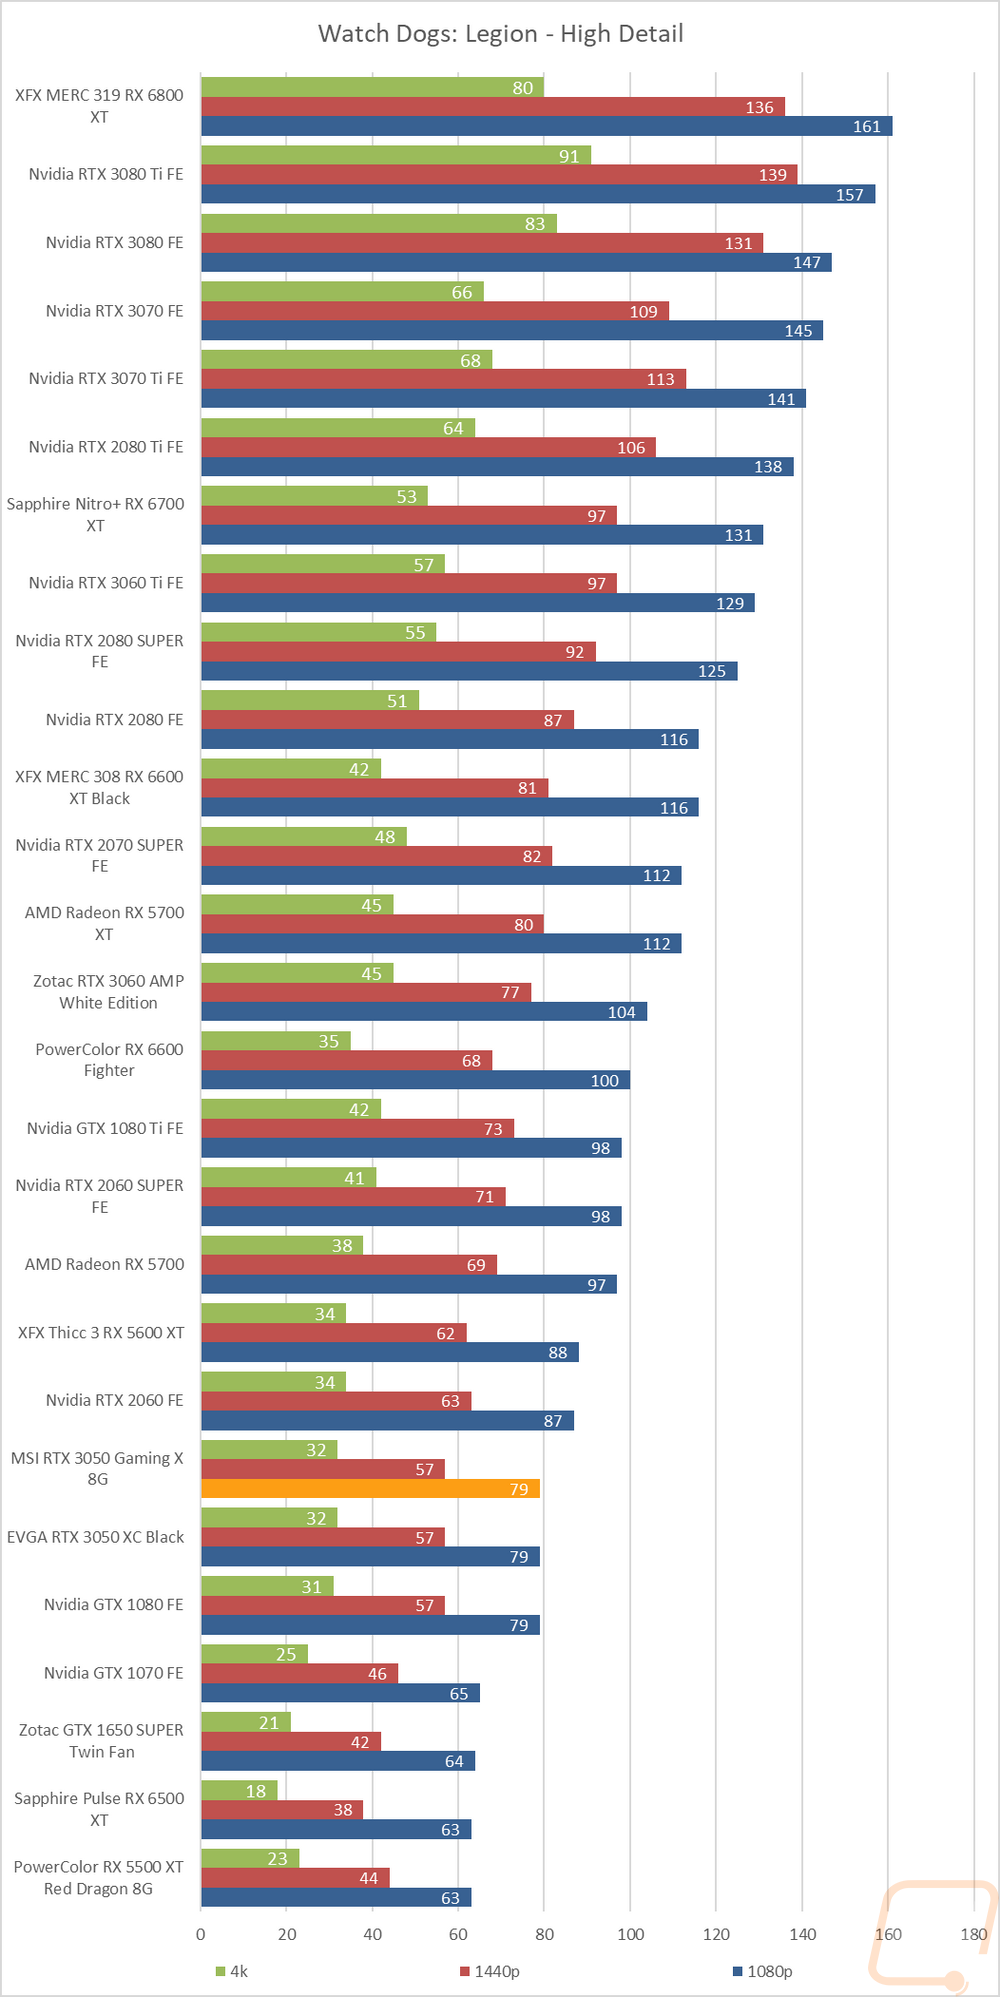
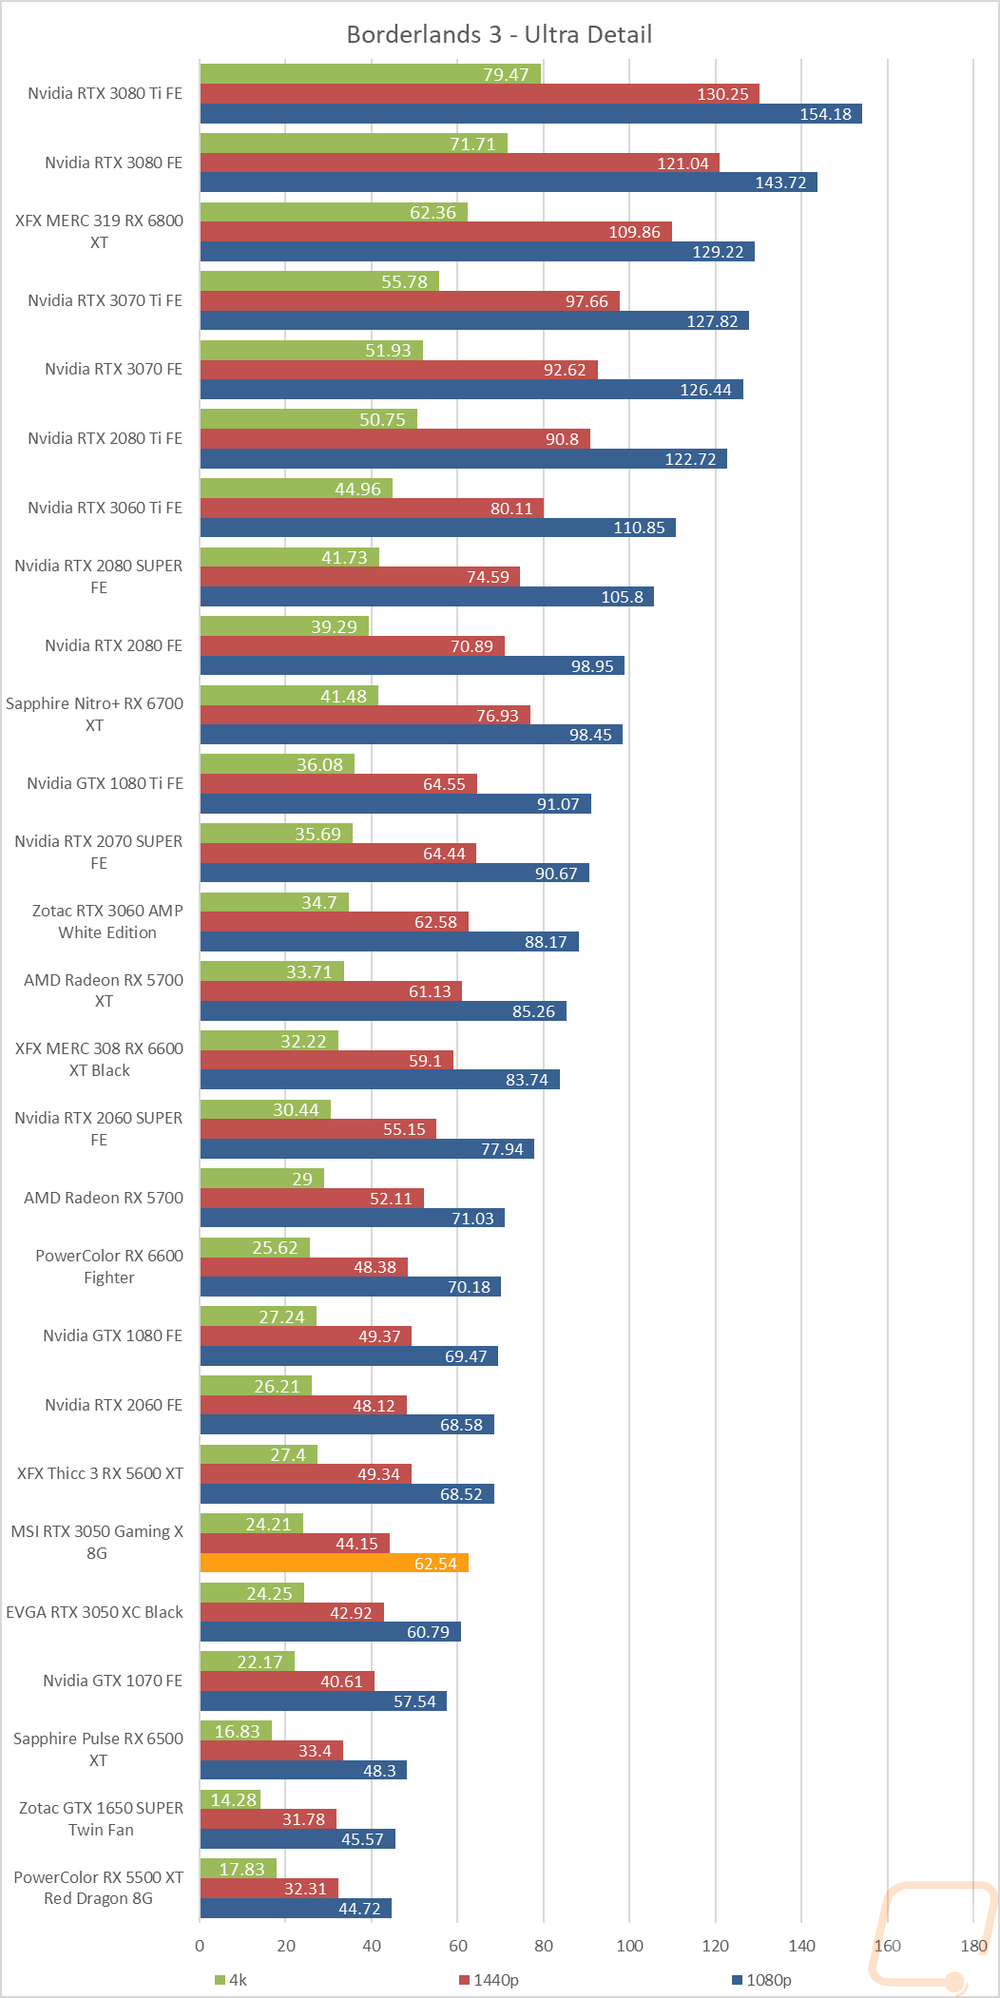
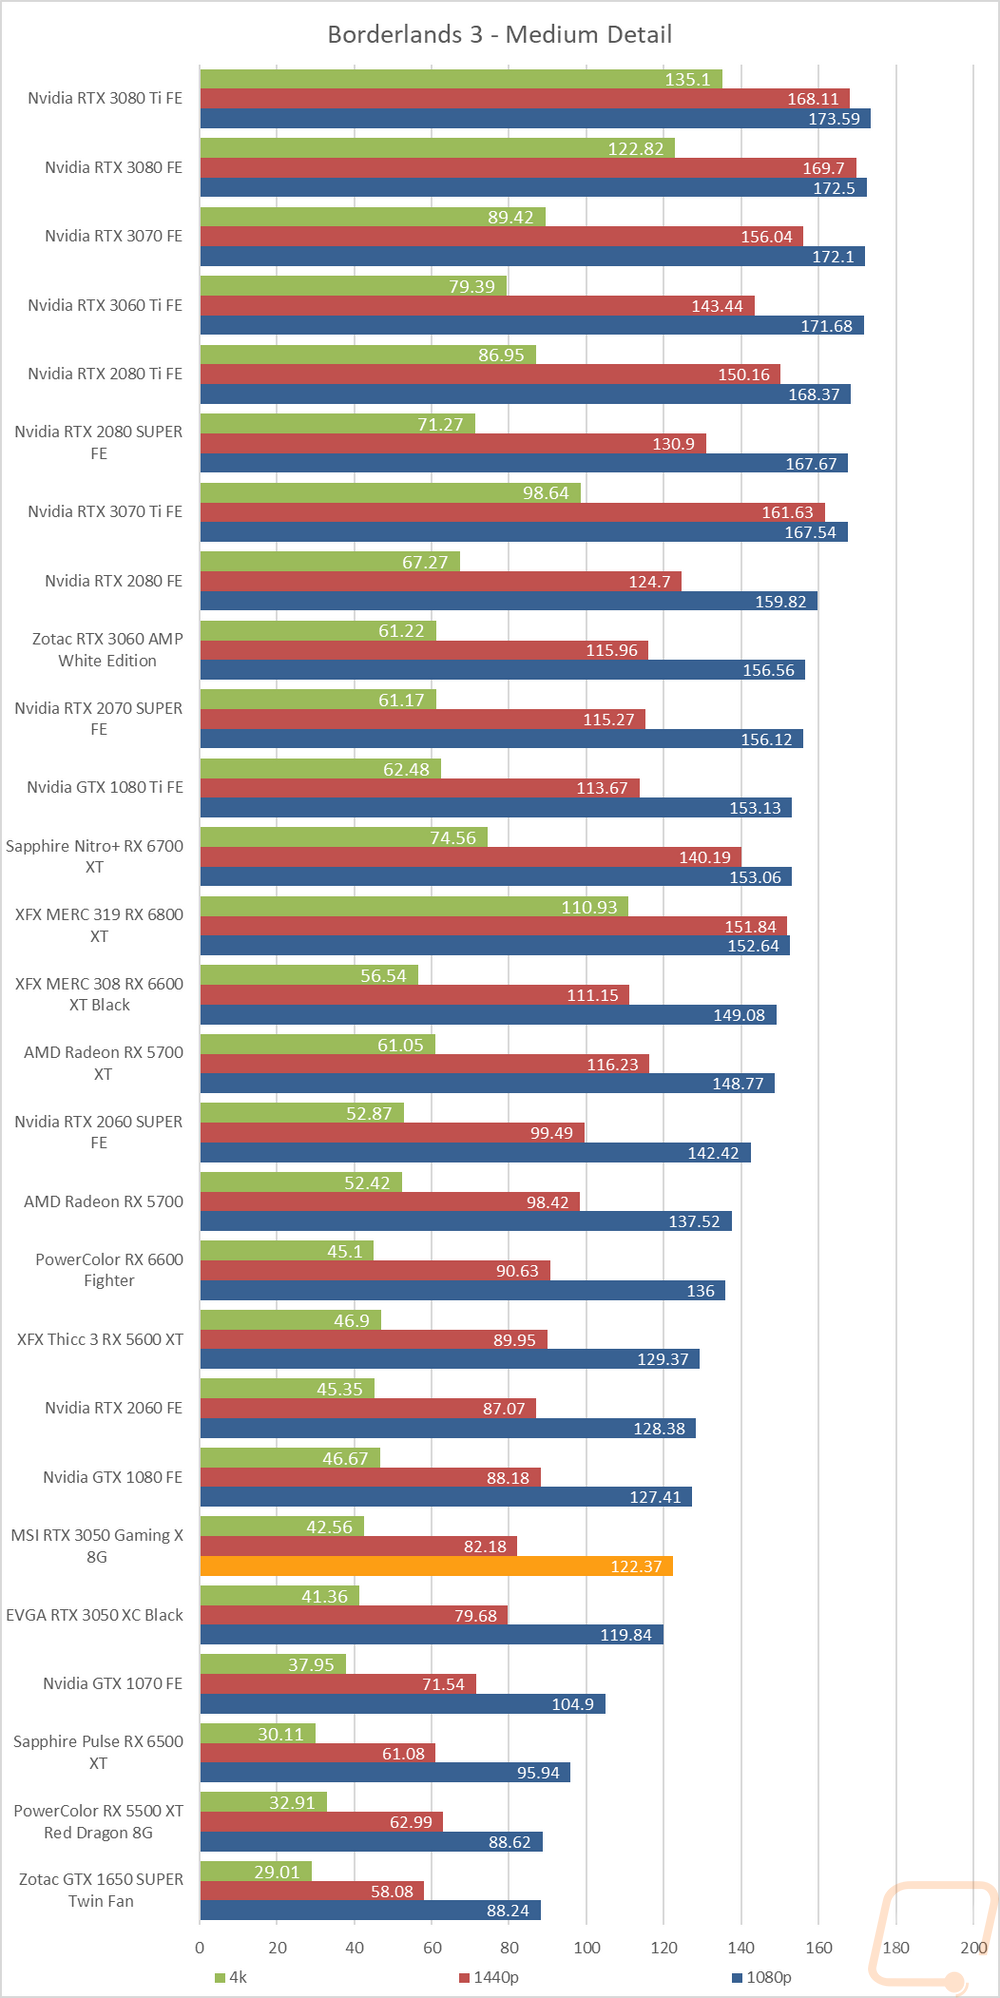
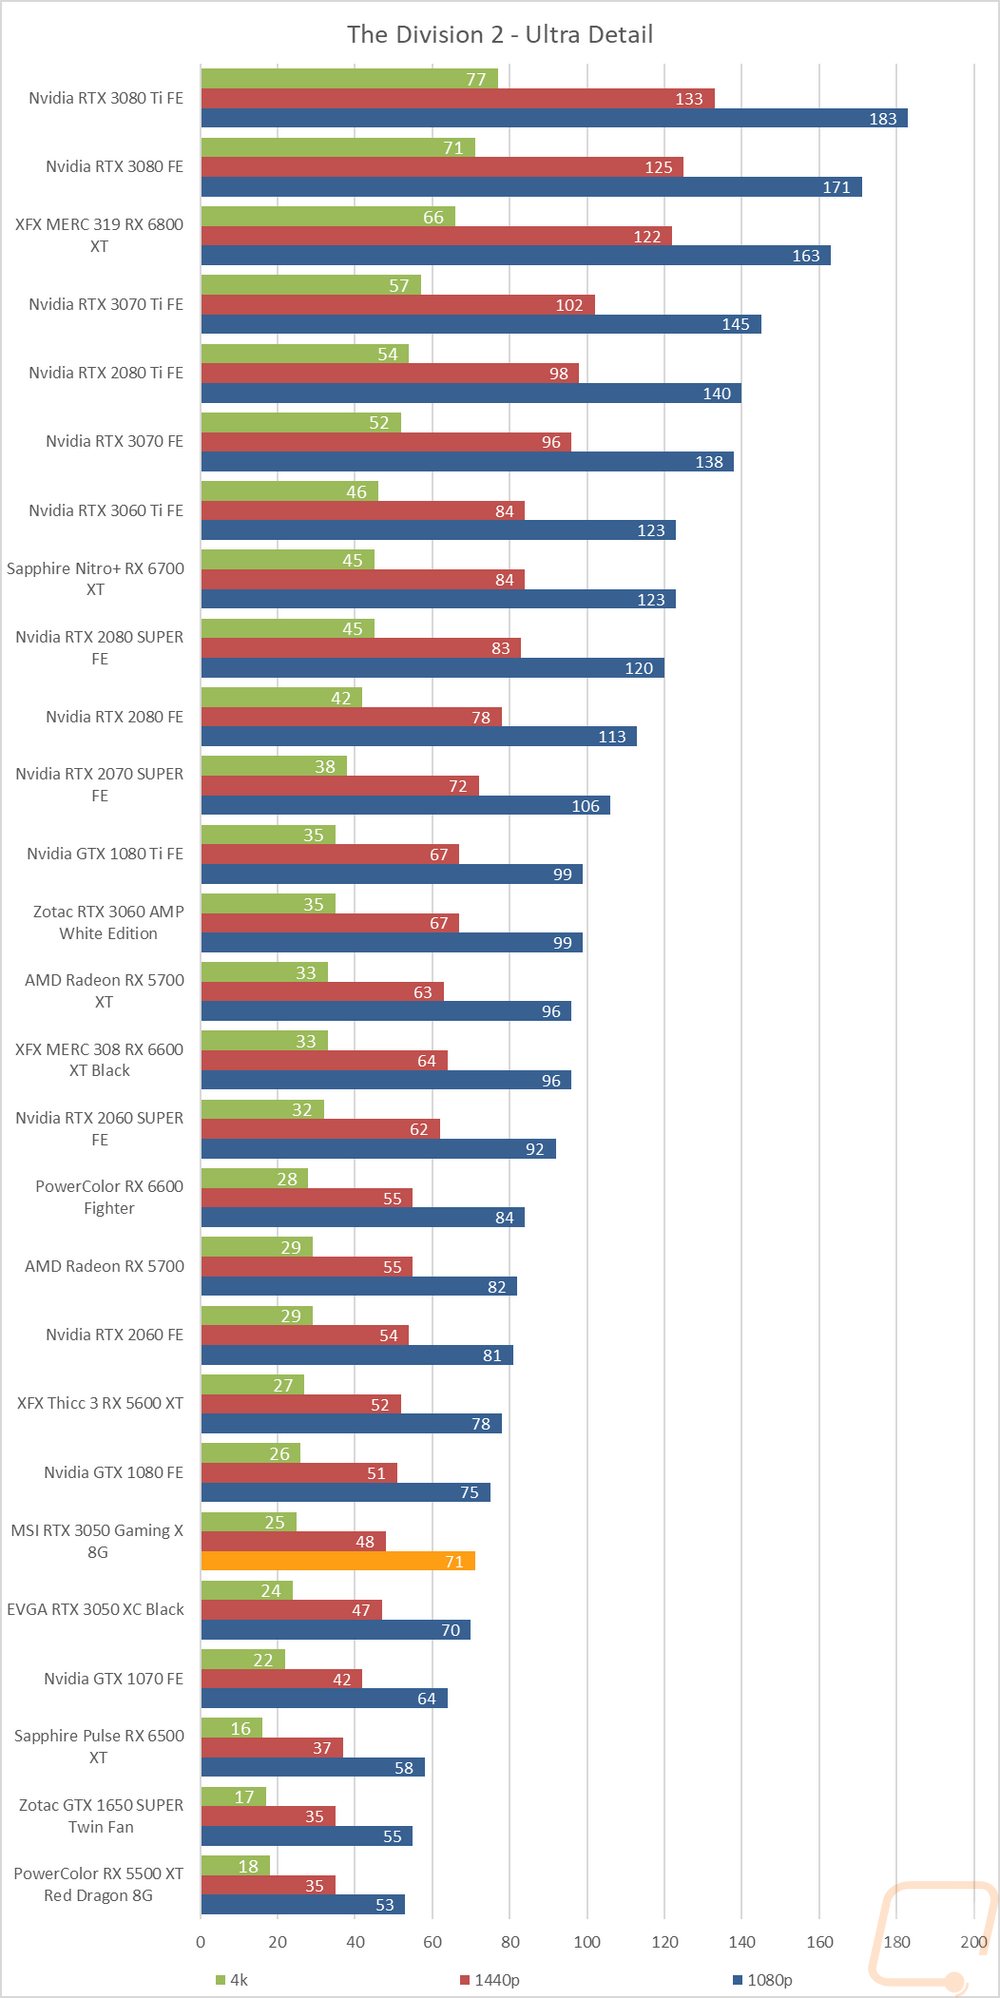
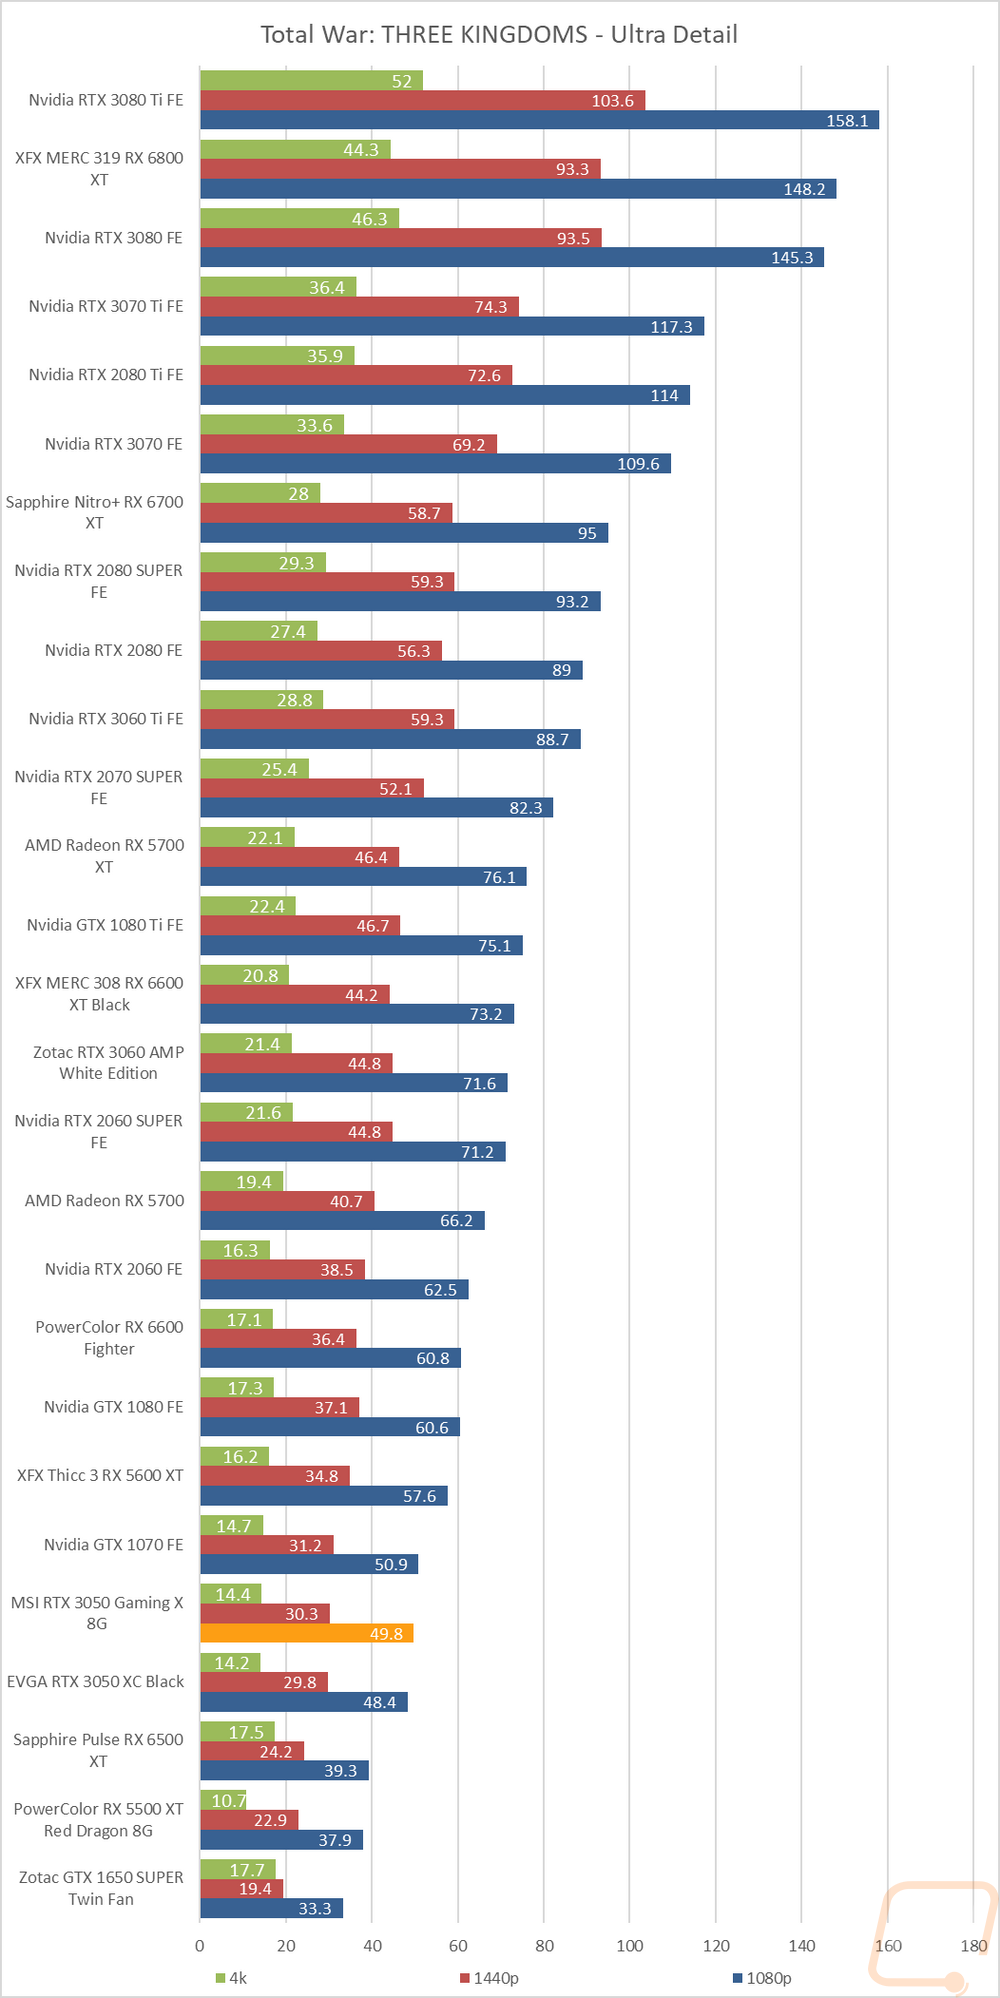
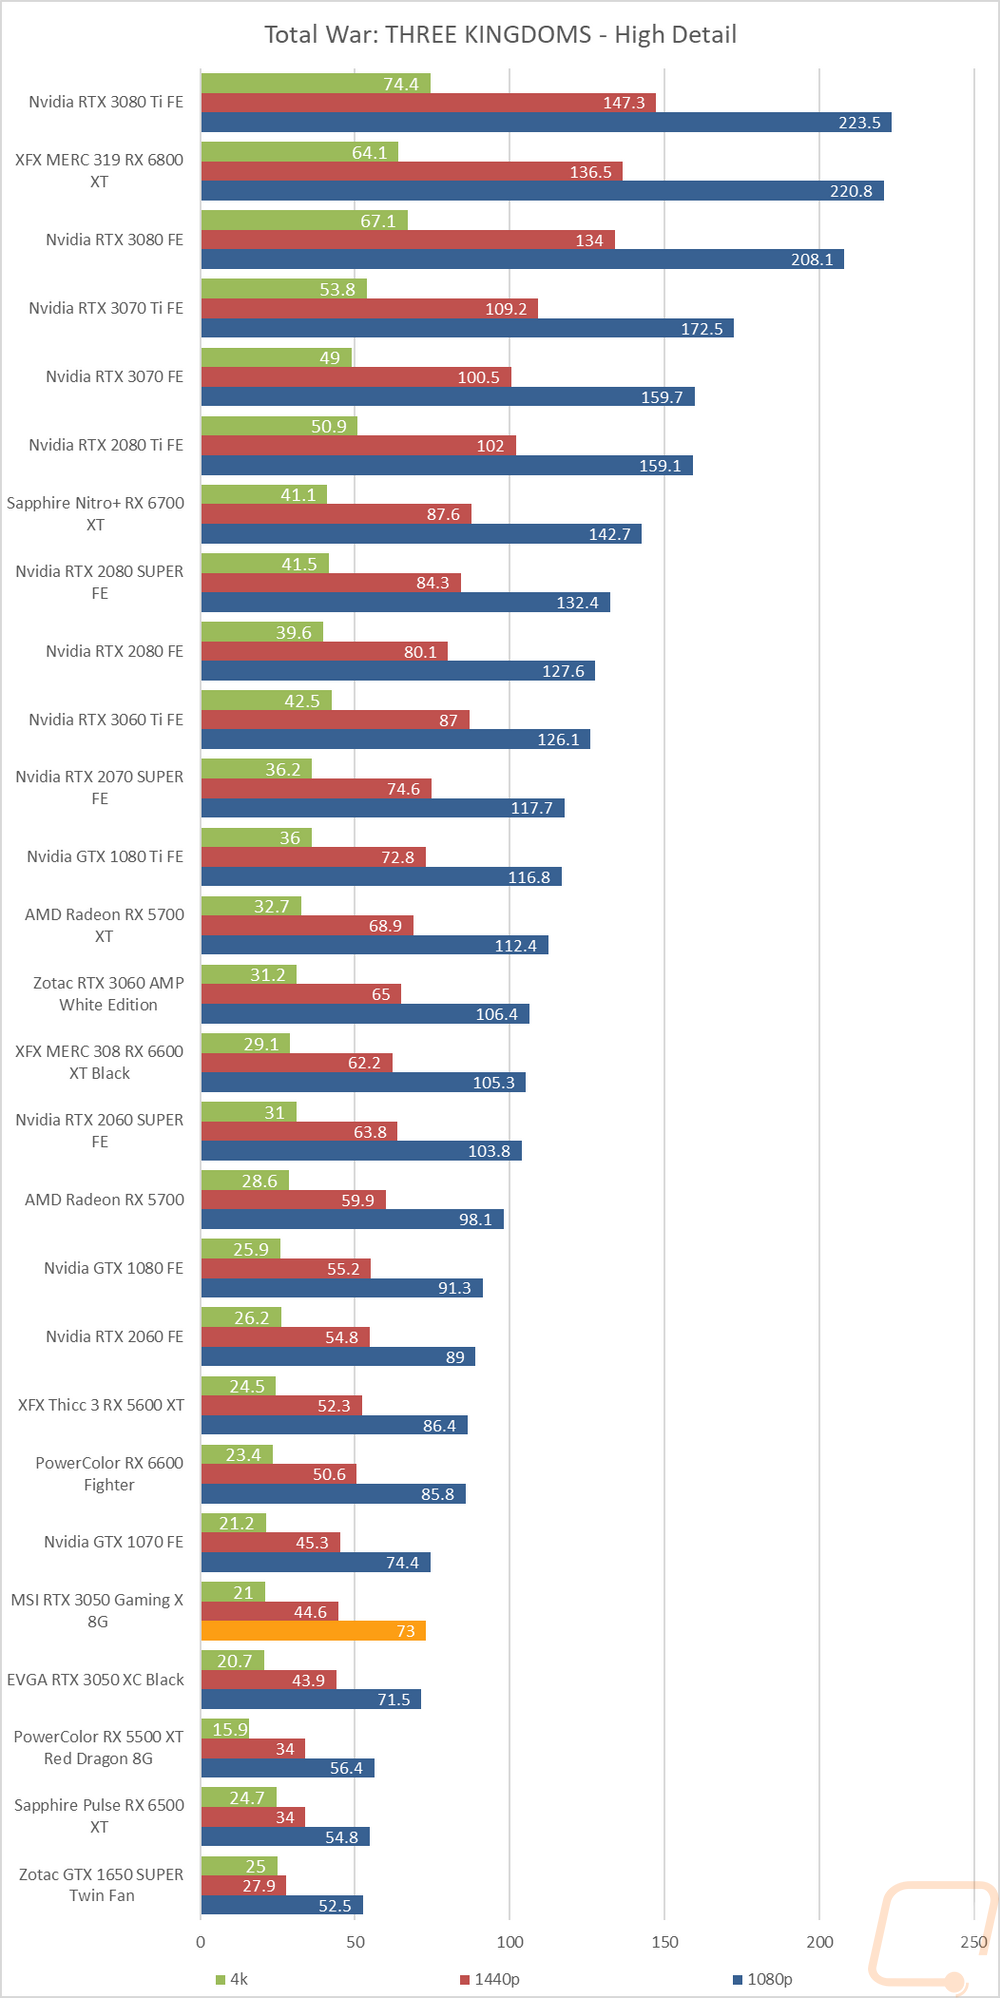
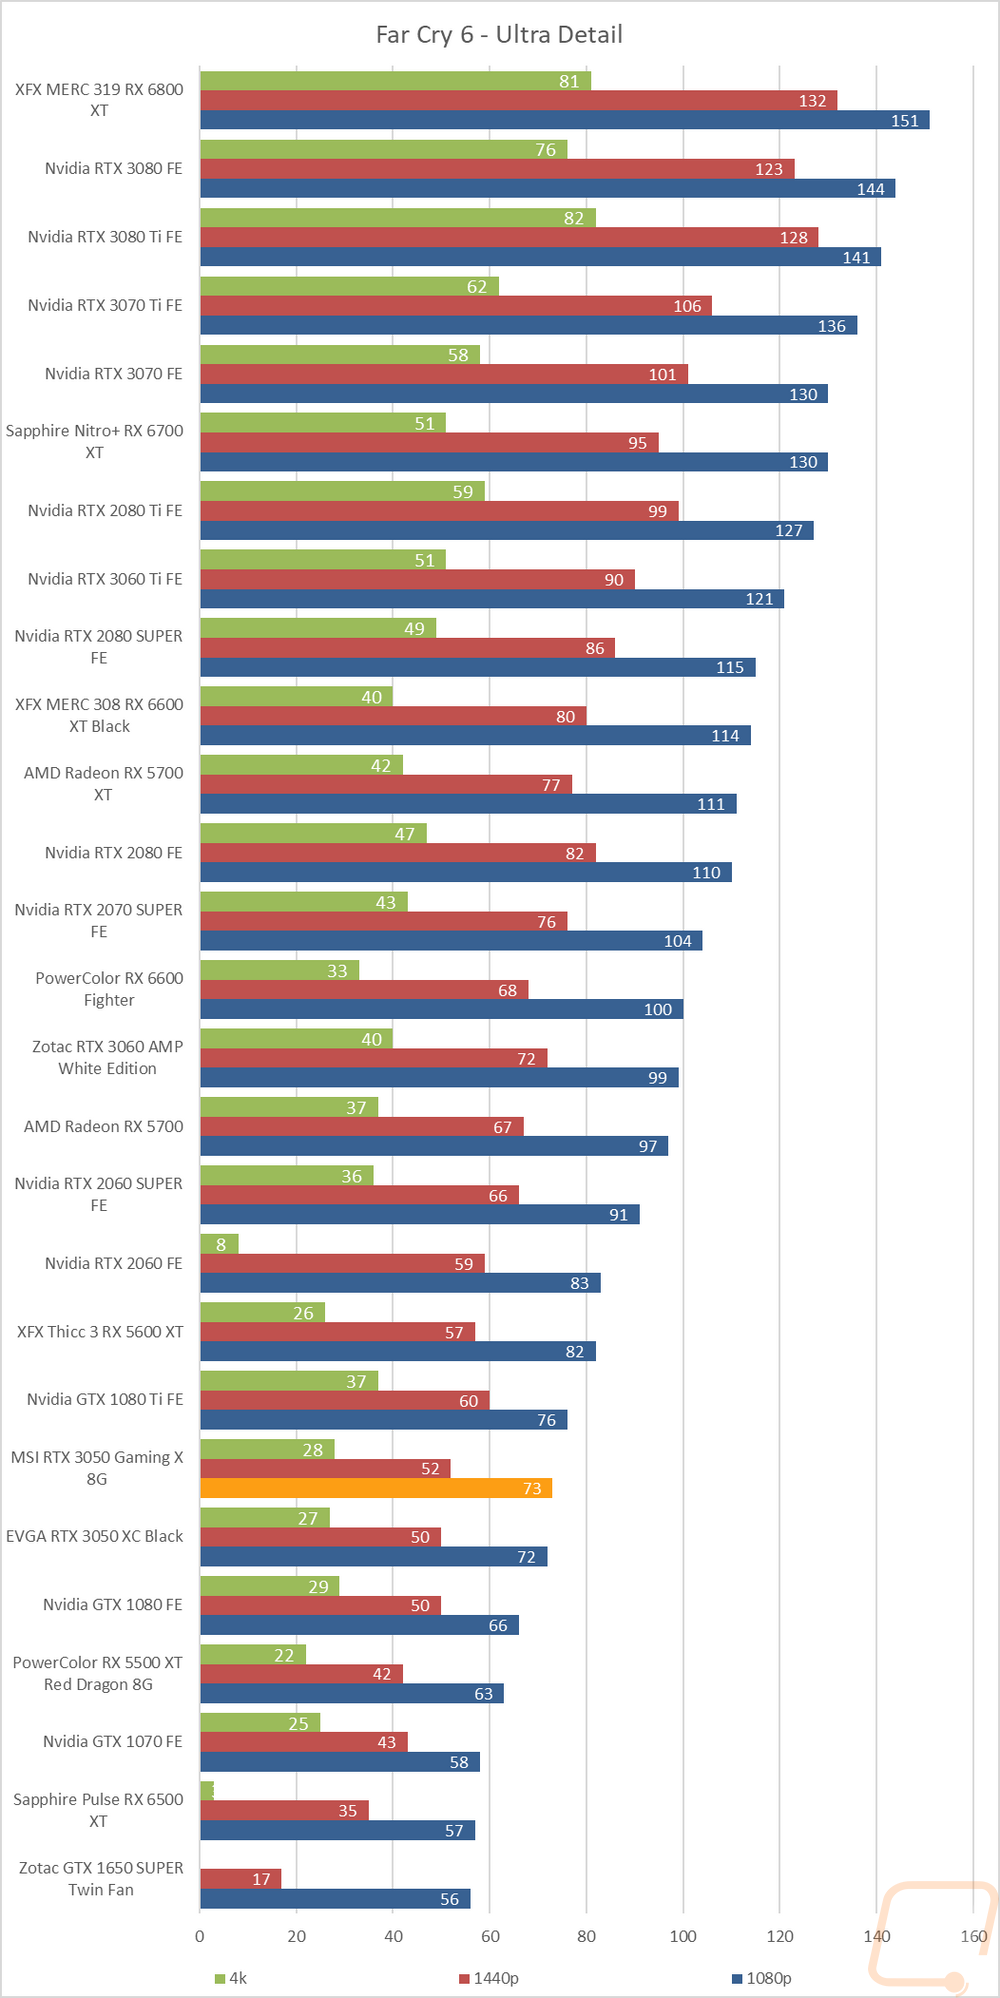
Of course, I have all of the actual in game results as well for anyone who wants to sort through the wall of graphs below. Right away on CS:GO we can see that the small overclock was enough to bump the 3050 Gaming Xup past the RX 5500 XT and RX 6500 XT when compared to the stock 3050 at 1080p. at 1440p it was only a fraction of an FPS faster and at 4K it came in 2 FPS slower. In Watch Dogs at Ultra detail, the 1 FPS jump pushed the 3050 Gaming X up in with the 2060. Beyond that, though the 3050 Gaming X did stay just right above the EVGA 3050 but there was a noticeable jump in FPS in almost every test. To see exactly where that put things I did put the numbers together for both RTX 3050’s to see how much the small overclock helped. The biggest improvement was at 1080p at 2.21 FPS but at all three resolutions, the overclock did help.
|
|
1080p |
1440p |
4K |
|
EVGA RTX 3050 XC Black |
99.56 |
68.99 |
36.98 |
|
MSI RTX 3050 Gaming X |
101.77 +2.21 |
70.26 +1.27 |
37.61 +.63 |
Compute Benchmarks
Now some people don’t need a video card for gaming, they need the processing power for rendering or 2D/3D production, or in some cases people who game also do work on the side. So it is also important to check out the compute performance on all of the video cards that come in. That includes doing a few different tests. My first test was a simple GPU Compute benchmark using Passmark’s Performance Test 10 and the 3050 Gaming X did much better than the stocked clocked 3050 here with a jump from 6991 up to 7232. That was enough to put the 3050 Gaming X right with the RTX 2060 SUPER.
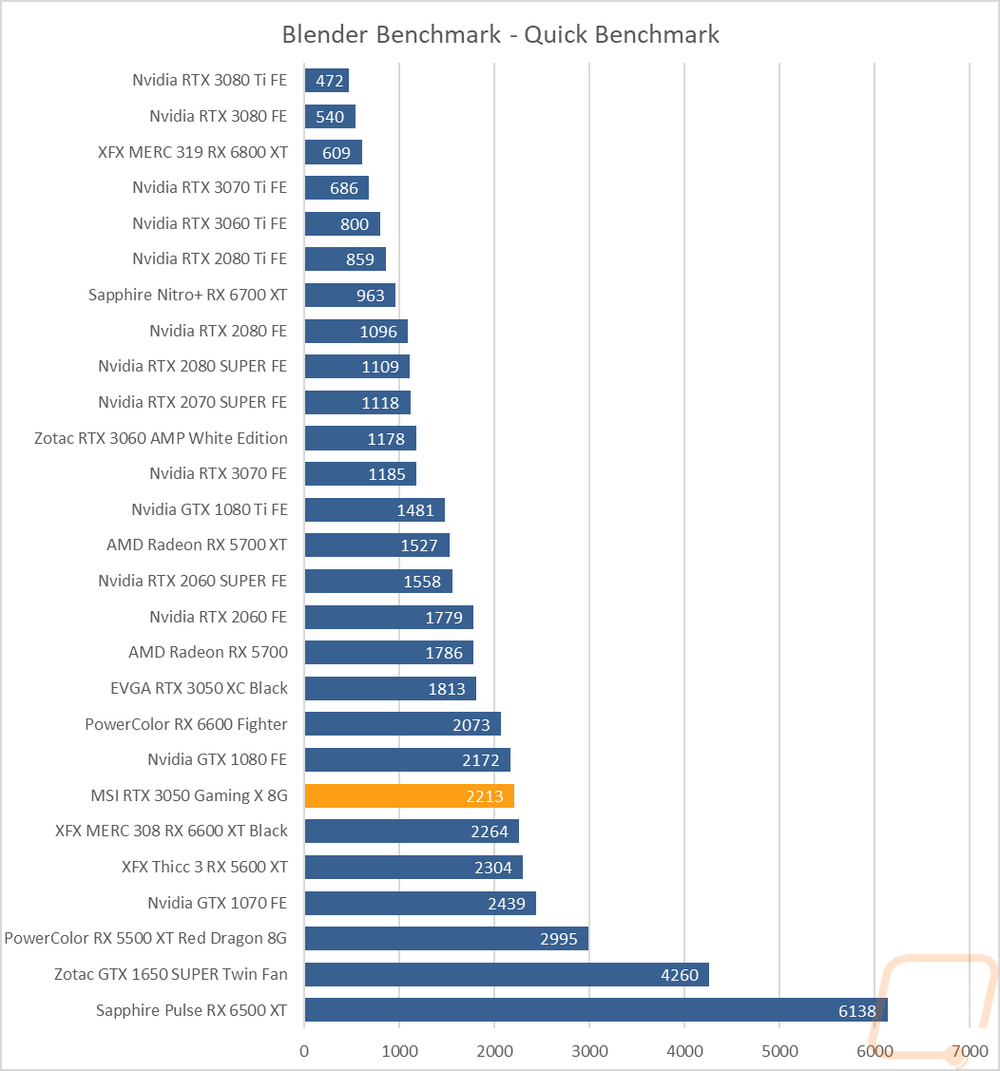
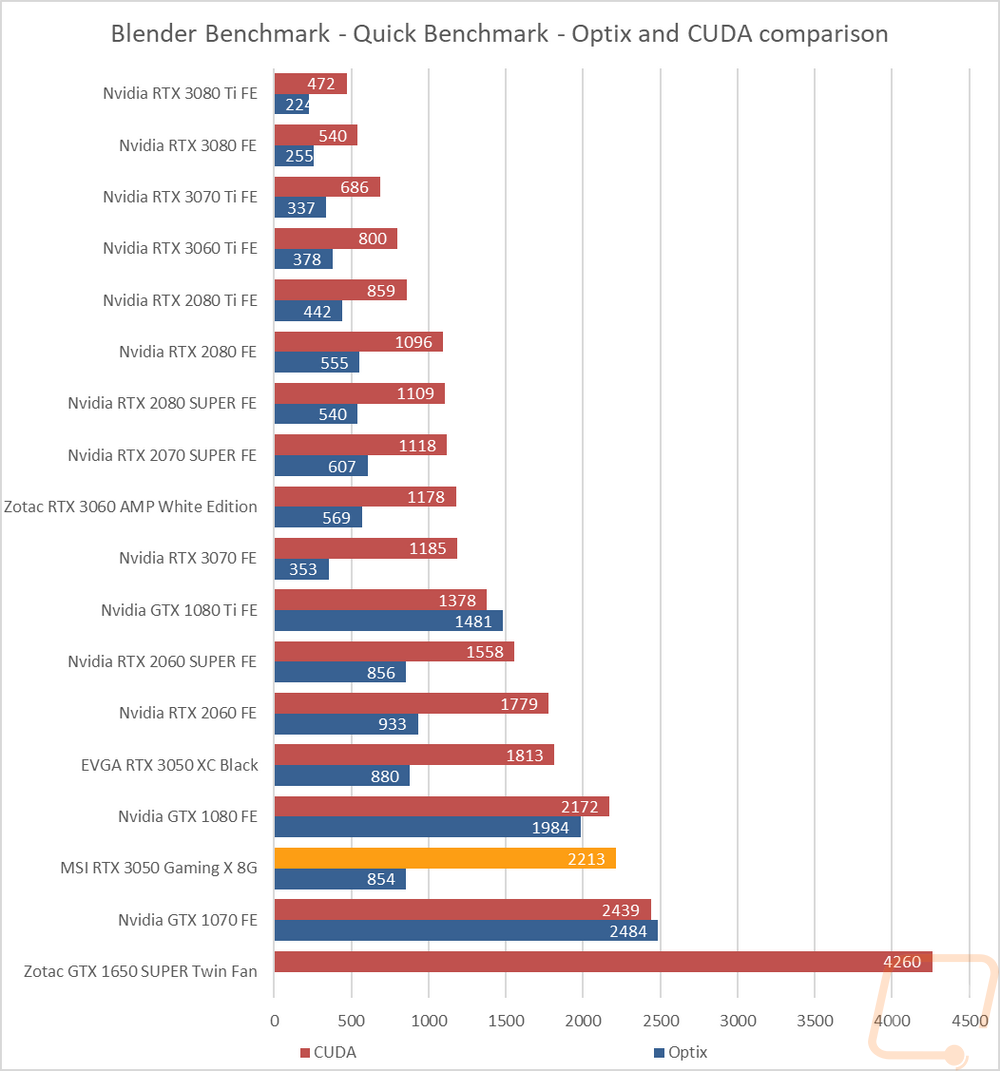
Blender is always my favorite compute benchmark because the open-source 3D rendering software is very popular and it isn’t a synthetic benchmark. Here I render all six scenes and combine the total time it takes in seconds using the provided Blender Benchmark on the 2.93.1 build. The 3050 Gaming X struggled on the standard Blender test with it actually dropping in time compared to the stock clocked 3050. But when testing using Optix it didn’t have the same problem finishing 26 seconds faster on that test. I did redo the CUDA test a few times a few times with similar results but no indication as to why that specific test dropped in performance as much as it did.
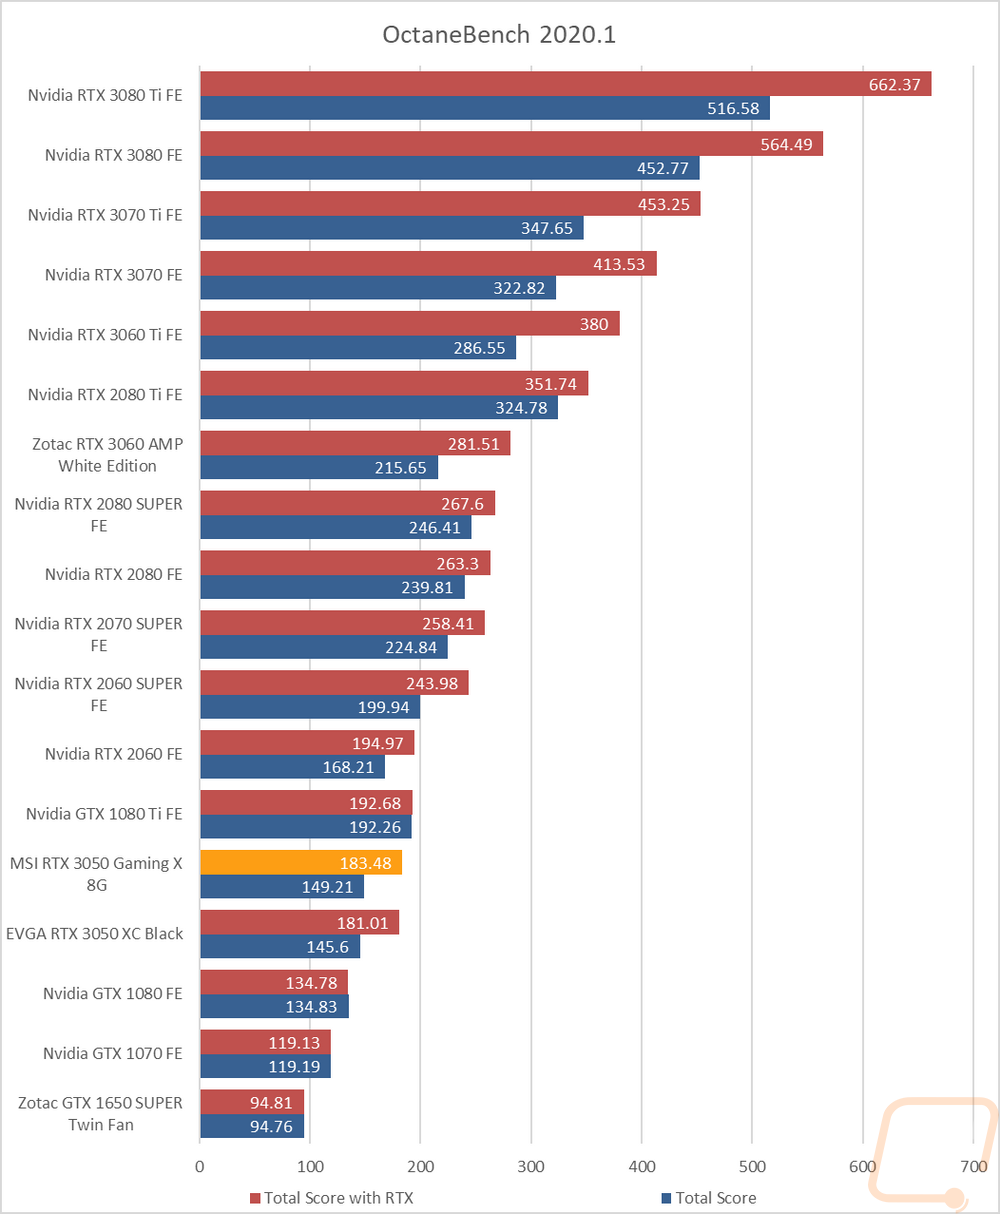
For CUDA-based cards, I also check out OctaneRender performance using their OctaneBench 2060.1 benchmark which allows me to check out both RTX and non-RTX rendering performance. Here the 3050 Gaming X gained on the stock 3050 with and without RTX on but it wasn’t enough to catch up to the GTX 1080 Ti which is above it.
RTX and DLSS
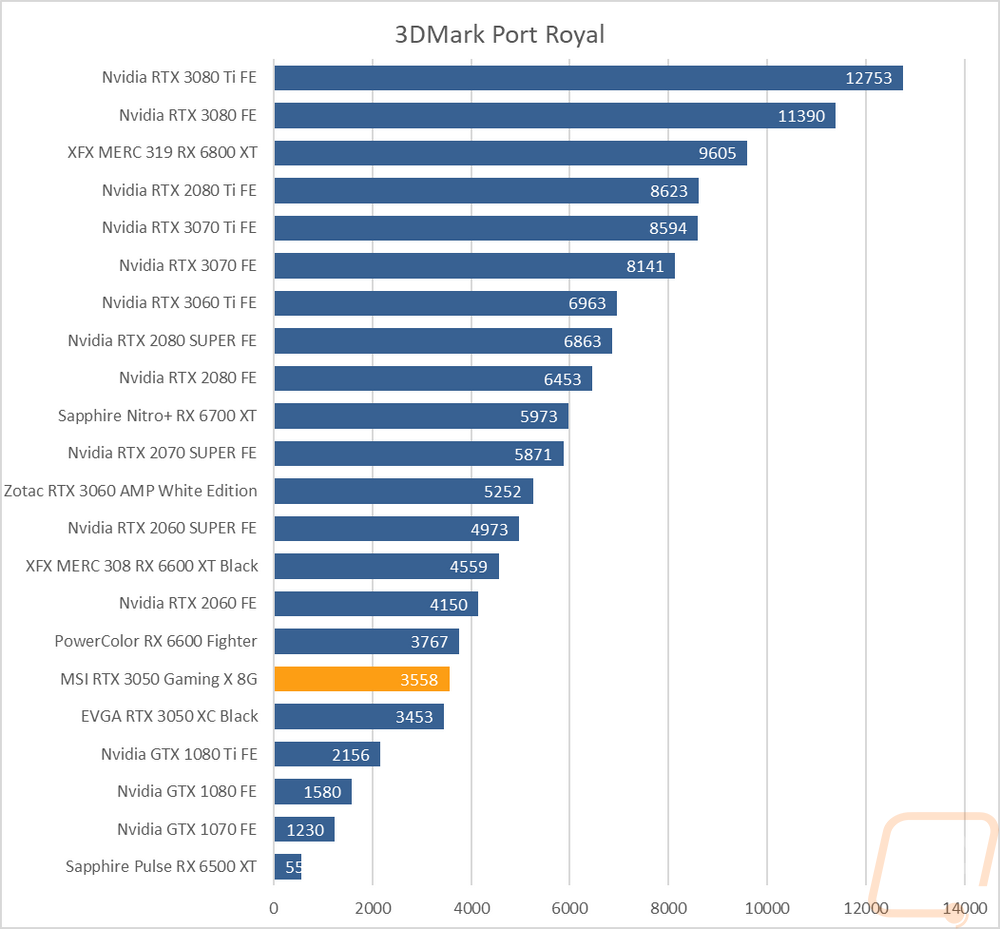
Being an RTX card I also like checking out the performance of some of Nvidia’s features. Namely the ray tracing performance and the performance improvements you can see by using DLSS combined with the tensor cores. My first test goes back to our synthetic benchmarks with 3DMark where I check out their Port Royal benchmark. This is the one test that does also have AMD Ray Tracing support which is great to get a look at how different cards including older non-RTX cards perform. The 3050 Gaming X gained 105 points on the stock clocked card which still wasn’t enough to overtake the 6600 or catch up to the RTX 2060.
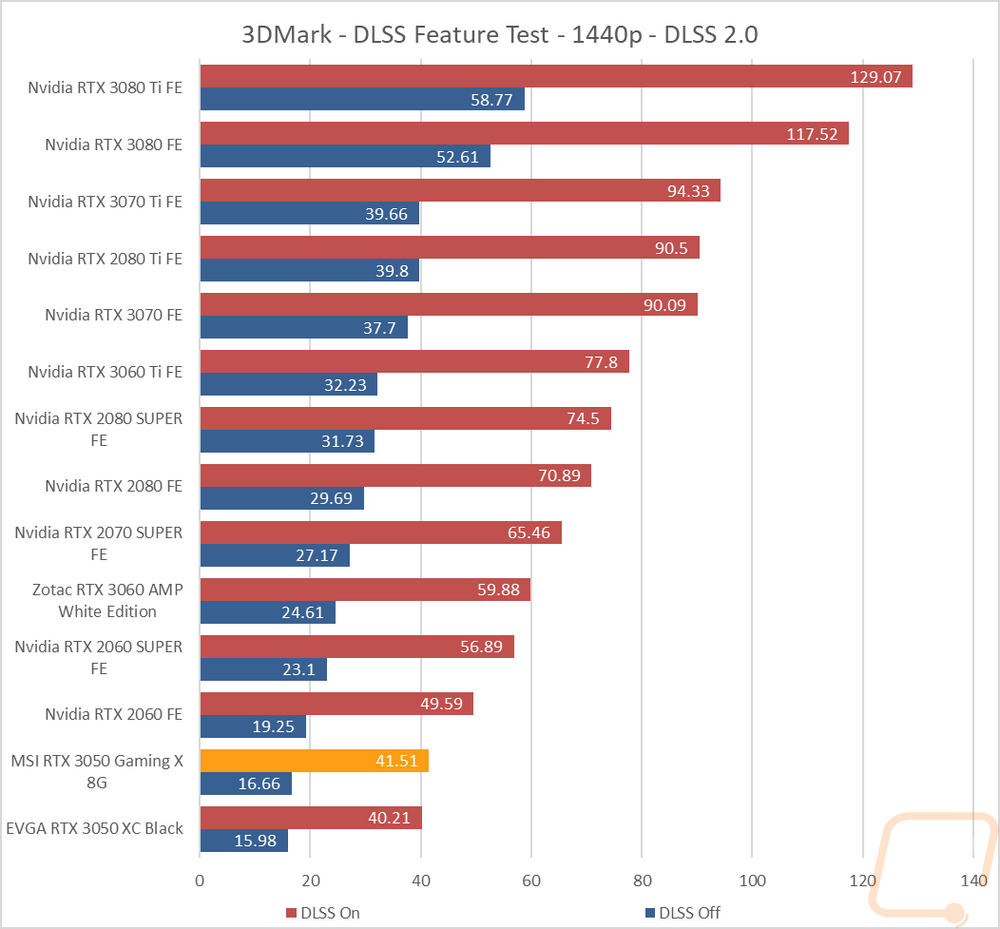
3DMark also has added in a few feature tests, one being a look at DLSS performance. For this one, I have the resolution set to 1440p and DLSS 2.0 turned on. I then have run the test on every card supported to get a comparison on how their test performs with and without DLSS. The 3050 Gaming X gained over 1 FPS with DLSS on over the stock card and over half an FPS without DLSS. More importantly, this shows just how much DLSS can help improve performance when it is optimized.
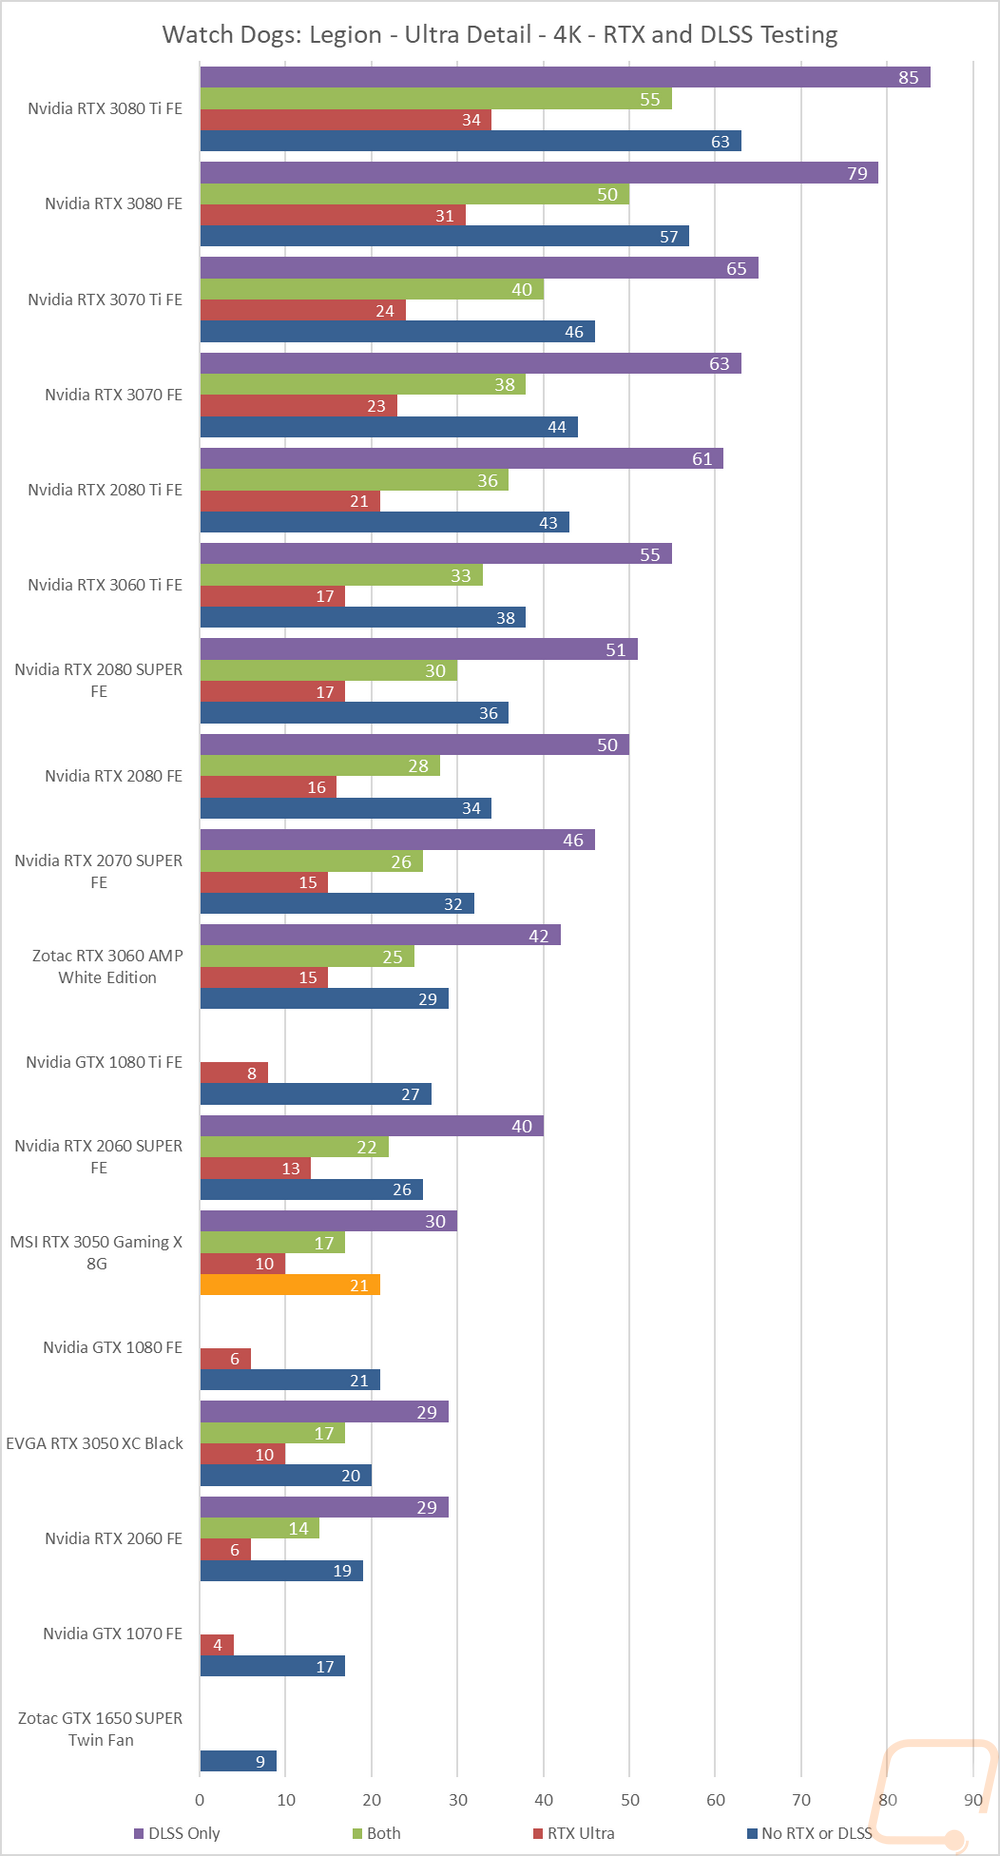
I then jumped into game tests, this time with Watch Dogs: Legion. For this one, I wanted to get an idea of the performance you will see when taking advantage of Nvidia’s RTX and DLSS features. I tested at 4k with the ultra detail setting and with ultra being the setting for DLSS and RTX when they are on as well. I then test with no RTX or DLSS on and then with RTX DLSS on and off and on together. Here the 3050 Gaming X started with one more FPS in the no-RTX and no-DLSS test and it also had one more FPS in the DLSS result compared to the stock clocked card.
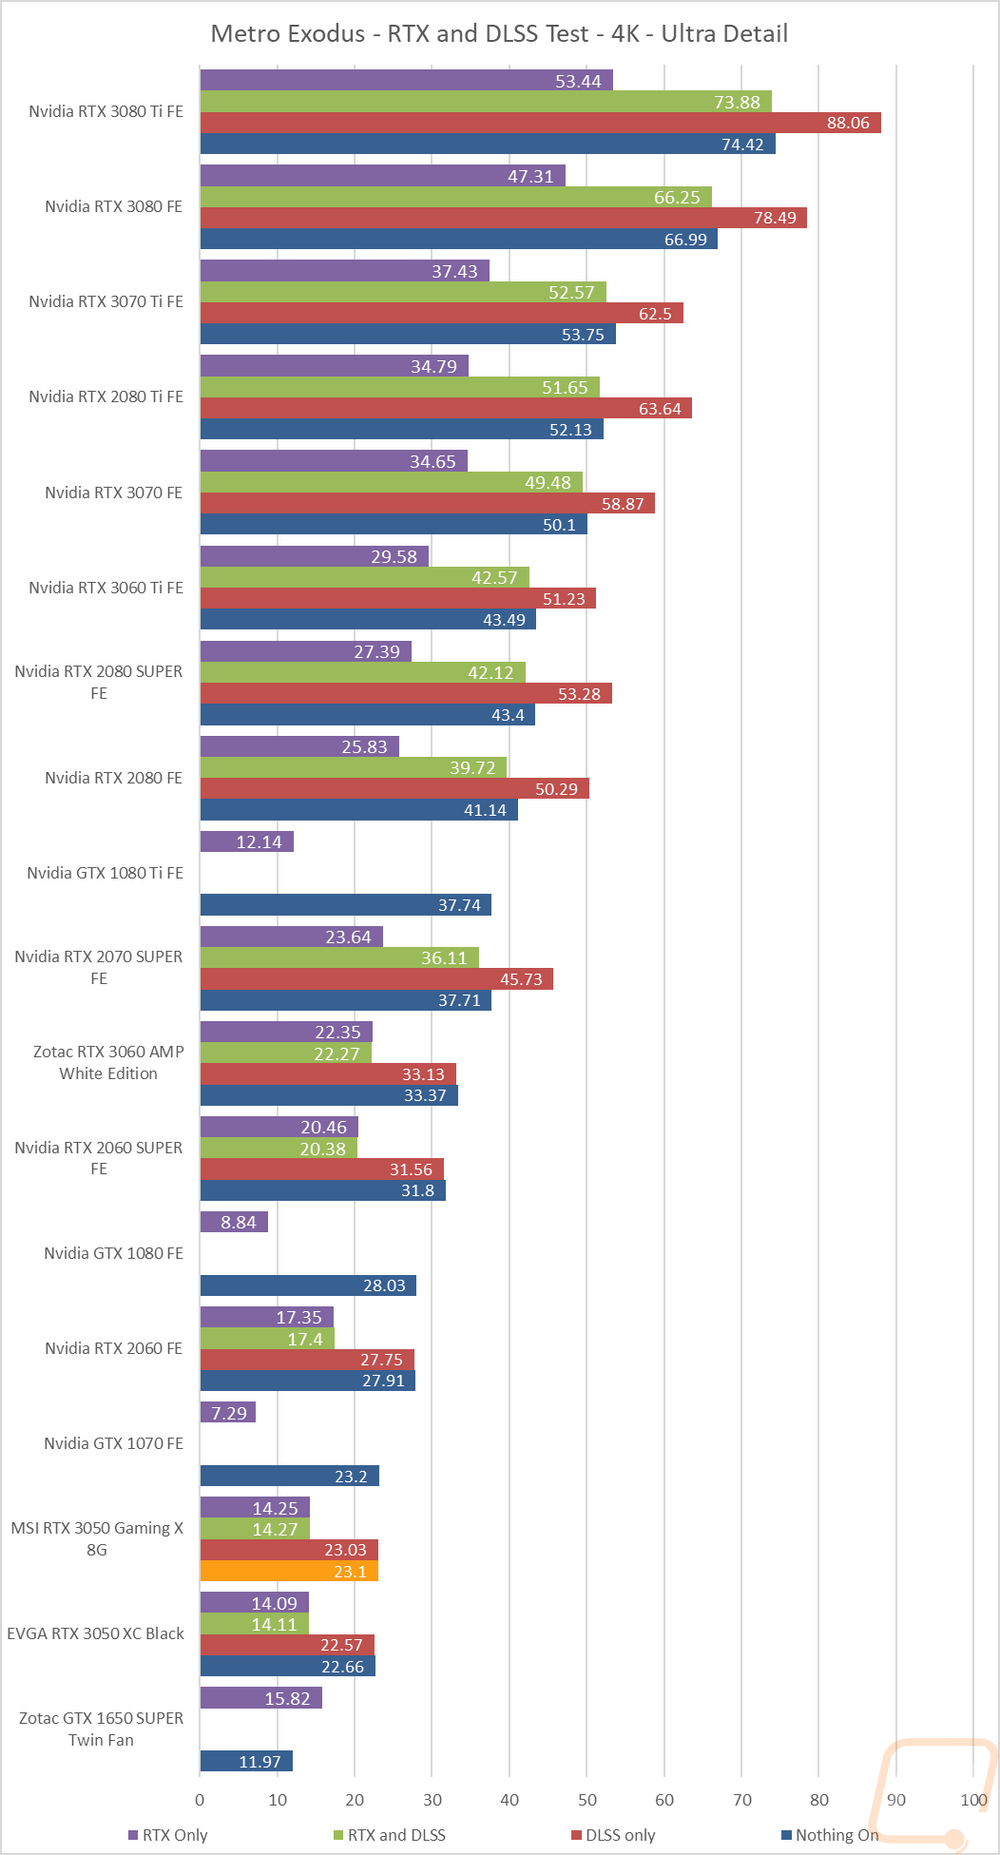
Next, I wanted to check out the performance in Metro Exodus which we have used for testing for a long time now. This test is similar as well with it set to 4K and Ultra detail, I use the included benchmark to test DLSS and RTX individually and then with them both on and both off to give us a look at overall frame rates depending on which direction you go. The 3050 Gaming X did gain on the stock clocked card a little here but not by anything to be concerned with. Overall though both 3050’s struggled with the DLSS result on this one, basically matching the speed of the non-DLSS tests.
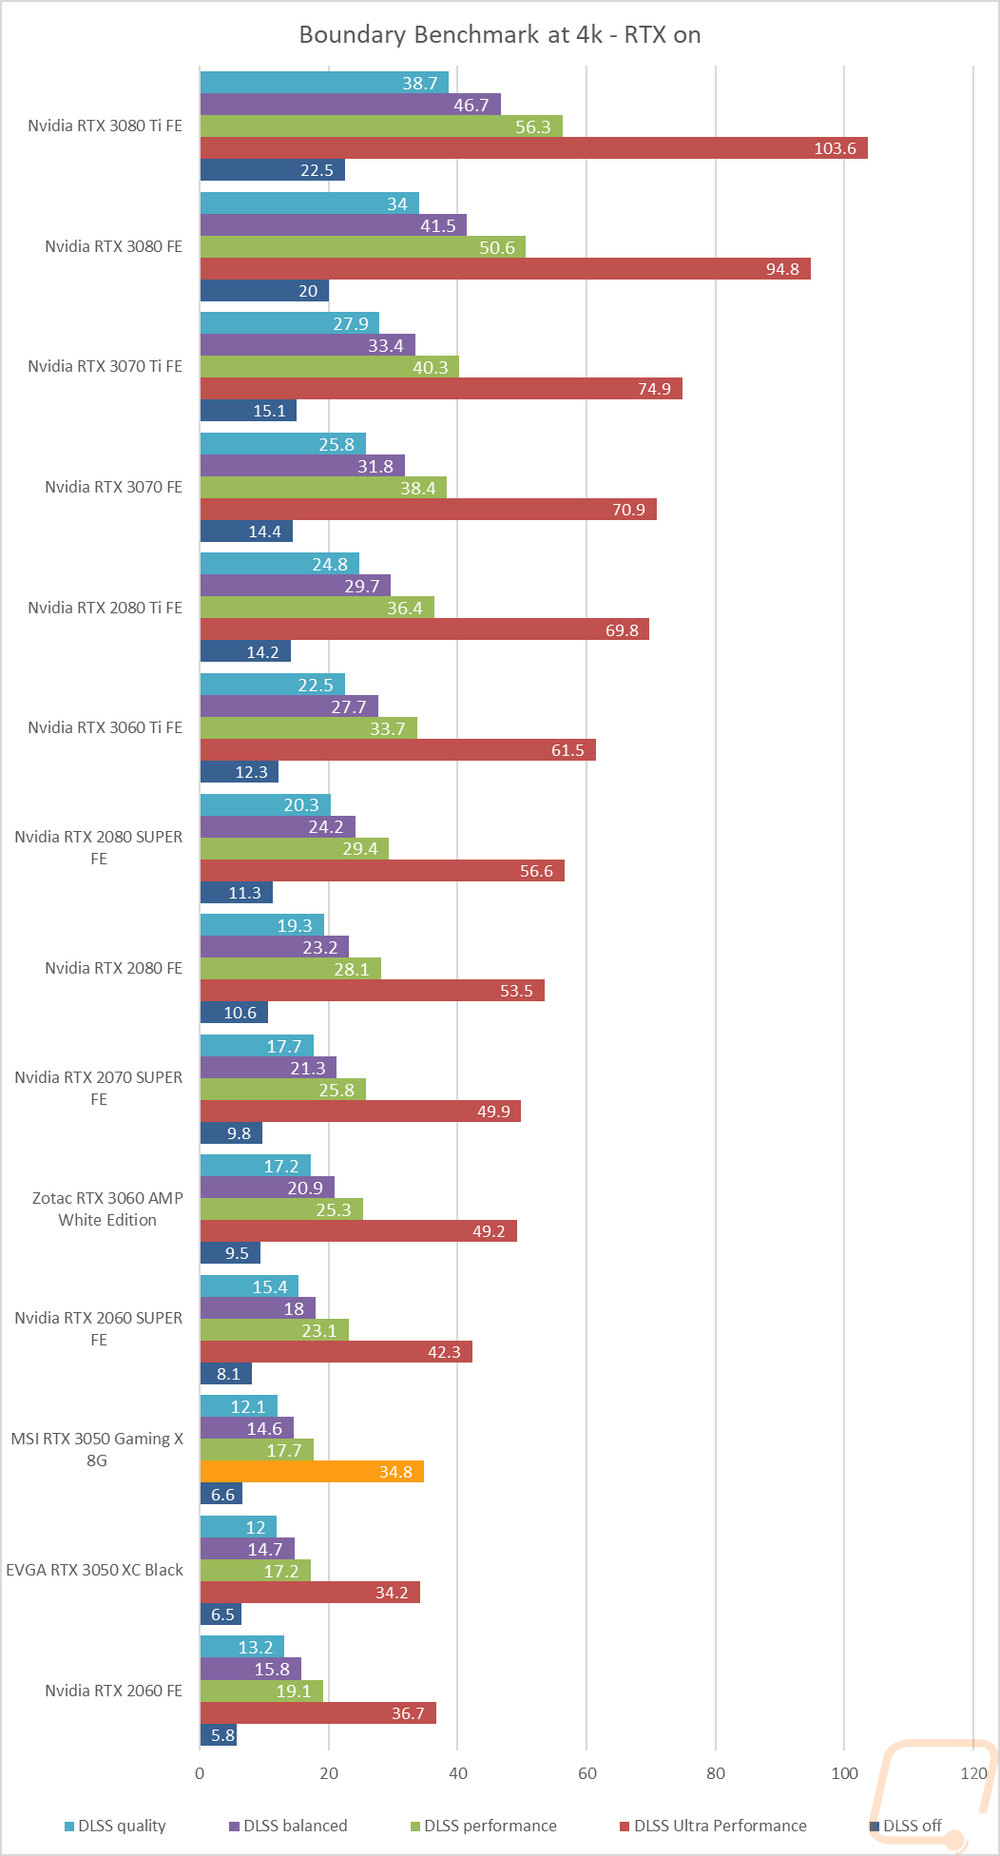
Next, I tested using a benchmark based on the game Boundary. For this one, I wanted to see how all of the different DLSS settings would perform, including turning it off completely. This is run using the free benchmark and with the resolution set to 4k and RTX on. In the Boundry Benchmark, the 3050 Gaming X shows just how much DLSS can help, especially when running at DLSS Ultra Performance where the 3050 Gaming X jumped from 6.6 up to 34.8.
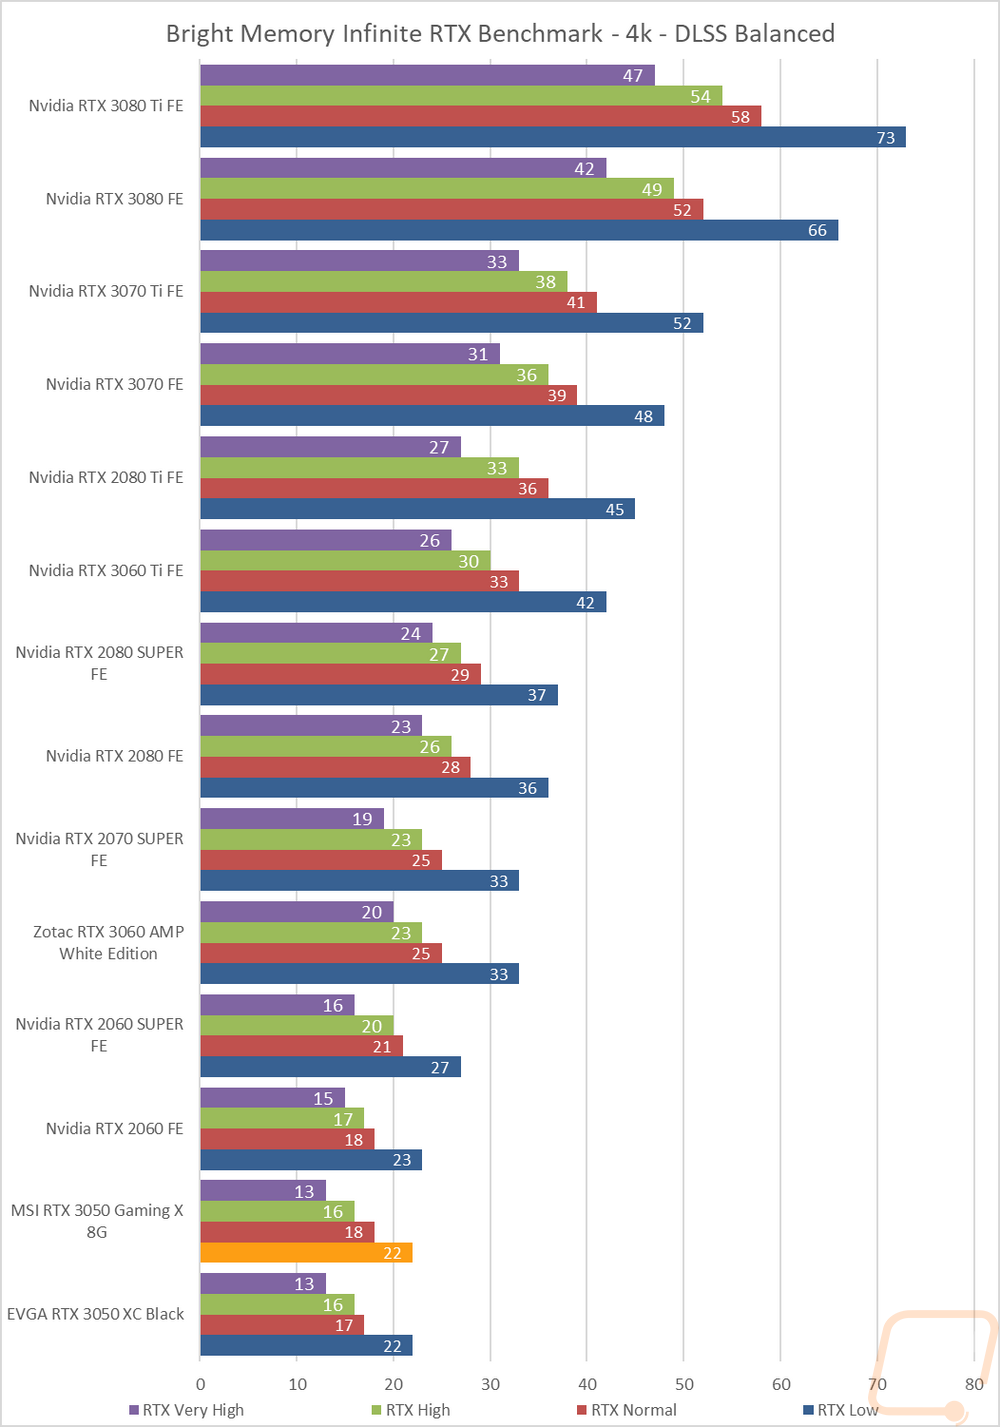
The last tests were done in a benchmark based on the game Bright Memory with their free steam benchmark. This is similar to the previous Boundary test only it is looking at RTX settings individually with the resolution set to 4K and DLSS is set to the balanced setting. The 3050 Gaming X isn’t designed for 4k gaming, especially with RTX on but this test does show the performance difference between the different RTX detail levels. The very high RTX test came in at 13 FPS, going to the high detail jumps up to 16 FPS and 18 on the normal settings.
Cooling Noise and Power
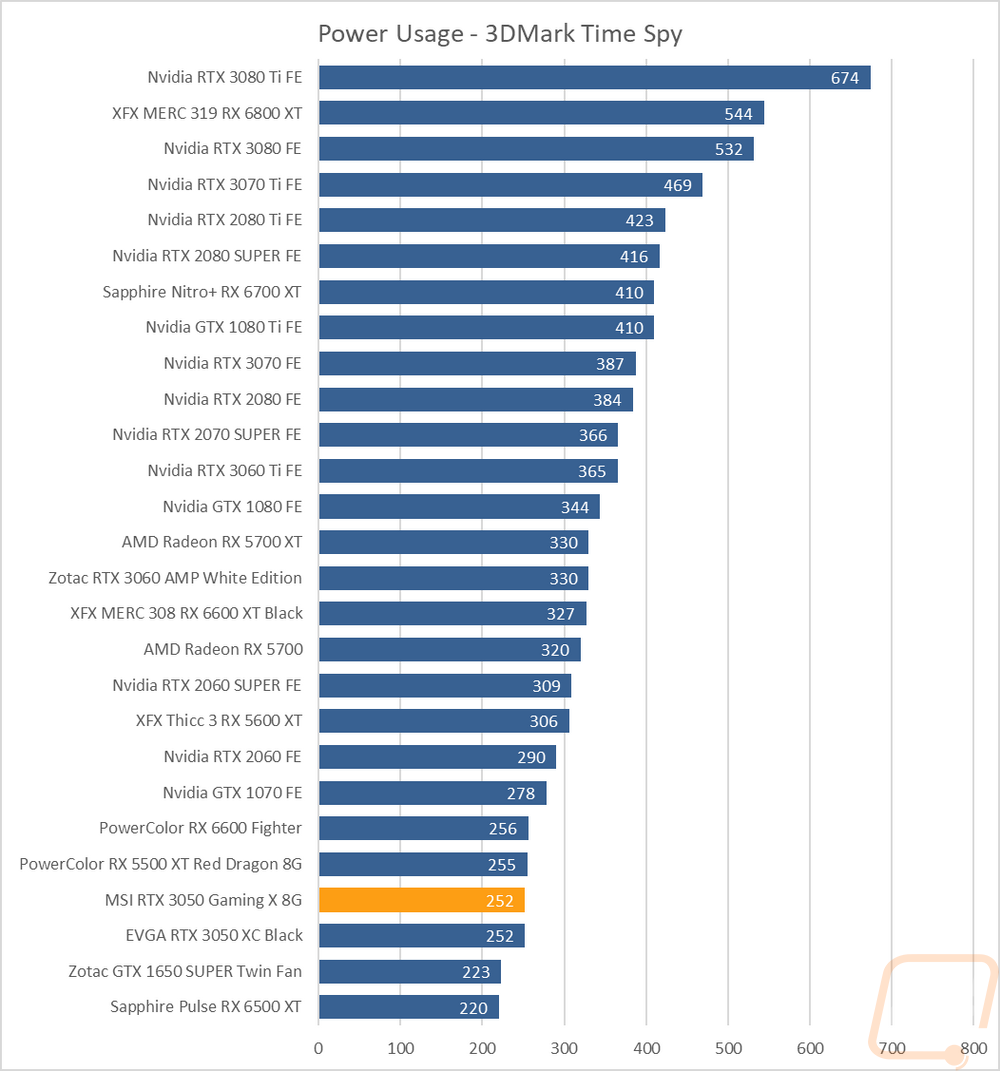
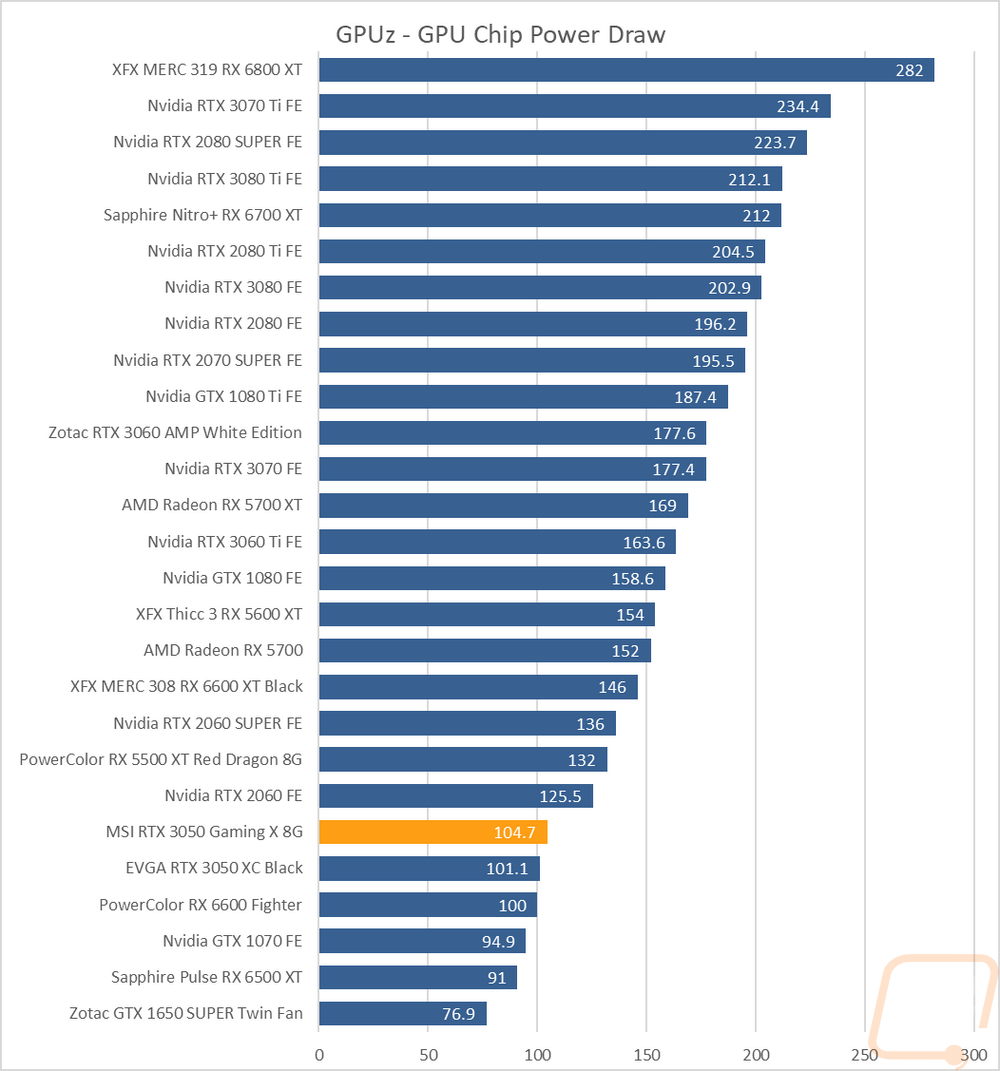
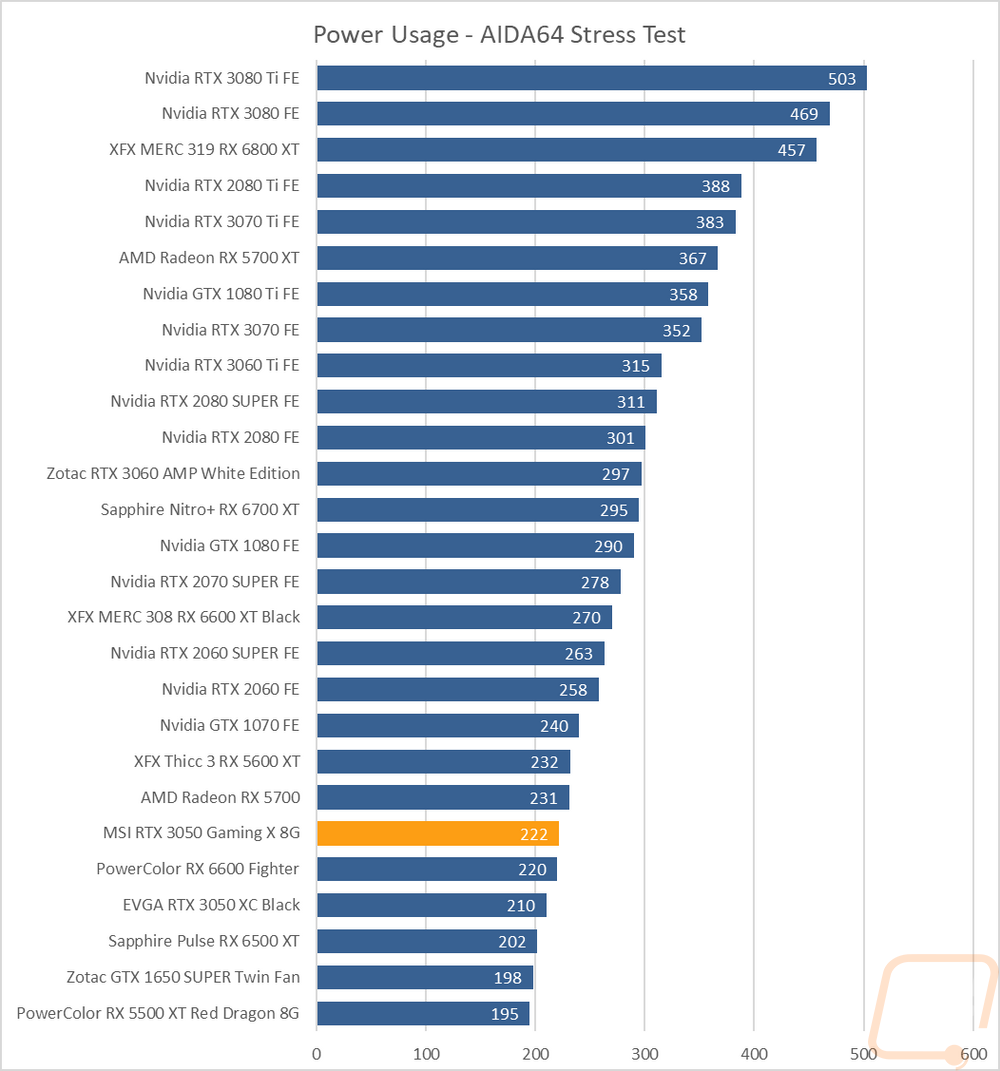
For my last few tests, rather than focusing on in game performance, I like to check out other aspects of video card performance. These are also the most important ways to differentiate the performance between cards that have the same GPU. To start things off I took a look at power usage. For this, I use our Kill-A-Watt hooked up to the test bench to record the total wattage of the system. I ran two tests with the first using 3DMark Time Spy to put the system under a load similar to normal in game performance. Here our test system with the 3050 Gaming X pulled 252 watts which was exactly the same as the stock RTX 3050. At the same time with Time Spy I also use GPUz to check out the onboard reading for GPU power draw at the chip. On that result, the 3050 Gaming X does show that it is pulling 3.6 more watts to the GPU itself over the stock 3050. Lastly, I run AIDA64’s stress test on the video card to load up only the GPU, and using the Kill-A-Watt the test bench with the 3050 Gaming X was pulling 222 watts. That is 12 more watts than the stock RTX 3050 and enough to push it up over the RX 6600.
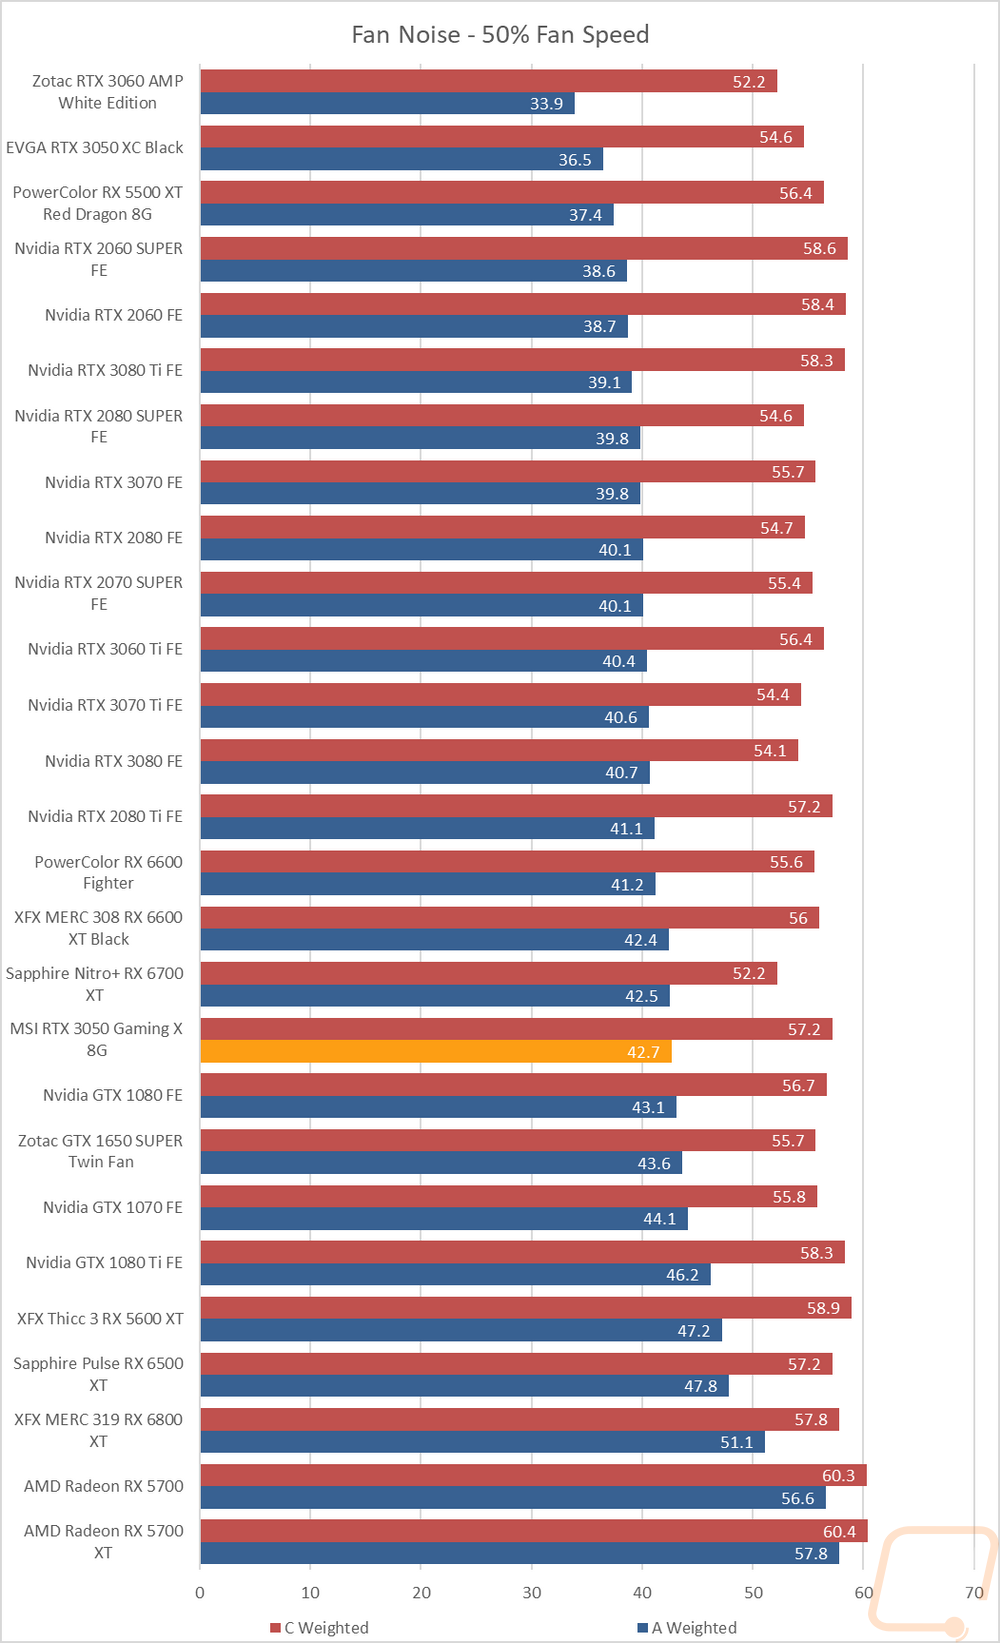
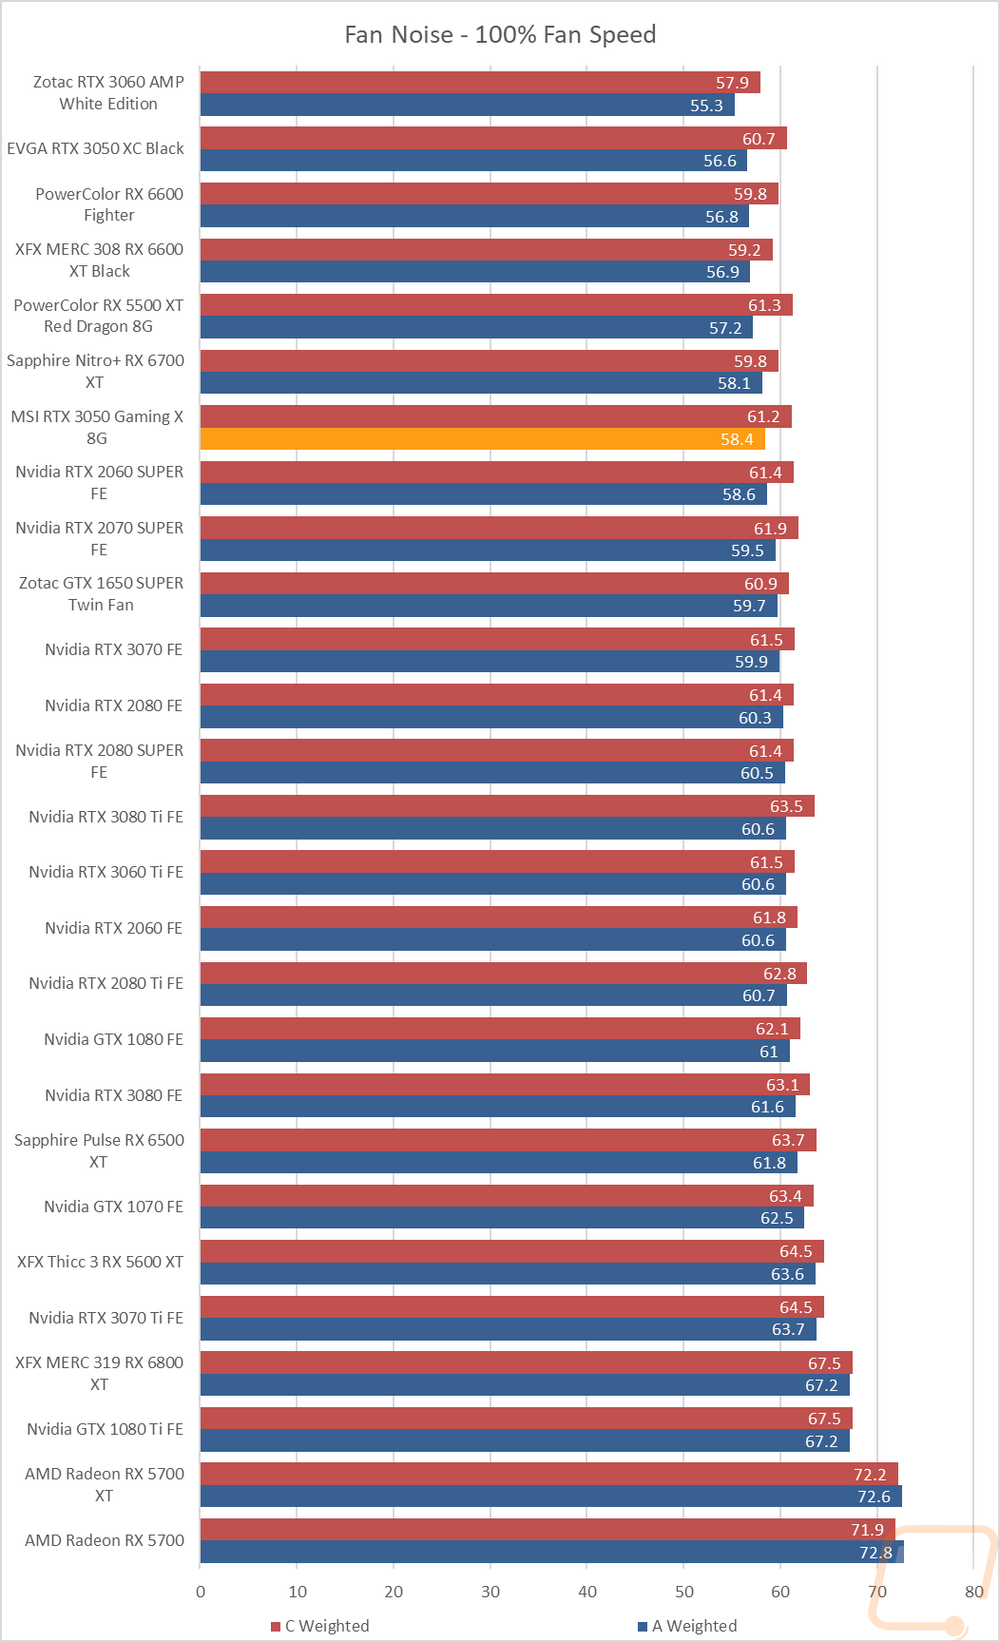
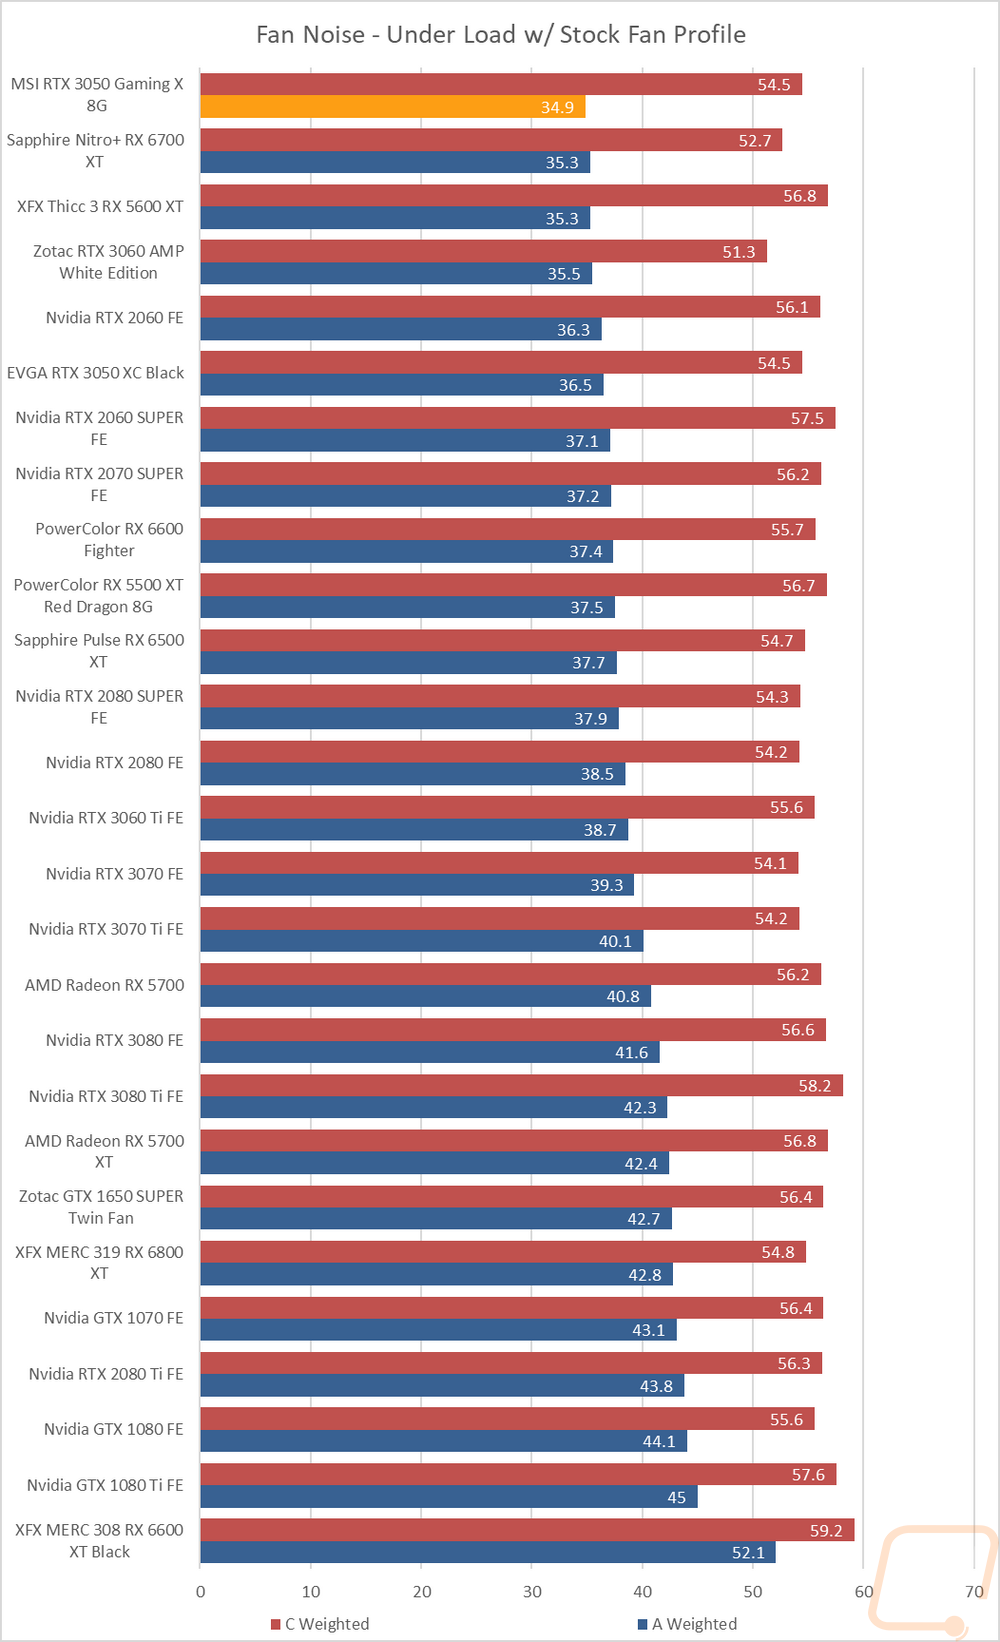
My next round of tests were looking at noise levels. These are especially important to me because I can’t stand to listen to my PC whirling. Especially when I’m not in game and other applications are using the GPU. For my testing, though I first tested with the fan cranked up to 100% to get an idea of how loud it can get, then again at 50% to get an idea of its range. I test using both A and C weighting, A is the standard way and C has a little more of the low end to check for low-level hums. The 3050 Gaming X didn’t do all that well in the 50% fan speed chart with it coming in at 42.7dB in the A-weighted test. When the fans were turned up to 100% it did do better, however. I also take a look at noise performance while under load. For that when running AIDA64’s stress test I wait until the temperature of the card has leveled off and then measure how loud things are when the card is at its worst-case scenario with the stock fan profile. Here the 3050 Gaming X did extremely well and was the quietest card tested.
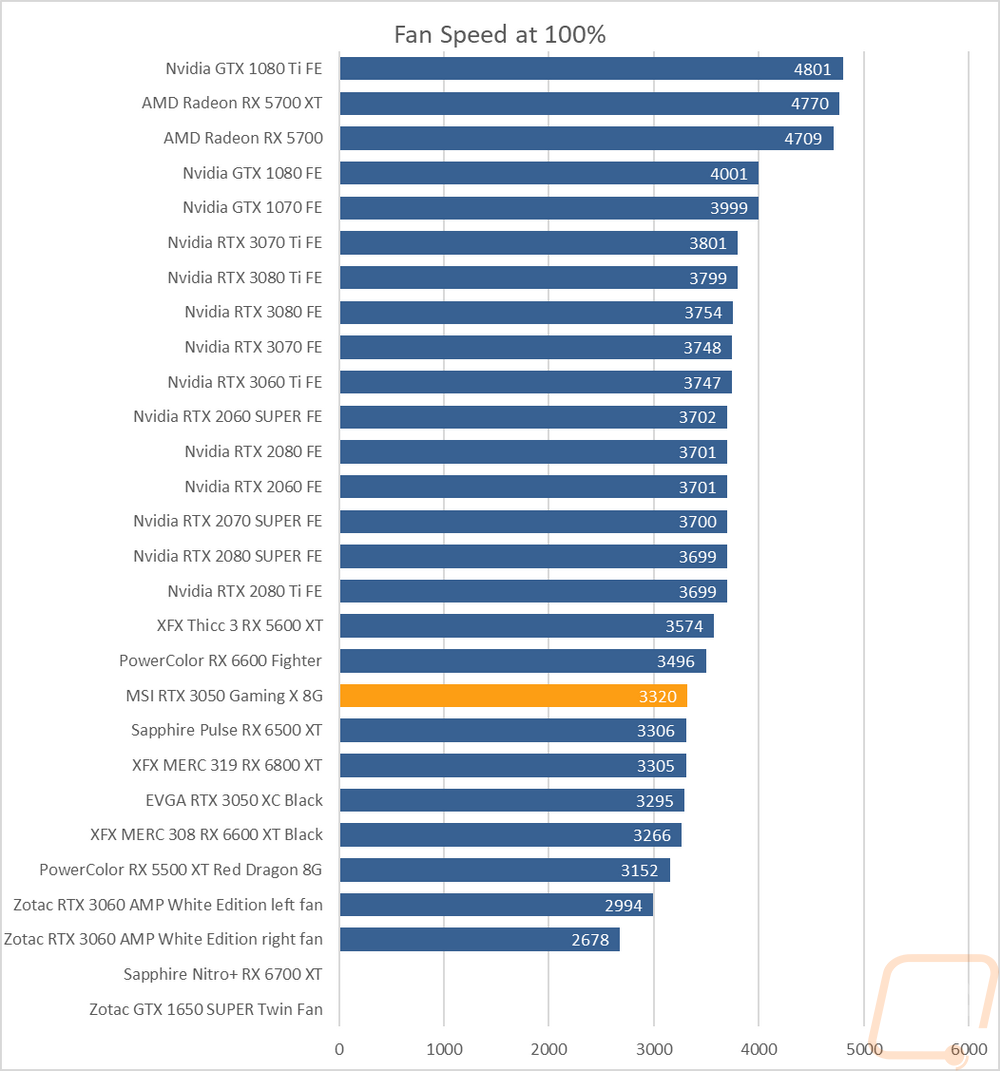
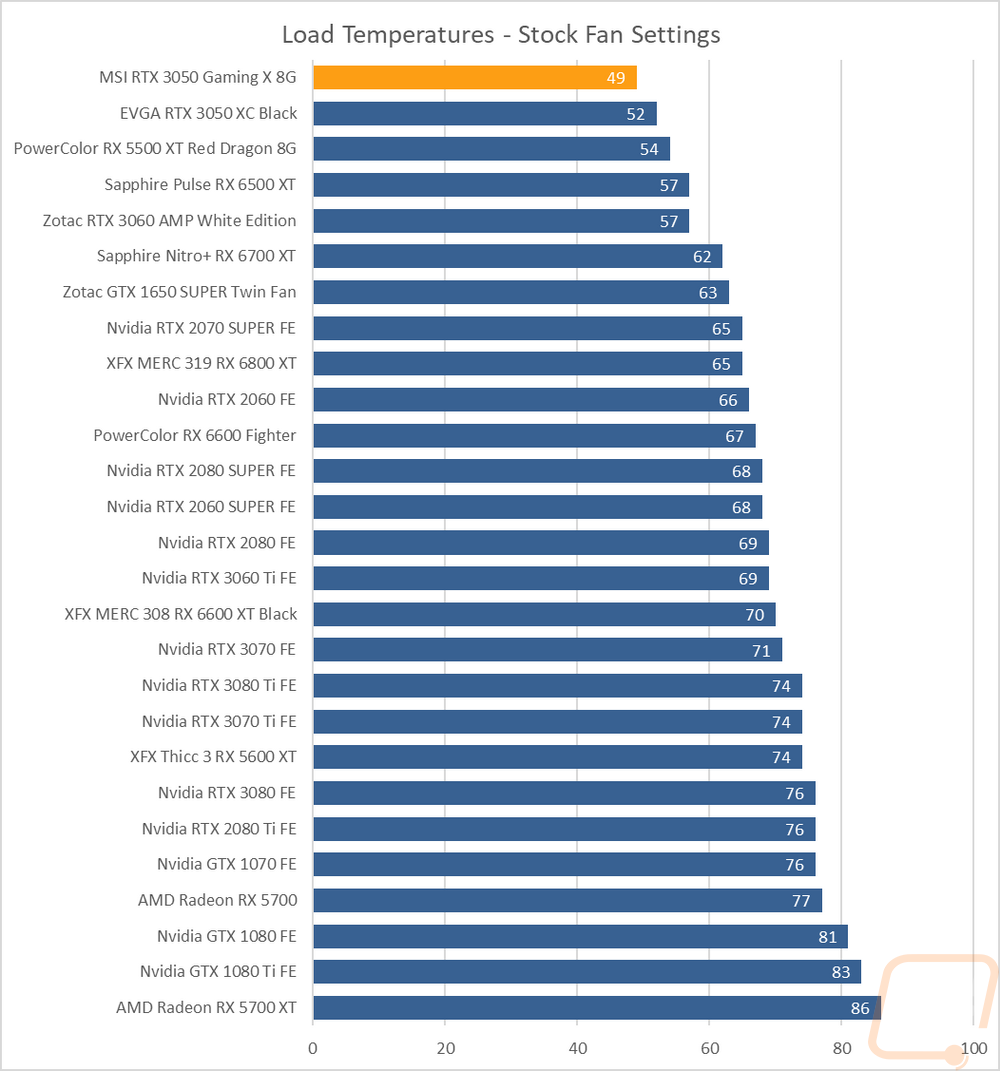
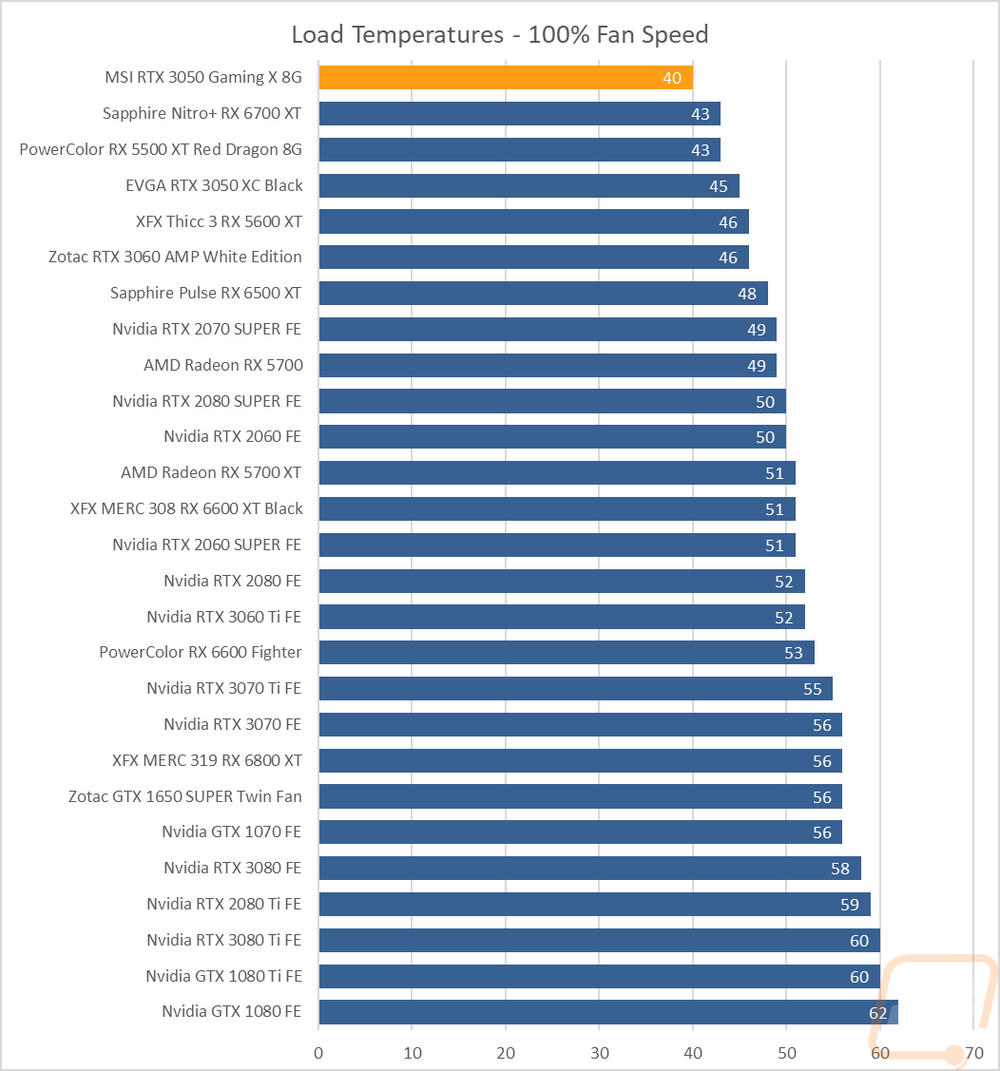
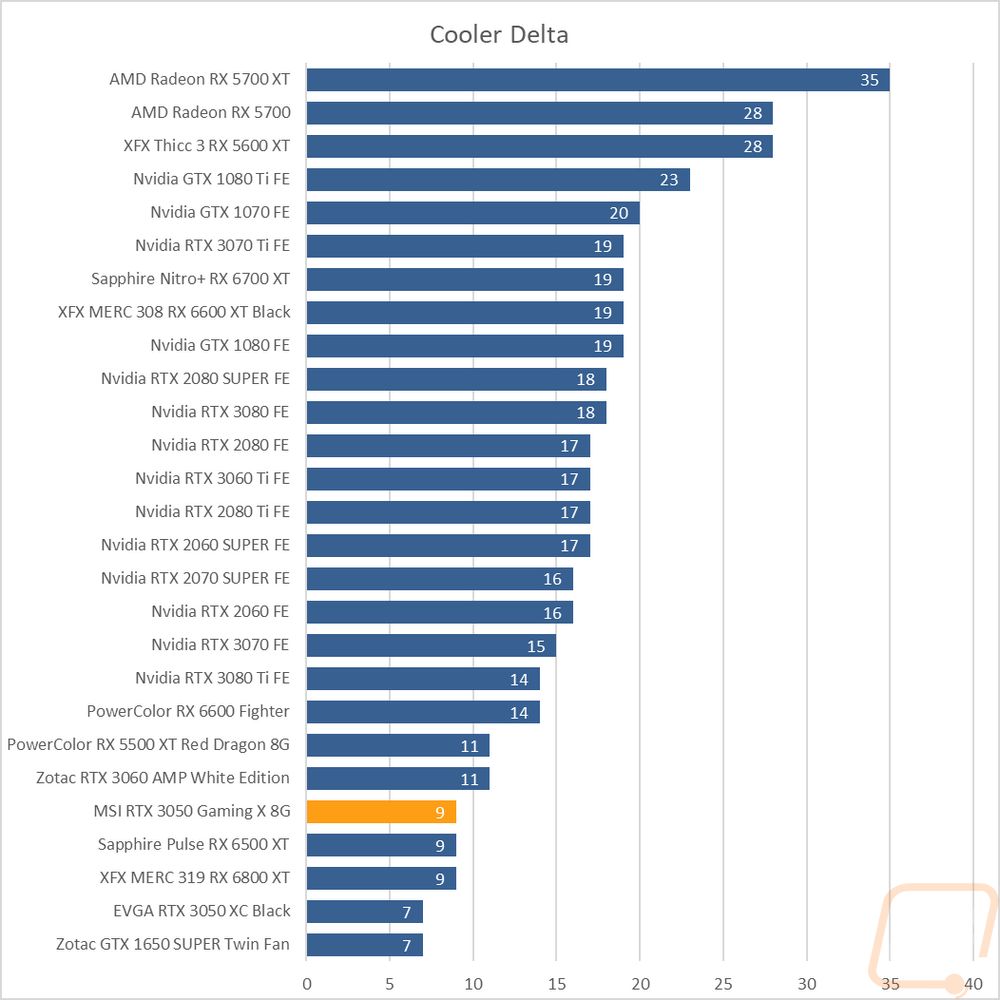
To finish up my testing I of course had to check out the cooling performance. To do this I ran two different tests. I used AIDA64’s Stress Test run for a half-hour each to warm things up. Then I documented what temperature the GPU leveled out at with the stock fan profile and then again with the fans cranked up to 100%. With the stock profile, I was really surprised to see that the 3050 Gaming X was running cooler than any other card tested. Not that I didn’t think it was capable of doing that. But with the under load noise testing result being so good I thought that MSI had maybe sacrificed a little cooling with their fan profile but that wasn’t the case. Then with the fans cranked up, the 3050 Gaming X was once again the coolest card tested, sitting ahead of everything else by 3 degrees. Together we can see there is still headroom in the cooler, even with the stock profile running so cool.
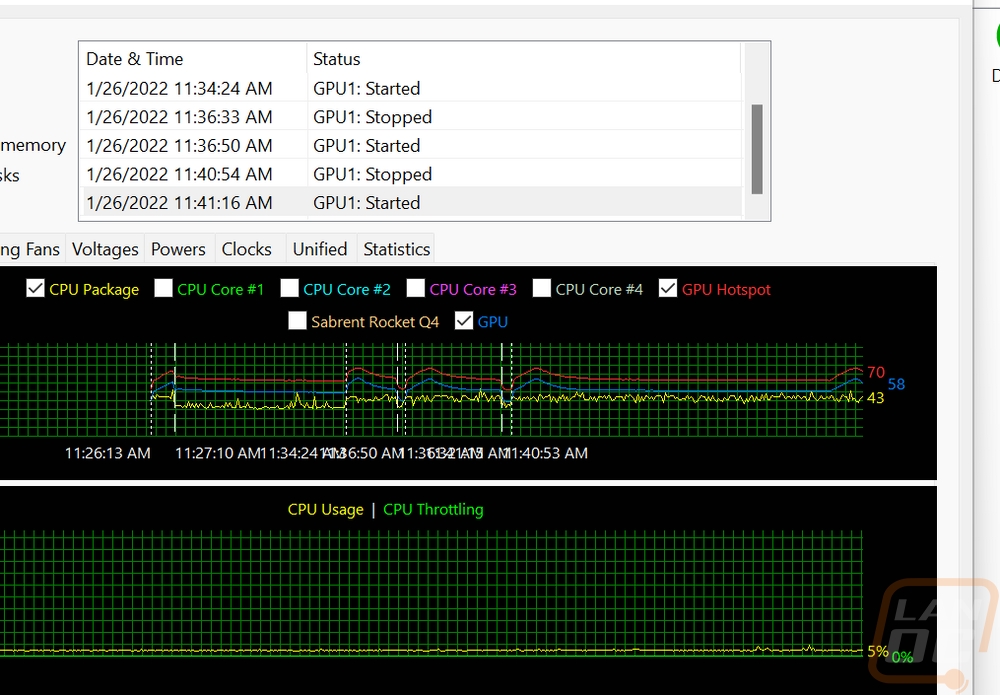
When doing the stock fan profile testing I did see a couple of quirks, nothing that would be a big concern at all but I did want to point them out in case anyone else runs into them. The 3050 Gaming X has what MSI calls Zero Frozr which is where the fans don’t turn on until you are putting the card under load. I love this feature because no matter how quiet a fan is it does still make some noise. Normally the fan will come on as things heat up before the card reaches its “stable temp”. But the 3050 Gaming X waits a little longer. So our card when under the AIDA64 stress test would level out at 49c with the stock fan profile. But before getting there the fans actually won’t turn on until it reaches 62c so you will see a spike in temperatures ahead of the cooling coming on. You can see it below with the lines where I turn the test on and off. I suspect that with some games or workloads that aren’t always at 100% load like this stress test you might see the 3050 Gaming X running at the higher temperature a lot more. Beyond that after around 20 minutes I would also see the fans just turn off and heat back up and cool back down again, this happens consistently over and over if I leave the workload on. Again, this isn’t heating things up enough to be a concern at all. It is just a little inconsistent with what I’ve seen other cards that turn the fans off do most likely because the 3050 Gaming X runs cooler than most cards. I would bet that if the fan turn on point was under 49c we wouldn’t see this quirk.
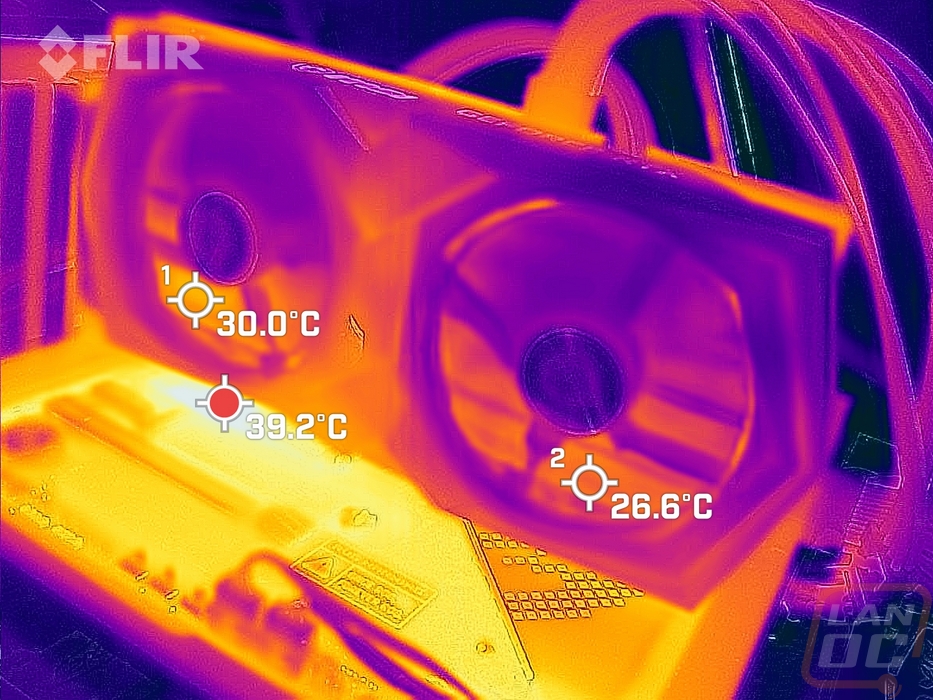
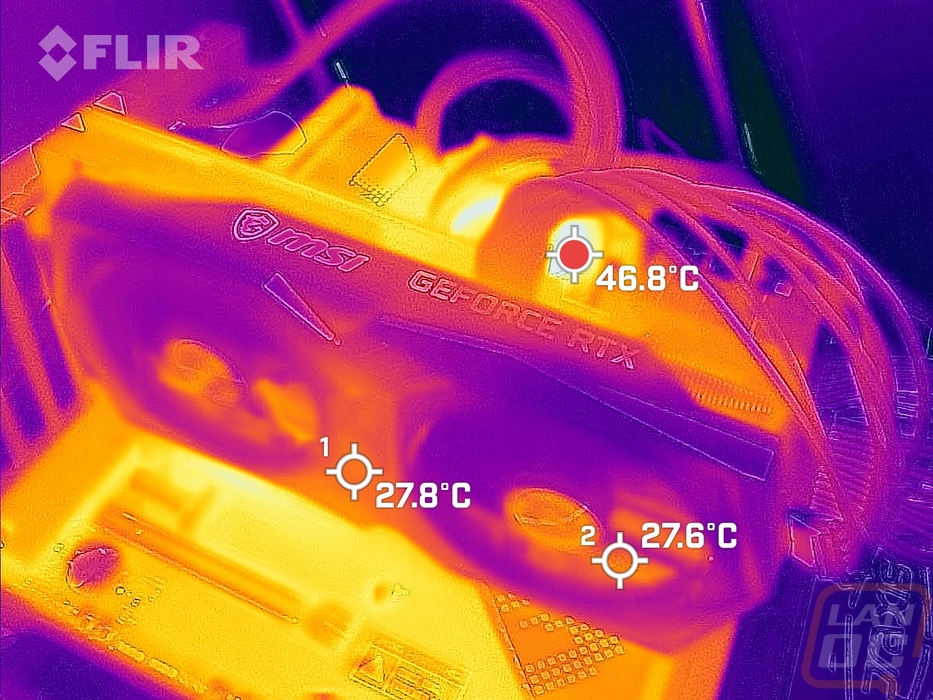
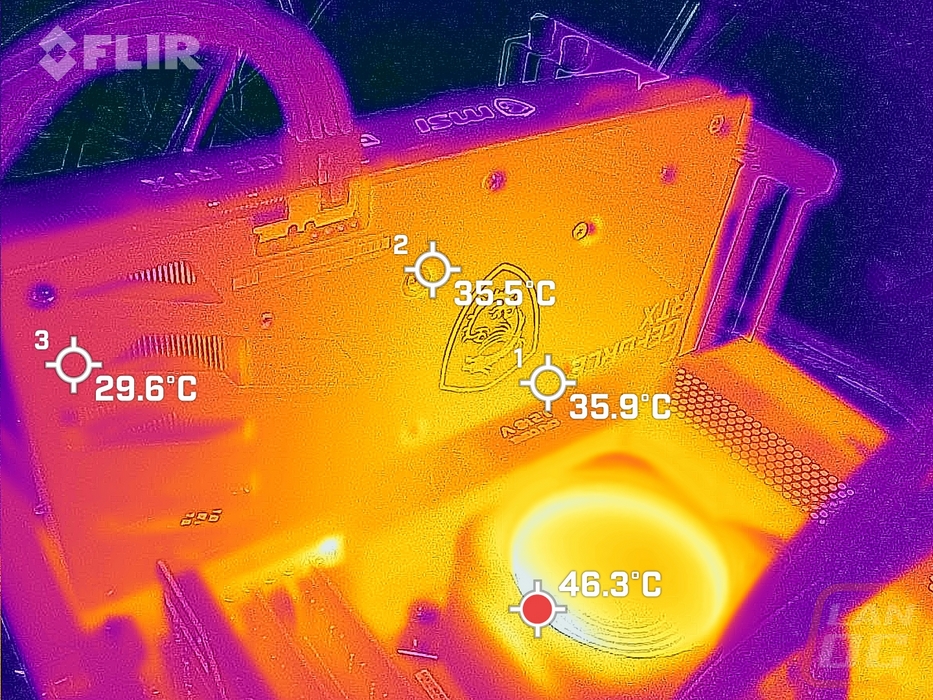
While running the stock fan profile testing I also took the time to get a few thermal images so we could see what is going on. Starting on the fan side, the 3050 Gaming X is running cool. The hottest spot on this side is down on the SSD below the card, which the 3050 Gaming X does contribute to that heat with the hot air from the card blowing down into that area. That view shows the bottom half of the heatsink is warmer than the top, most likely with the top having an easier airflow path. The left side which has the VRM and a little more of the GPU also makes that side a little warmer, the right side also has the blow-through ventilation that helps as well. Up on the top edge, you can see where some of the heat is being blown out of the top. Then with the backplate view, we can see that the GPU side of the card is transferring some heat through the backplate and out.
Overall and Final Verdict
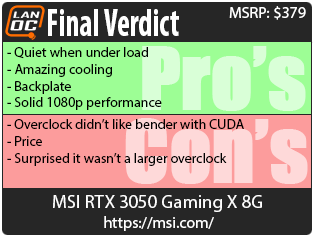
One thing is for sure, when it comes to cooling and noise performance MSI has been on point with their higher-end card models. In the case of the MSI RTX 3050, Gaming X 8G the cooling performance of their dual-fan Twin Frozr 8 cooler kept the new RTX 3050 which isn’t exactly a hot GPU even on its own stay cool enough to be at the bottom of our charts. It did that while also being a lot quieter than I expected when under load. 100% fan speed noise levels were also good but the 50% results were louder than I expected. MSI combined that with a small overclock that was able to gain a few FPS across the board in our testing when compared to the stock clocked EVGA RTX 3050 that I took a look at for the 3050 launch. The overclock wasn’t the biggest, in fact, I really thought with the much larger cooler the 3050 Gaming X would have a bigger overclock. But I think MSI was aiming to still keep the GPU power limit close to the stock limit. This did seem to affect bender performance when using CUDA which was the one result in which the overclock ended up being slower than the stock clocked card. Overall though, this is a great card for gaming at 1080p and it didn’t have the same limitations that the AMD 6500 XT has with it having 8GB of VRAM and it at least running with 8 PCI 4.0 lanes.
As for the card design itself. The MSI Gaming design has been consistent for a while now. It is a lot more aggressive than some of the card designs with its angular shapes on the fan shroud and mixing in multiple shades of grey along with black for even more depth compared to some simple blacked-out designs. But it isn’t exactly super flashy either, it doesn’t even have a lot of the RGB lighting that higher-end MSI Gaming cards have, the 3050 Gaming X just has the top MSI logo lit up. Compared to the EVGA that I took a look at previously, this is a bigger card. But MSI did also slip in a full metal backplate as well which isn’t something you always find on cards in this performance range.
Talking about pricing these days is a tough one because even when we talk about the prices that cards should be selling for. Due to demand and supply issues unless you catch them at restocks even the suggested prices are lower than the actual pricing. But let's talk about the MSRP of the MSI RTX 3050 Gaming X 8G. The base price for the RTX 3050 was $249 and MSI did have their Aero ITX card at that price point. The 3050 Gaming X however does have its overclock, a much larger cooler, and a backplate. The launch price for this card was $379 and a $130 price increase over the base price is a lot for a card in this range. But as much as it pains me to say, that is still a lower price than what the open market is going to go to for these cards. So in other words, I’m not a big fan of the price. But until things calm down, if you are looking to game at 1080p this would still be a good pickup if you can find it at this price.
Live Pricing: HERE


