Cooling Noise and Power
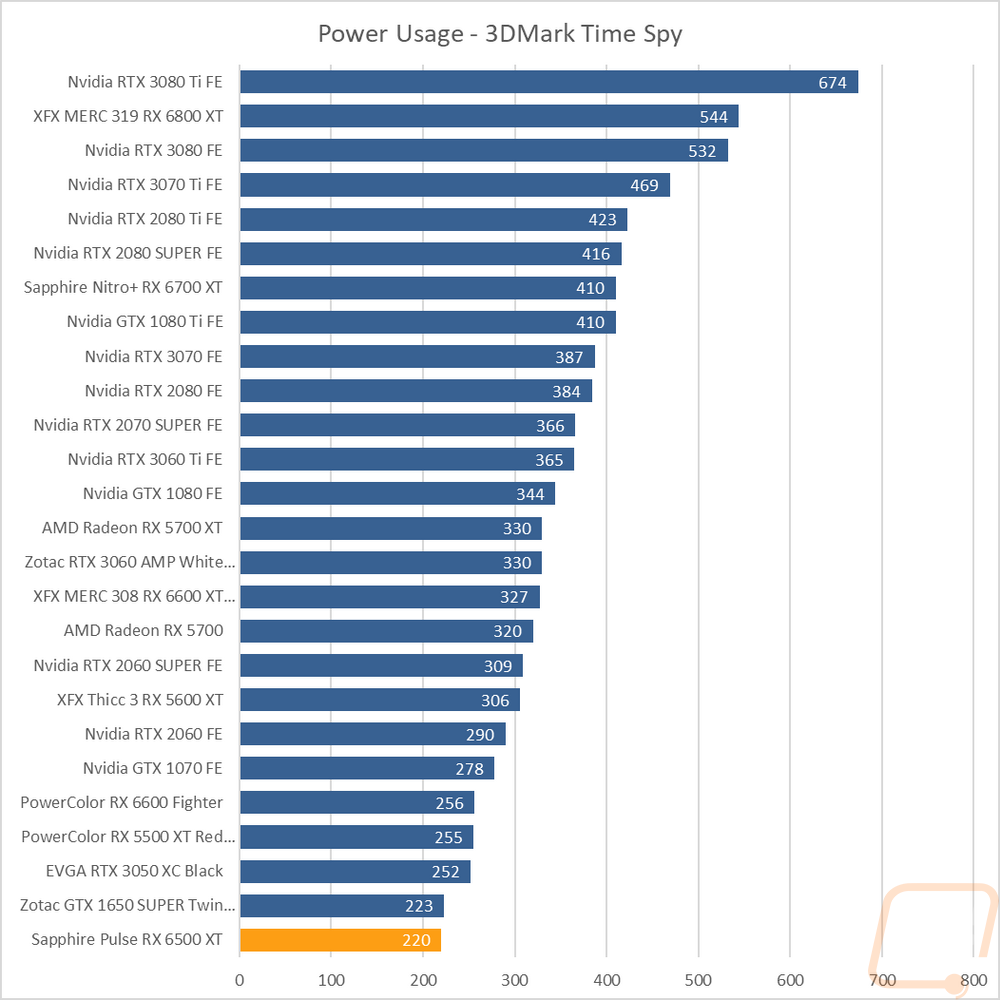
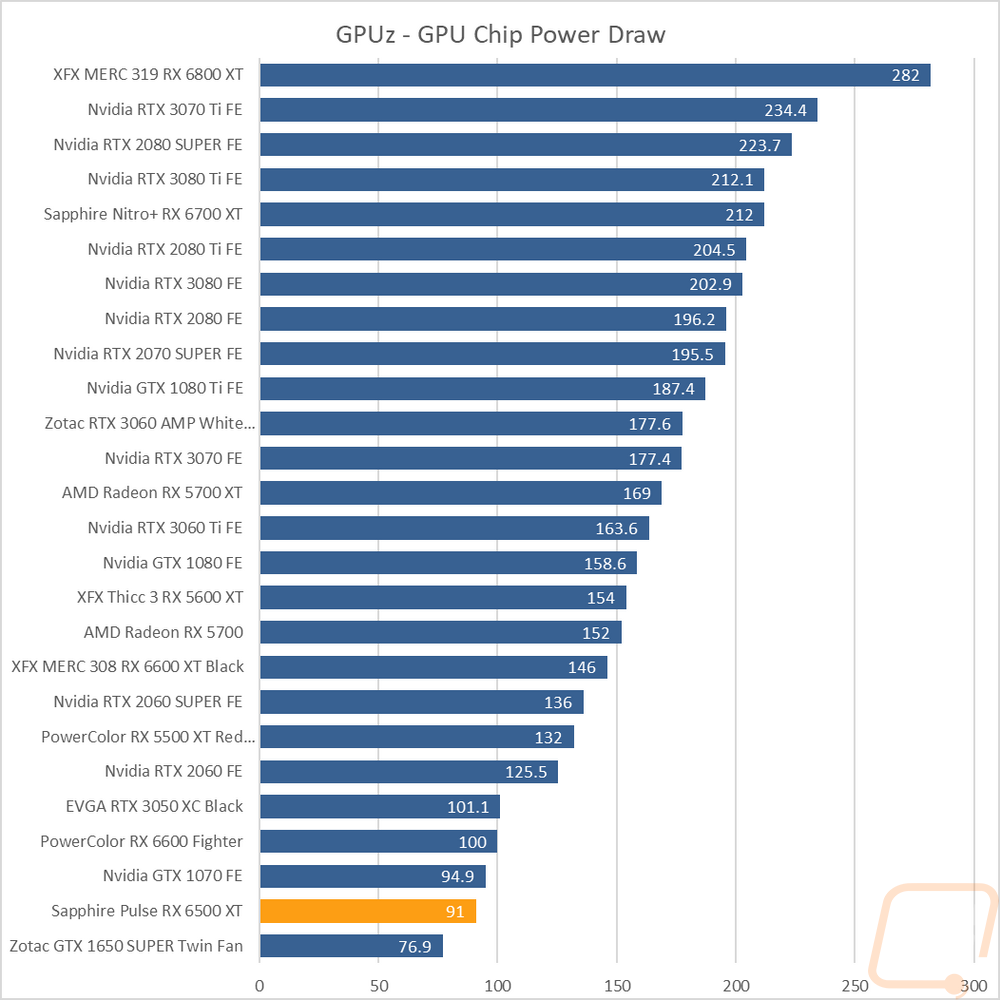
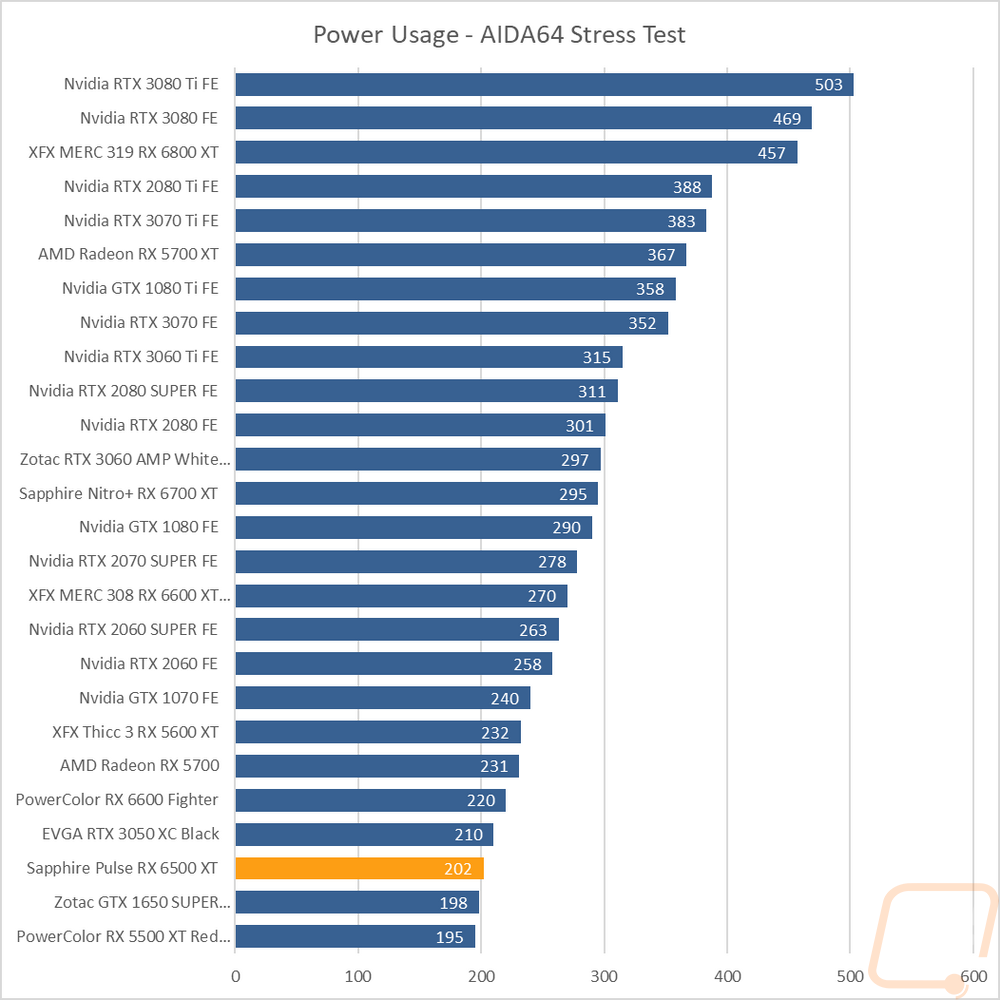
For my last few tests, rather than focusing on in game performance, I like to check out other aspects of video card performance. These are also the most important ways to differentiate the performance between cards that have the same GPU. To start things off I took a look at power usage. For this, I use our Kill-A-Watt hooked up to the test bench to record the total wattage of the system. I ran two tests with the first using 3DMark Time Spy to put the system under a load similar to normal in game performance. Here our test system with the Pulse 6500 XT pulled a total of 220 watts putting it down at the bottom of all of the cards tested with only the GTX 1650 below it. At the same time with Time Spy I also use GPUz to check out the onboard reading for GPU power draw at the chip. The Pulse 6500 XT, even with its overclock was registering 91 watts even, for comparison the 5500 XT ran at 132 watts. Lastly, I run AIDA64’s stress test on the video card to load up only the GPU, and using the Kill-A-Watt the test bench with the Pulse 6500 XT came in at 202 watts, the AIDA 64 workload had the 1650 and 5500 XT both below the Pulse 6500 XT but just a few watts off.
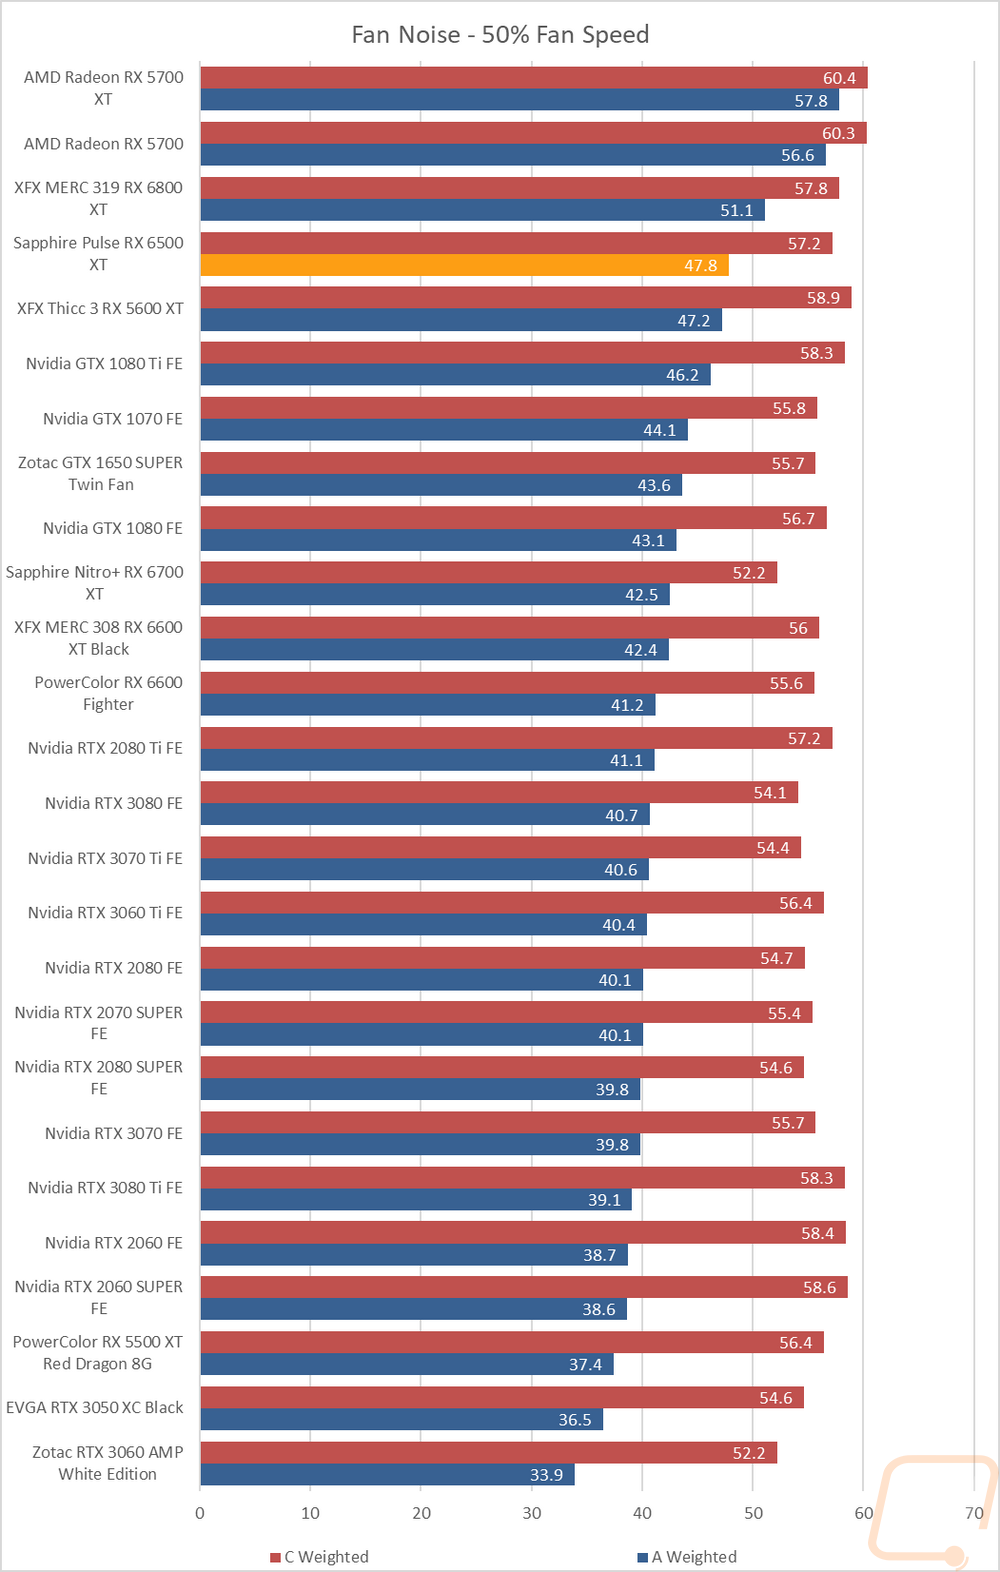
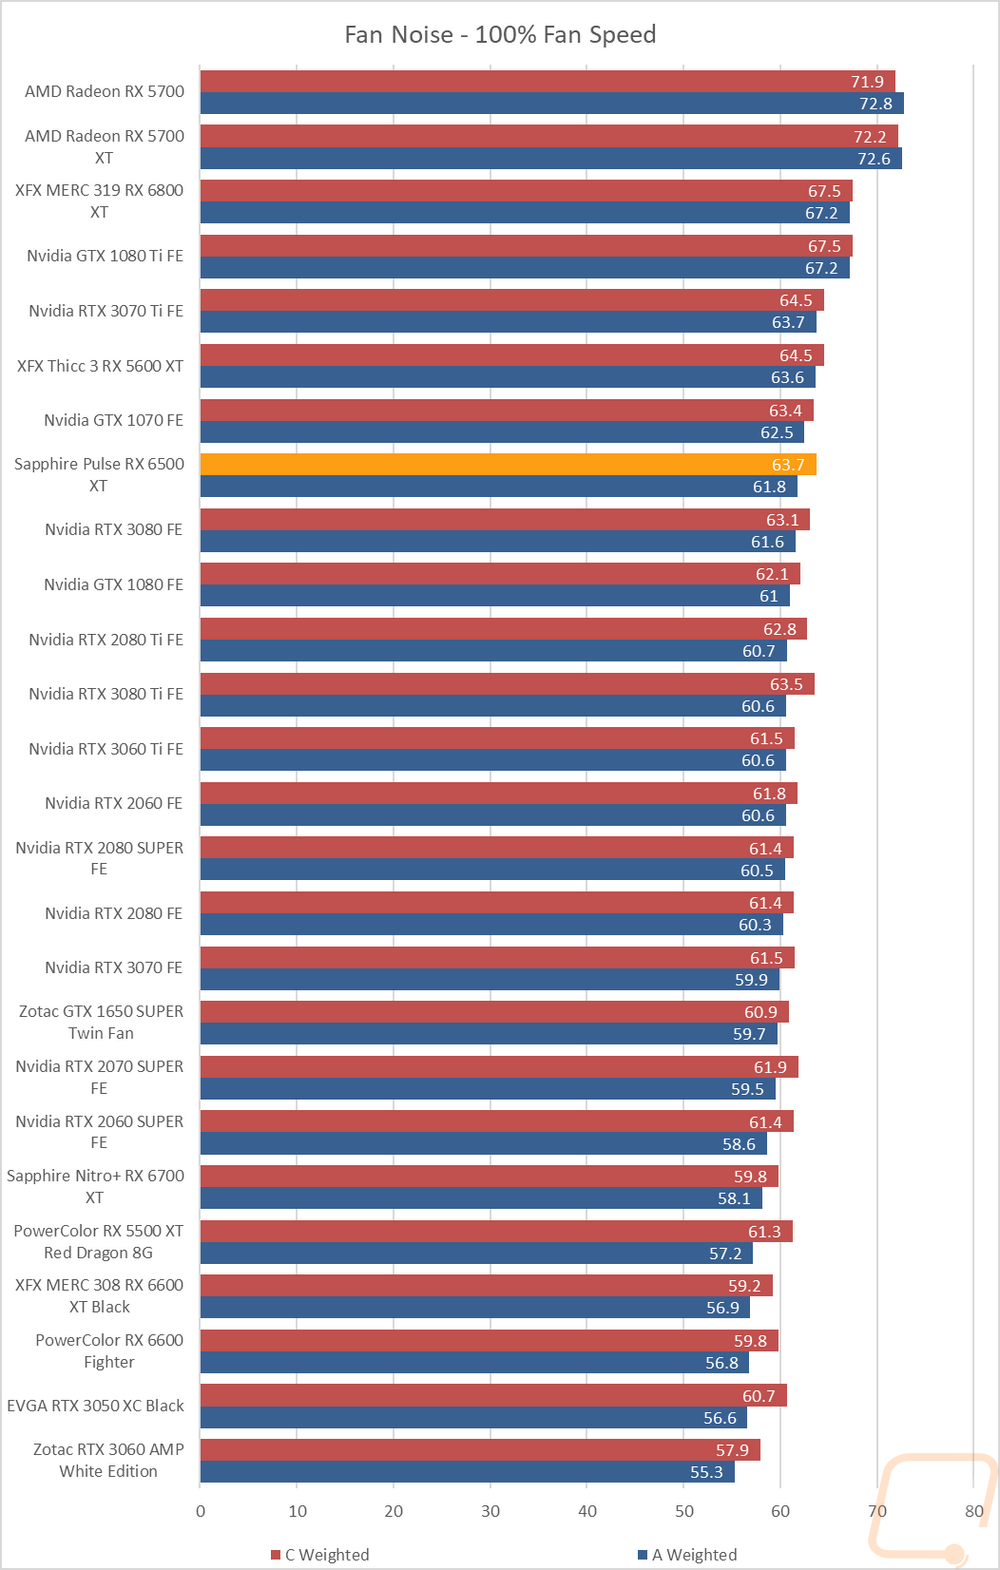
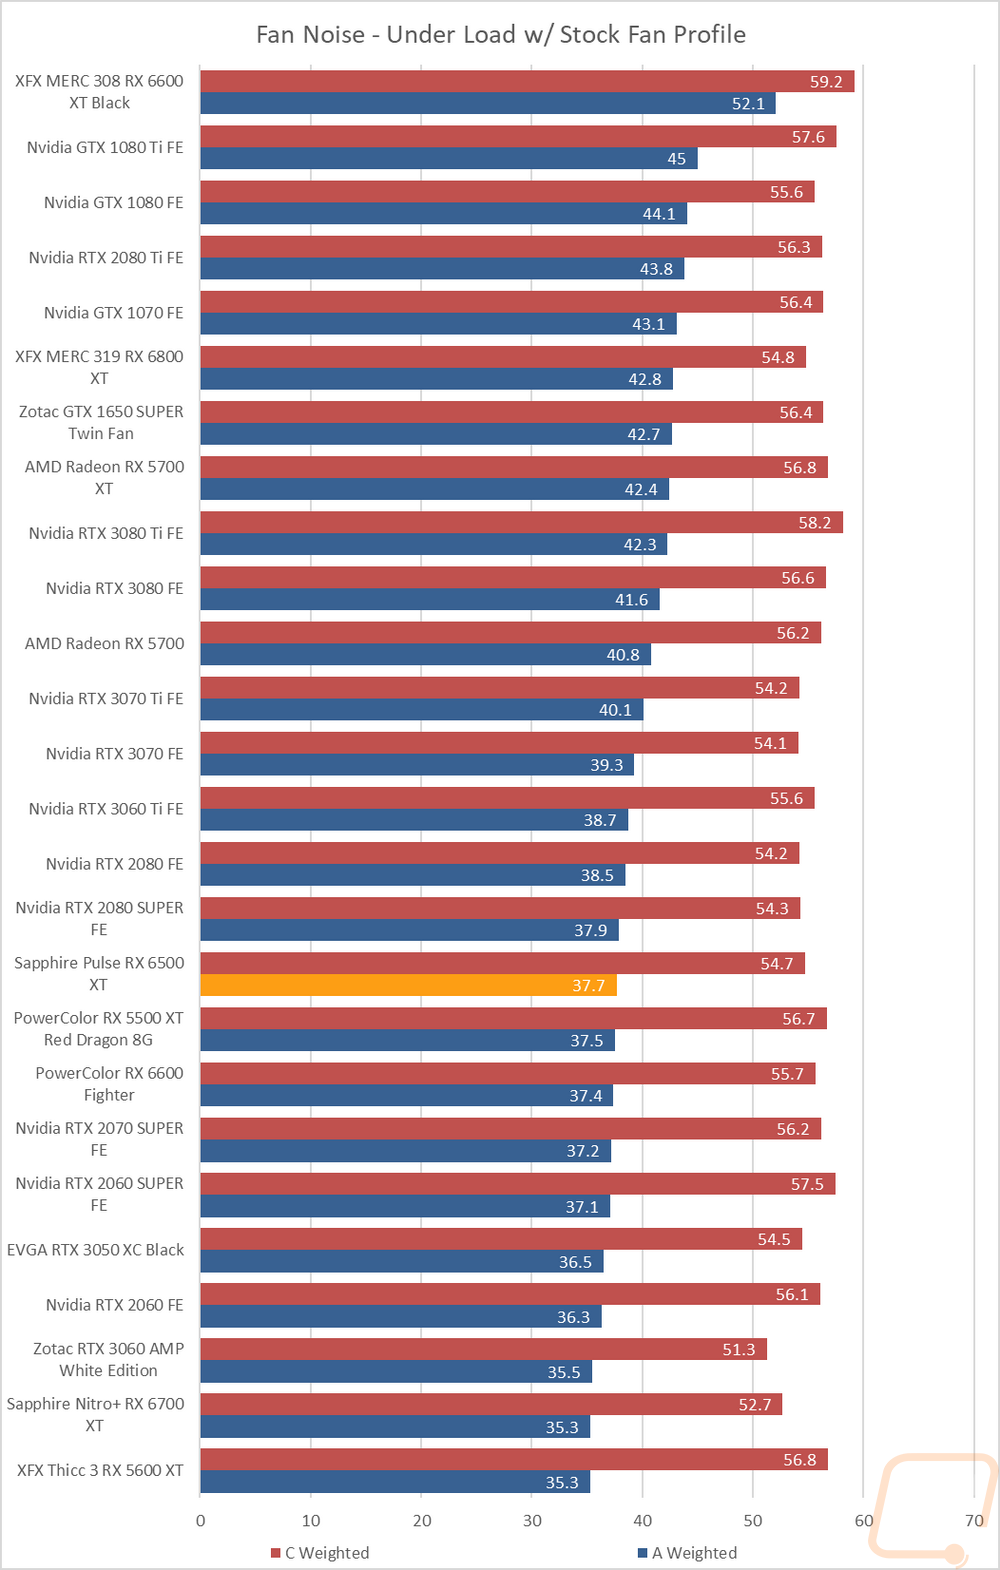
My next round of tests were looking at noise levels. These are especially important to me because I can’t stand to listen to my PC whirling. Especially when I’m not in game and other applications are using the GPU. For my testing, though I first tested with the fan cranked up to 100% to get an idea of how loud it can get, then again at 50% to get an idea of its range. I test using both A and C weighting, A is the standard way and C has a little more of the low end to check for low-level hums. The Pulse 6500 XT was a lot louder than I expected in the 50% fan speed test when doing the standard A weight. The card did better when adding in the lower frequencies with the C weighting but was still in the middle of the pack there. The Pulse 6500 XT was up in the same range when I cranked up the fan speed up to 100% with it coming in at 61.8 decibels with the A-weighting. This put it in the middle of all of the dual fan reference/founders edition cards and not down with most of the aftermarket cards. I also take a look at noise performance while under load. For that when running AIDA64’s stress test I wait until the temperature of the card has leveled off and then measure how loud things are when the card is at its worst case scenario with the stock fan profile. Here the Pulse 6500 XT did much better, running right with the PowerColor 5500 XT.
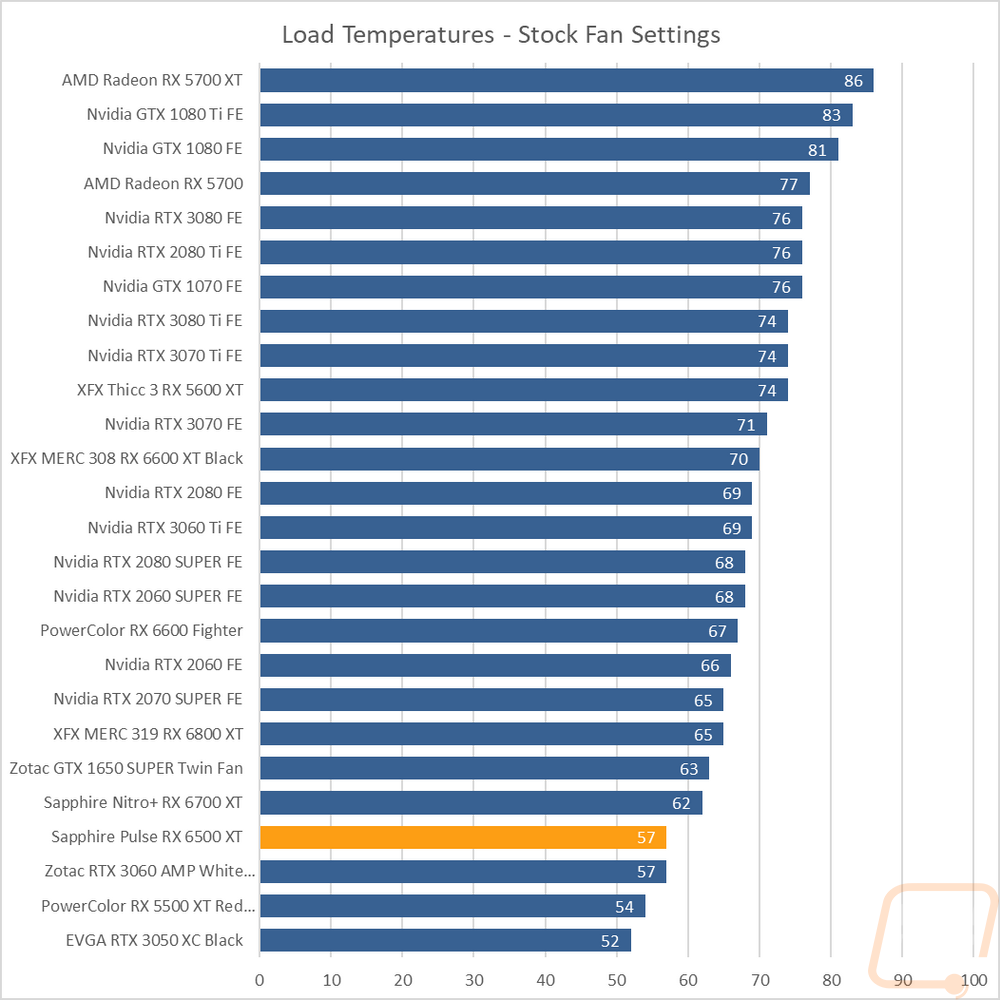
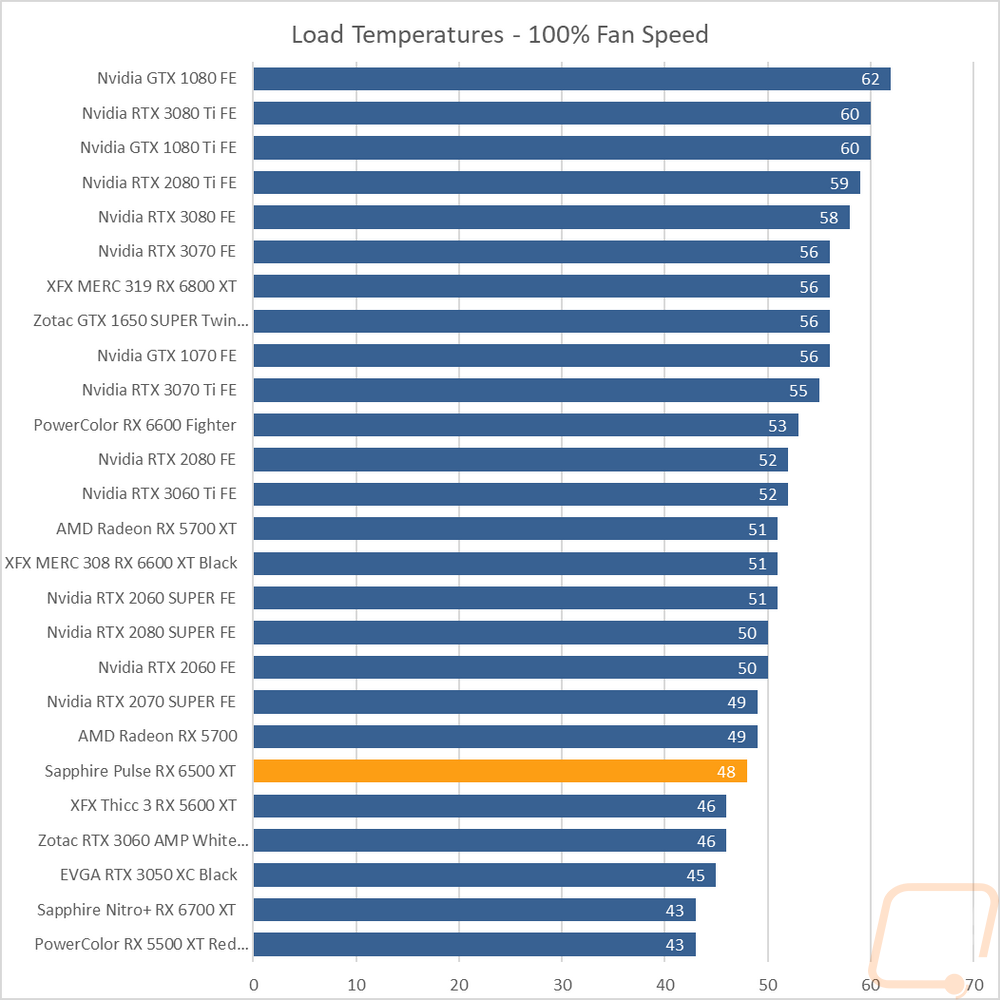
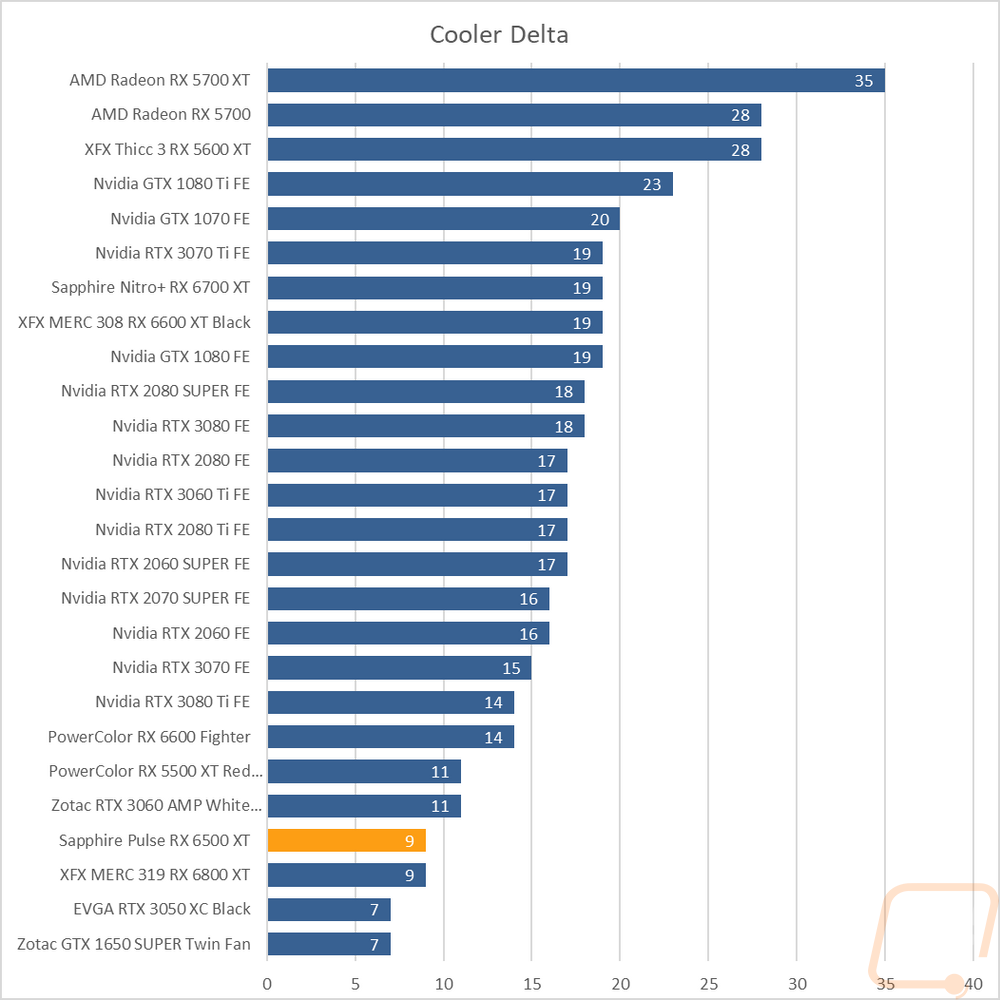
To finish up my testing I of course had to check out the cooling performance. To do this I ran two different tests. I used AIDA64’s Stress Test run for a half-hour each to warm things up. Then I documented what temperature the GPU leveled out at with the stock fan profile and then again with the fans cranked up to 100%. With the stock profile, the Pulse 6500 XT leveled off at 57c. This was 3 degrees higher than our 5500 XT and 5 above the EVGA stock clocked RTX 3050. Overall this is running cool, but given how much quieter the Pulse 6500 XT was in my noise testing on the stock fan profile than with the 50% or 100% fan tests their fan profile seems to be more focused on keeping things quiet. I don’t think that is a bad choice either. Then with the fans cranked up, the Pulse 6500 XT ran cooler at 48c but here it moved up in the chart a little. I suspect the horizontal heatsink layout plays a role here, like I said previously those cooler designs always run a little warmer from what I’ve seen. Even still, the Pulse 6500 XT isn’t exactly running hot. But the delta between the two tests shows that most cards have a wider gap between results.
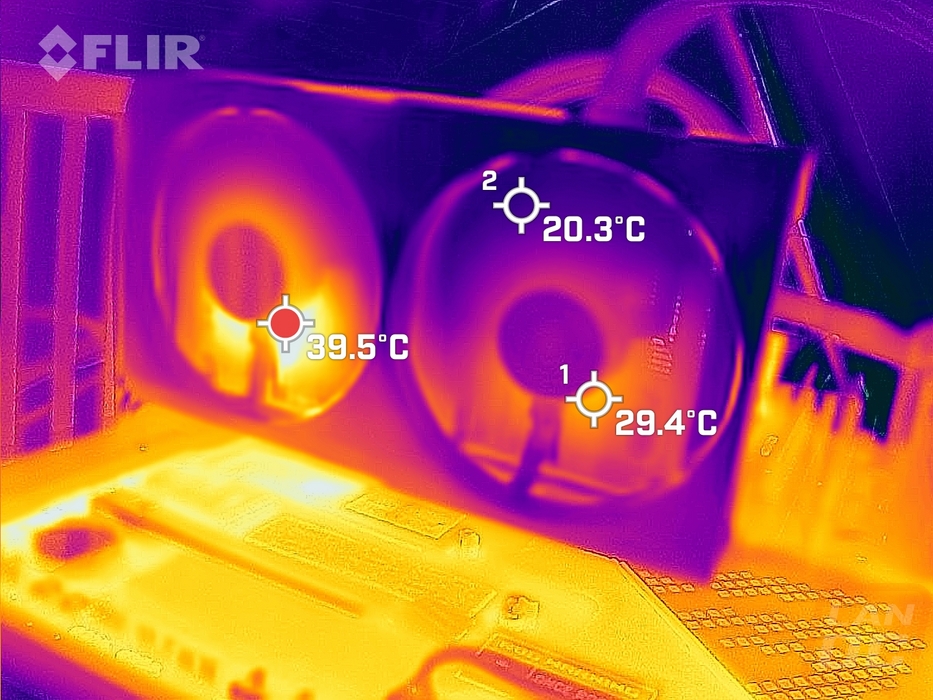
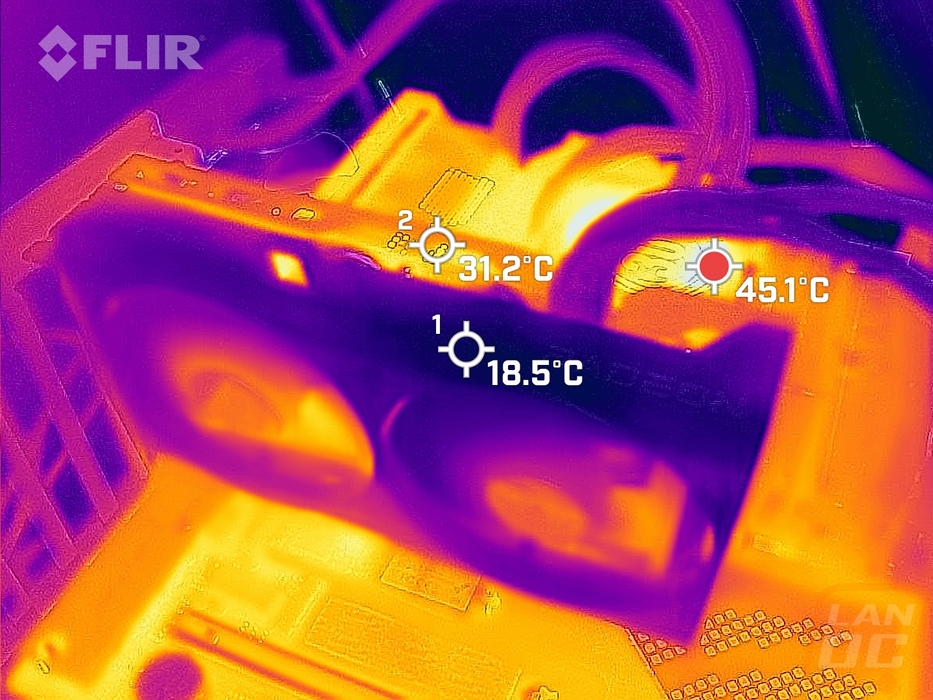
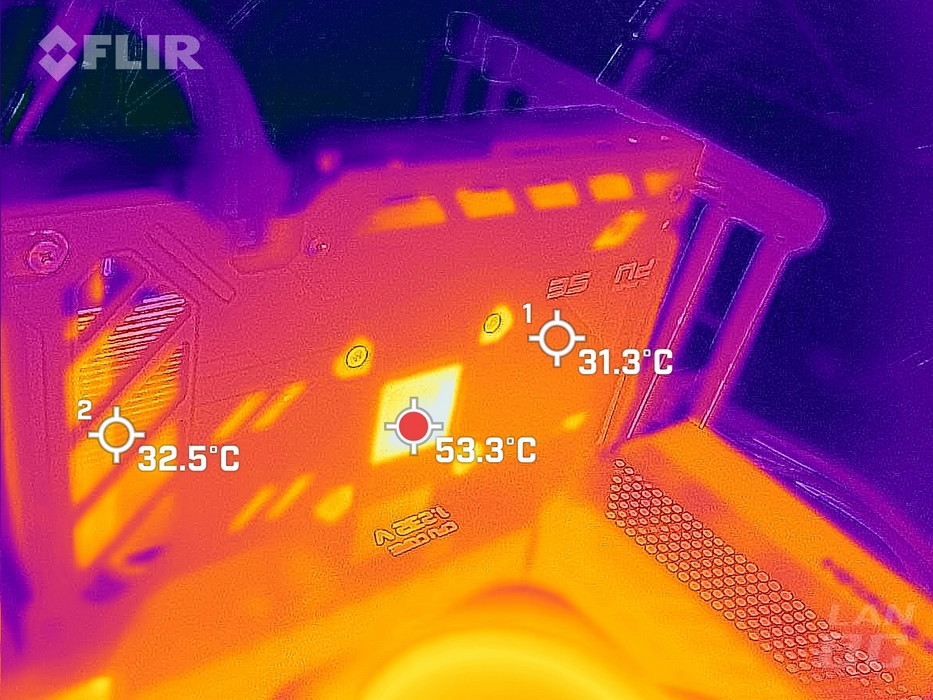
While running the stock fan profile testing I also took the time to get a few thermal images so we could see what is going on. With the fan side thermal image on the Pulse 6500 XT, it is clear that the left side is handling more heat load and having a harder time cooling things down. The right side does have easier airflow with the blow-through section on the PCB and backplate which helps. But the left side has the same heat from the GPU as well as all of the VRMs on that side. The top view shows there isn’t too much air blowing out of the top or bottom of the card and that the horizontal layout is doing its job pushing the air towards the two ends of the card. Then on the back the exposed back of the GPU mounting location is obviously the hottest spot on the card. There is some thermal transfer to the metal backplate with the bottom half of the backplate running a little warmer. We can also see the blow-through section is doing just that on the far end of the card.