In-Game Benchmarks
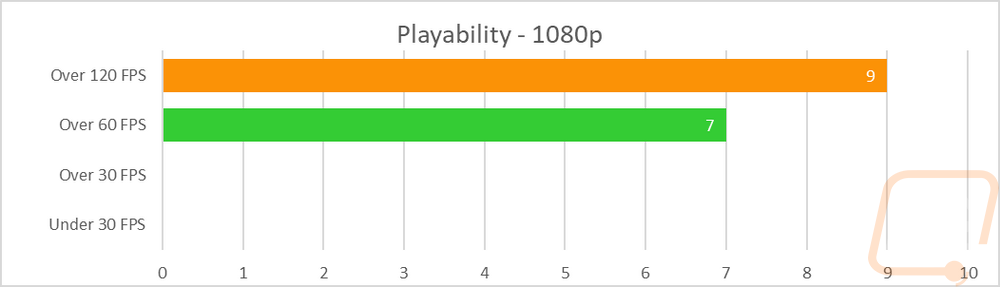
Now we finally get into the in game performance and that is the main reason people pick up a new video card. To test things out I ran through our new benchmark suite that tests 9 games at three different resolutions (1080p, 1440p, and 4k). Most of the games tested have been run at the highest detail setting and a mid-range detail setting to get a look at how turning things up hurts performance and to give an idea of if turning detail down from max will be beneficial for frame rates. In total, each video card is tested 48 times and that makes for a huge mess of results when you put them all together. To help with that I like to start with these overall playability graphs that take all of the results and give an easier to read result. I have one for each of the three resolutions and each is broken up into four FPS ranges. Under 30 FPS is considered unplayable, over 30 is playable but not ideal, over 60 is the sweet spot, and then over 120 FPS is for high refresh rate monitors.
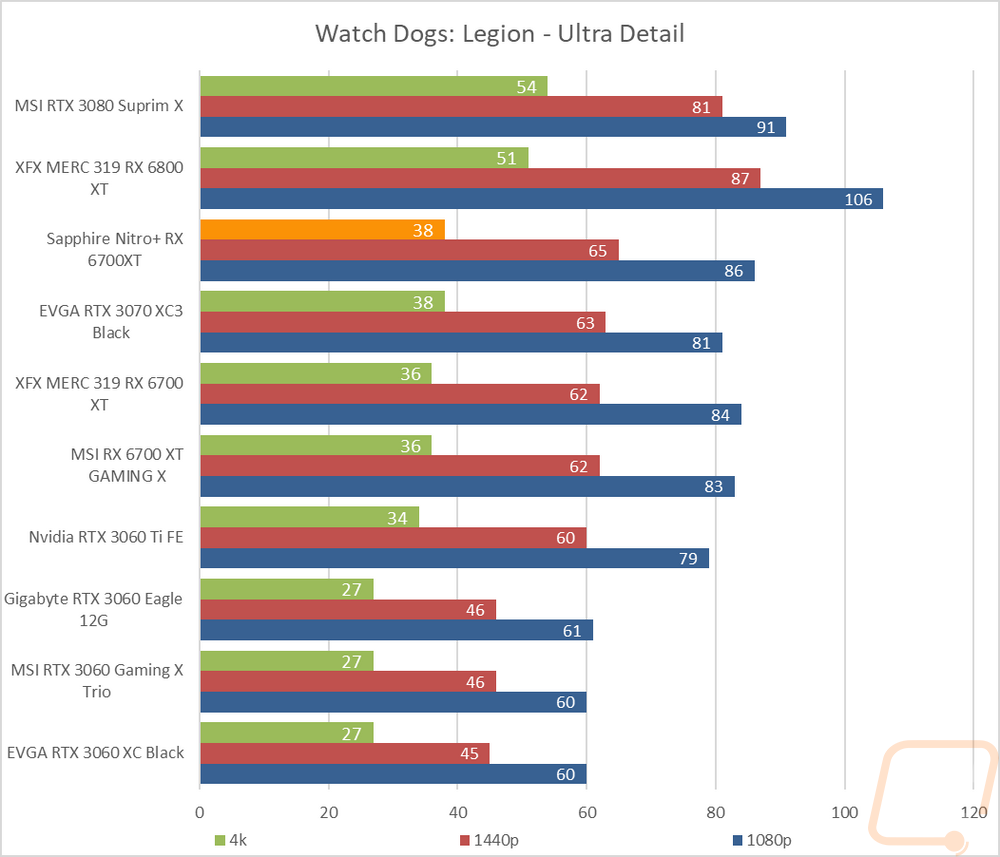
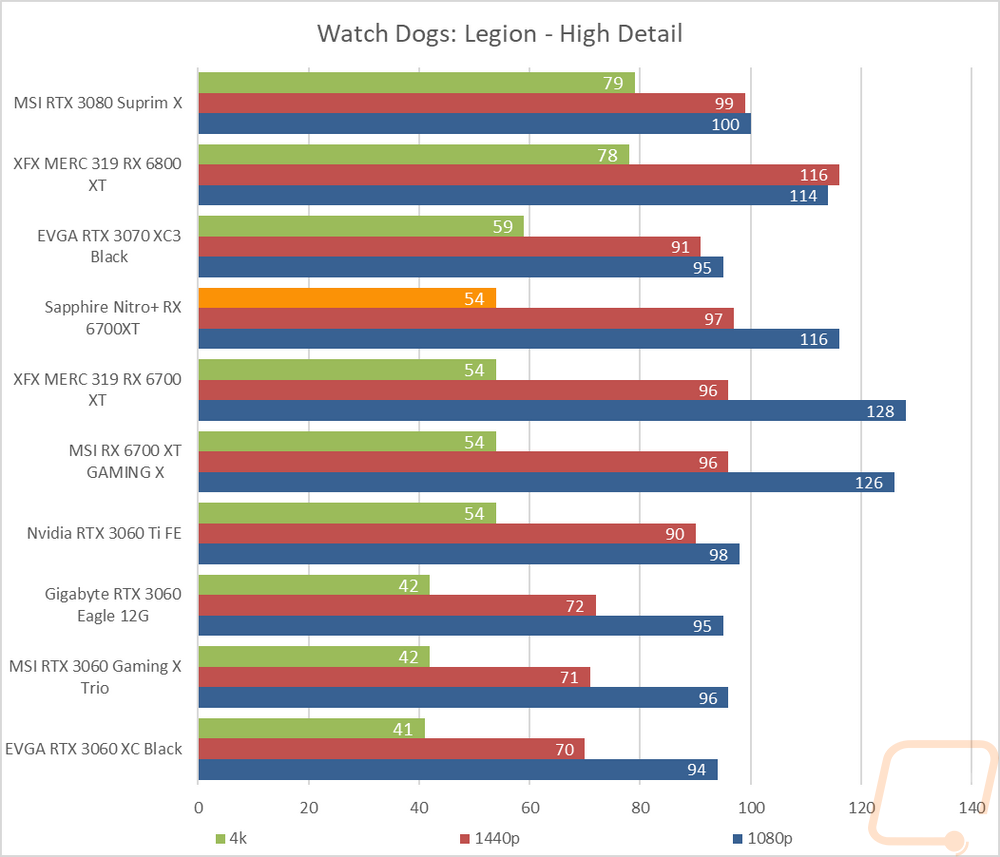
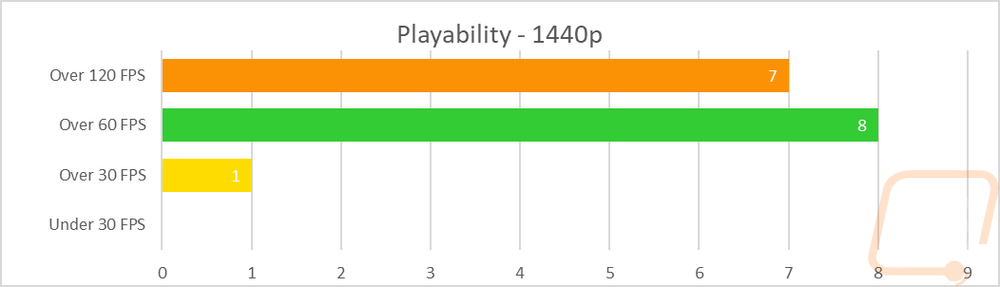
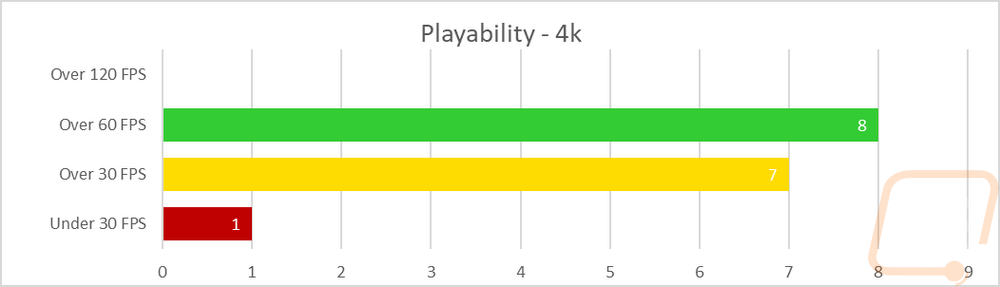
So how did the Nitro+ 6700XT do? There weren’t any big surprises here. The Nitro+ 6700XT kicked butt with all of the 1080p benchmarks with 9 coming in over 120 FPS for those high refresh rate monitors and 7 over 60 FPS. None of the results being less than buttery smooth. The Nitro+ 6700XT did have one less game up under 120 compared to the two other 6700XT’s and that was in Watch Dogs Legion on the high detail with it coming in just barely under 120 FPS. The 1440p performance wasn’t too bad as well with 6 tests up over 120 FPS and 8 over 60. There was one result in the 30-59 FPS range but that isn’t bad at all considering the games tested. Then at 4K, the Nitro+ 6700XT was still able to handle things, only more were in the 30-59 FPS range with 8 over 60 and 7 in the 30-59 range and then one result was up under 30 FPS. Overall this is a solid 1440p card that isn’t going to leave you hanging if you upgrade your monitor to 4K later.
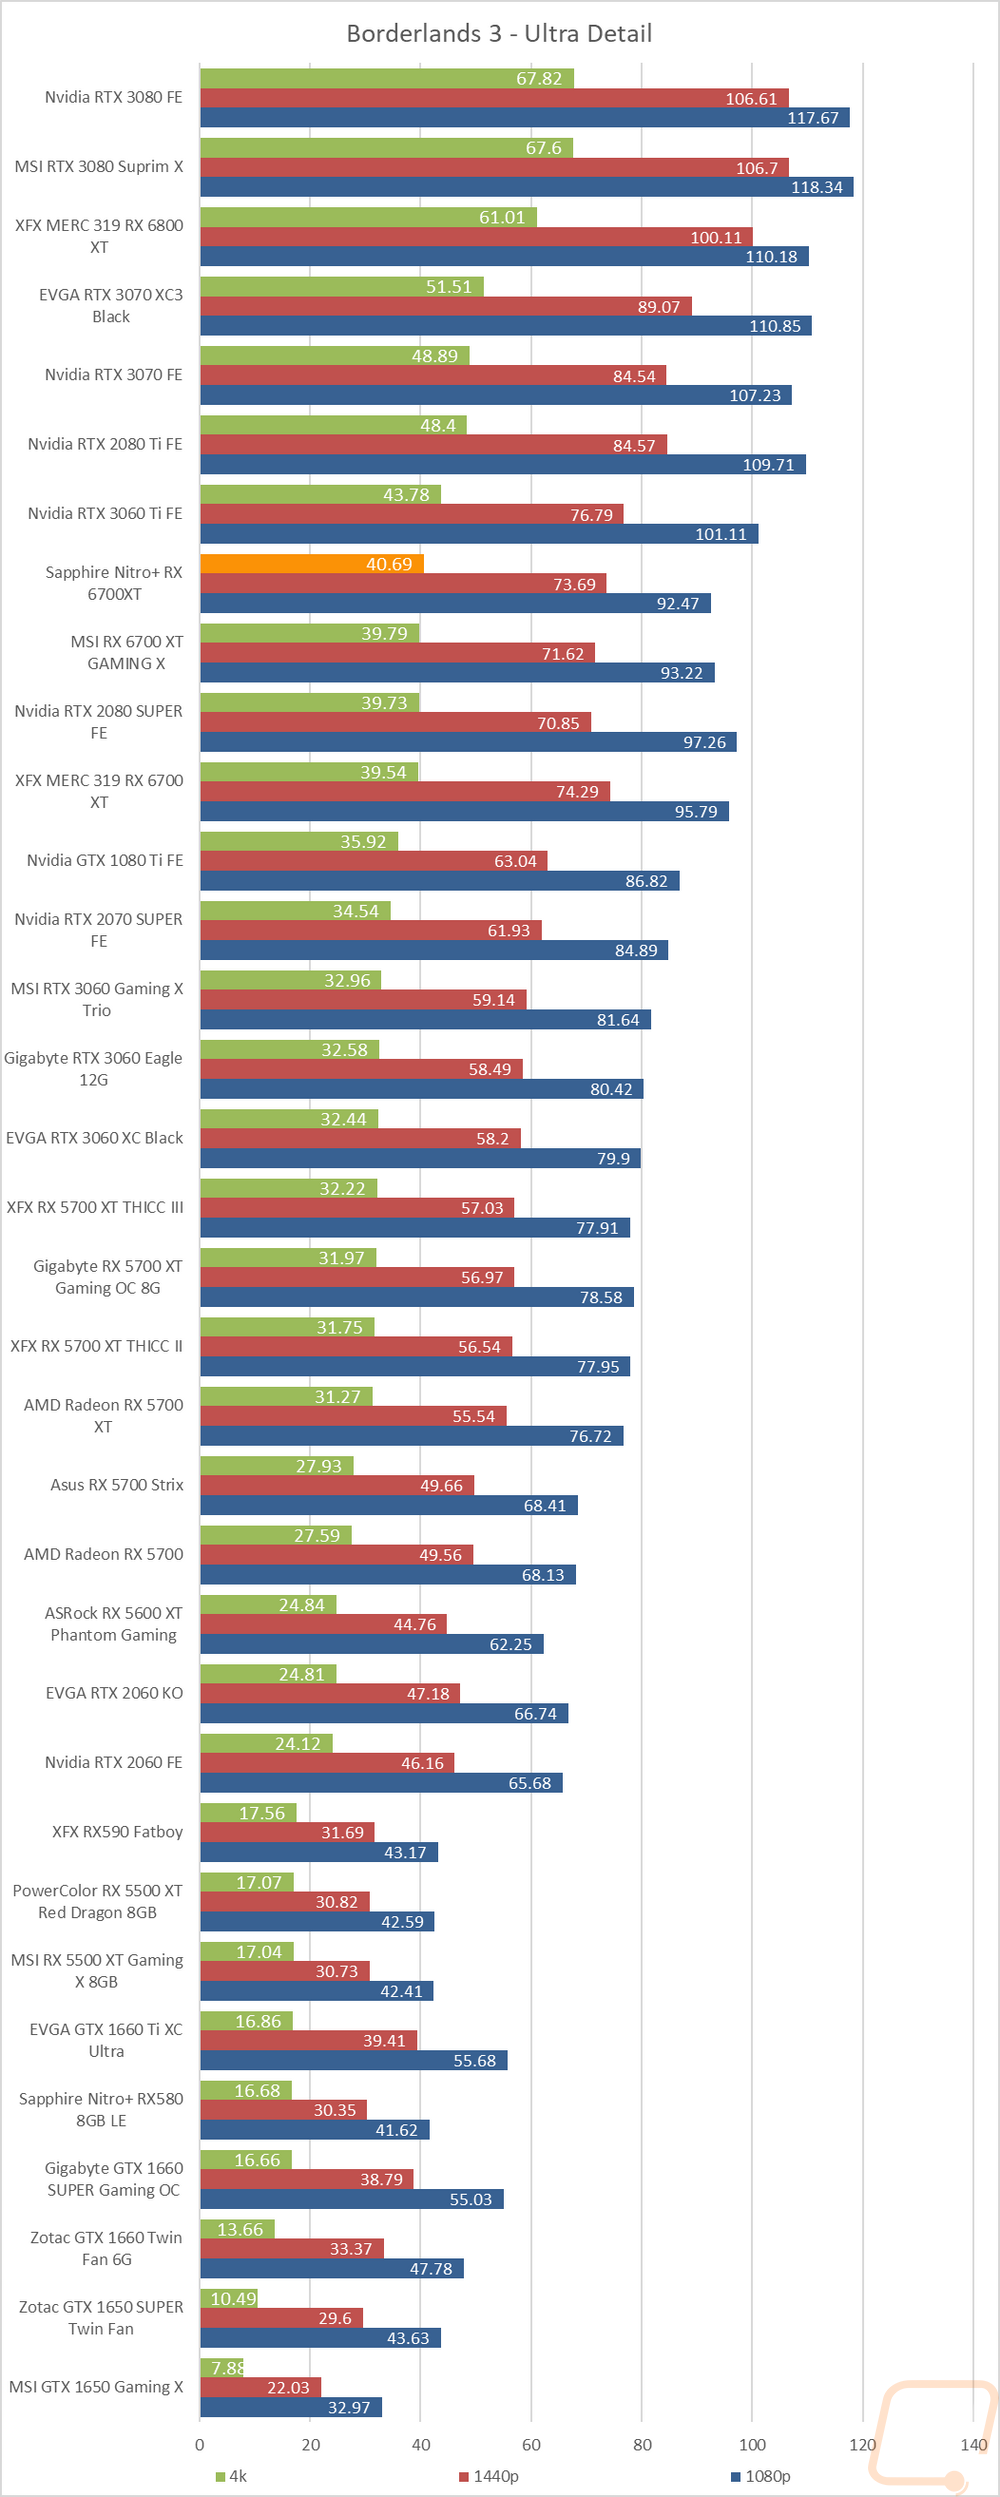
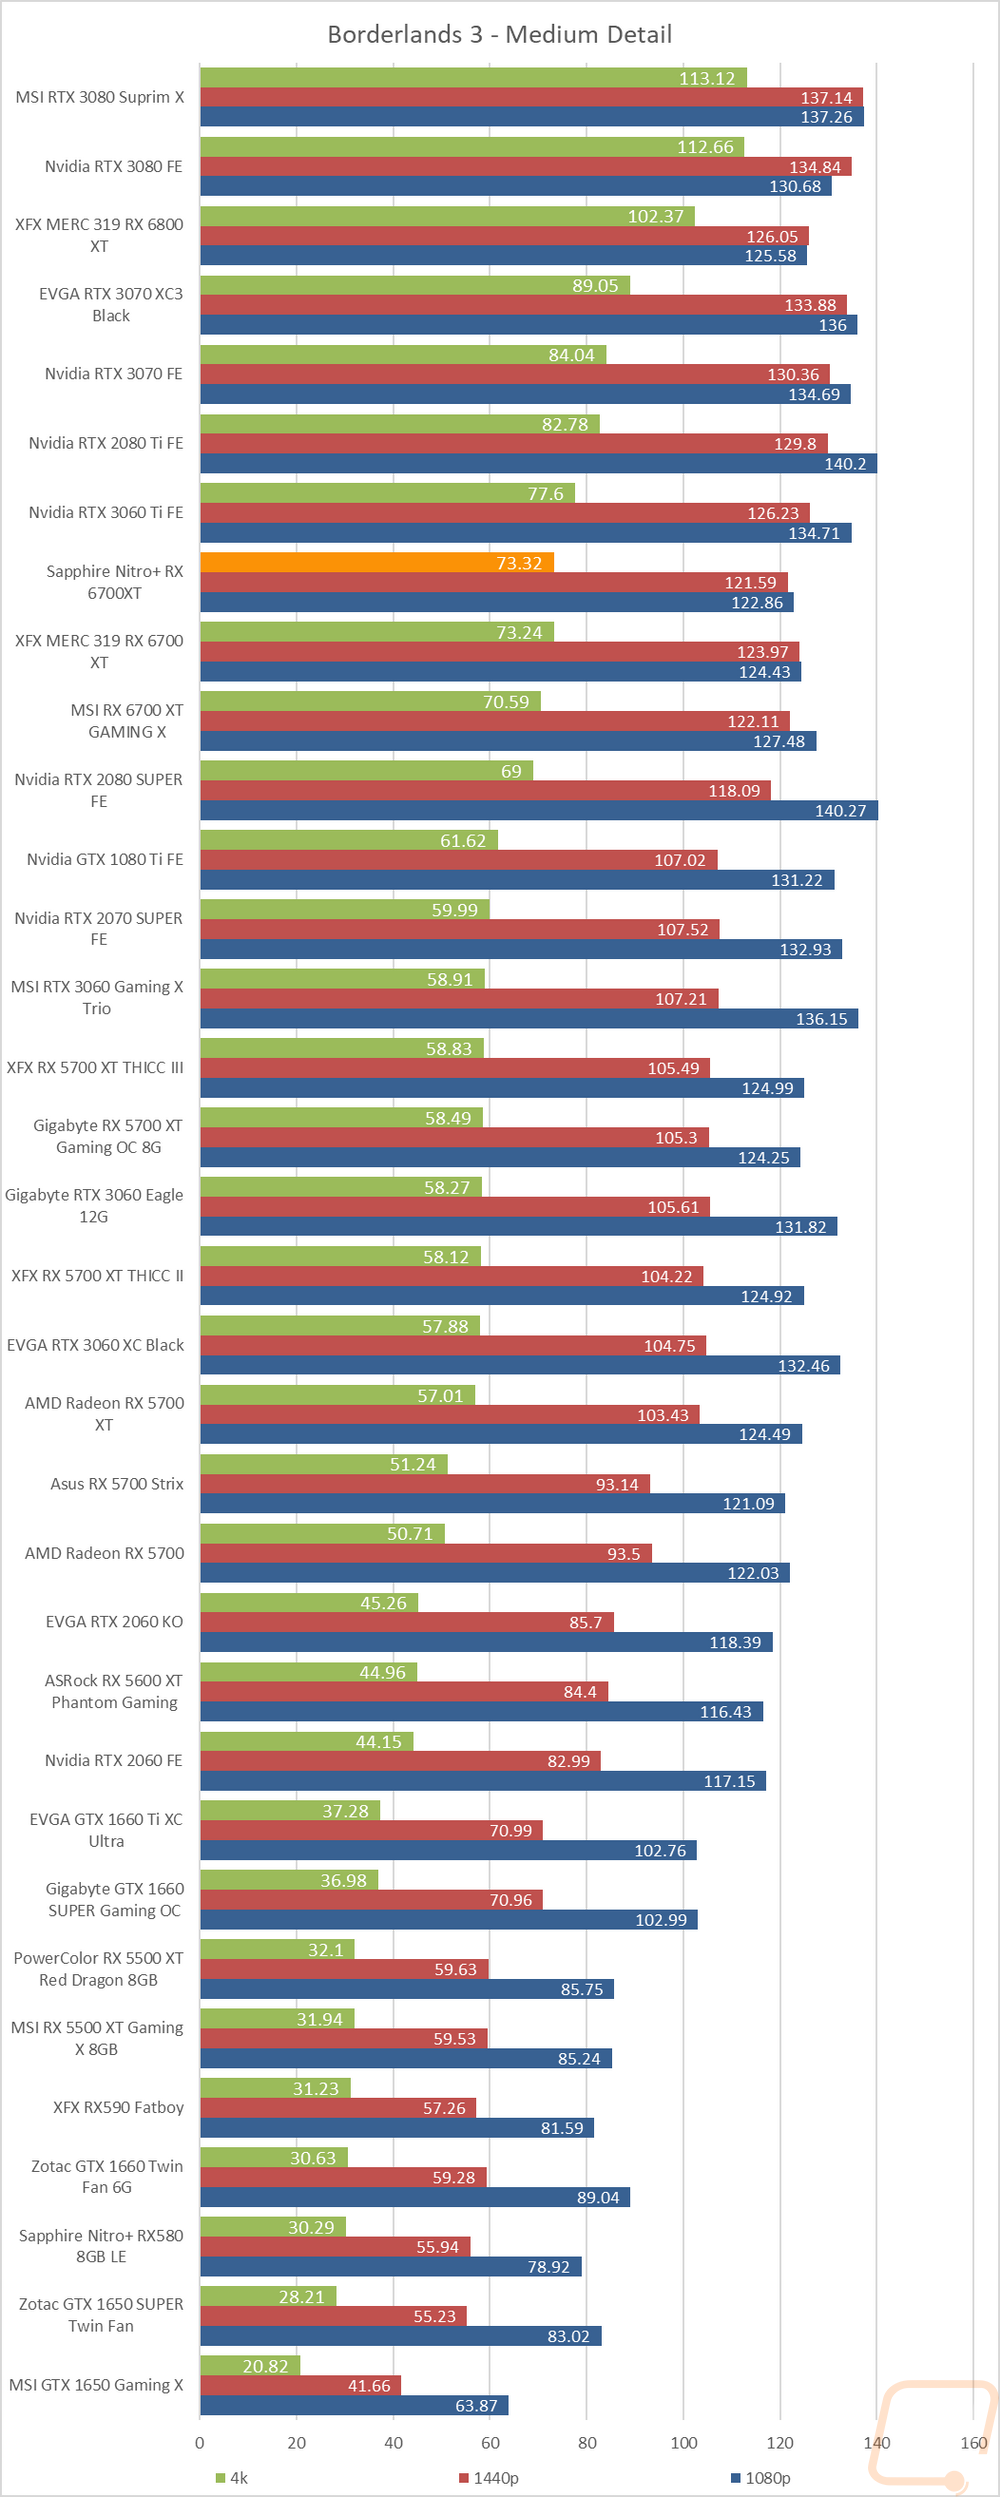
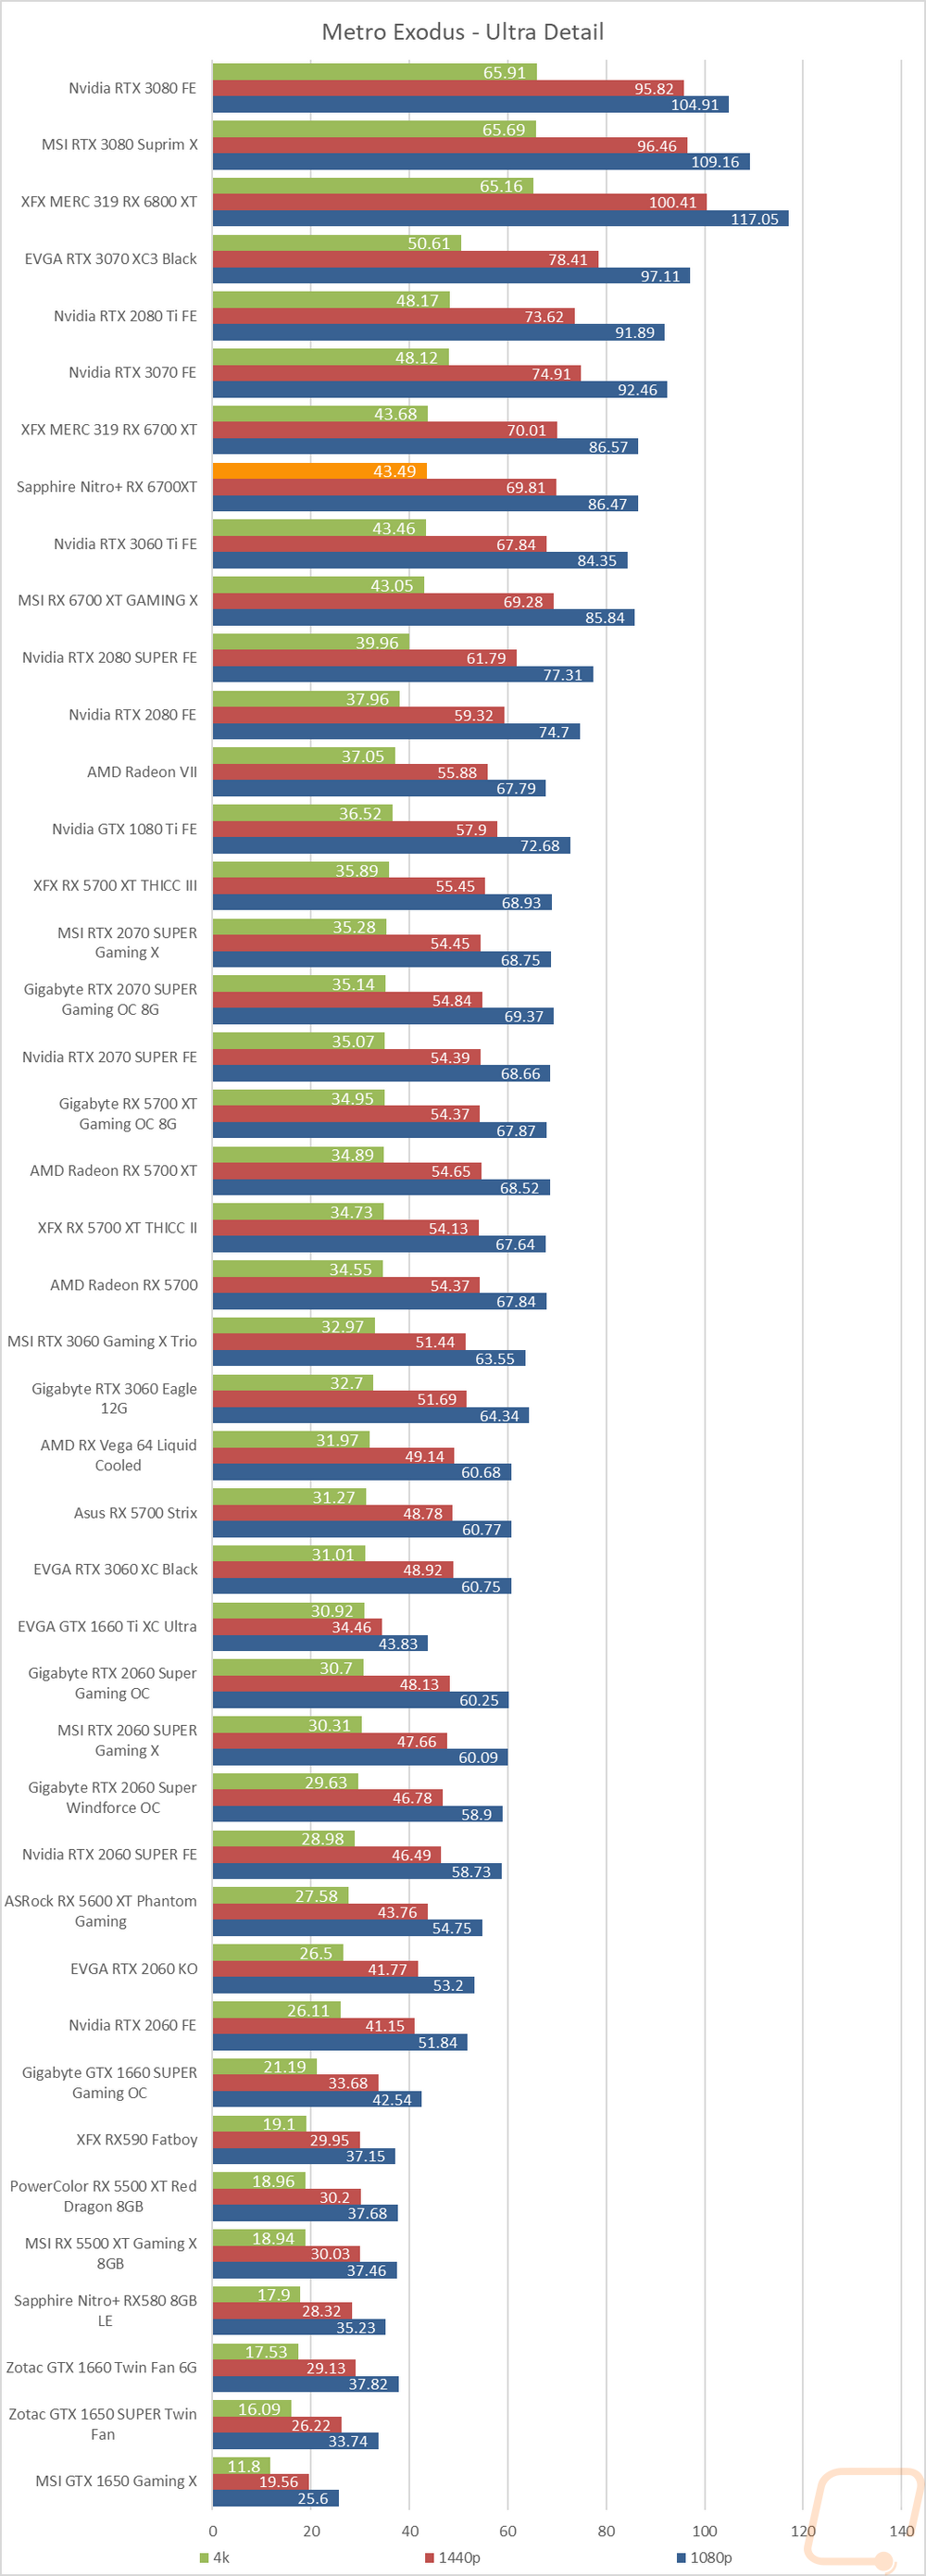
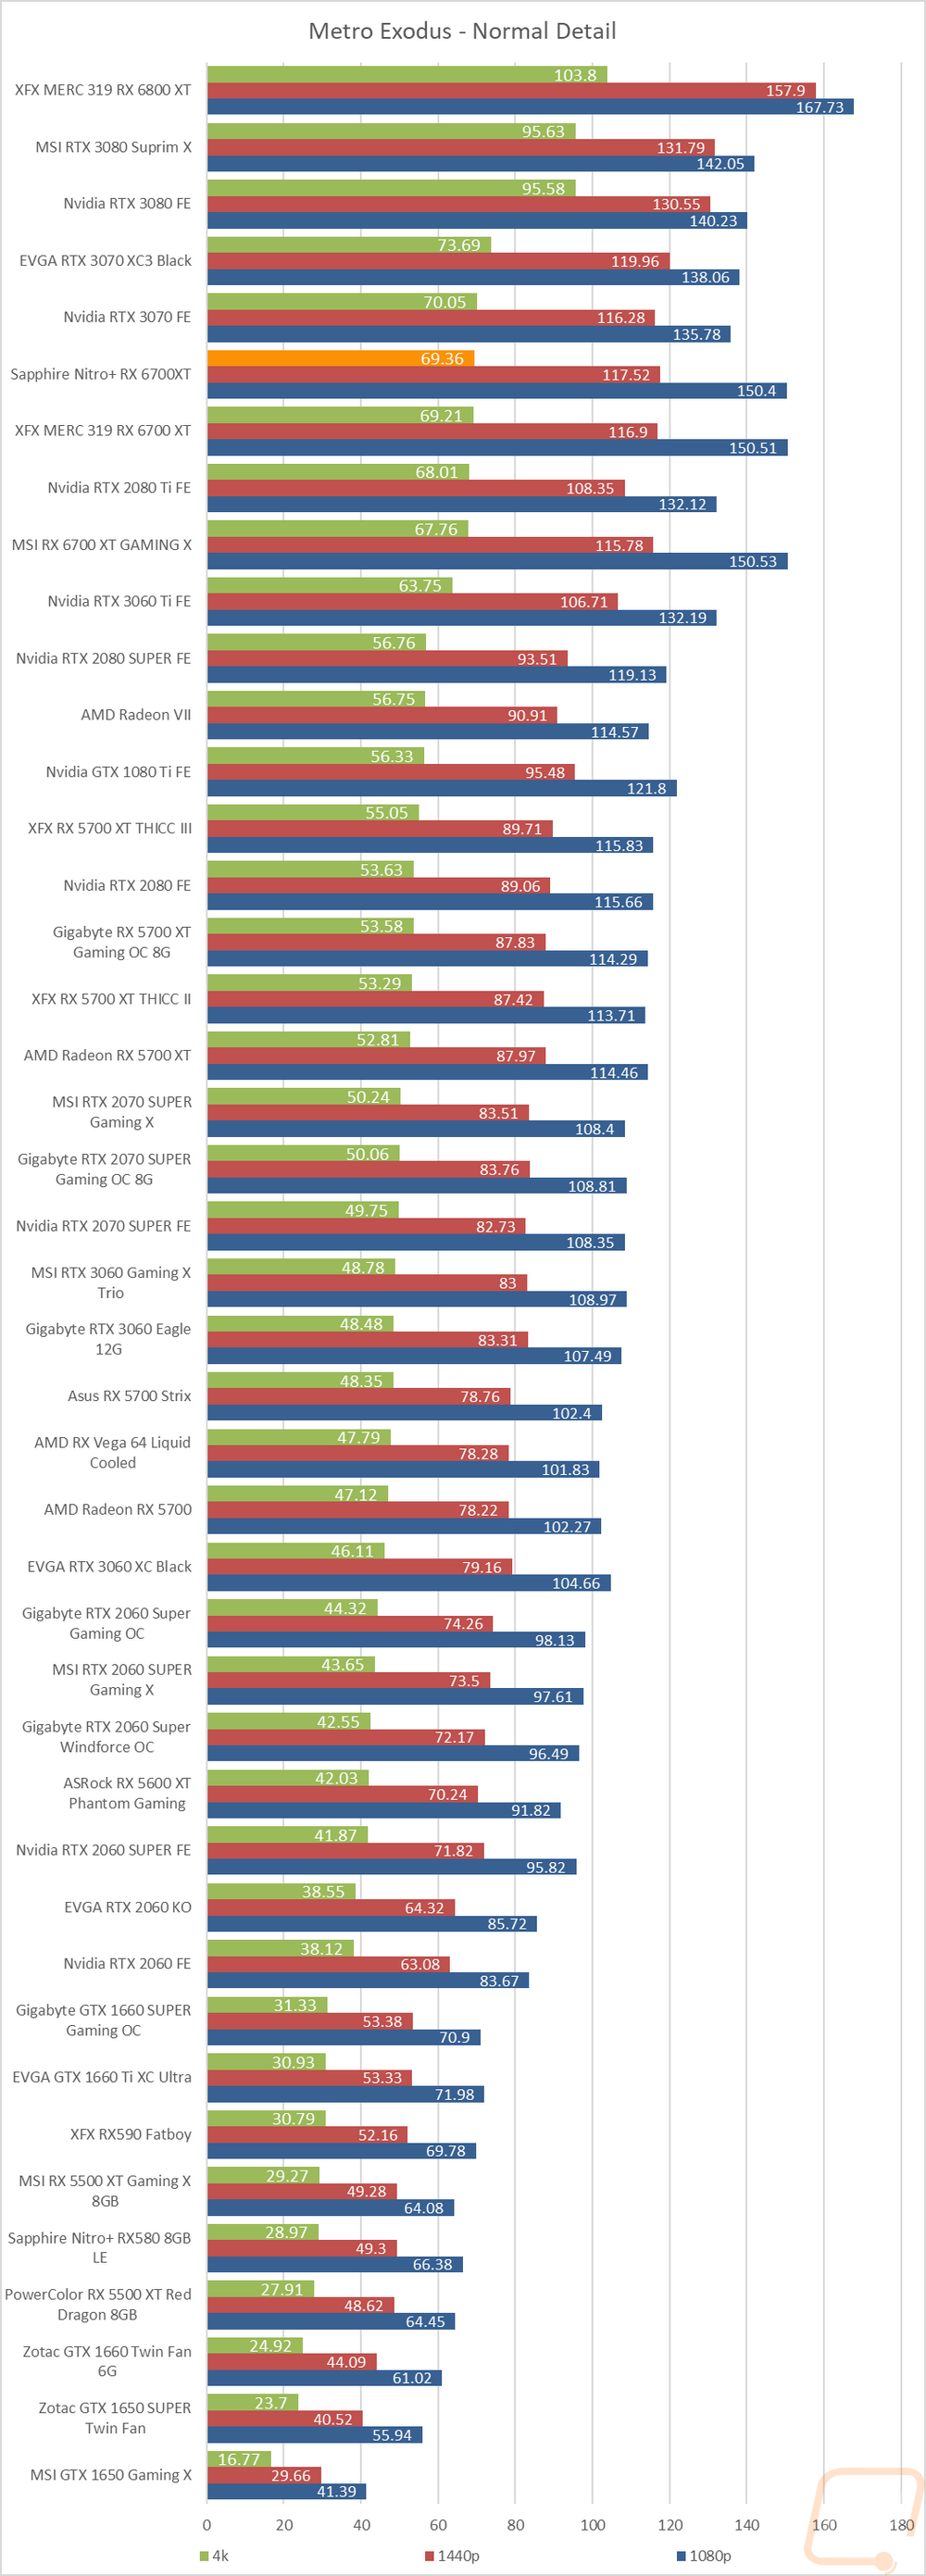
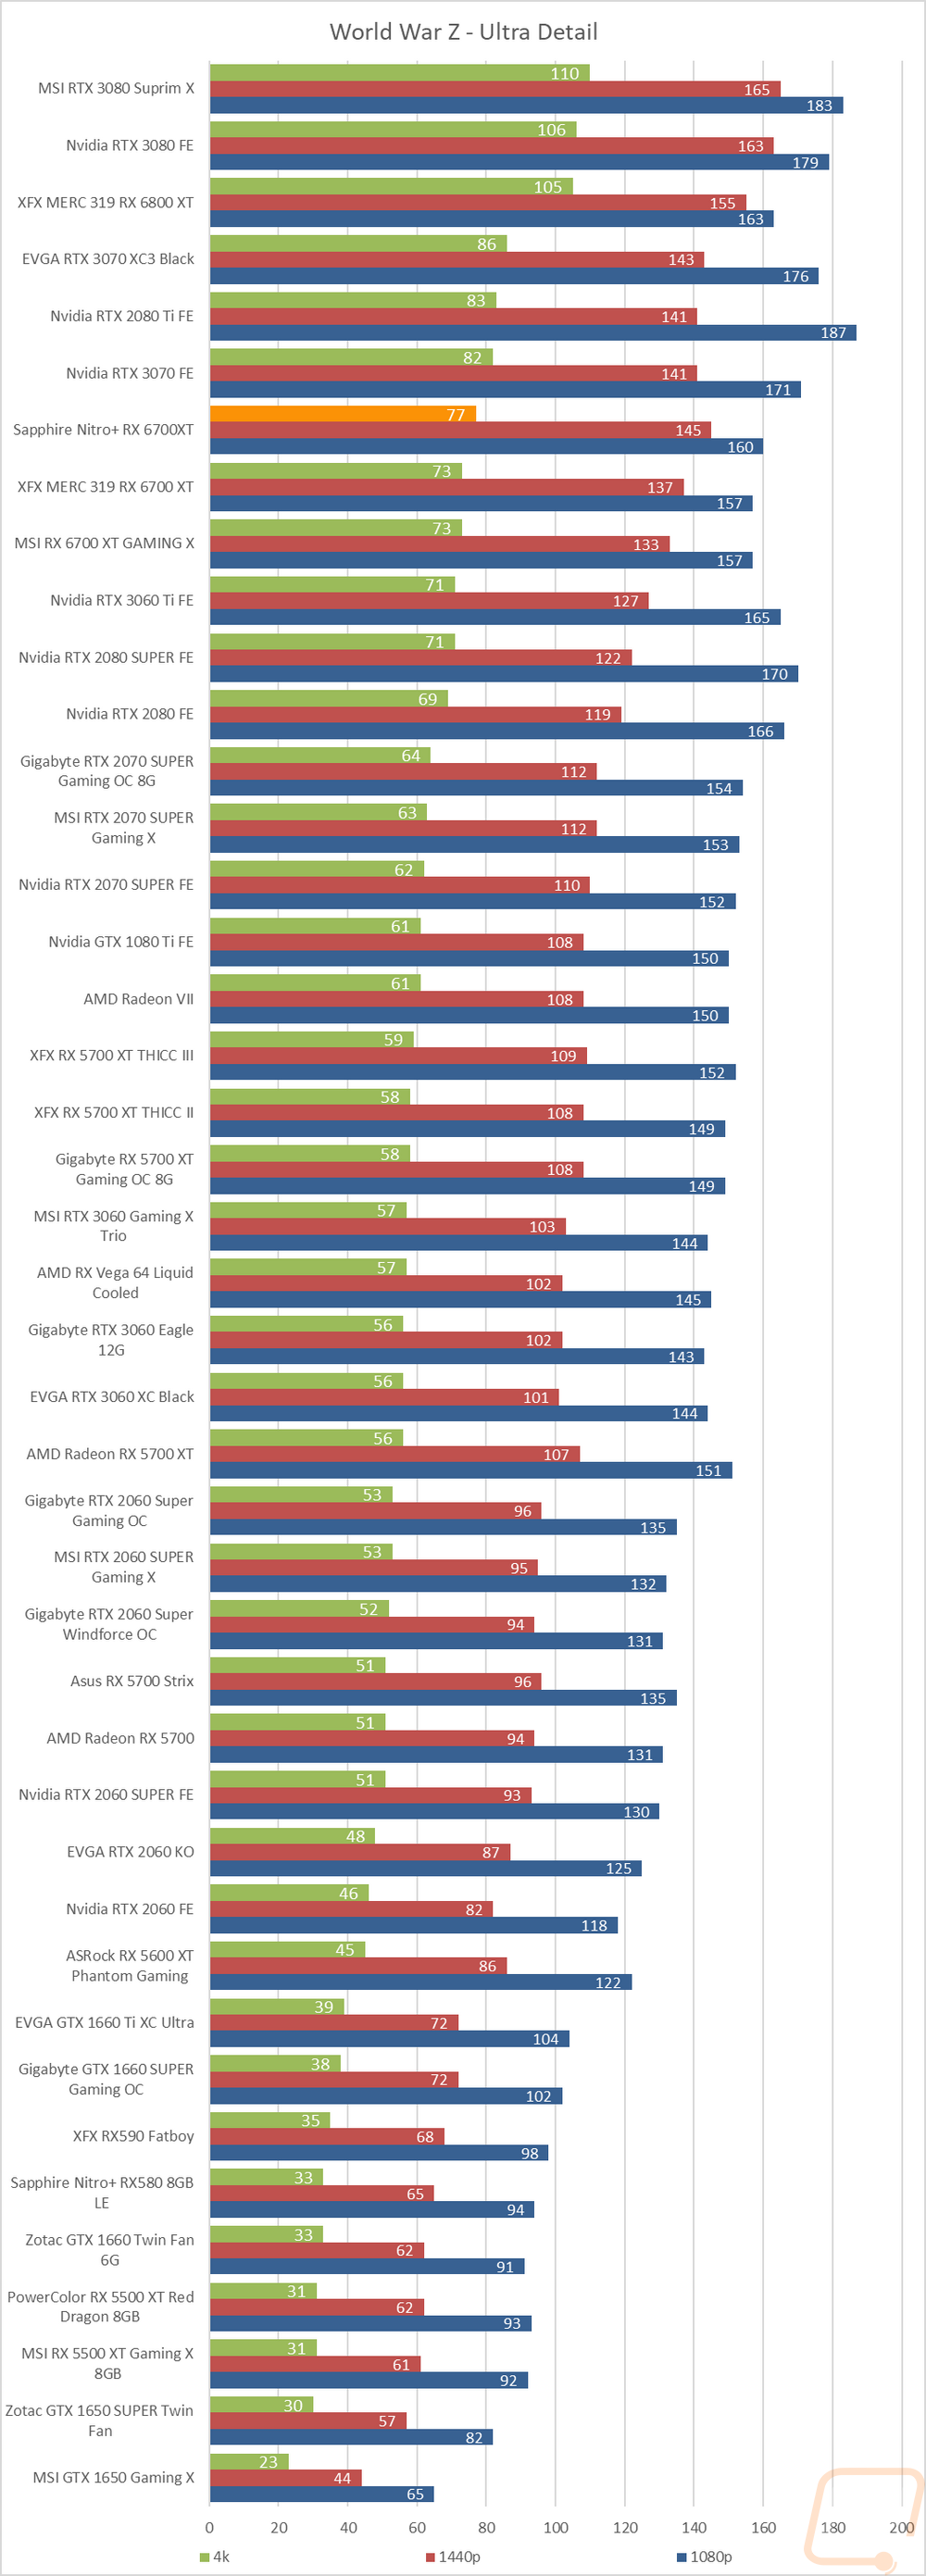
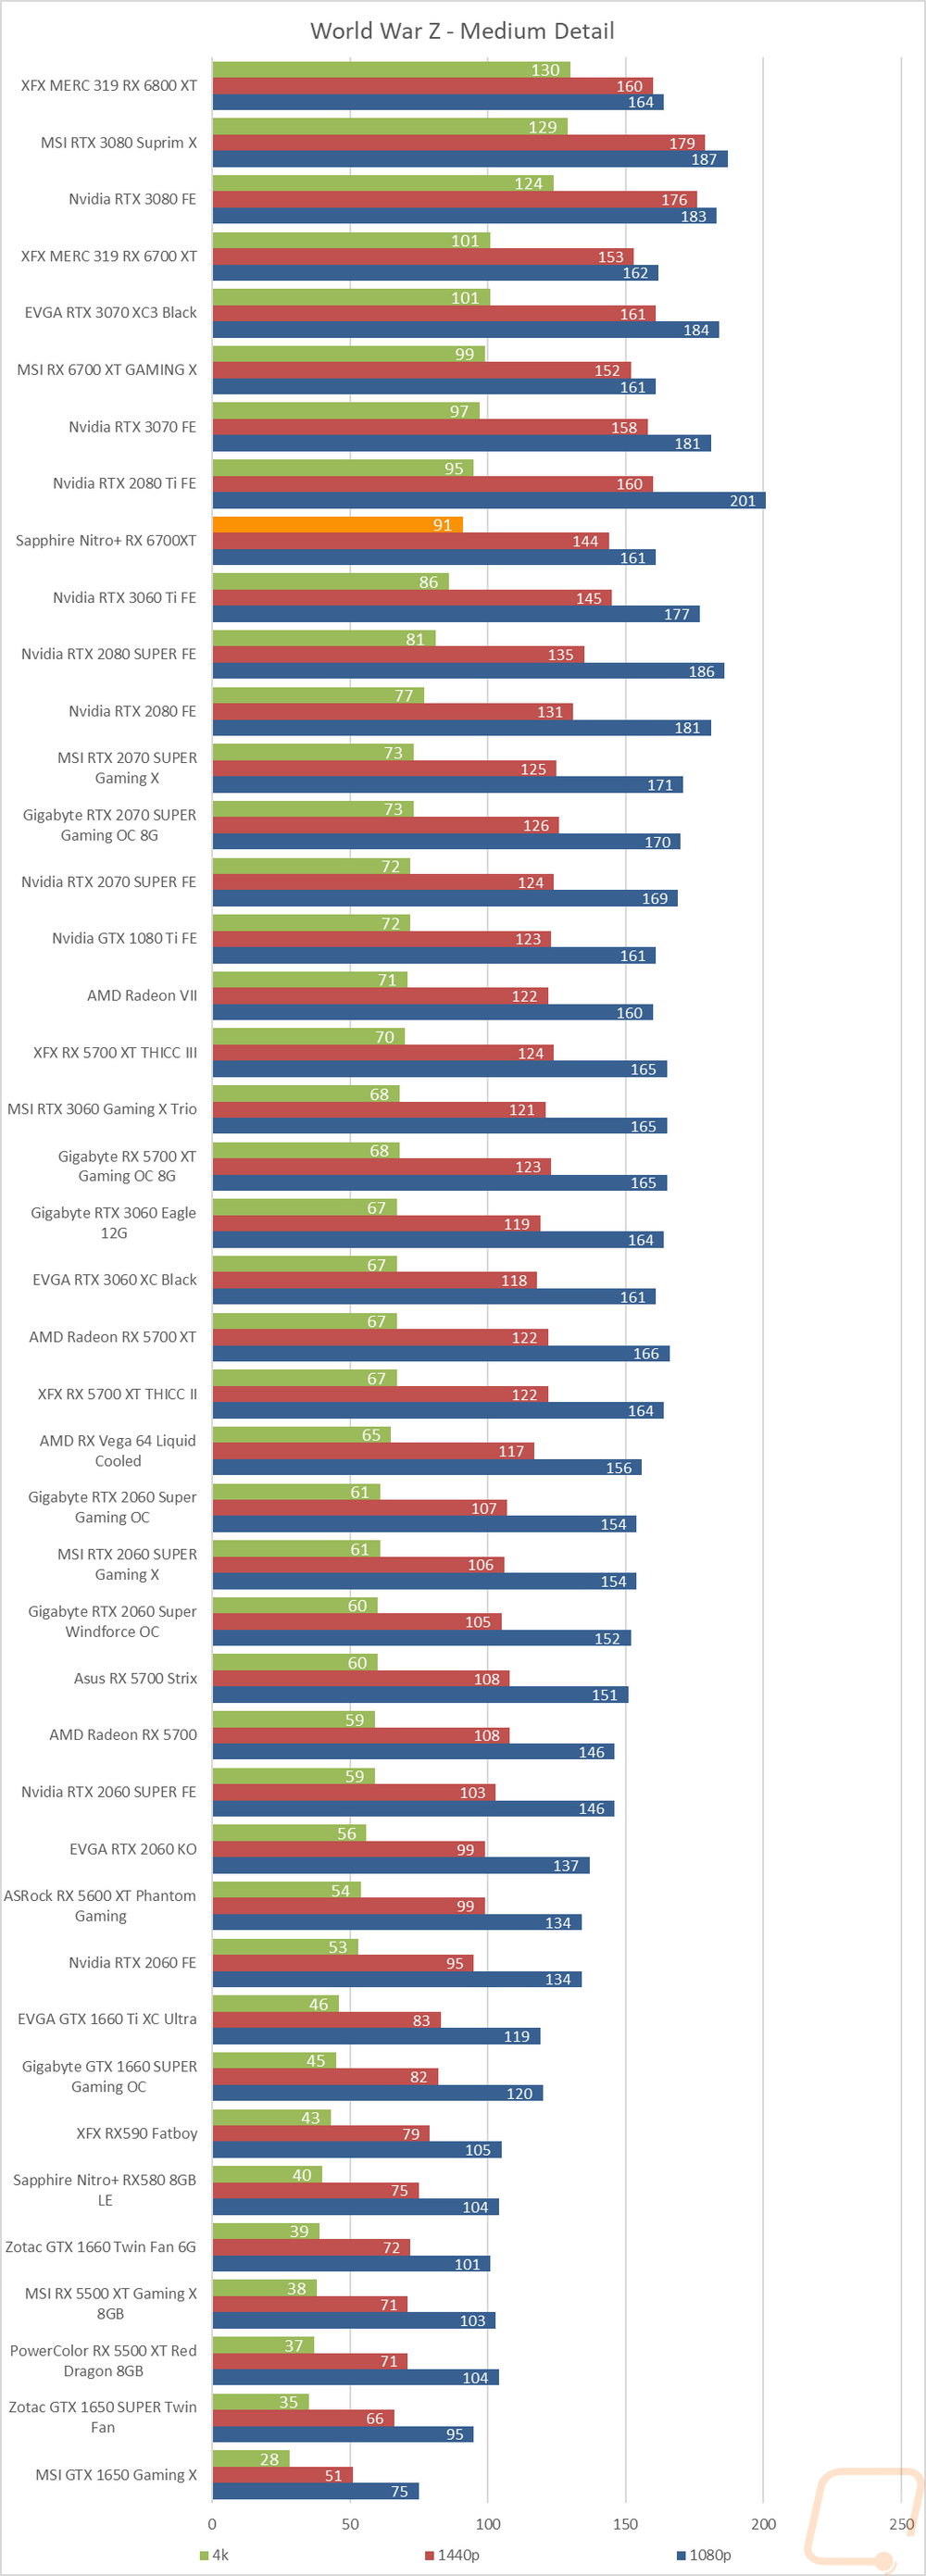
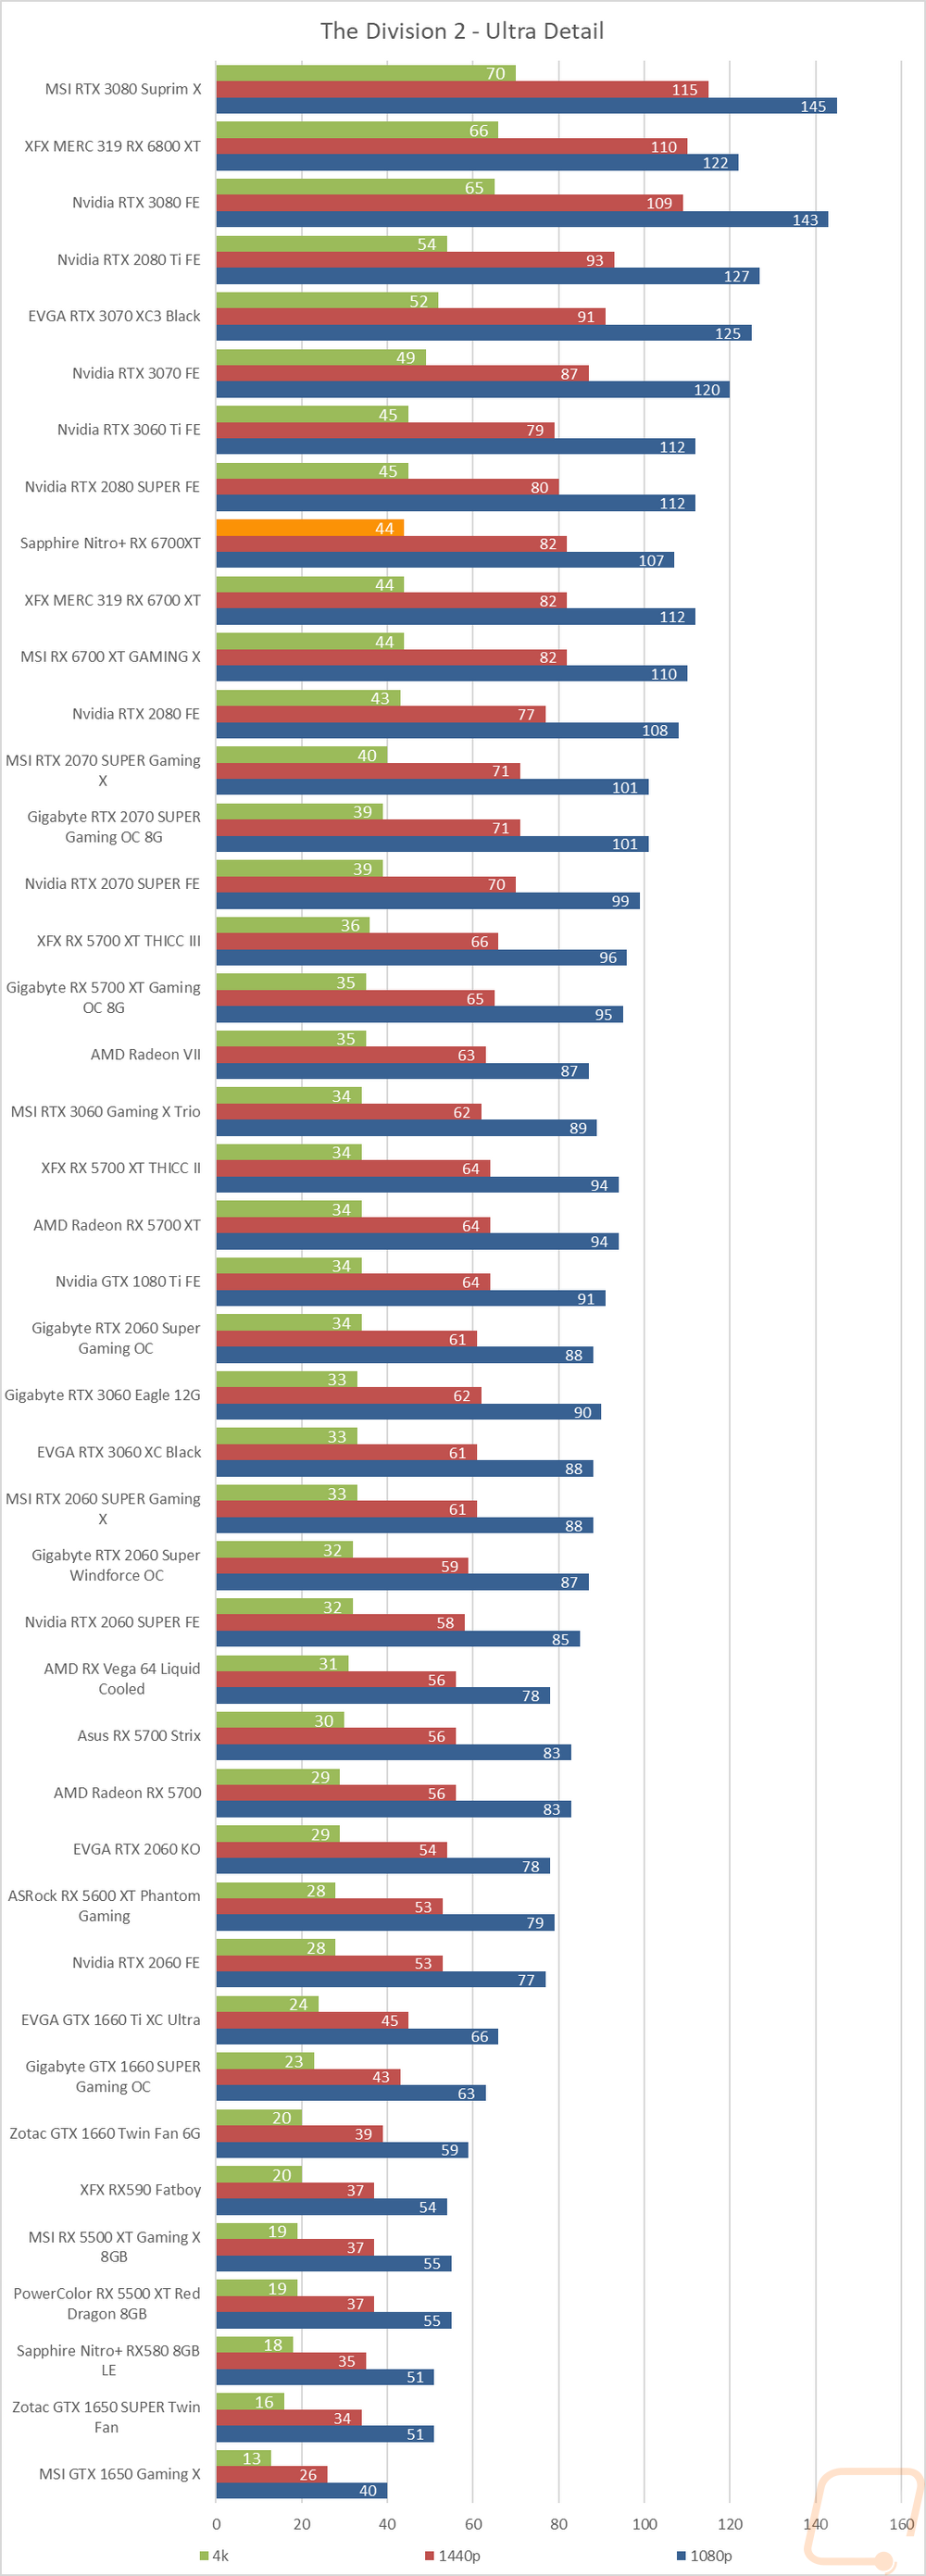
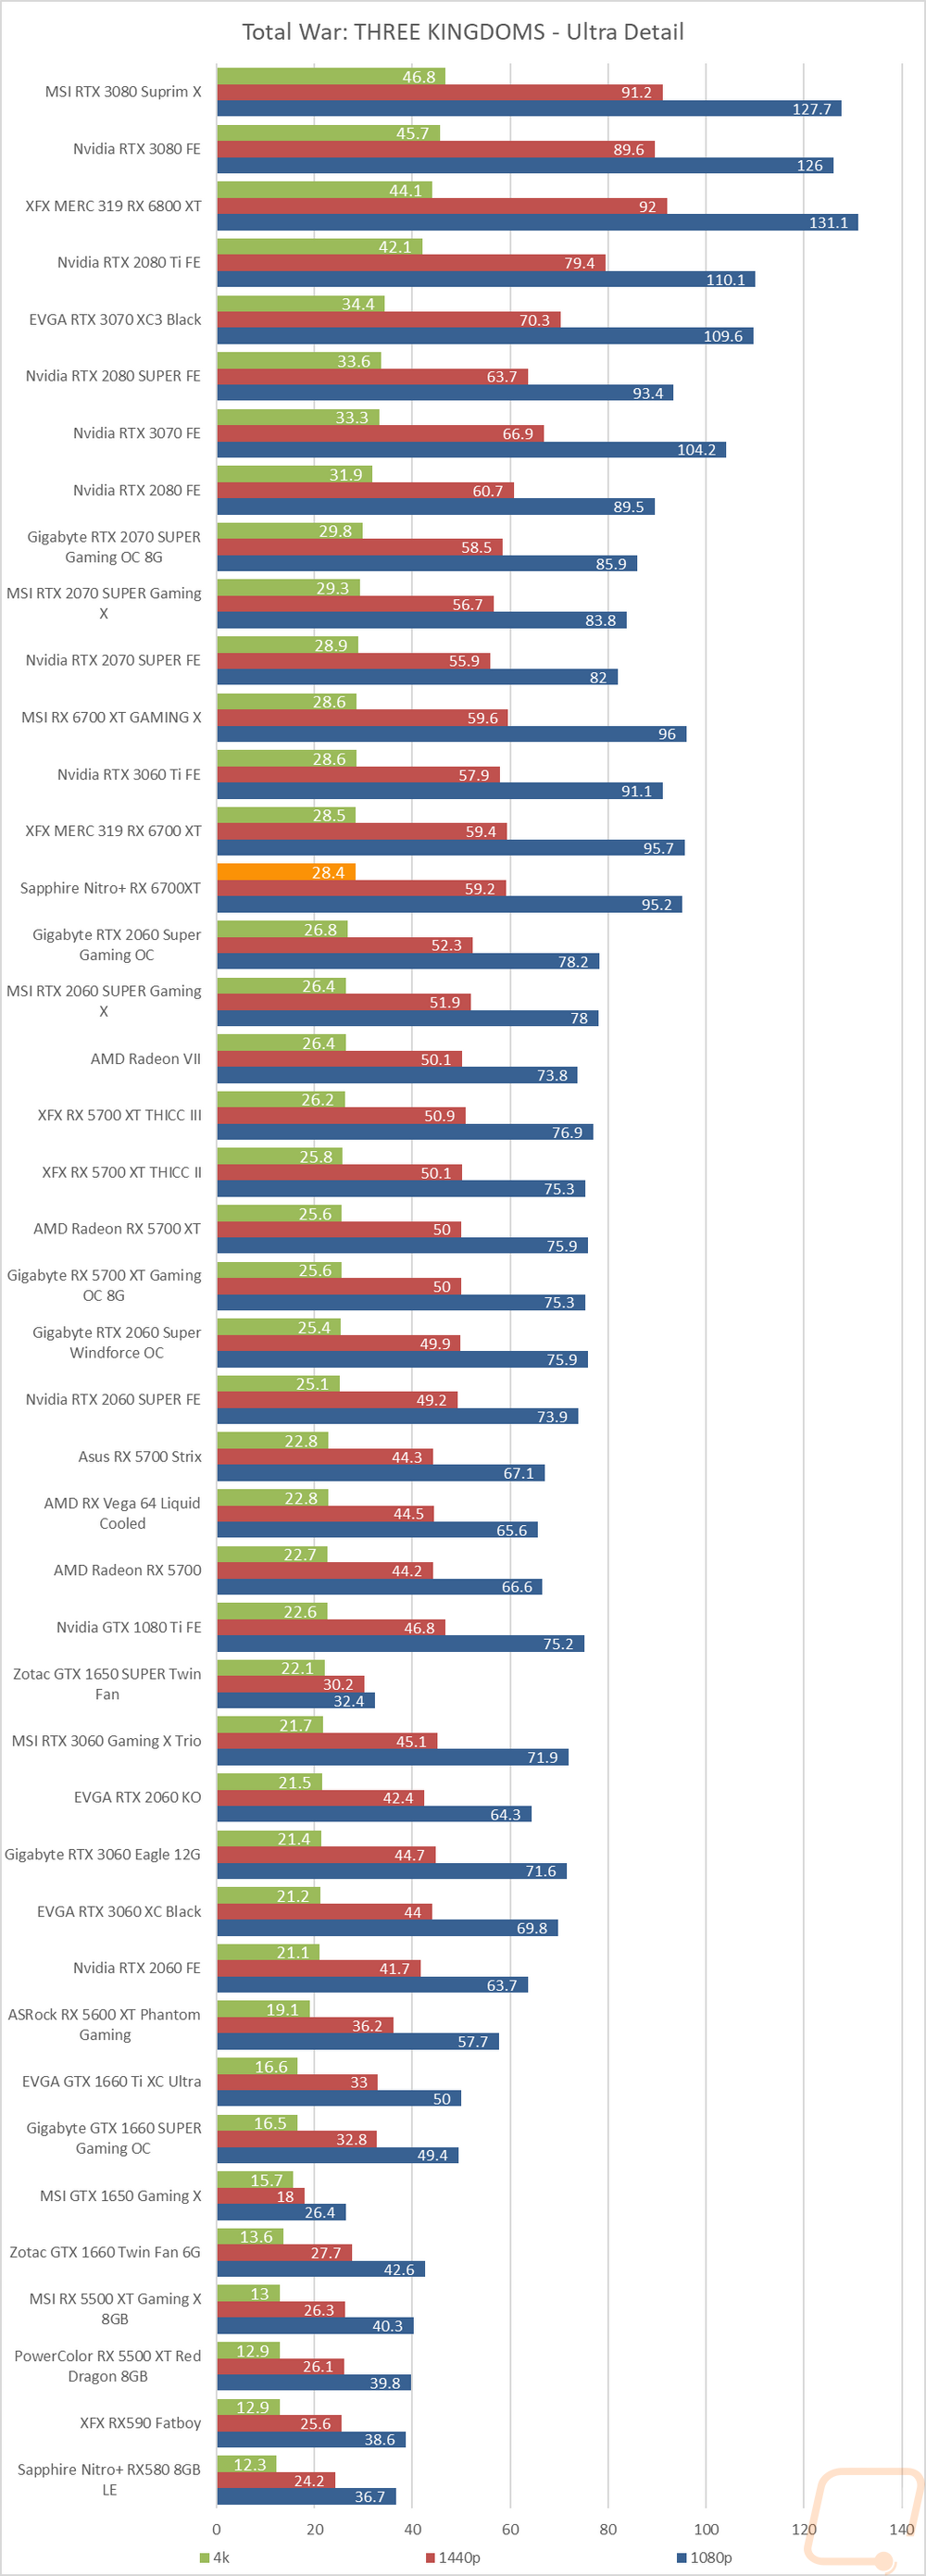
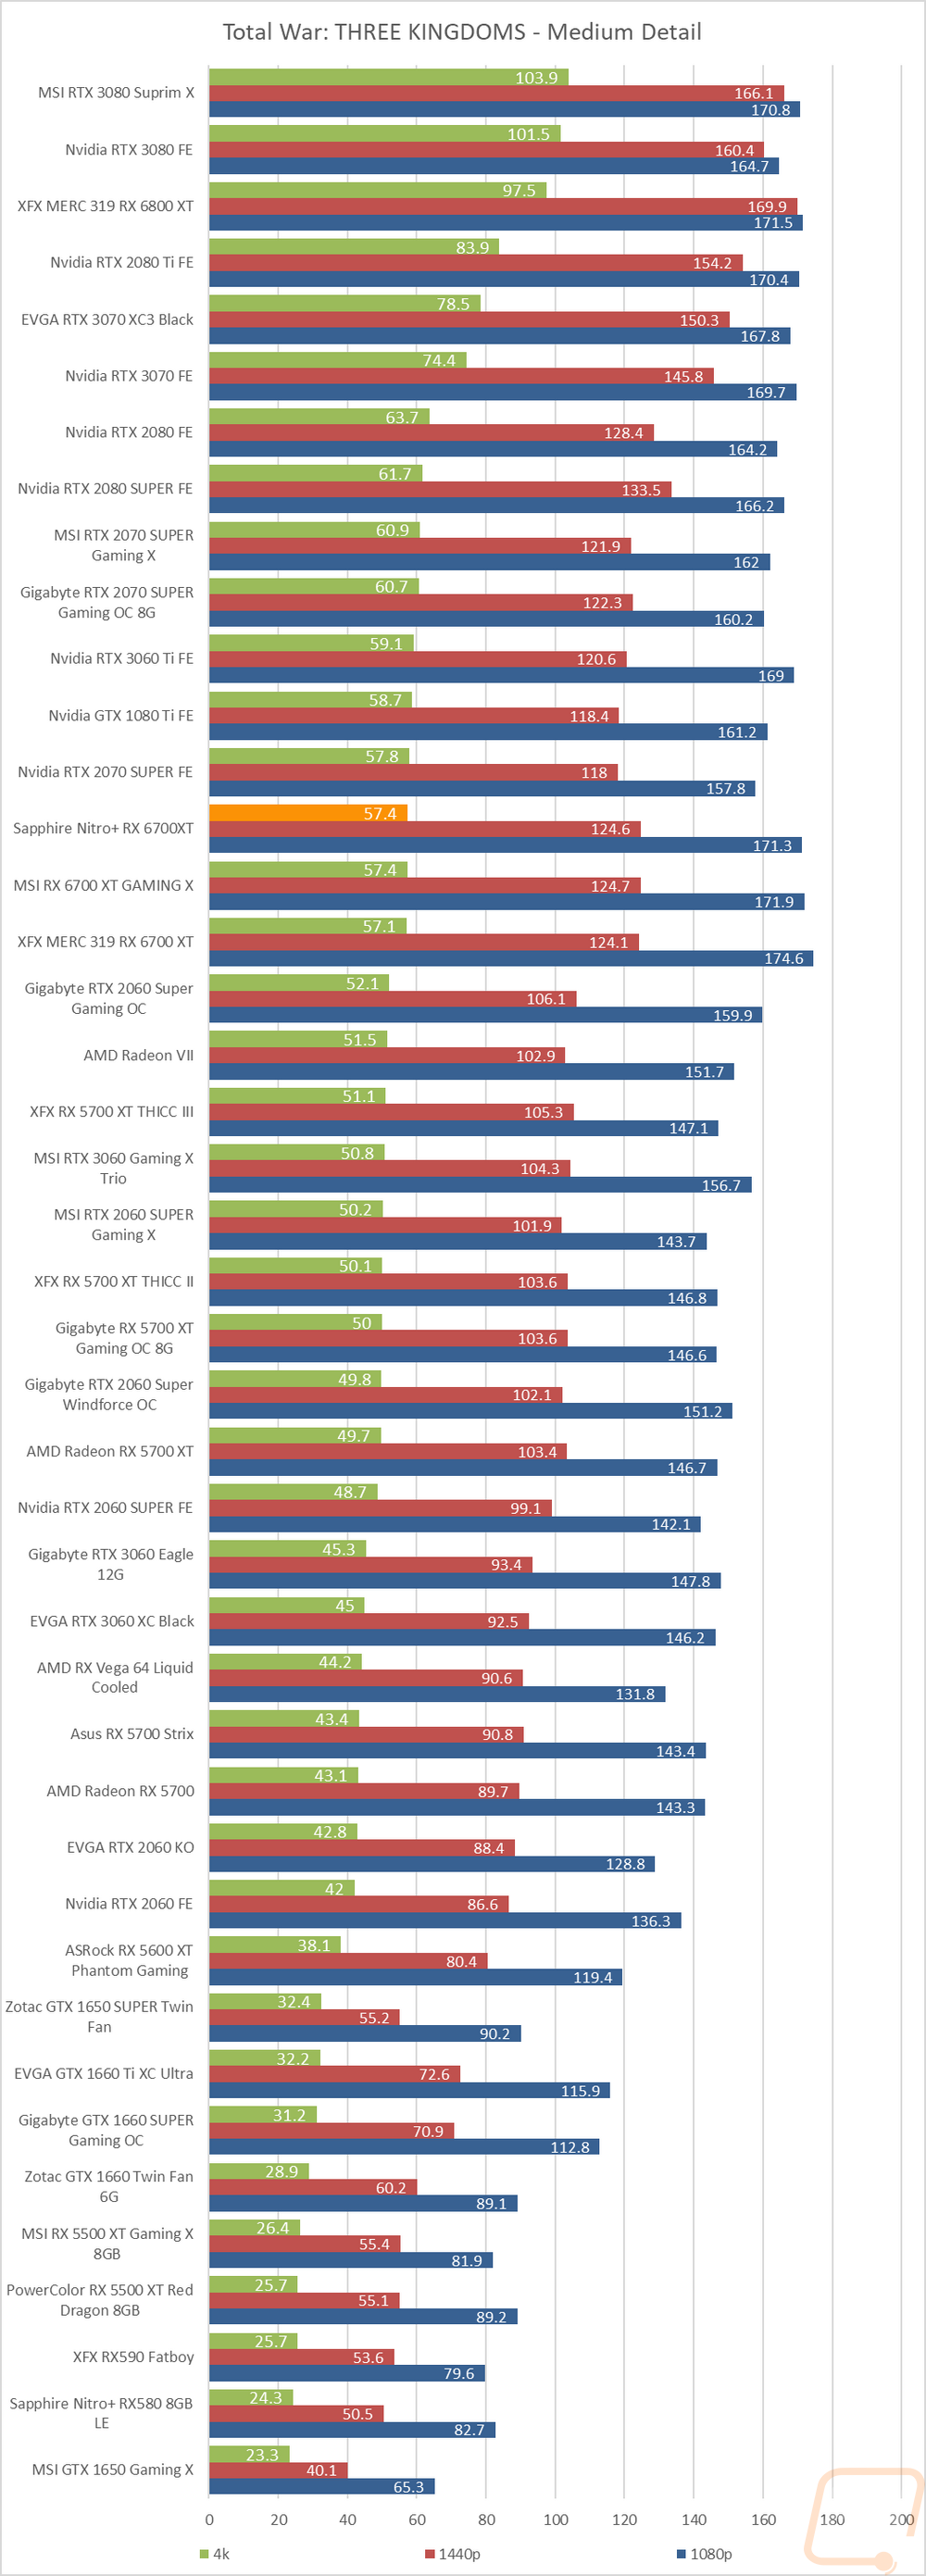
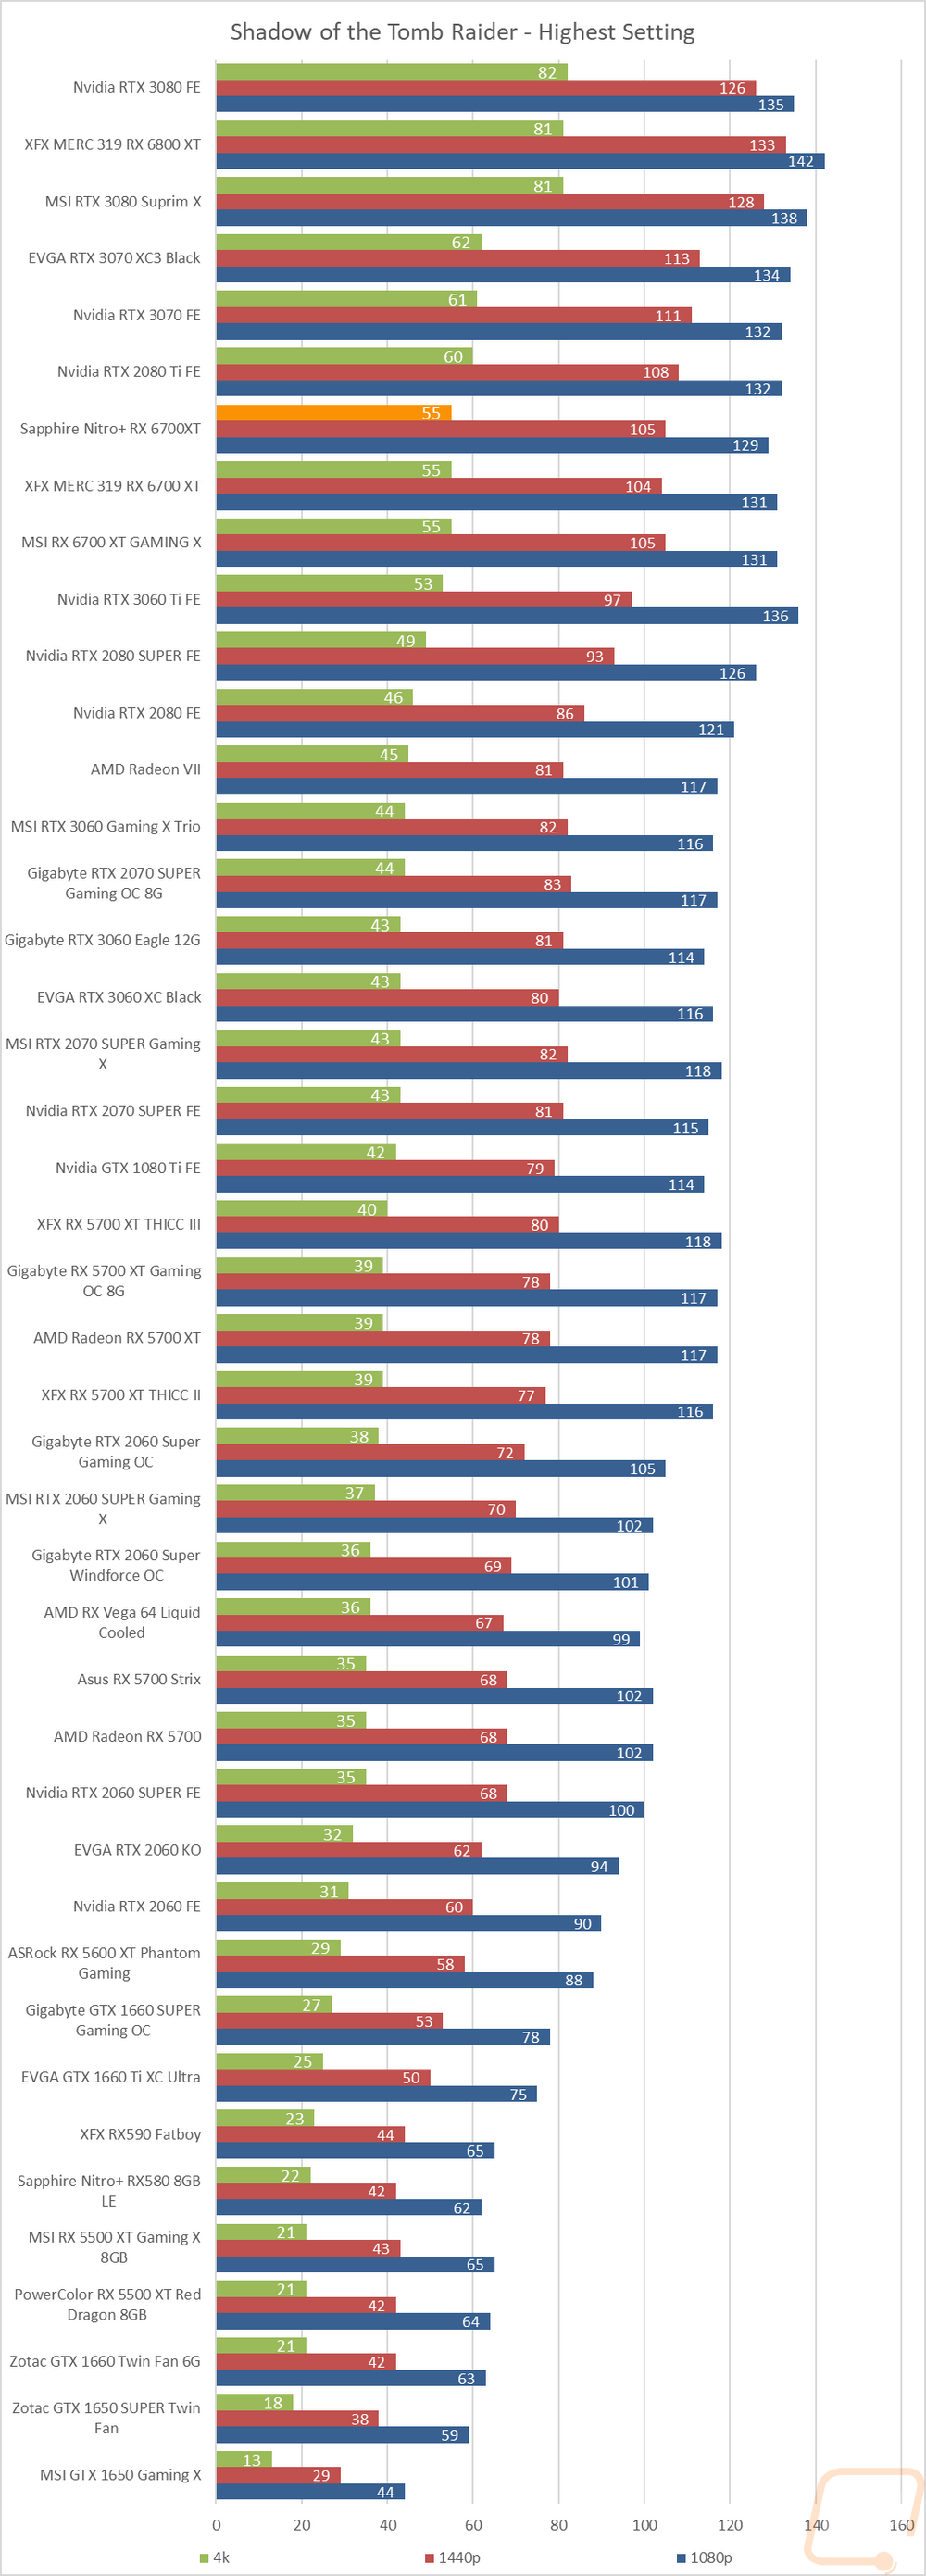
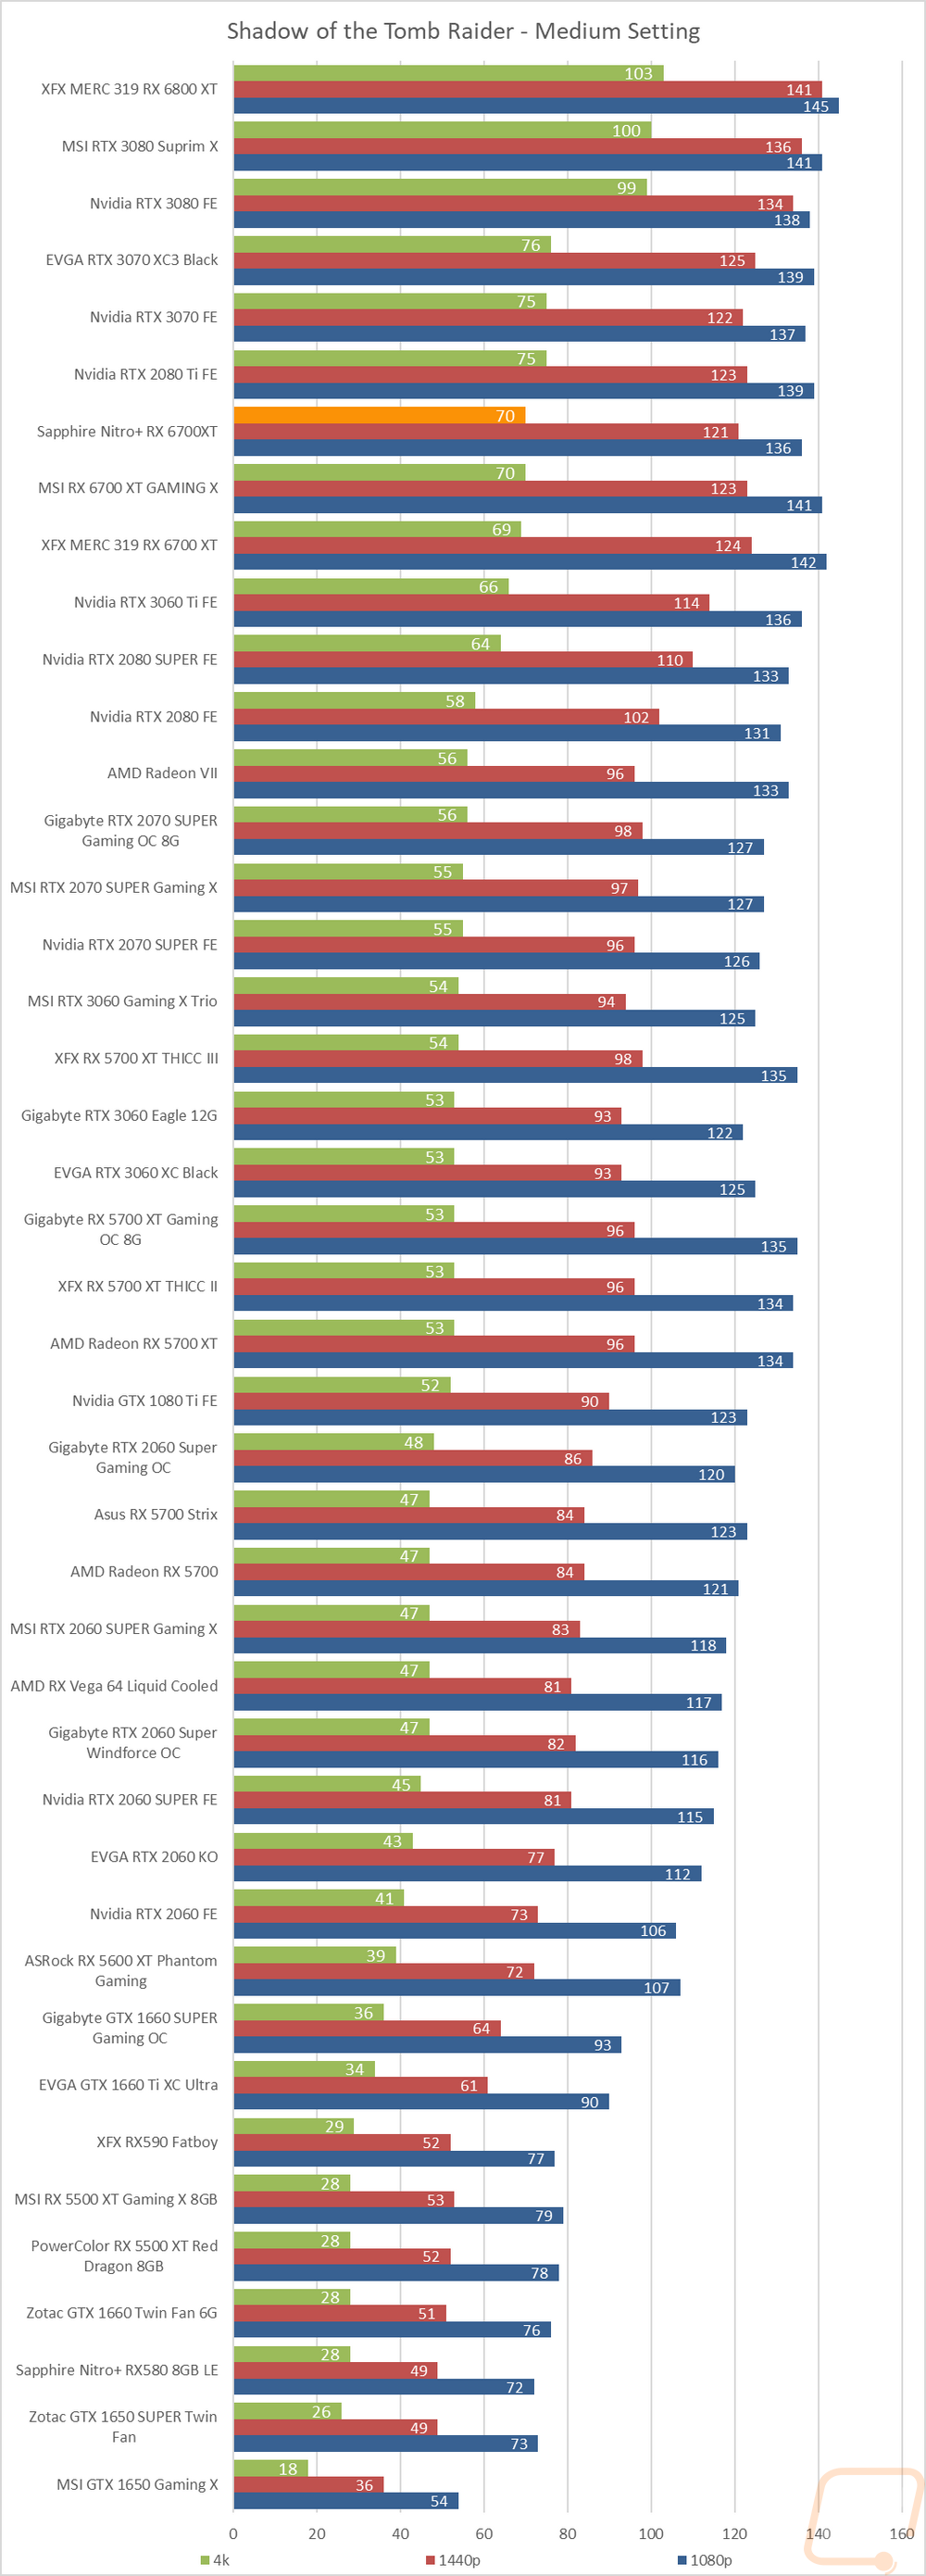
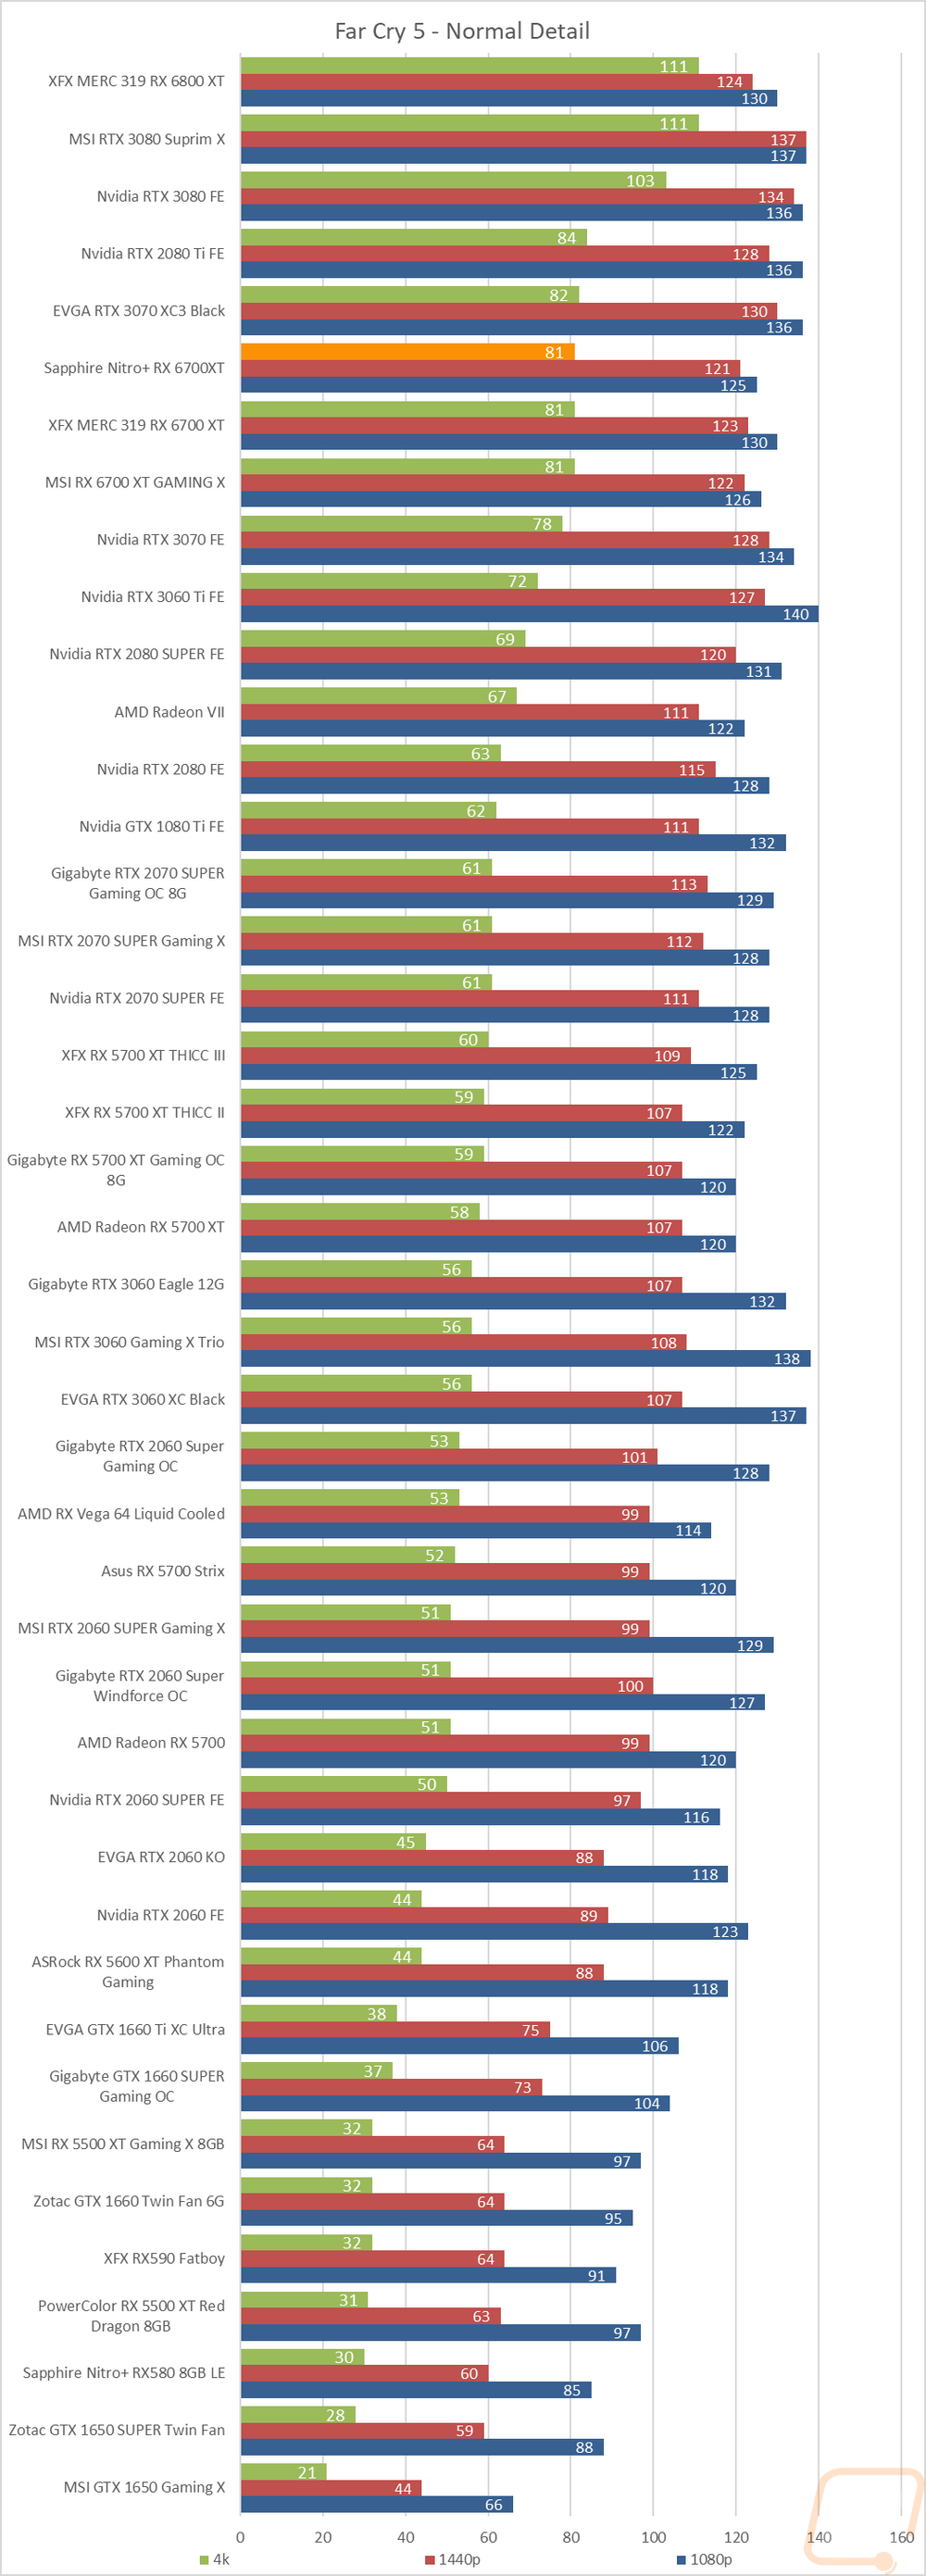
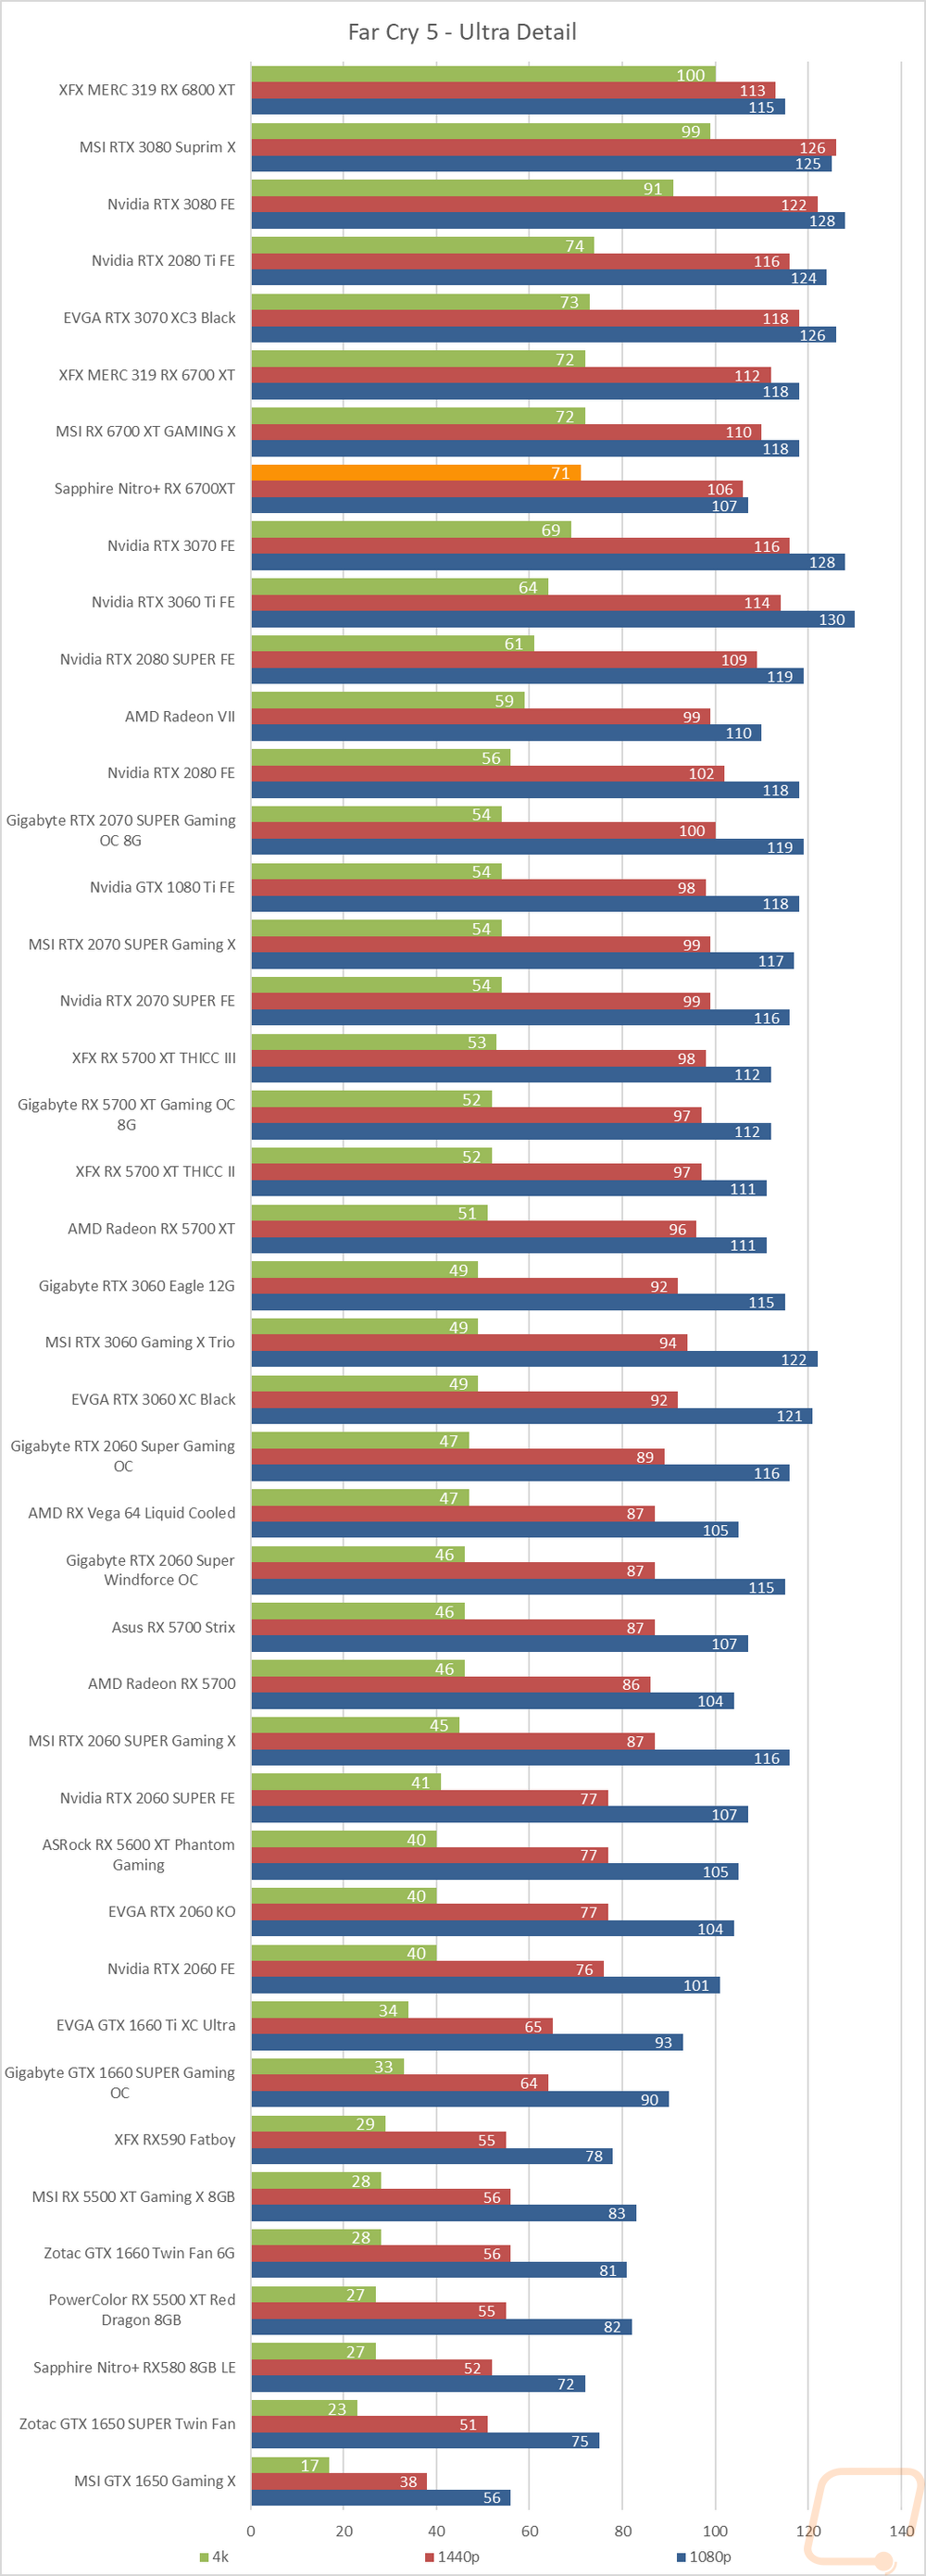
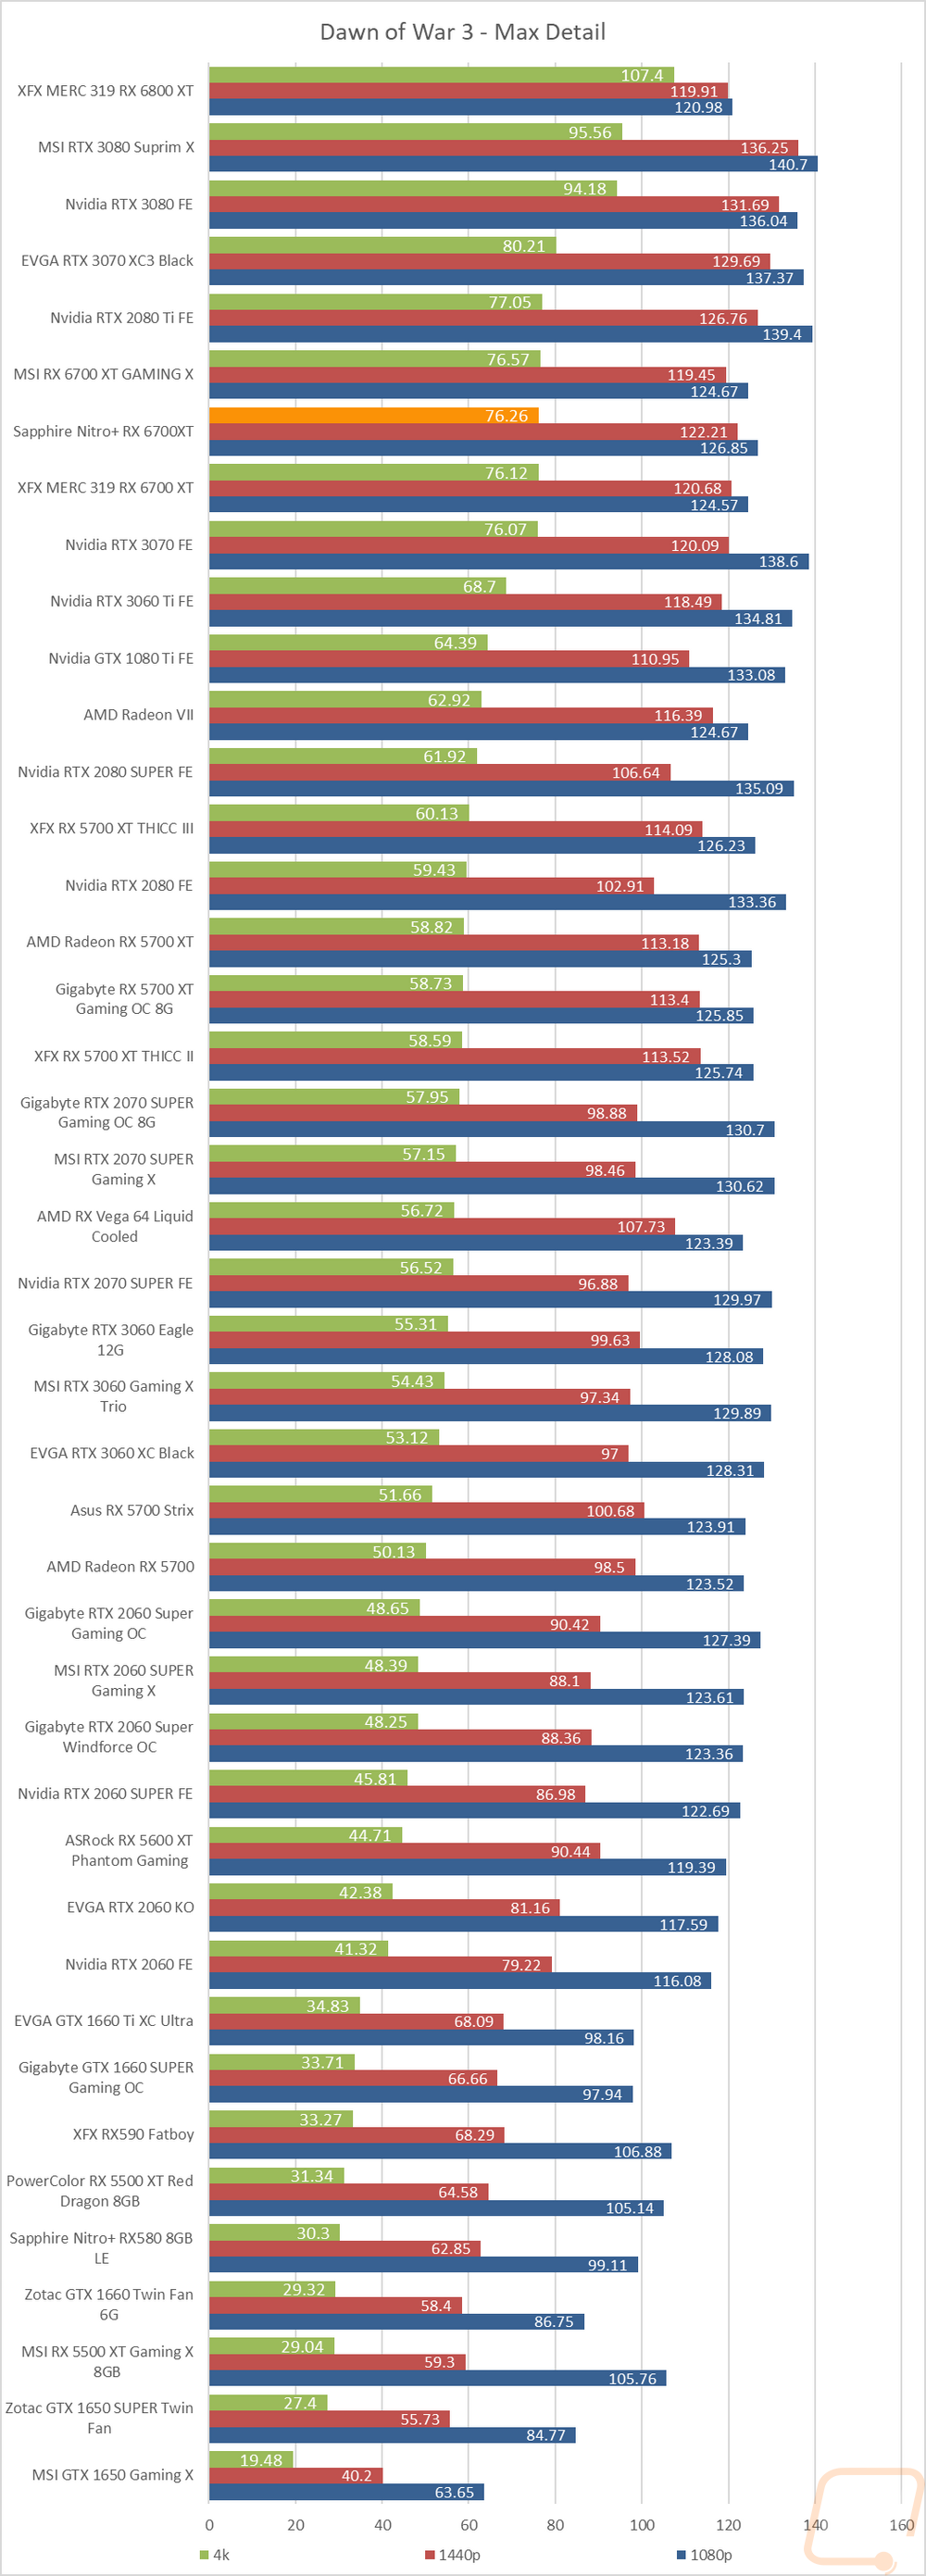
Of course, I have all of the actual in game results as well for anyone who wants to sort through the wall of graphs below. With these, I wanted to take a closer look as to where the Nitro+ 6700XT was in comparison with the other 6700XT’s as well as compared to cards from Nvidia as well. In Watch Dogs Legion with the ultra detail setting the Nitro+ 6700XT outperformed the XFX with the same clock speed and the MSI enough to also edge out past the RTX 3070 but at the high detail, the 3070 was still a little faster. In Borderlands on the other hand the Nitro+ 6700XT was coming in just behind the RTX 3060 Ti in both tests. In Metro Exodus, the XFX and the Nitro+ 6700XT came in almost exactly the same in each test with the RTX 3070 less than one FPS ahead at 4k and then at 1440p and 1080p the Nitro+ 6700XT was faster at the normal detail setting. In World War Z at 4k, the MSI with its overclock pulled ahead with the Nitro+ 6700XT sitting back between the 3060 Ti and the 2080 Ti. Overall in our tests, the Nitro+ 6700XT ran with and above the RTX 3060 Ti but there are a few games where it surges up and runs with the RTX 3070.