In-Game Benchmarks
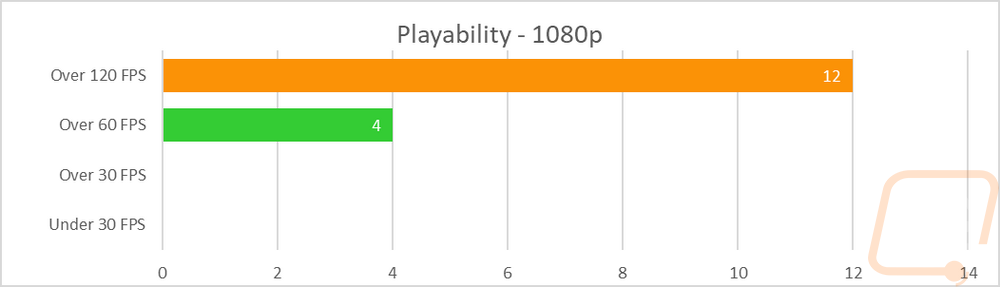
Now we finally get into the in game performance and that is the main reason people pick up a new video card. To test things out I ran through our new benchmark suite that tests 9 games at three different resolutions (1080p, 1440p, and 4k). Most of the games tested have been run at the highest detail setting and a mid-range detail setting to get a look at how turning things up hurts performance and to give an idea of if turning detail down from max will be beneficial for frame rates. In total, each video card is tested 48 times and that makes for a huge mess of results when you put them all together. To help with that I like to start with these overall playability graphs that take all of the results and give an easier to read result. I have one for each of the three resolutions and each is broken up into four FPS ranges. Under 30 FPS is considered unplayable, over 30 is playable but not ideal, over 60 is the sweet spot, and then over 120 FPS is for high refresh rate monitors.
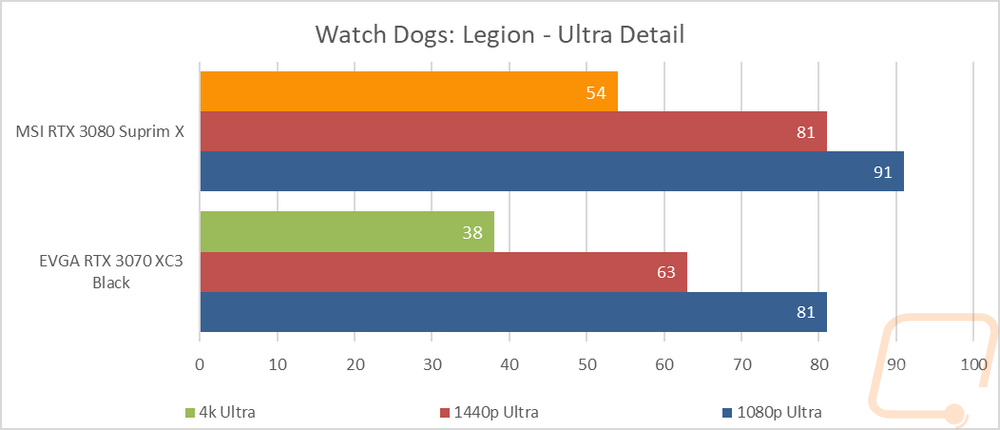
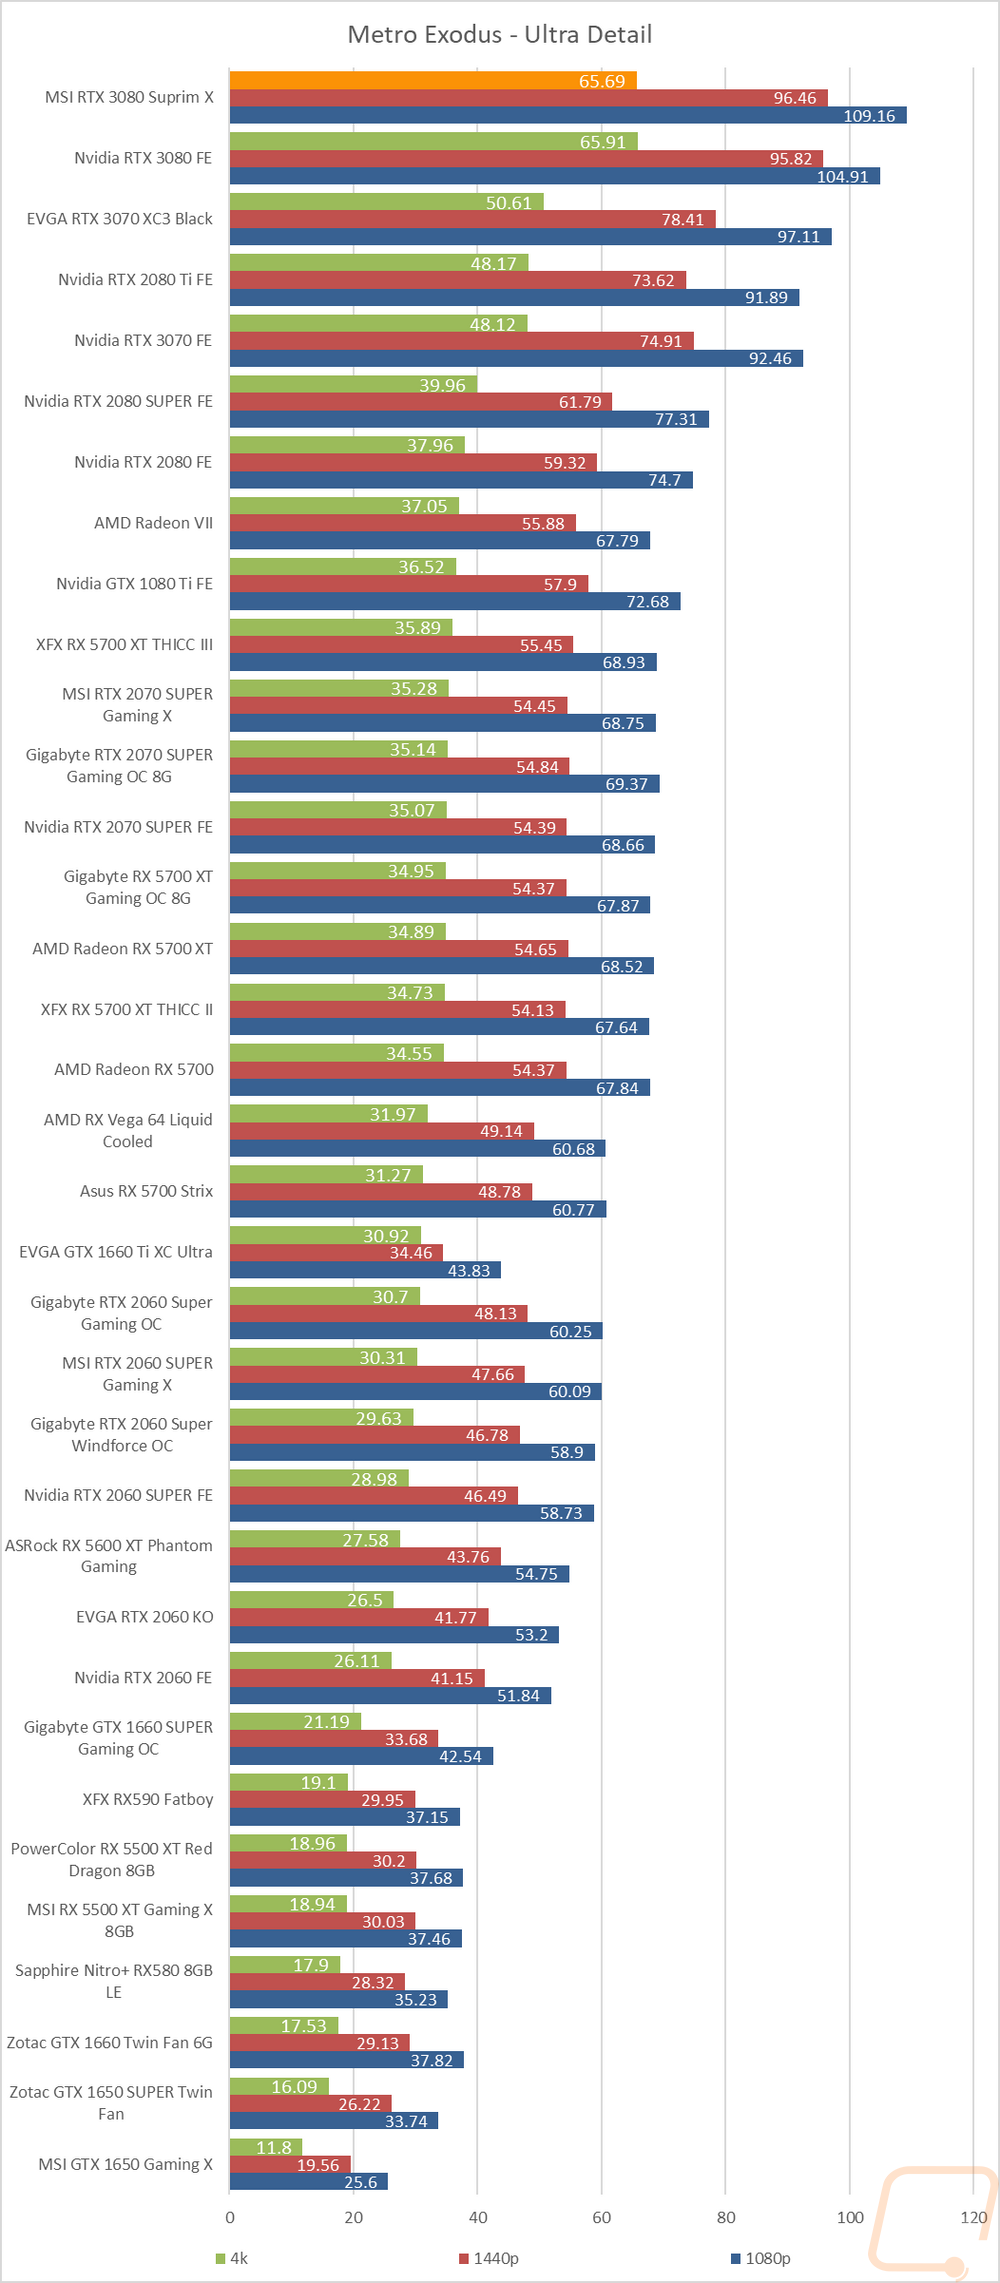
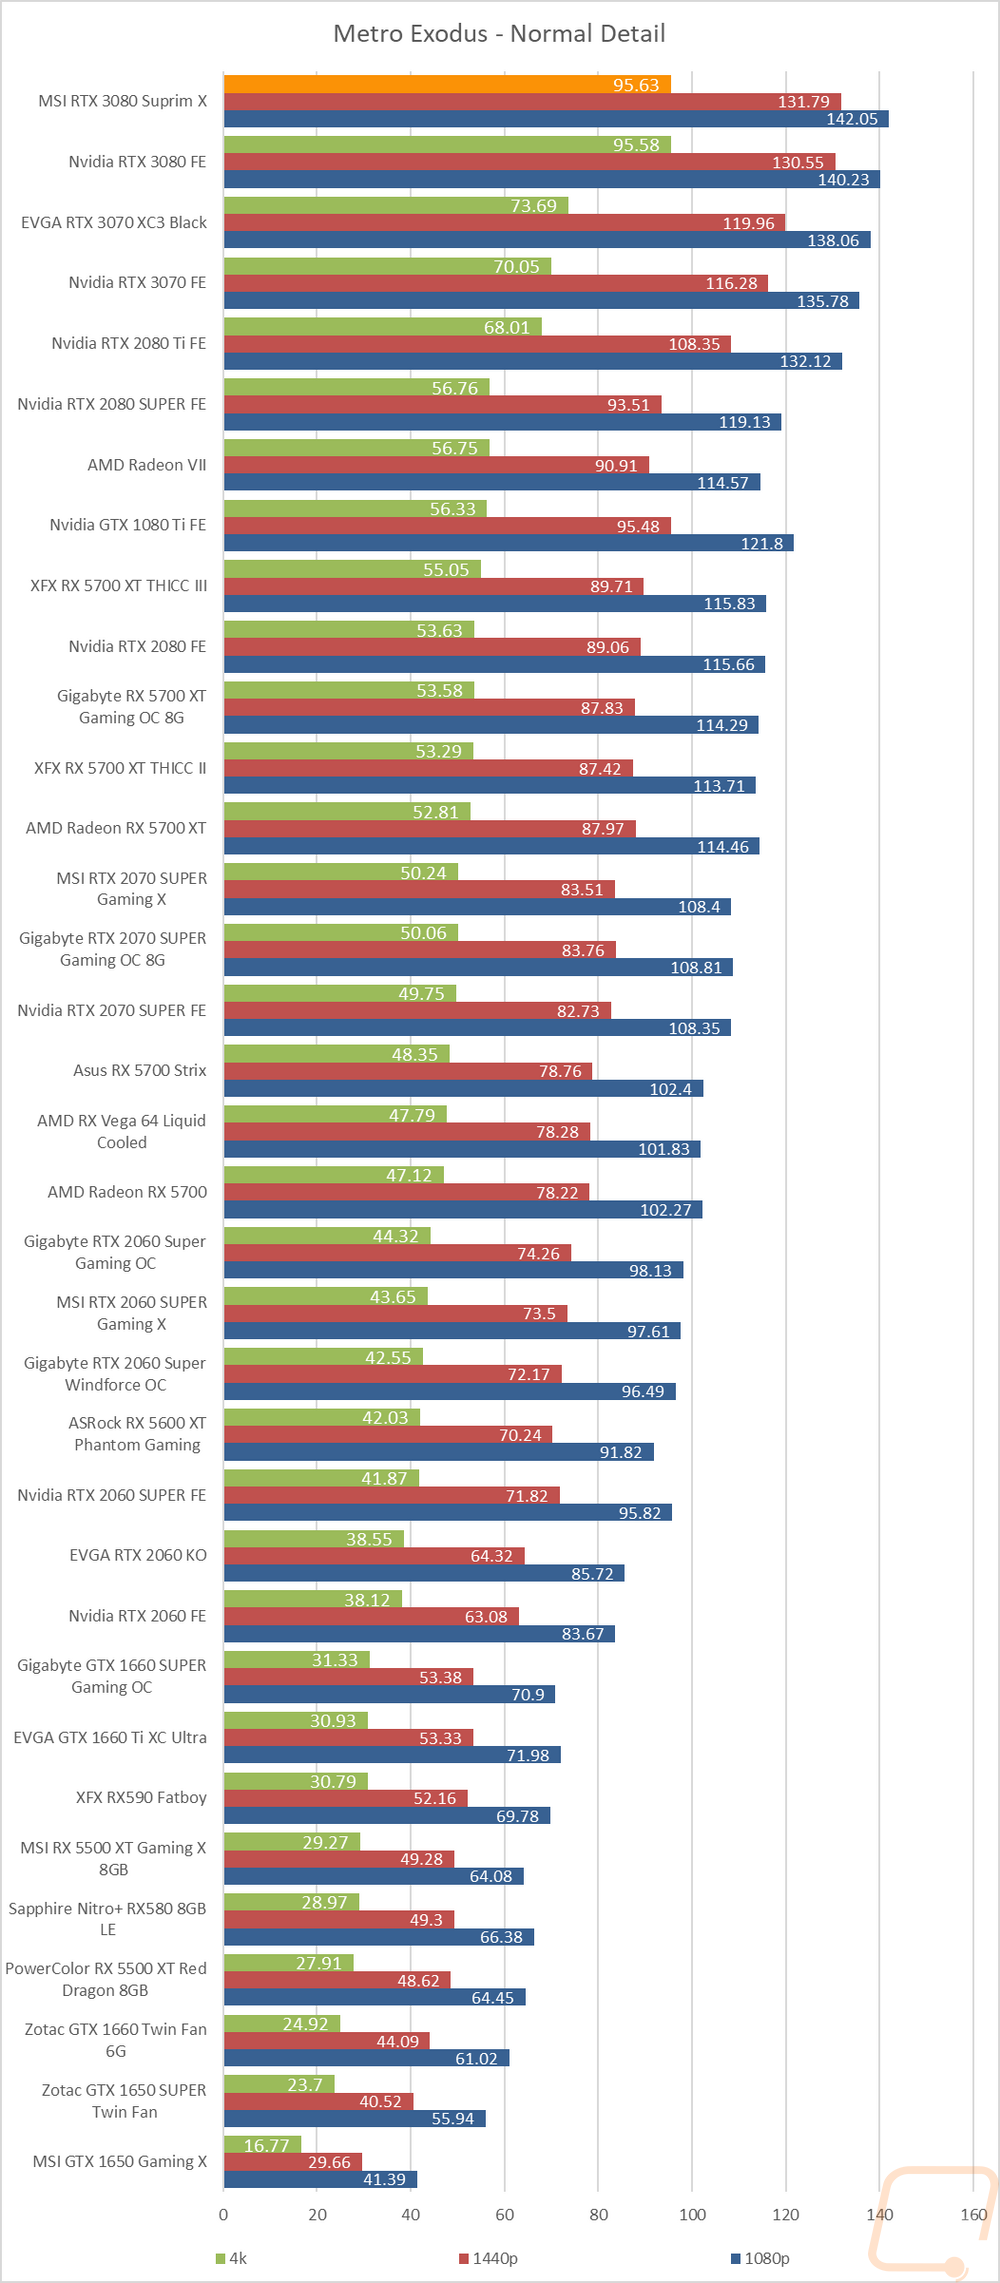
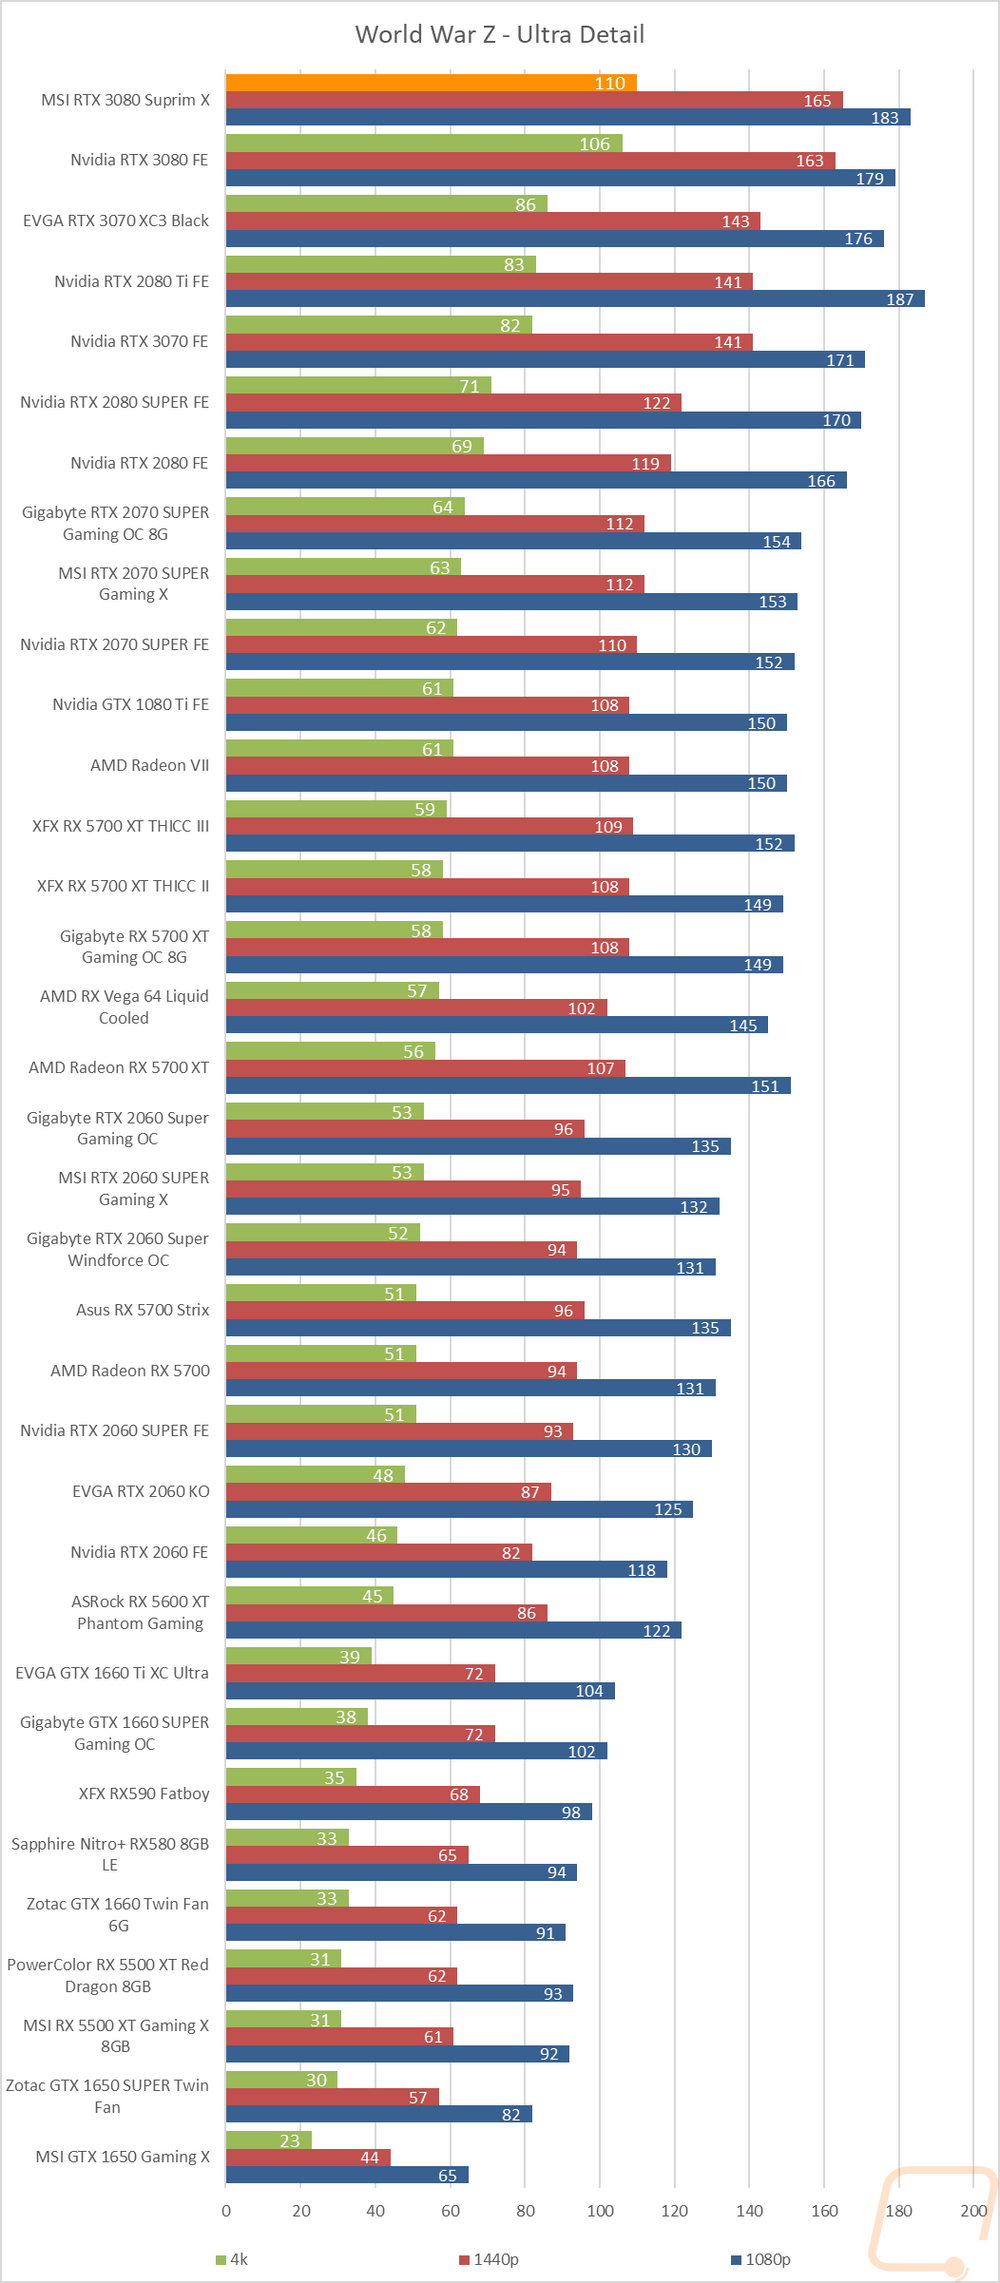
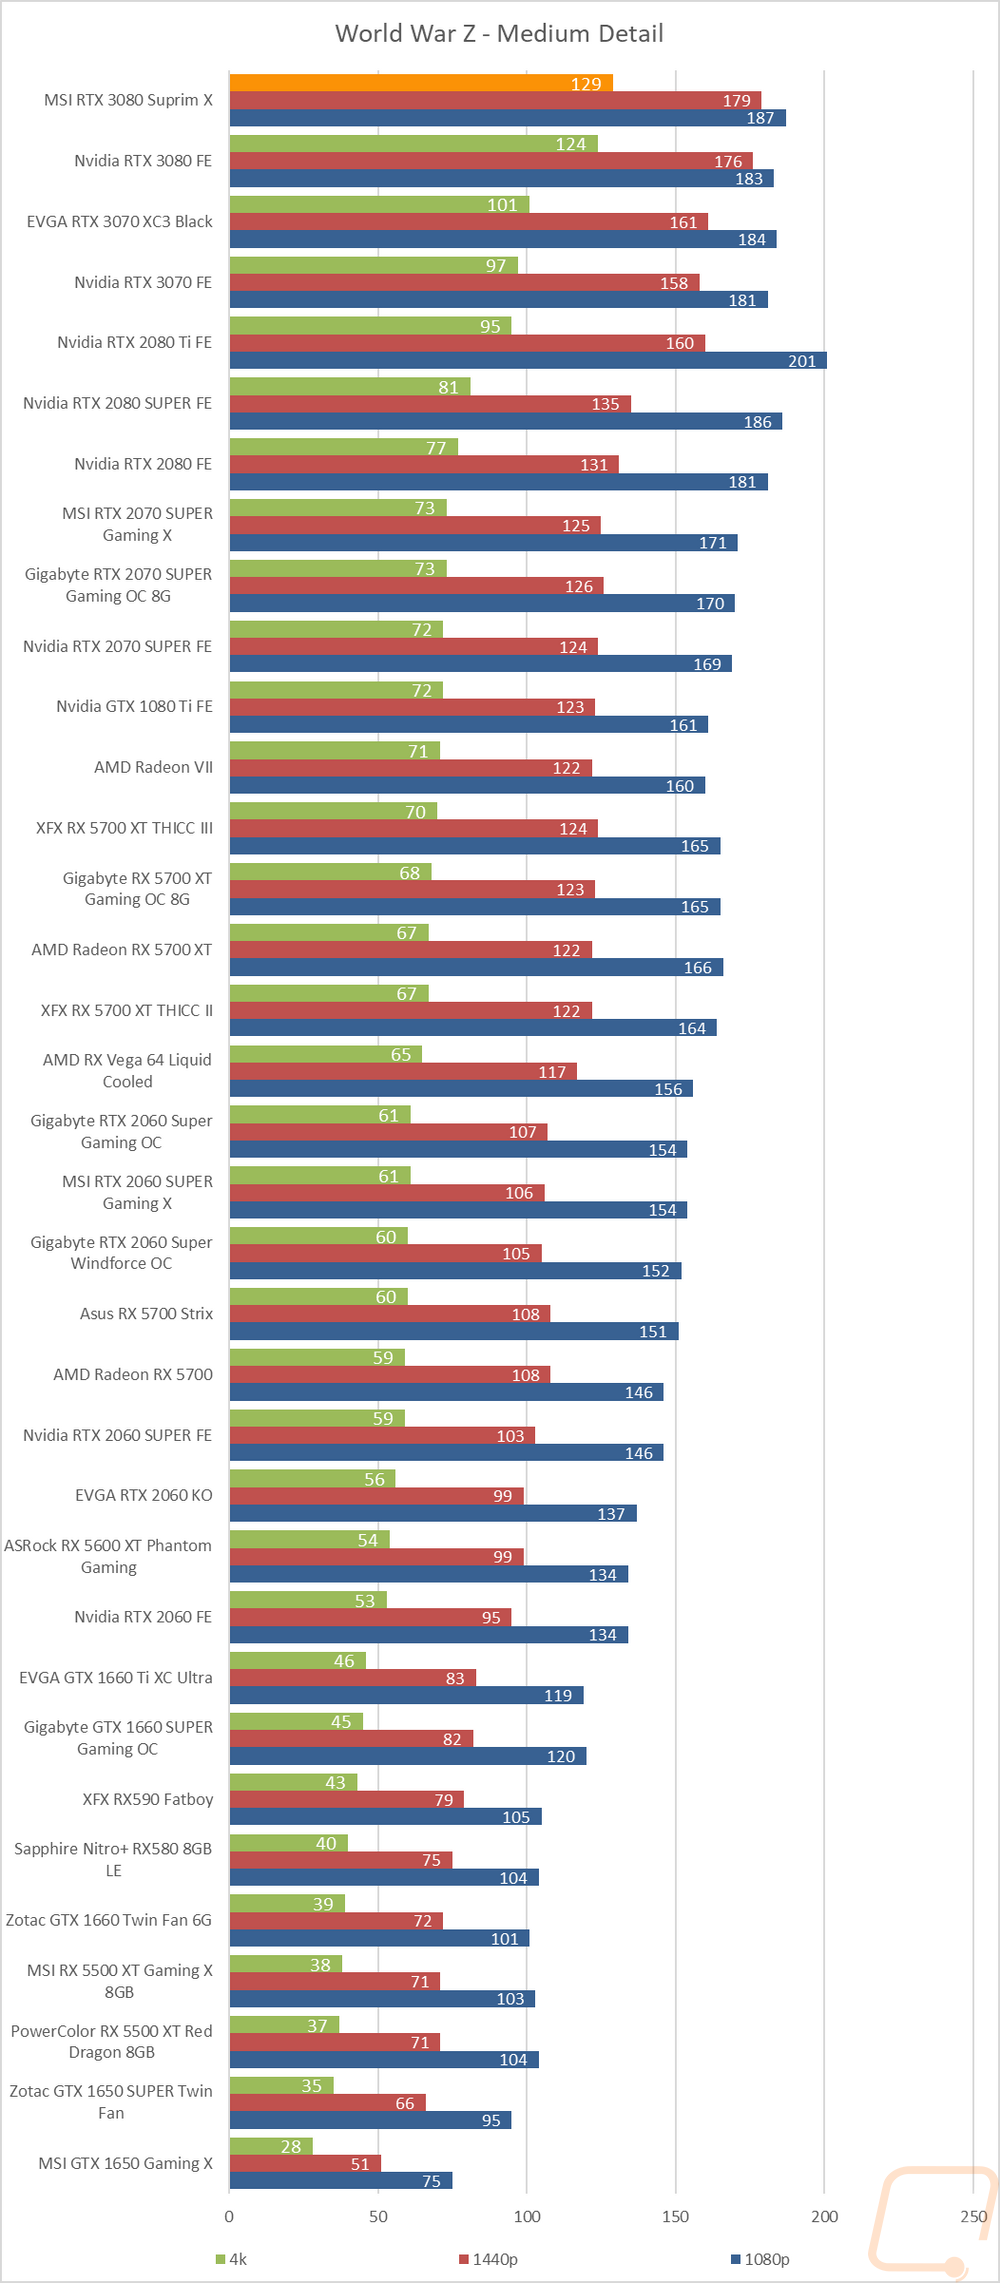
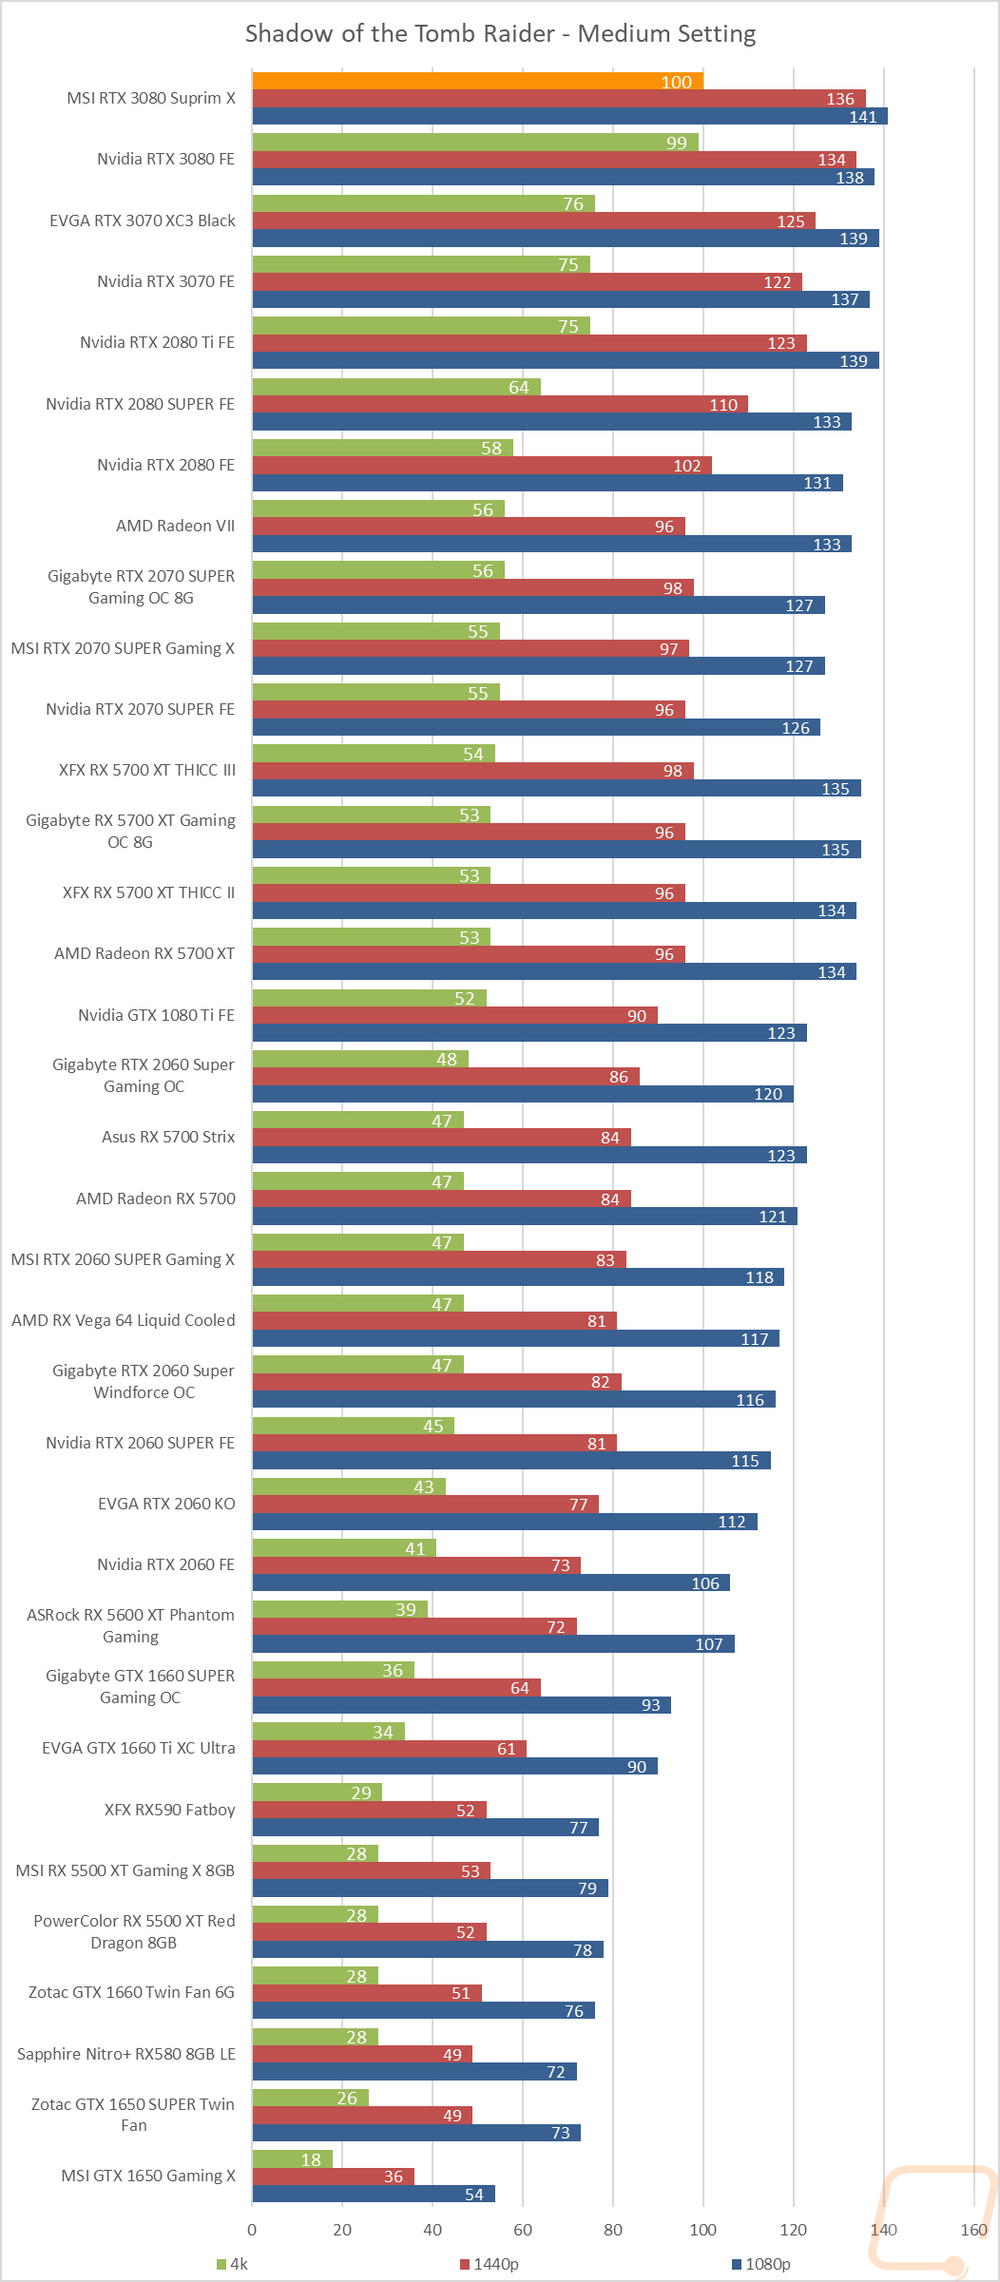
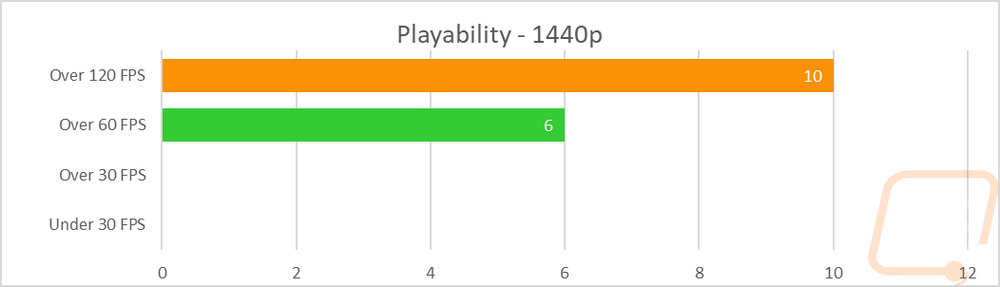
So how did the MSI RTX 3080 SUPRIM X perform? Well at 1080p there weren’t any surprises there with 12 of the 16 results coming in at over 120 FPS and the last four still over 60 FPS. 1440p was similar with 10 coming in over 120 FPS and 6 over 60 FPS. At 4K with nearly all of the tests being at the highest possible settings I would say having 1 over 120 FPS and 13 over 60 FPS was great. There were two that did come in the playable but not smooth 30-59 FPS range. Overall this was similar to the Founders Edition with the 1080p and 1440p results having one less in the 120 FPS range with Watch Dogs: Legion being added and Ghost Recon Wildlands being removed.
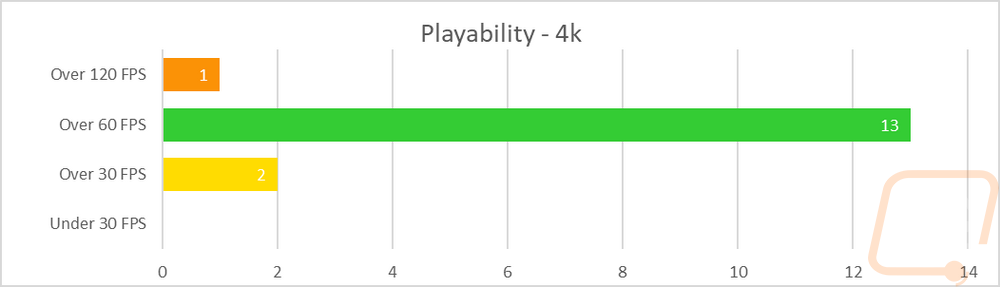
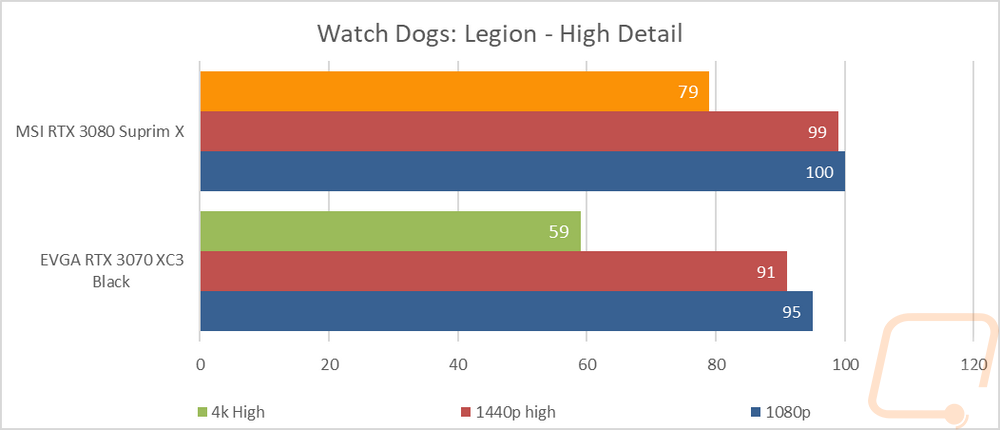
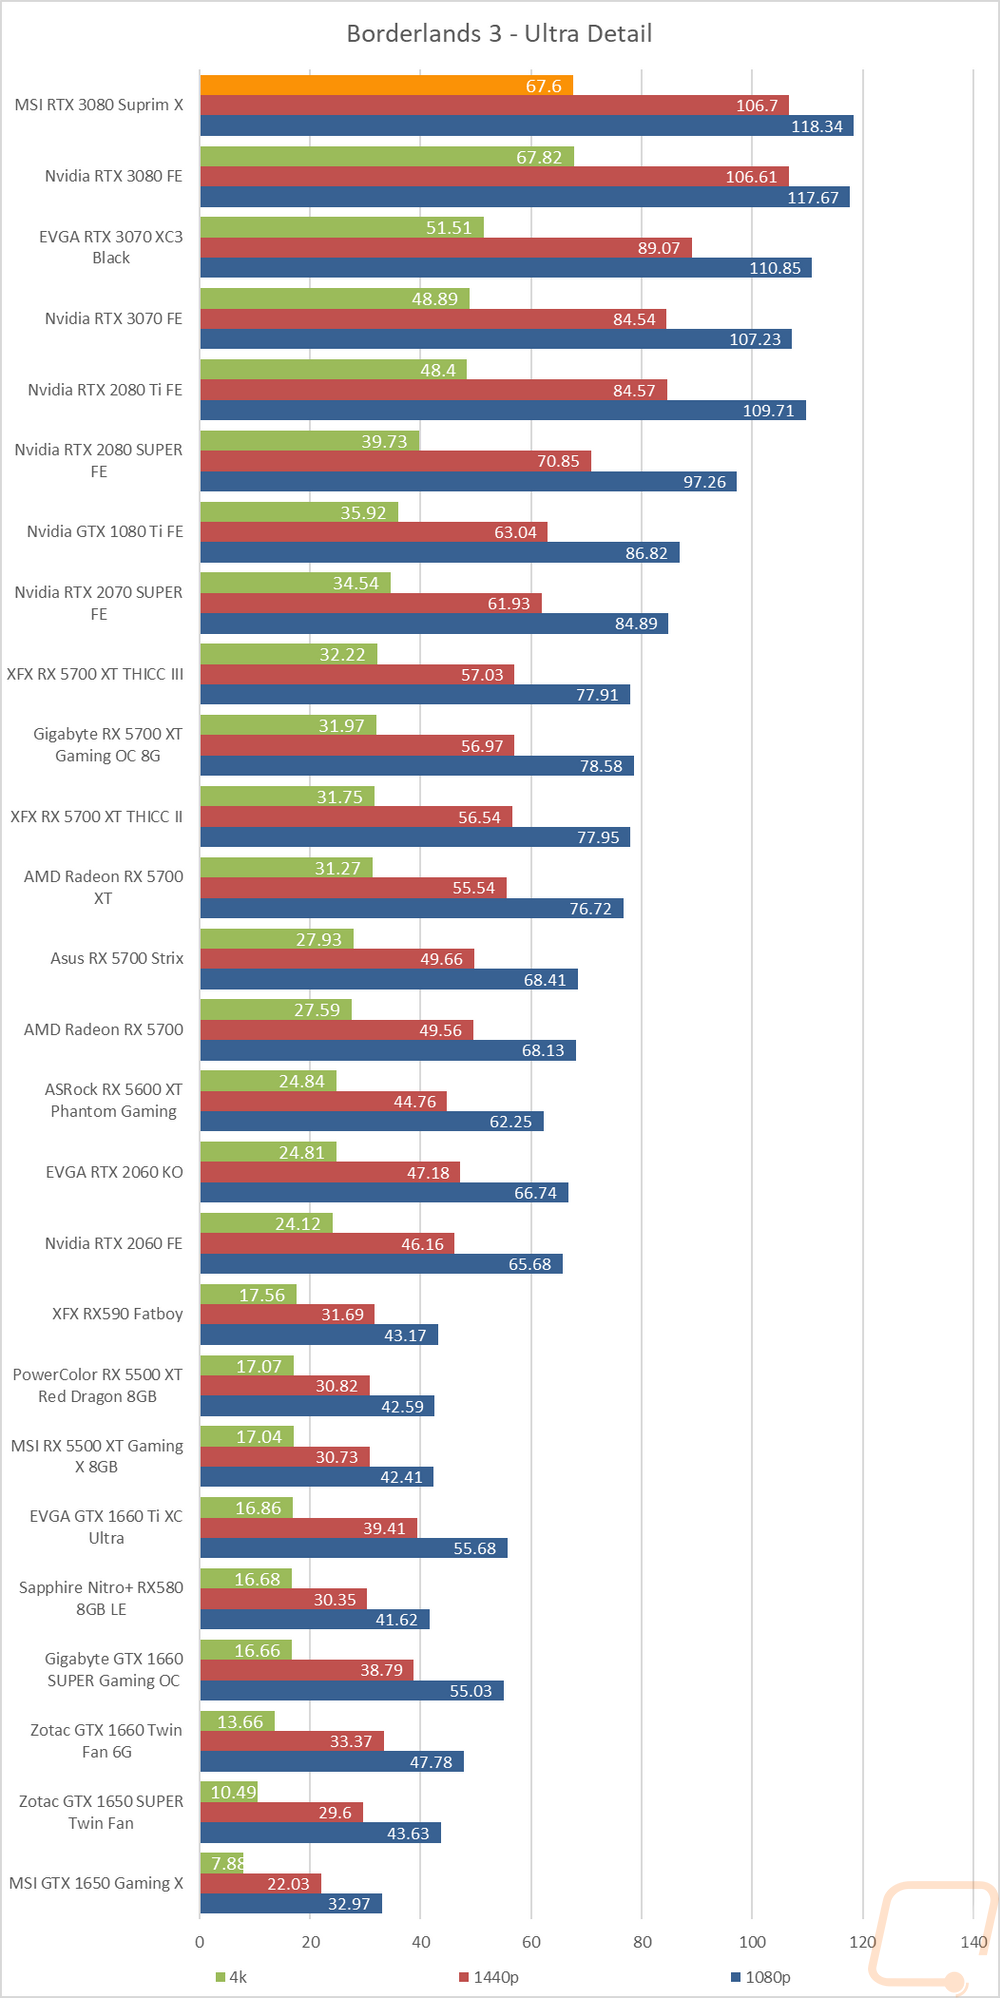
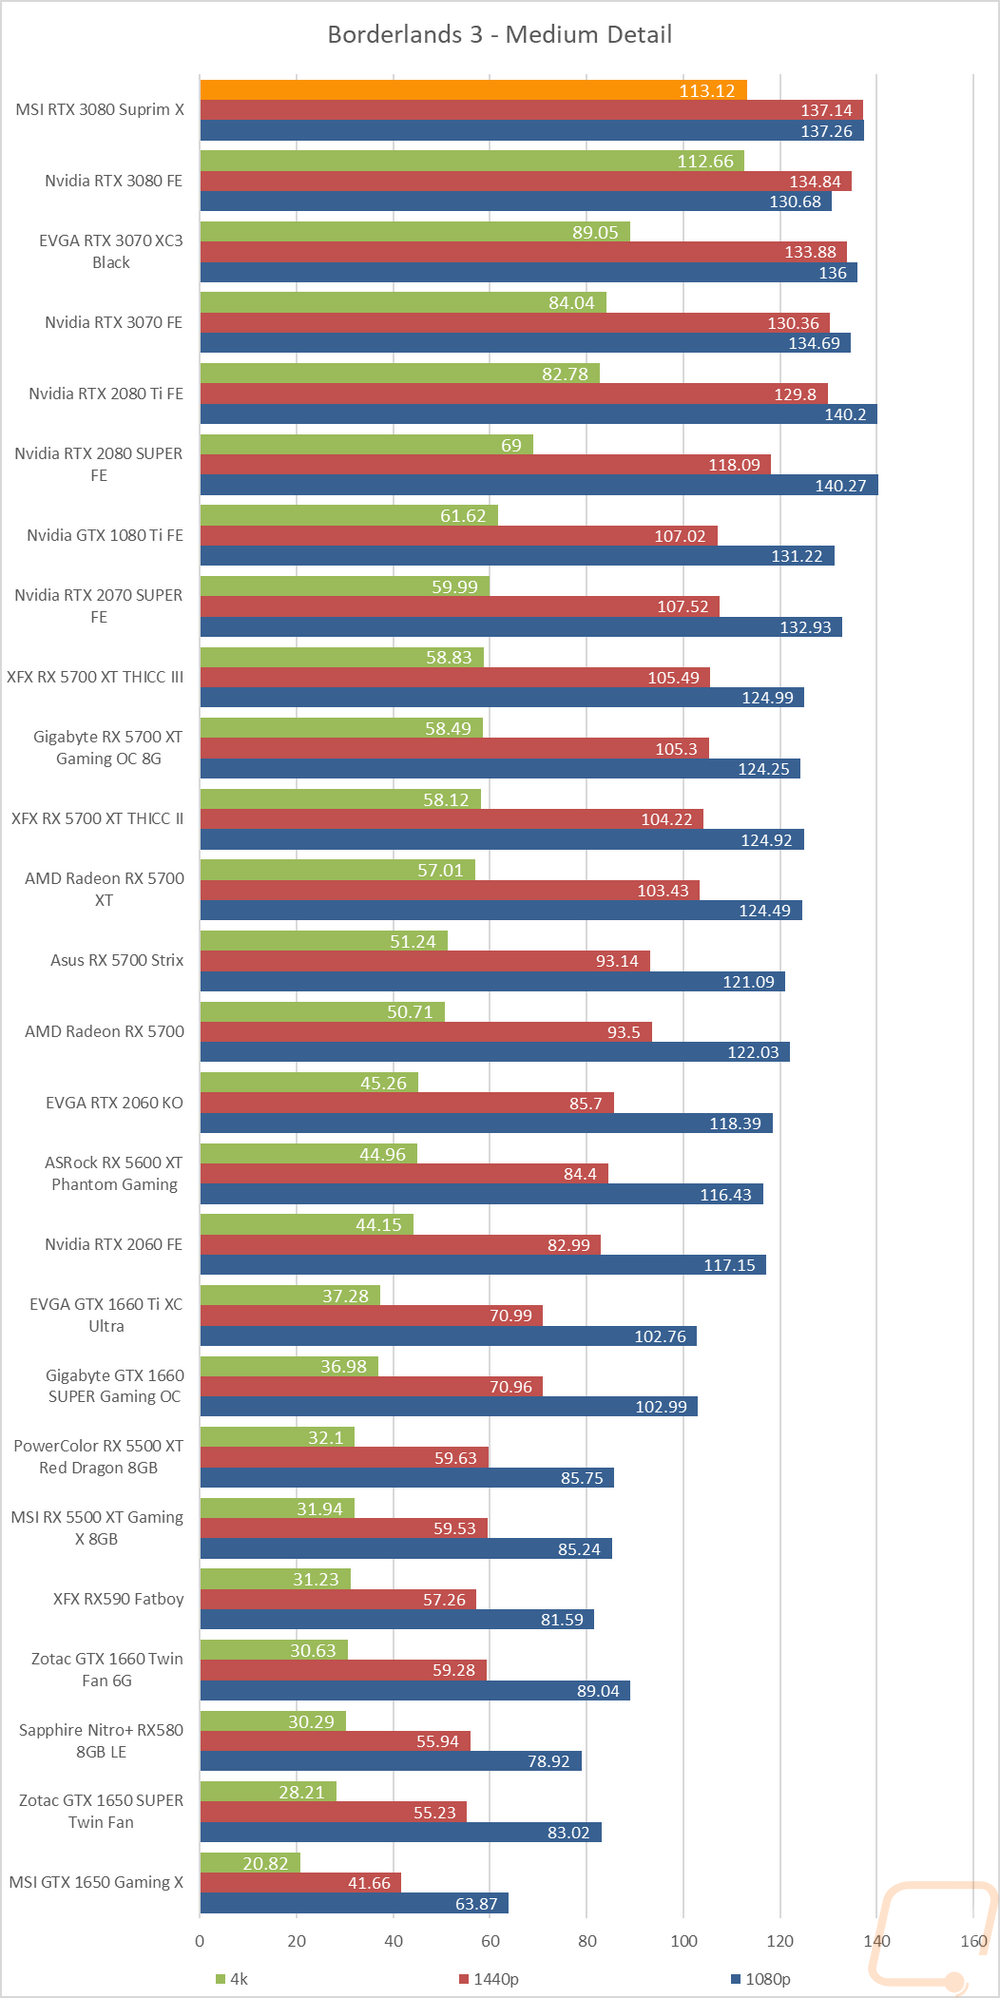
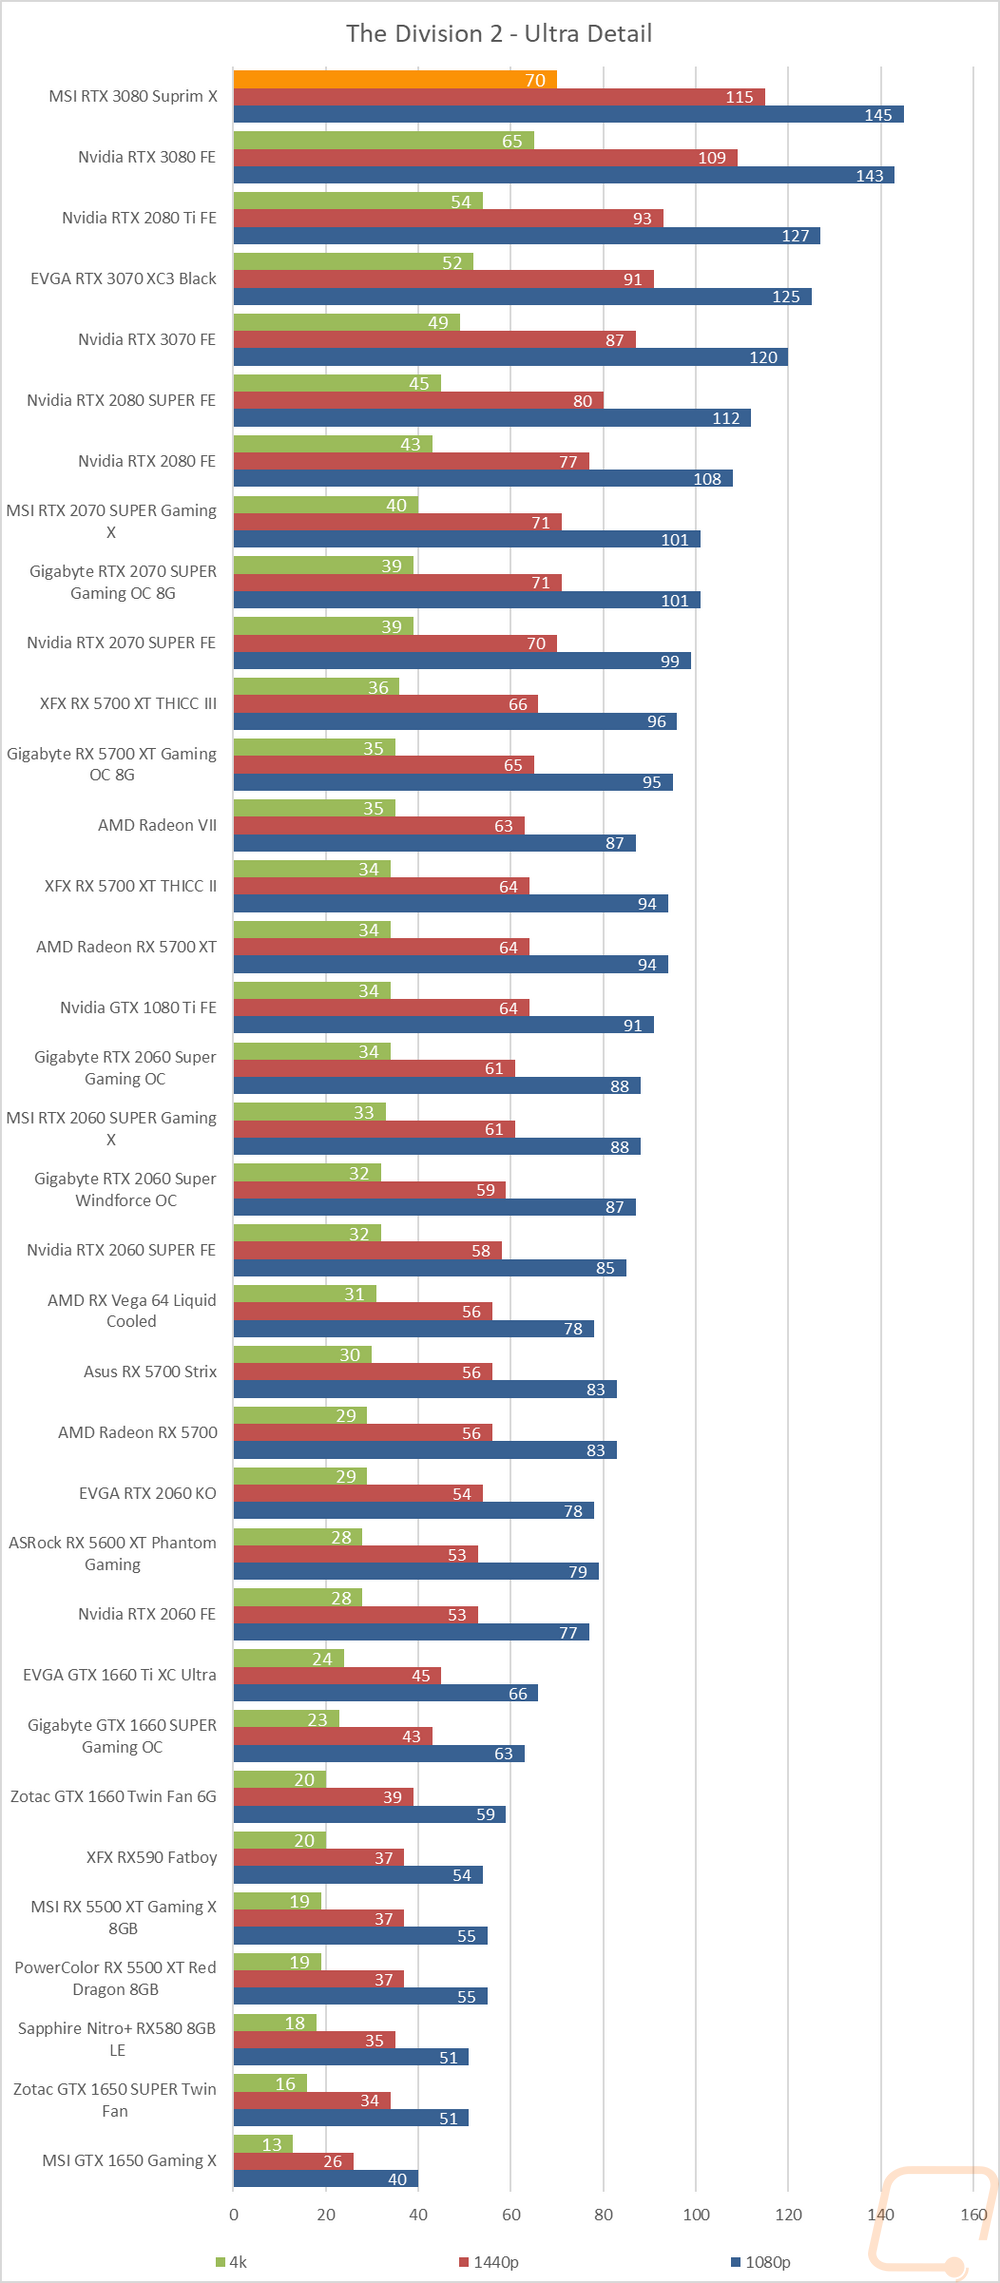
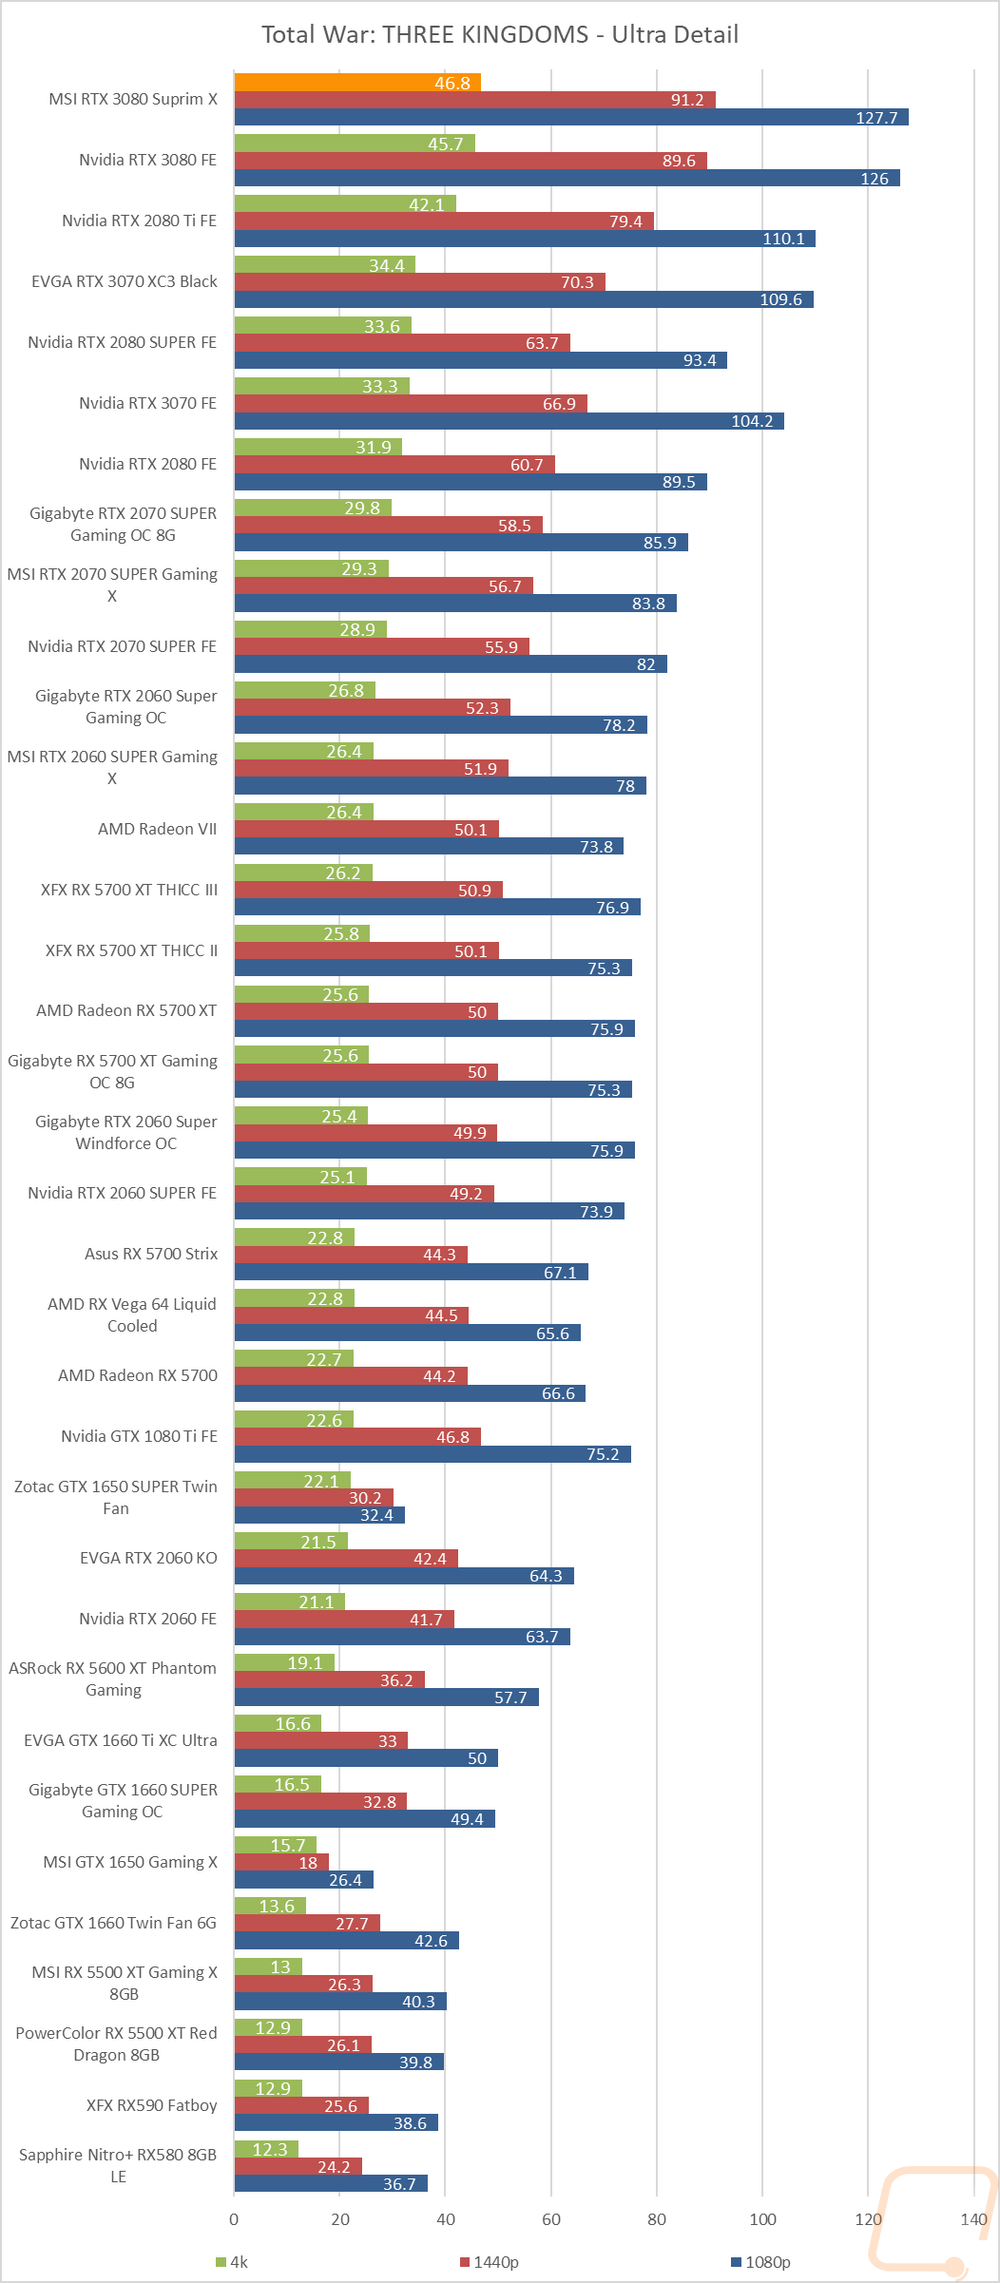
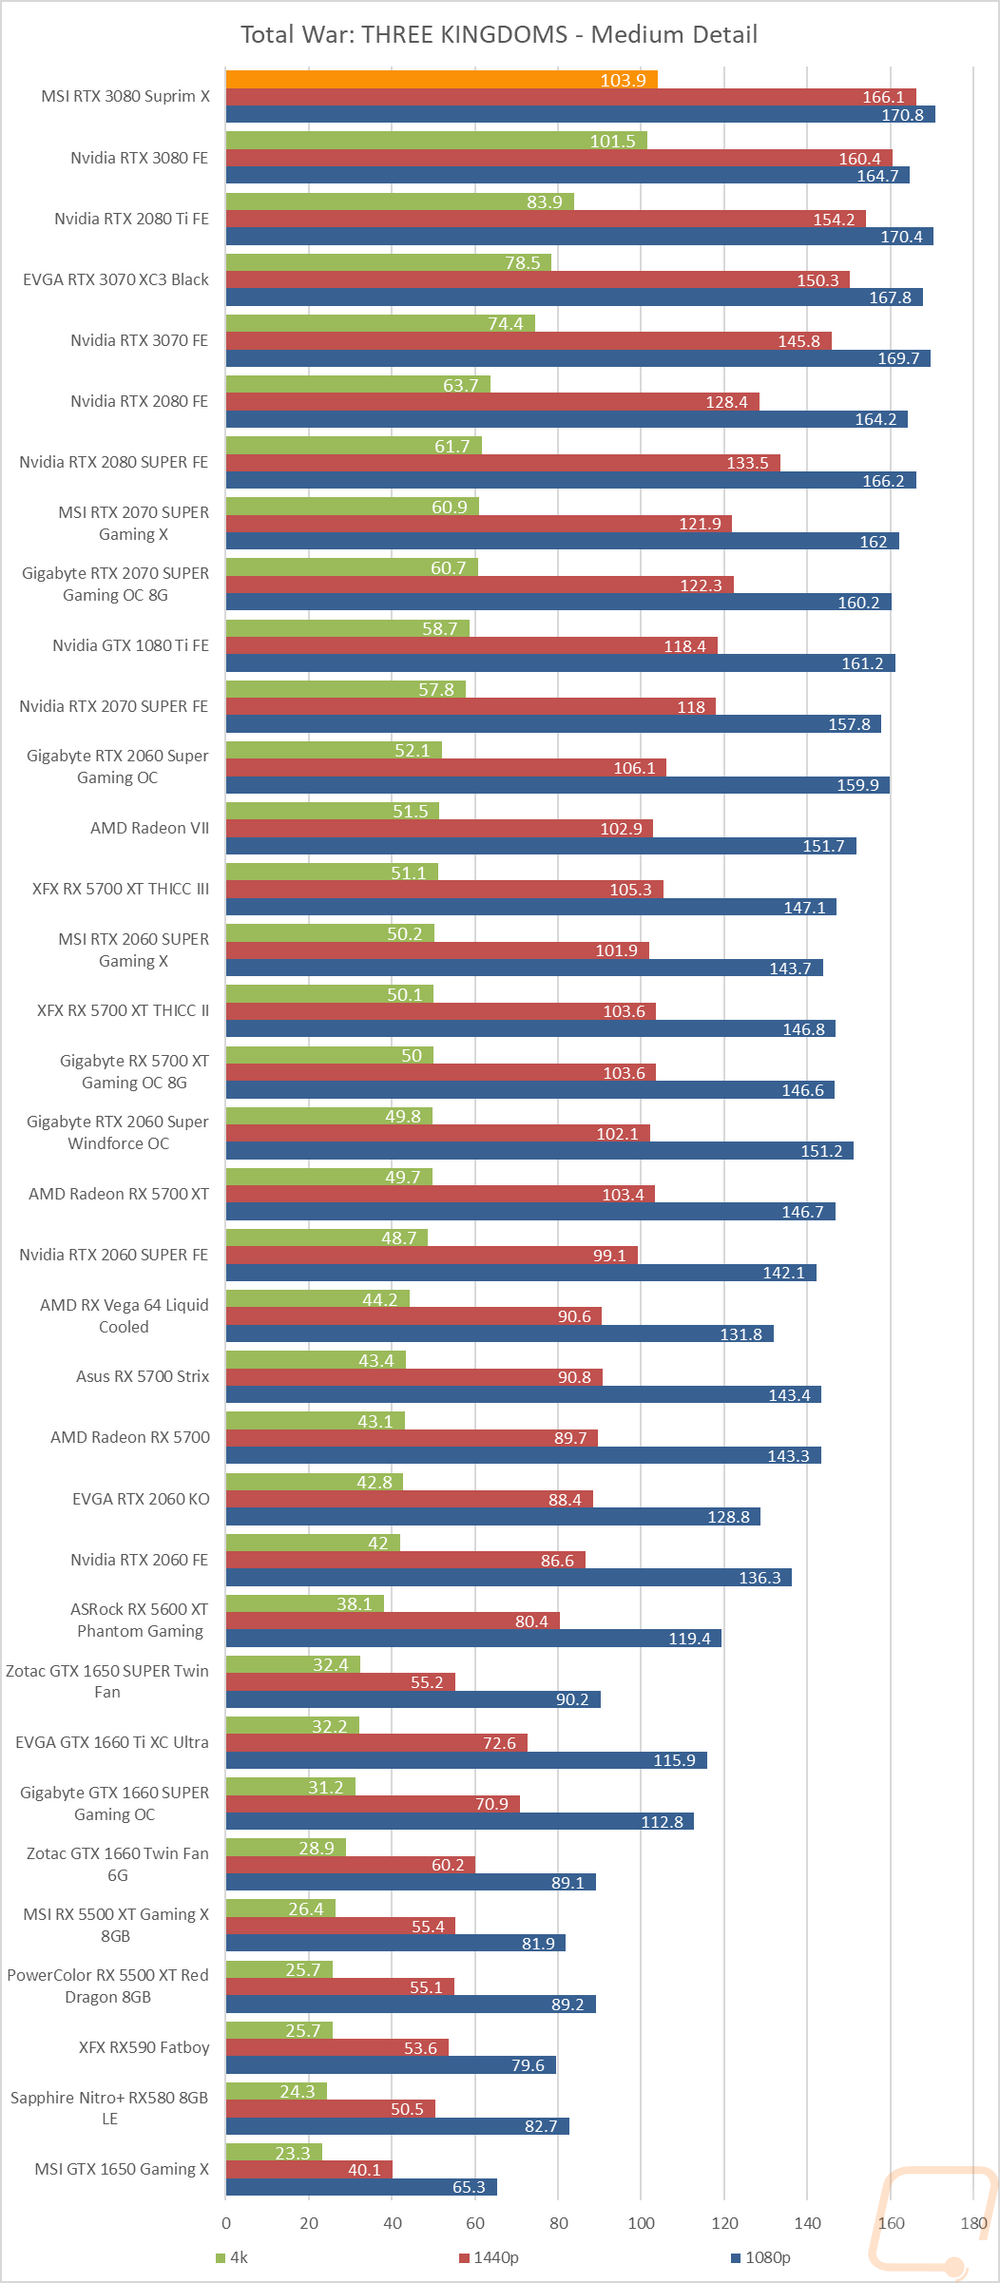
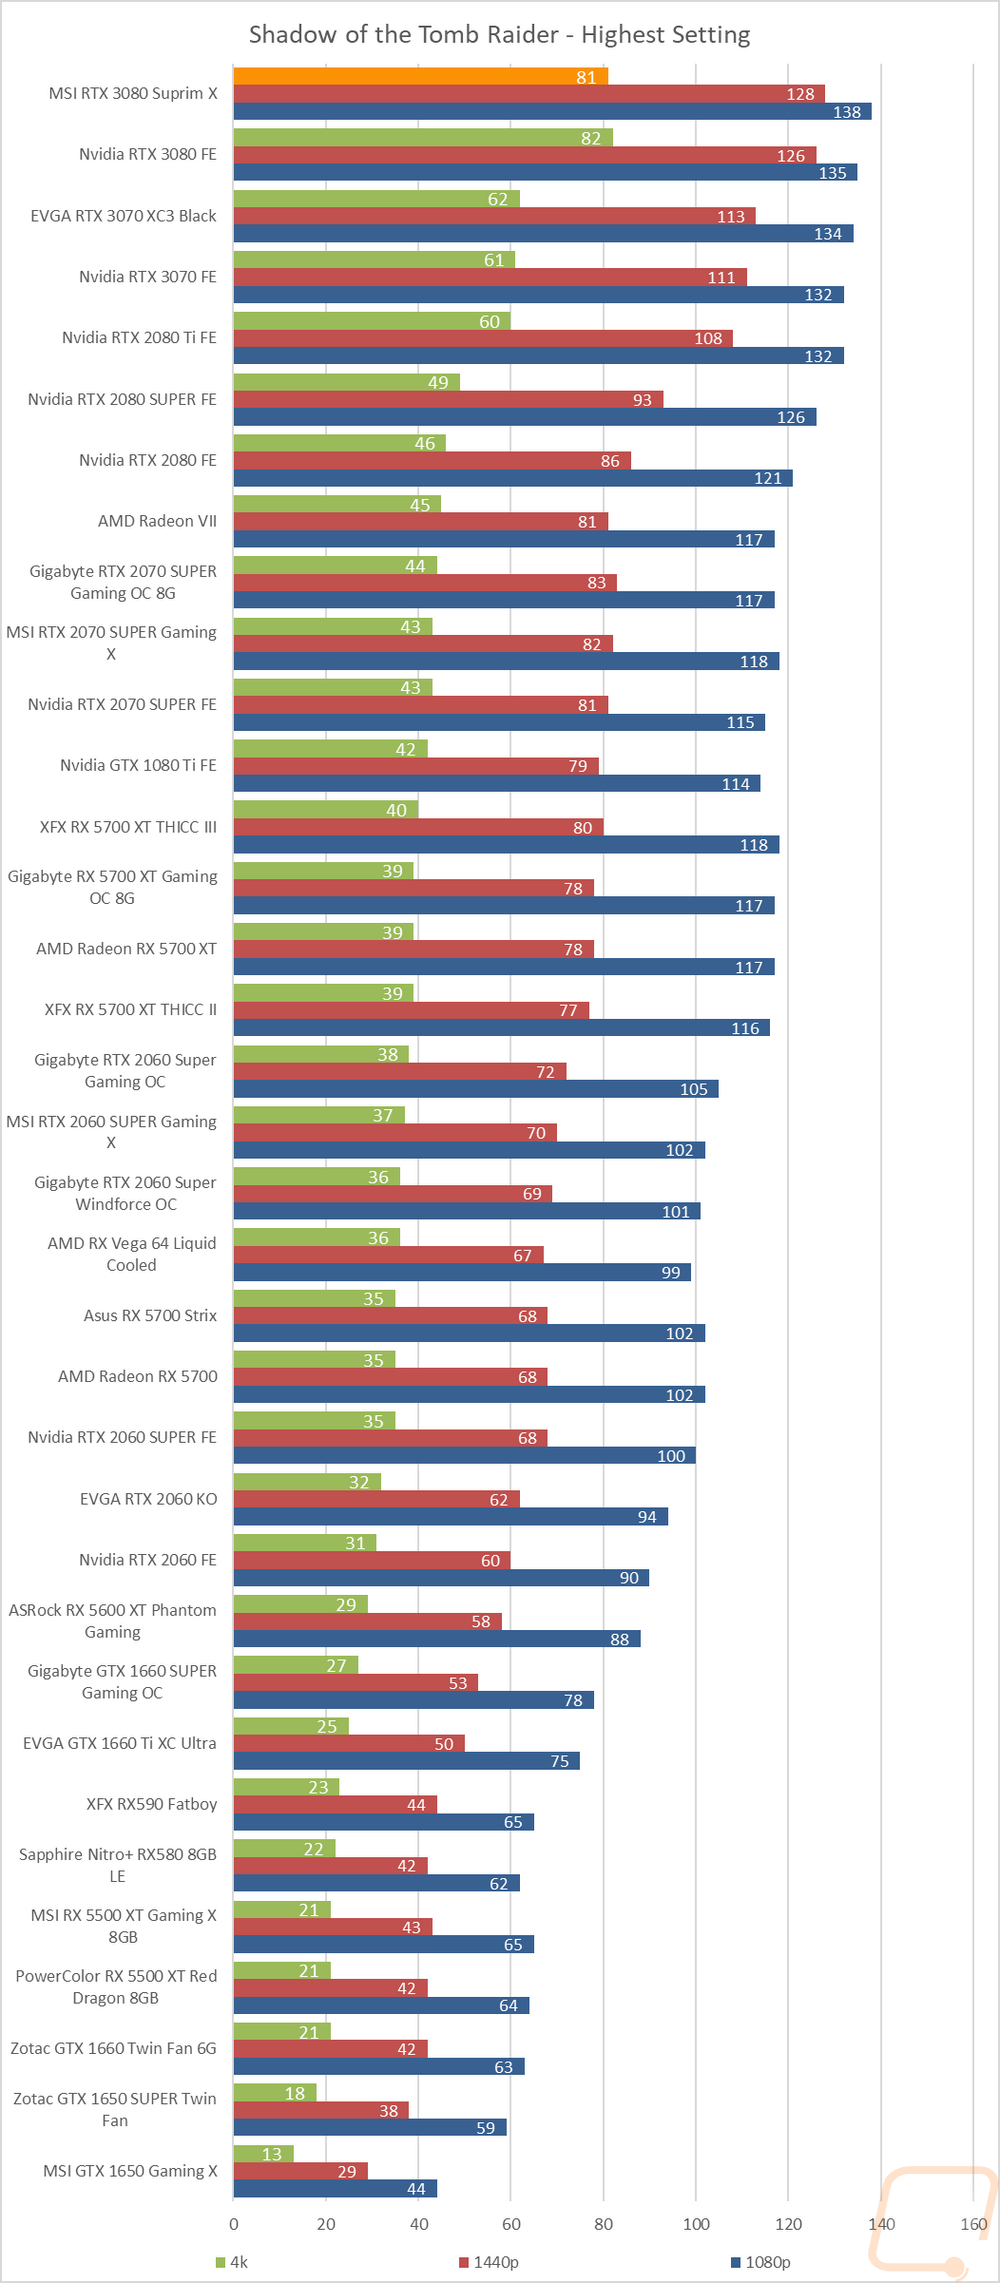
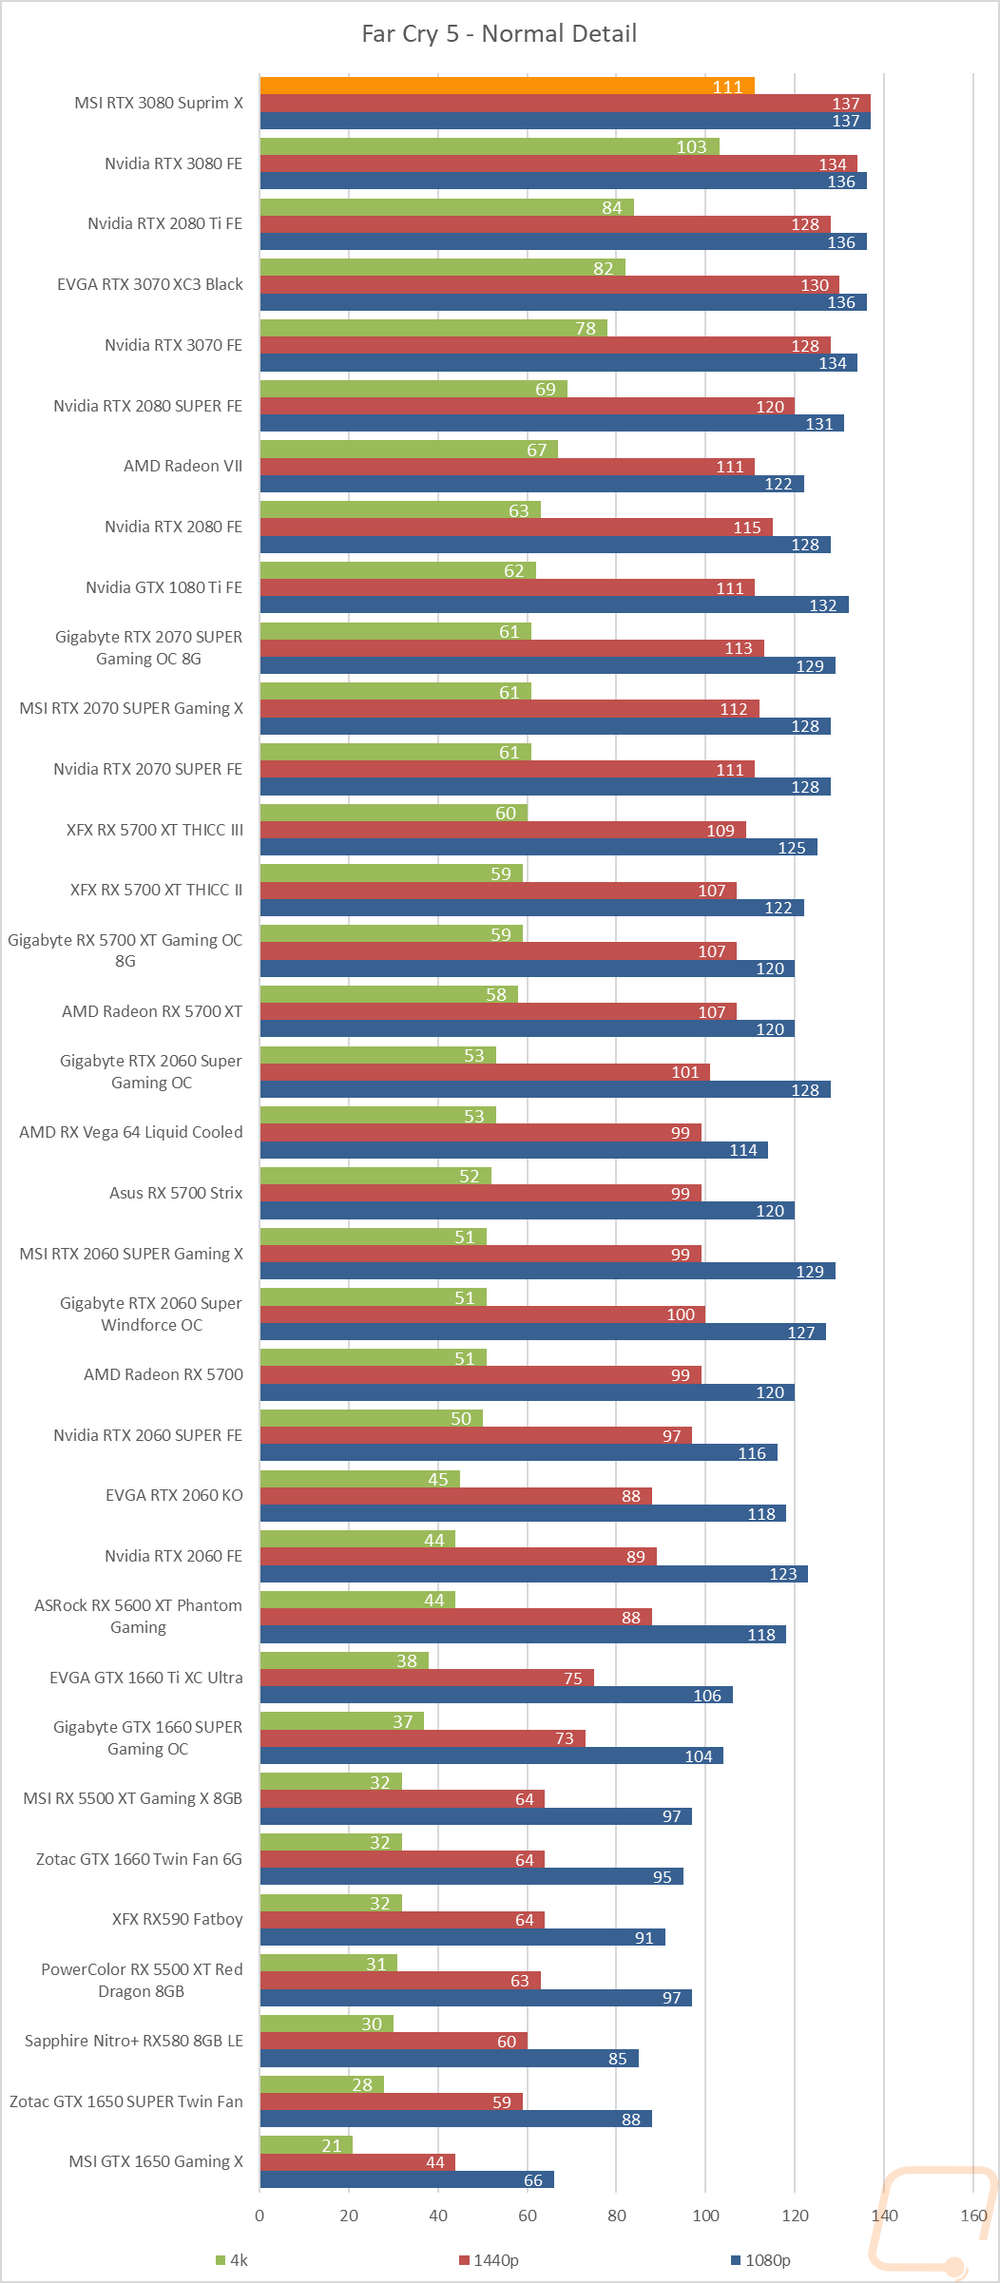
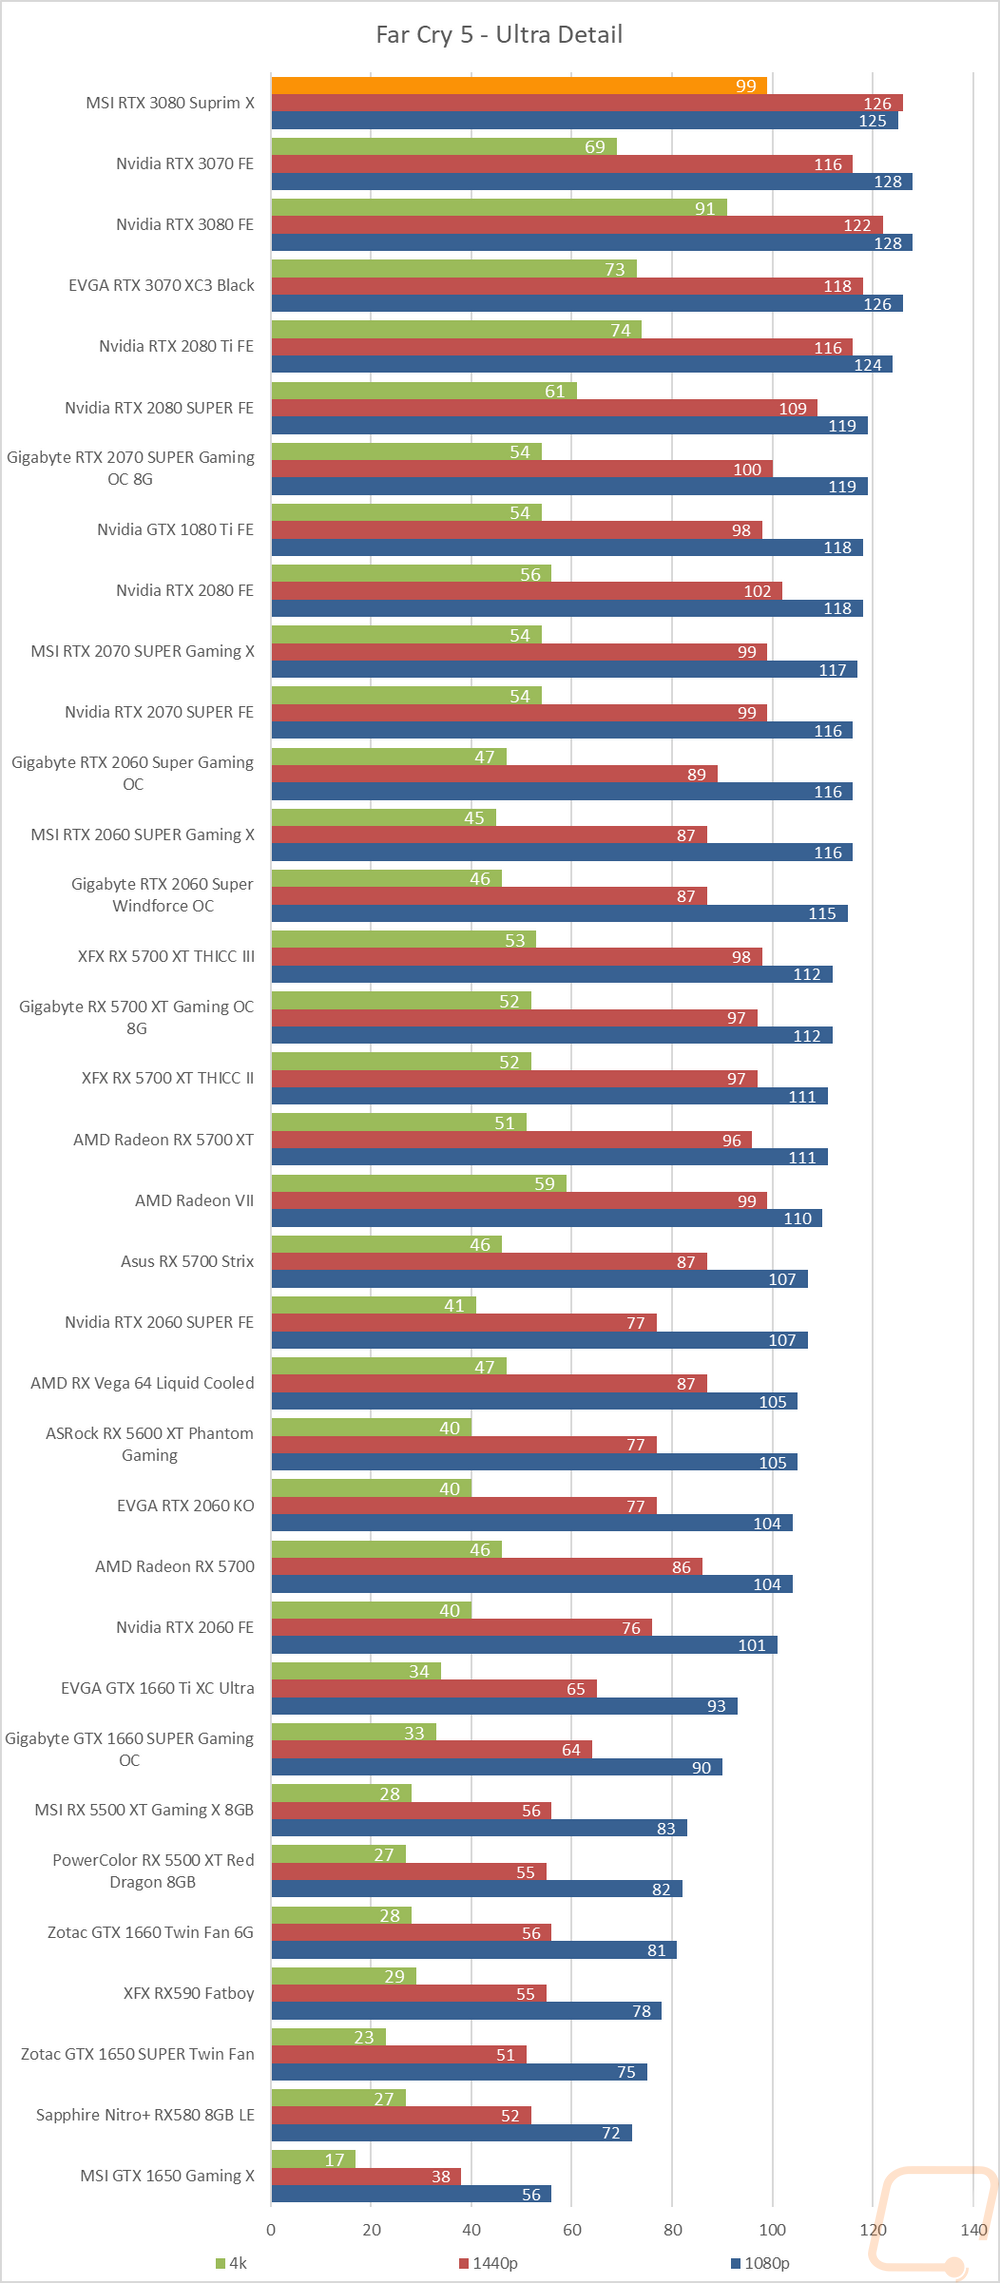
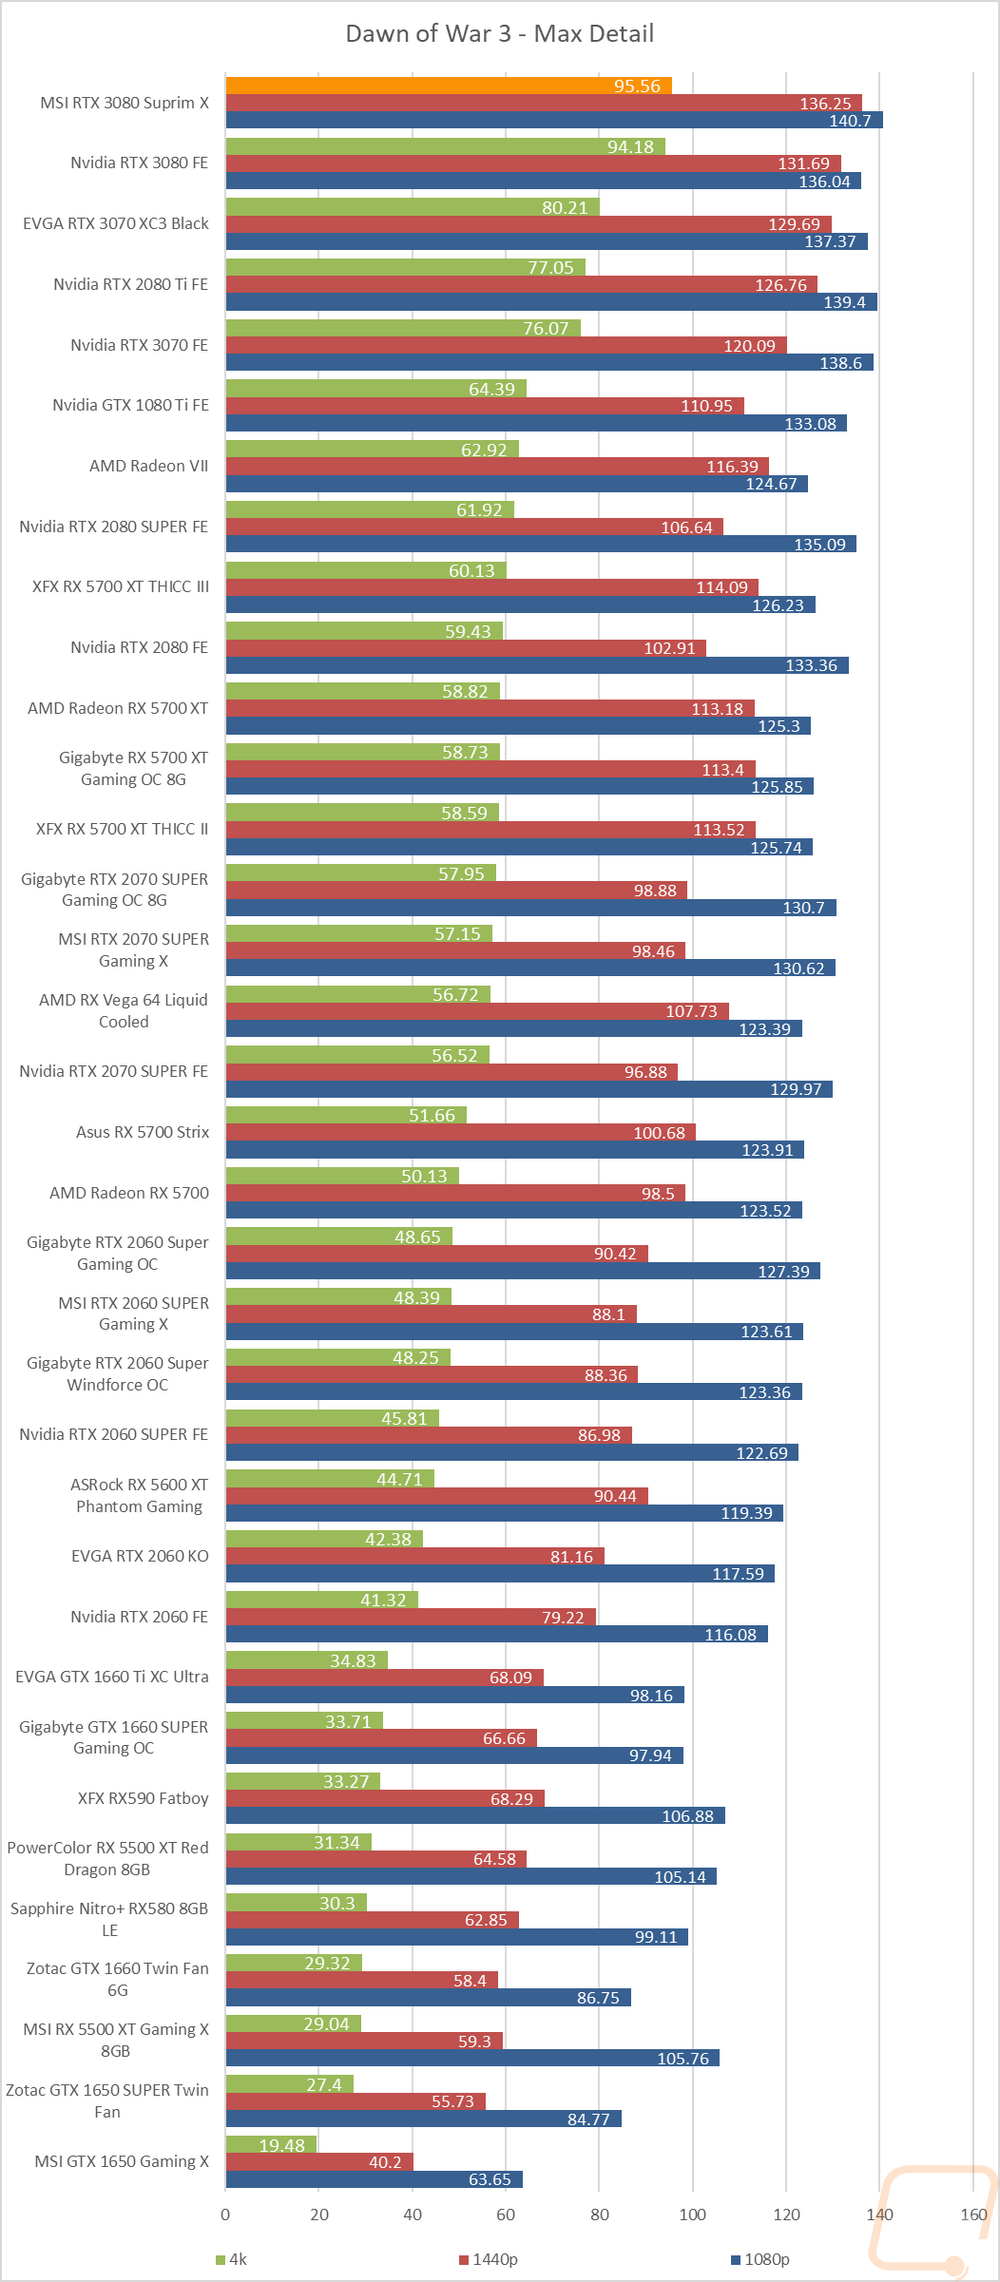
Diving into the actual results we can see that the addition of Watch Dogs did come in below 60 FPS at the Ultra details setting at 4k and seems to be CPU limited at the lower resolutions, especially at the lower high detail level. Comparing the SUPRIM X to the Founders Edition, it’s no surprise that with the 1905 MH boost clock it came in out ahead in all of the games and resolutions tested. In some, like Far Cry 5 at 4k with the ultra detail setting there was a big gap, specifically 8.7% for that one but most stayed closer to the 2.5% range.