Cooling, Noise, and Power
My last round of tests are all focused on areas that I find important, but don’t always have anything to do with gaming performance like most people are worried the most about. Here I test power usage, noise from the fans, and cooling performance. Once you have decided which GPU model you want, beyond clock speeds, these are the areas where different models from the same company and cards from multiple companies can stand out against each other.
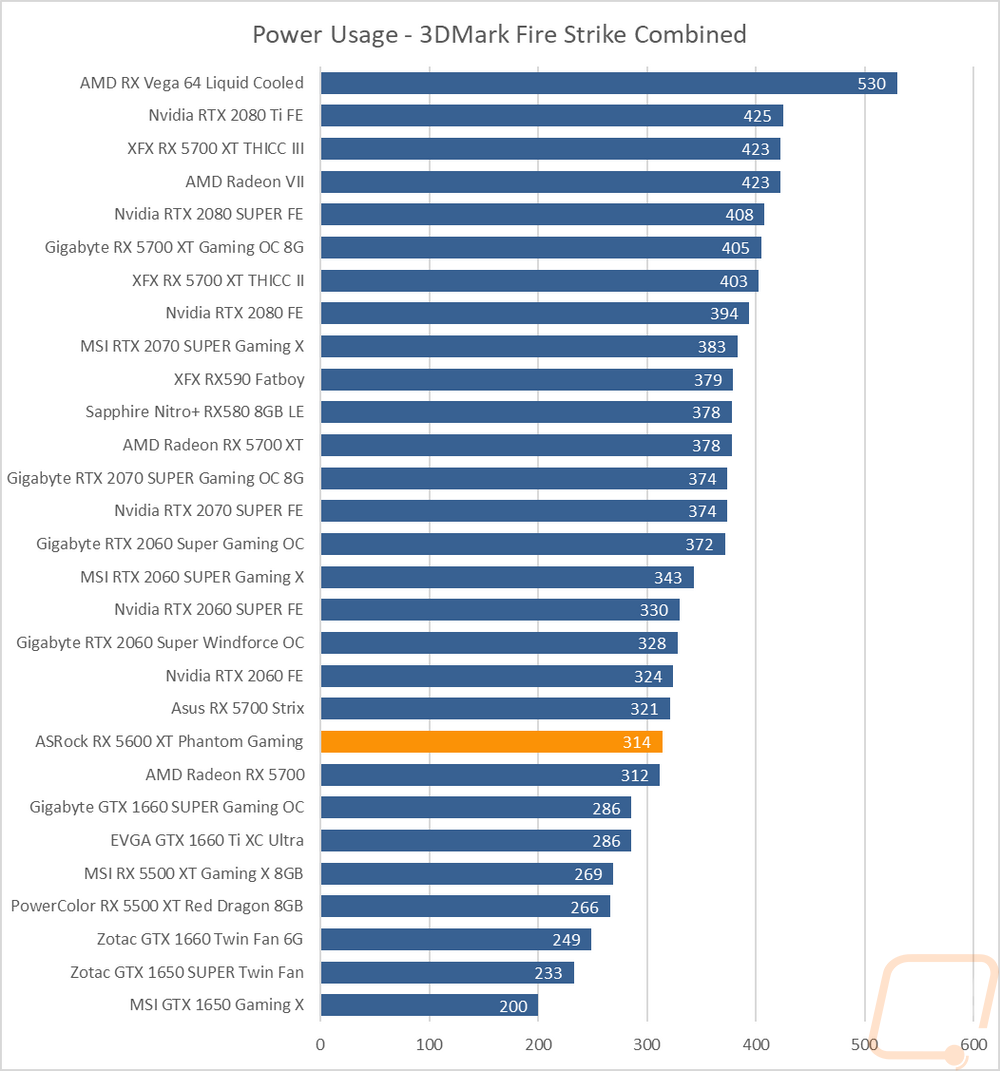
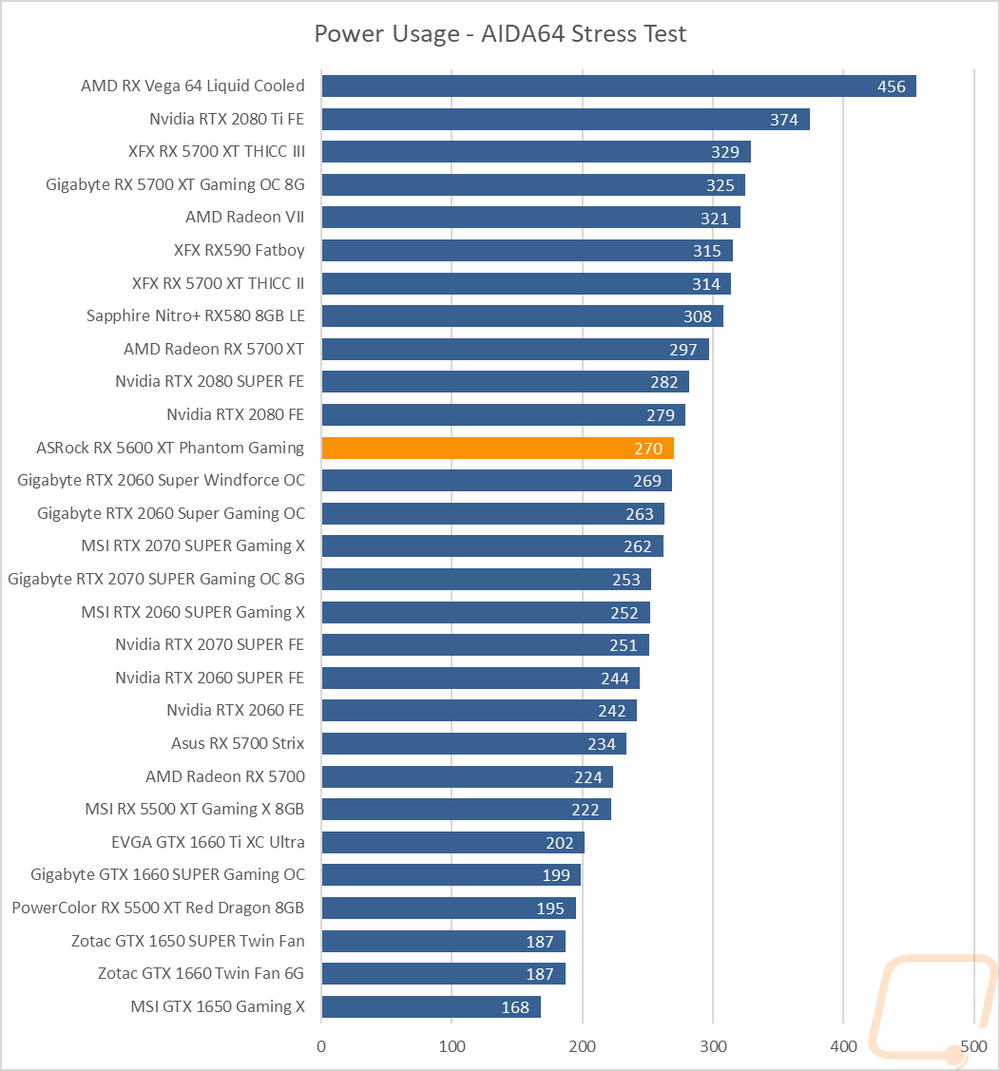
To start things off, I’m going to look at power usage. Stock for stock it should normally be about the same. But when it comes to overclocks, each company has their own idea of what amount of voltage is needed for a safe overclock. More means it can be more stable and with a lot of the auto overclocks these days more voltage can also mean some GPUs will run at a higher clock speed. But it also means more power usage and often more heat as well. To test this I use a kill-a-watt on our test system to measure total power draw in wattage and run two different tests. 3DMark Fire Strike during the combined test that loads the video card and CPU similar to a demanding game. Then I do a GPU only test using AIDA64’s stress test only on the GPU which puts even more load on the video card but doesn’t have any extra CPU power being pulled. In the 3Dmark test, the RX 5600 XT Phantom Gaming pulled 314 watts which right with the RX 5700 and just 10 watts below the RTX 2060. In the AIDA64 test, the wattage dropped down to 270 which put the 5600 XT up with the overclocked RTX 2060 SUPERs. I should point out that with the original BIOS before the “2060 price drop 5600 XT overclock” the card pulled 218 which is a huge difference.
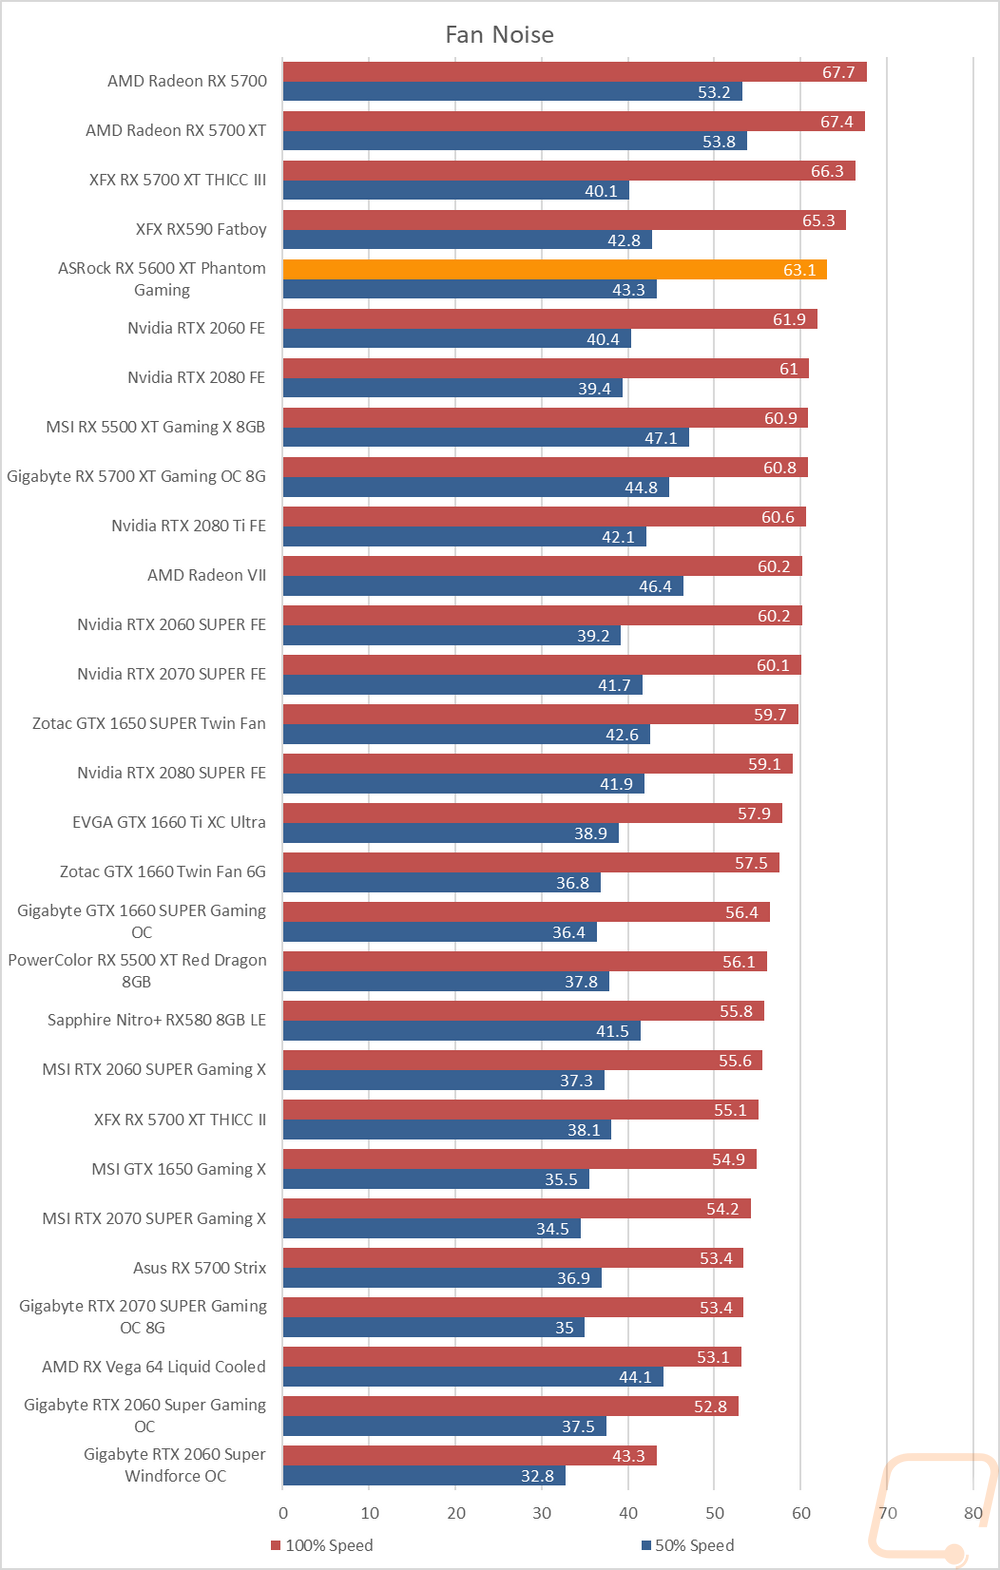
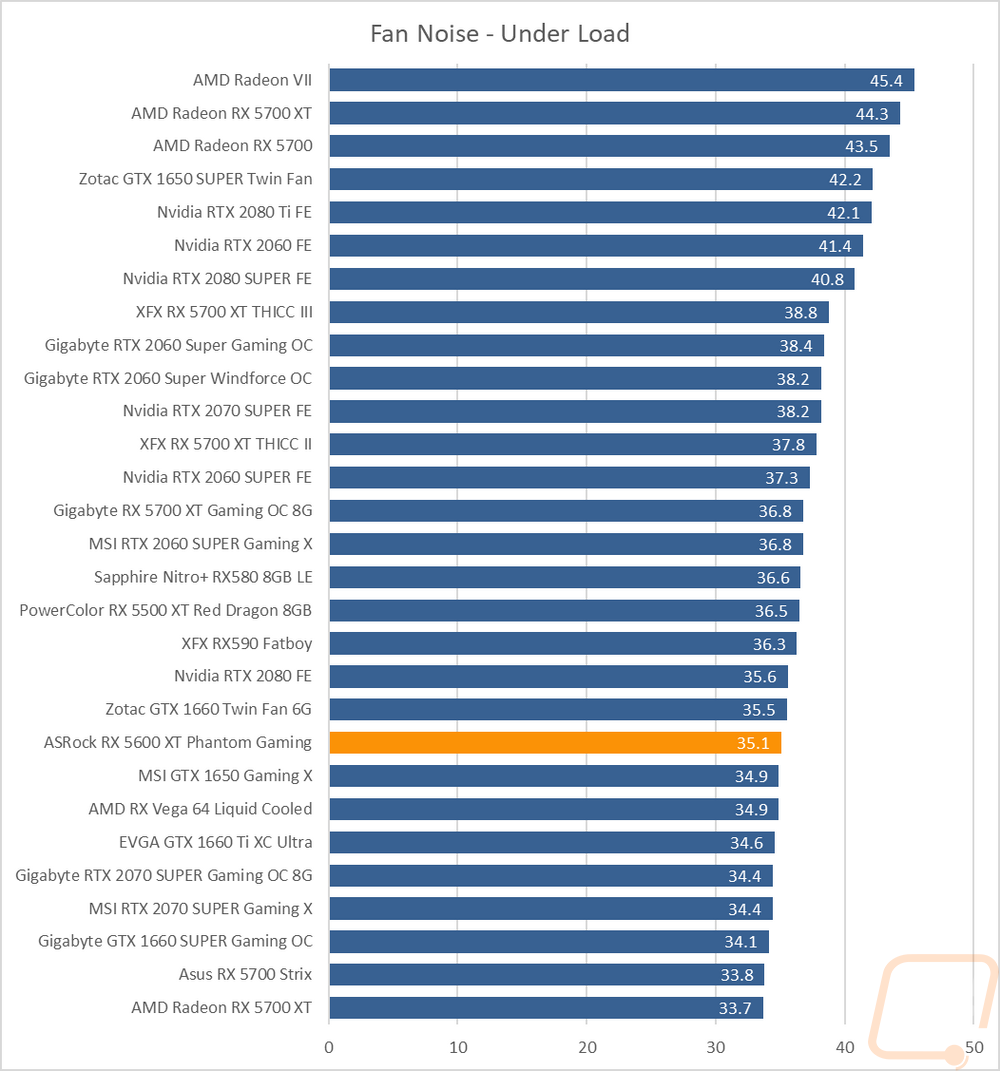
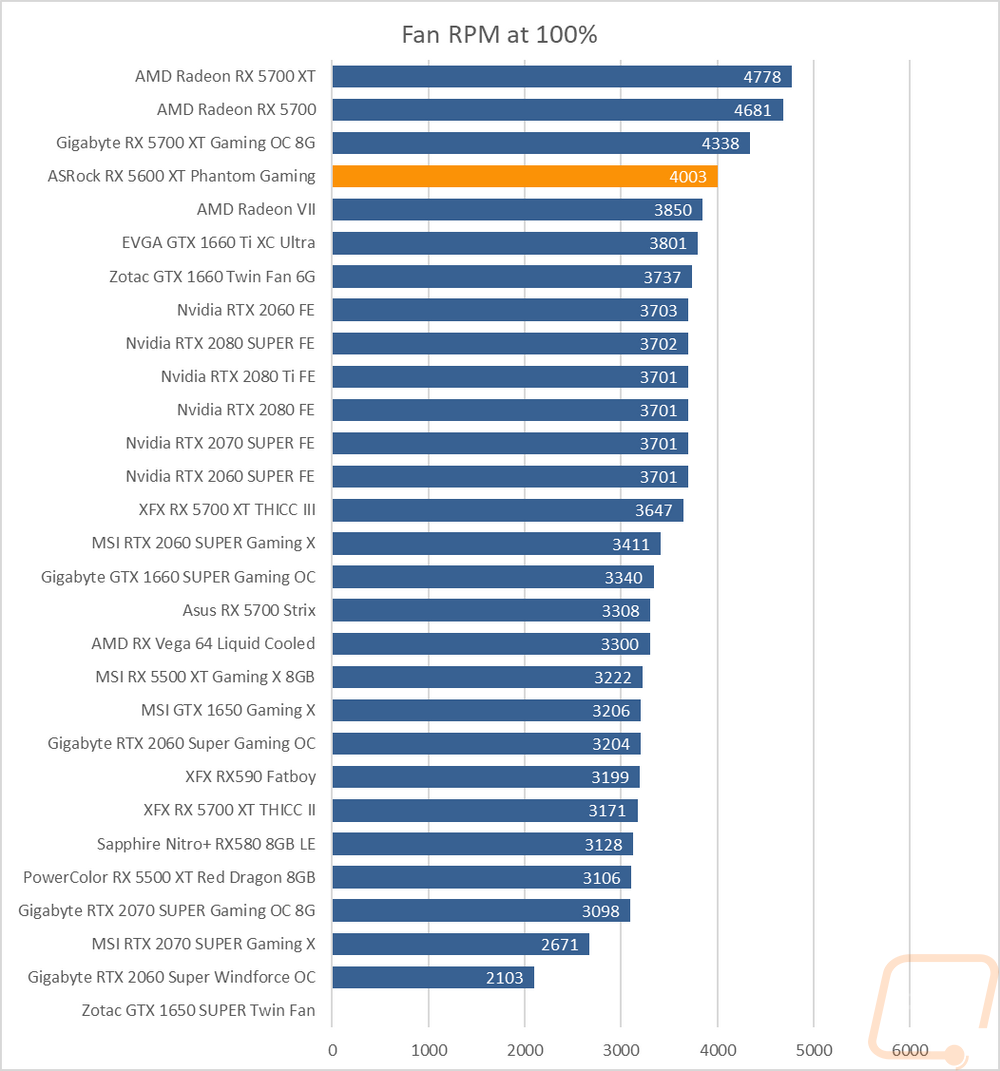
For the next test, I look at the noise output of the cooler. For this, I set up our decibel meter 18 inches away from the test bench and I run three tests. I do a manual speed test with the card set to 50% and 100% fan speeds, which by the way the AMD driver still freaks out when doing this required a reboot to get the fan speeds to drop back down. Then I do a third with the card under an AIDA64 load for over a half-hour where I test the noise level of the card in a worst-case scenario with the stock fan profile. ASRock did have the Phantom Gaming up on the high end of the chart at 100% fan speed, the 50% result was a little better with a few of the cards below it higher at 50%. This was still way off from the noise that both of the reference RX 5700 series cards put out, they were horrible. The RPM chart explains why the Phantom Gaming was so high up the charts as well with the 100% fan speed RPM being right up in the same area of the chart with its 4000 RPM fans. Then the last and most important test is the under load test. The Phantom Gaming was in the bottom half this time around showing that even though the fans can make all of that noise, they don’t need too with the stock fan profile.
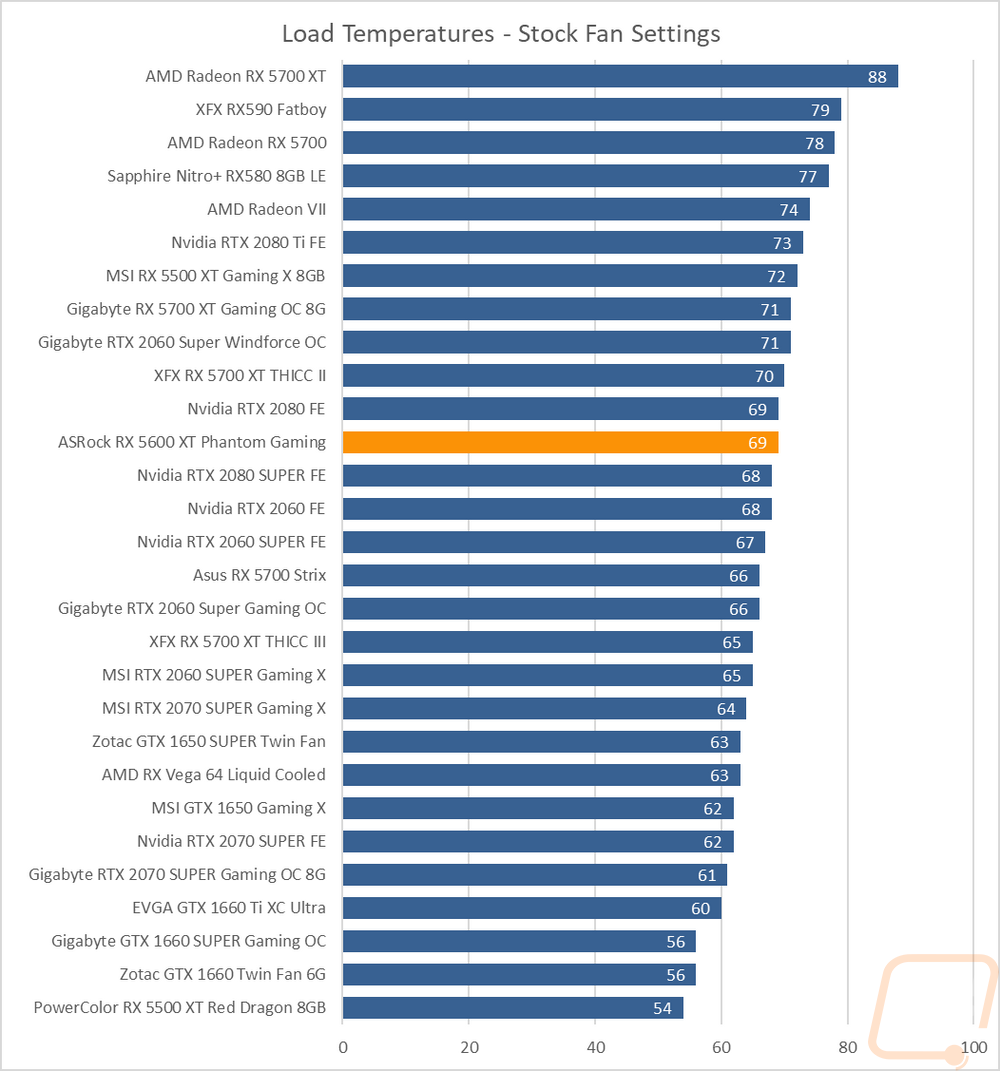
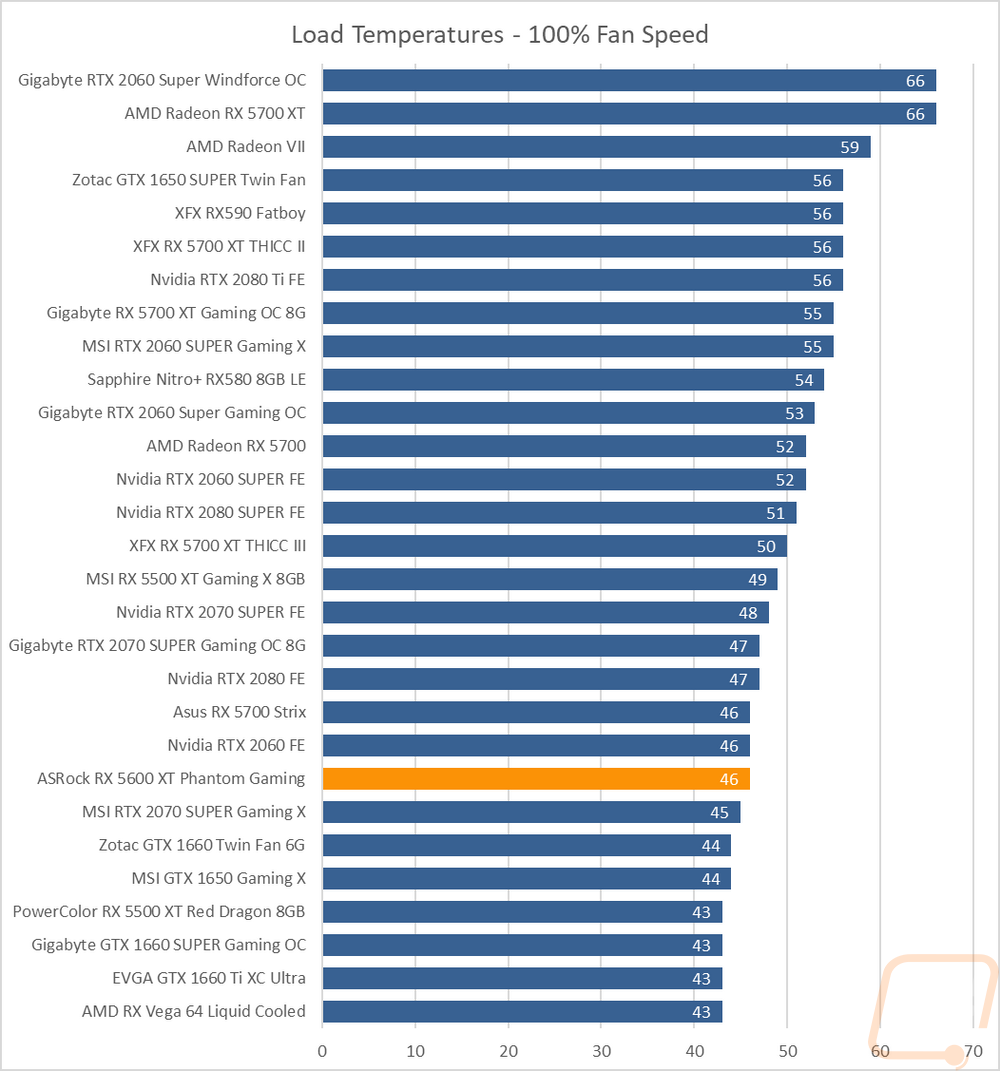
My last set of tests are the most important, thermal testing. For this, I use the AIDA64 Stress Test again. I run the test for a half hour or longer, waiting on the temperatures to level off. I do the test twice, once with the stock fan profile and then again with the fans running at 100% fan speed. This gives us a look at what to expect for temps in a worst-case when gaming and then 100% lets us see how much room is left. So with the stock fan profile, the Phantom Gaming reached 69 degrees which is a lot more like a reference card than an aftermarket. The 61 degree’s that this card did with the original BIOS was great but the update clearly changed the dynamics of things. At 100% fan speed temperatures dropped down to 46 degrees which kept it around the same place in the charts. But the 23-degree delta between the two isn’t bad at all but it also tells us that they may have benefited by adjusting the fan profile a little with the new overclock.
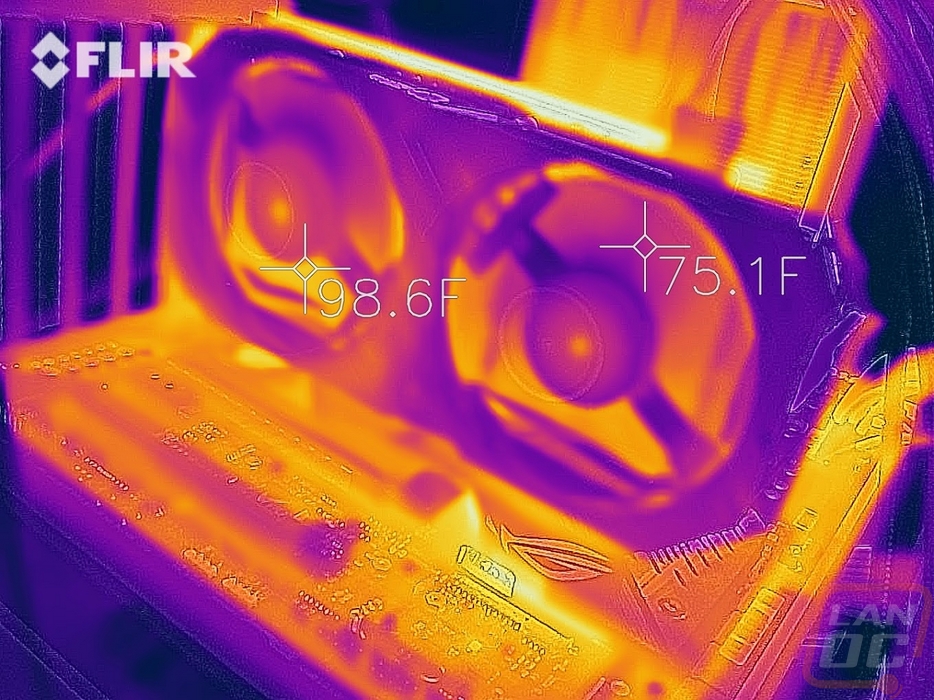
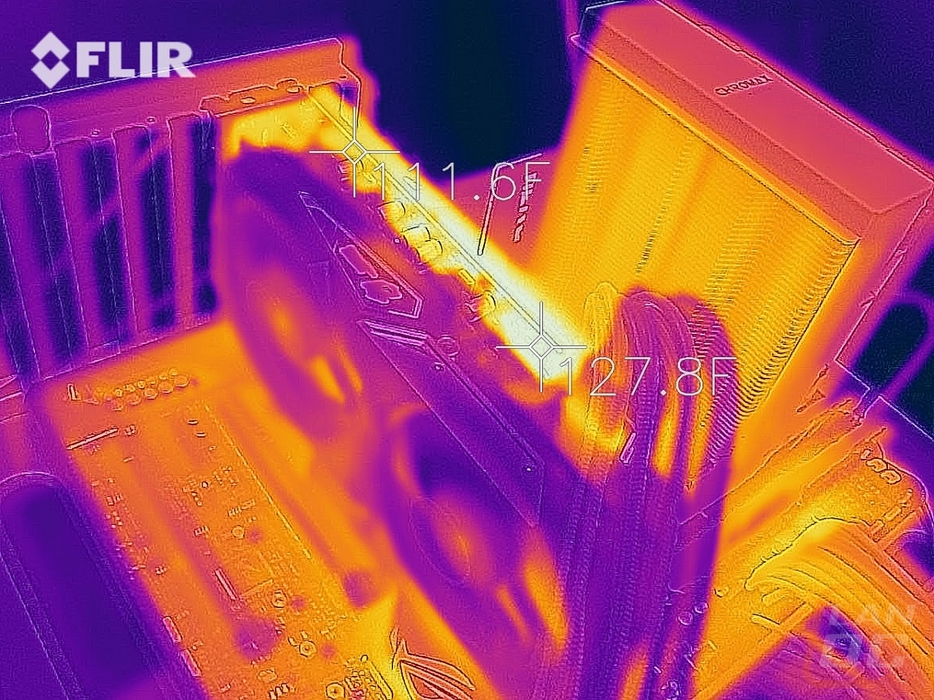
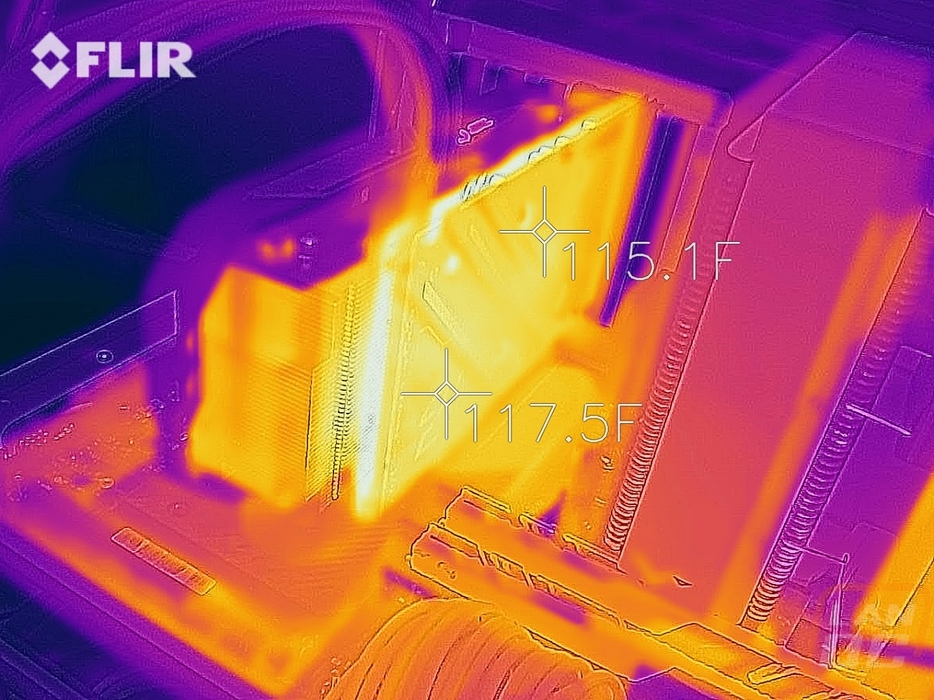
When doing the stock fan profile test, I do also get a few thermal images of the RX 5600 XT Phantom Gaming to see how things are looking. The fan side of the card didn’t show any significant hotspots, including down along the bottom edge where a lot of cards like to vent. ASRock did a great job getting good cooling performance with a dual axial fan design and those horizontal fins that often don’t cool as good as they should. You can see that the left fan does have a slightly warmer area on the bottom than the right fan has, but it wasn’t warm enough to be concerned at all. Up on top, you can see that the PCB is the hottest part of the card, especially down on the VRM side of the card which is a little bit of a concern. The backplate image shows similar with it being cooler on end near the PCI bracket. You can also see how the card is venting out at the end with that haziness, it's good to see the air being pushed that far.