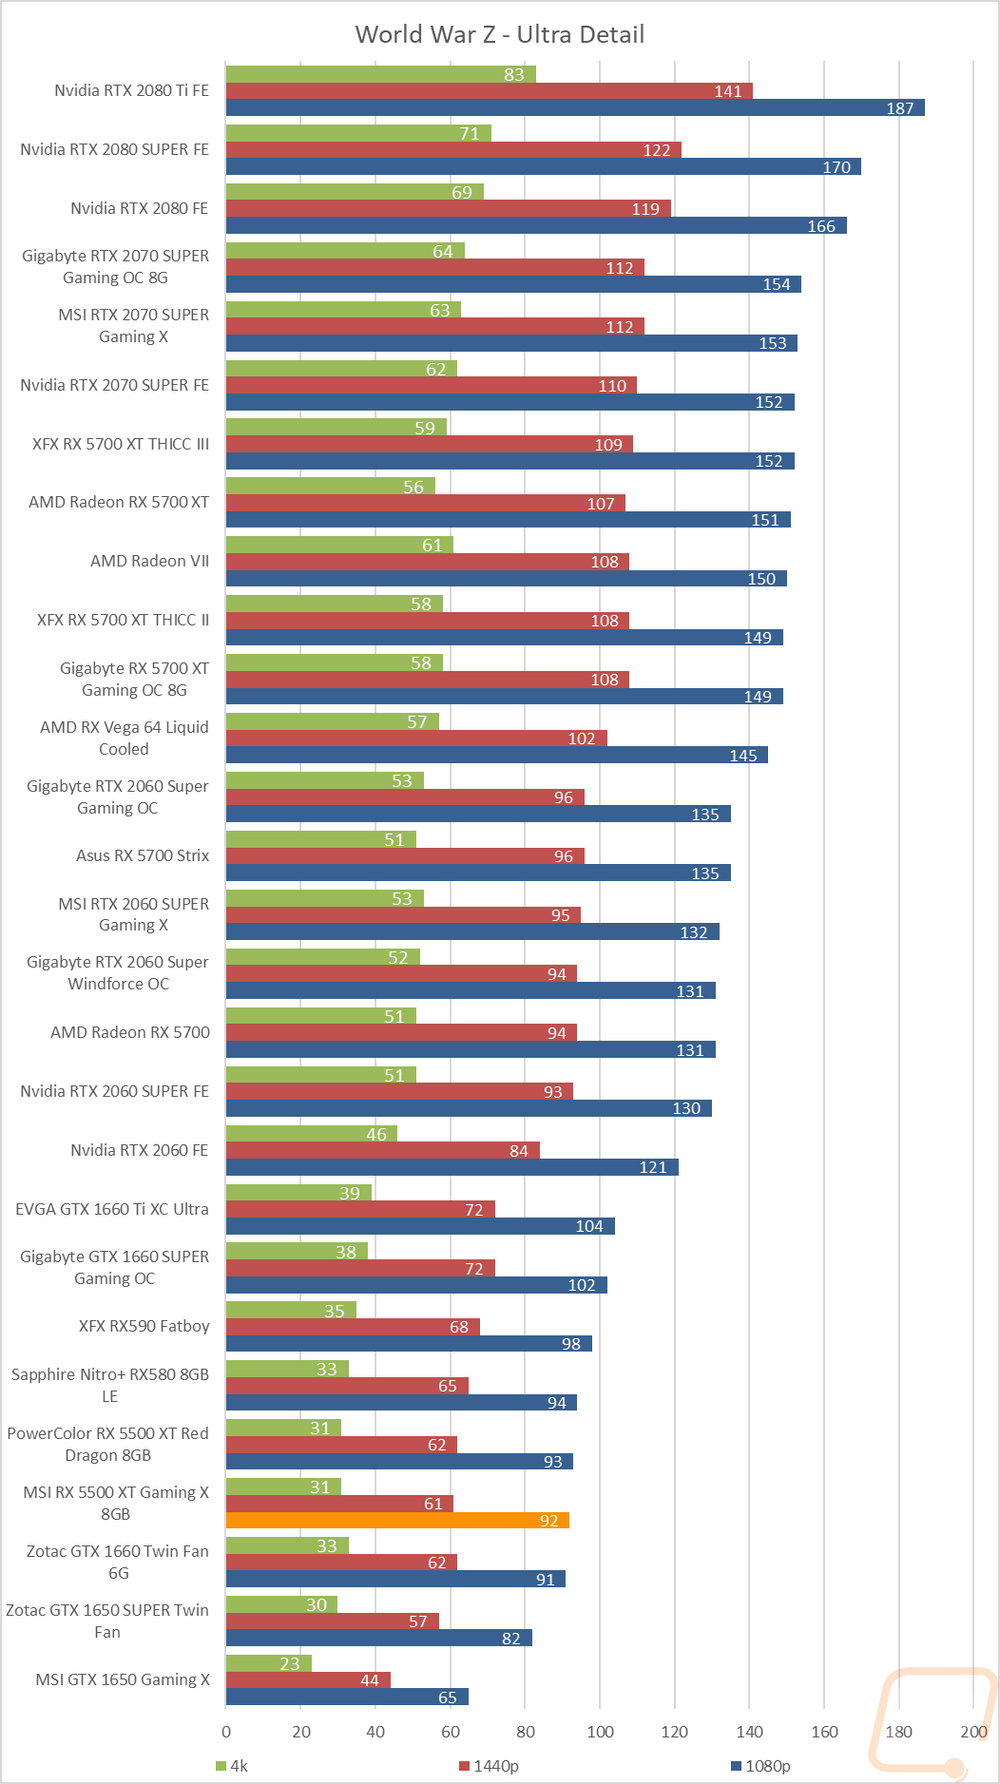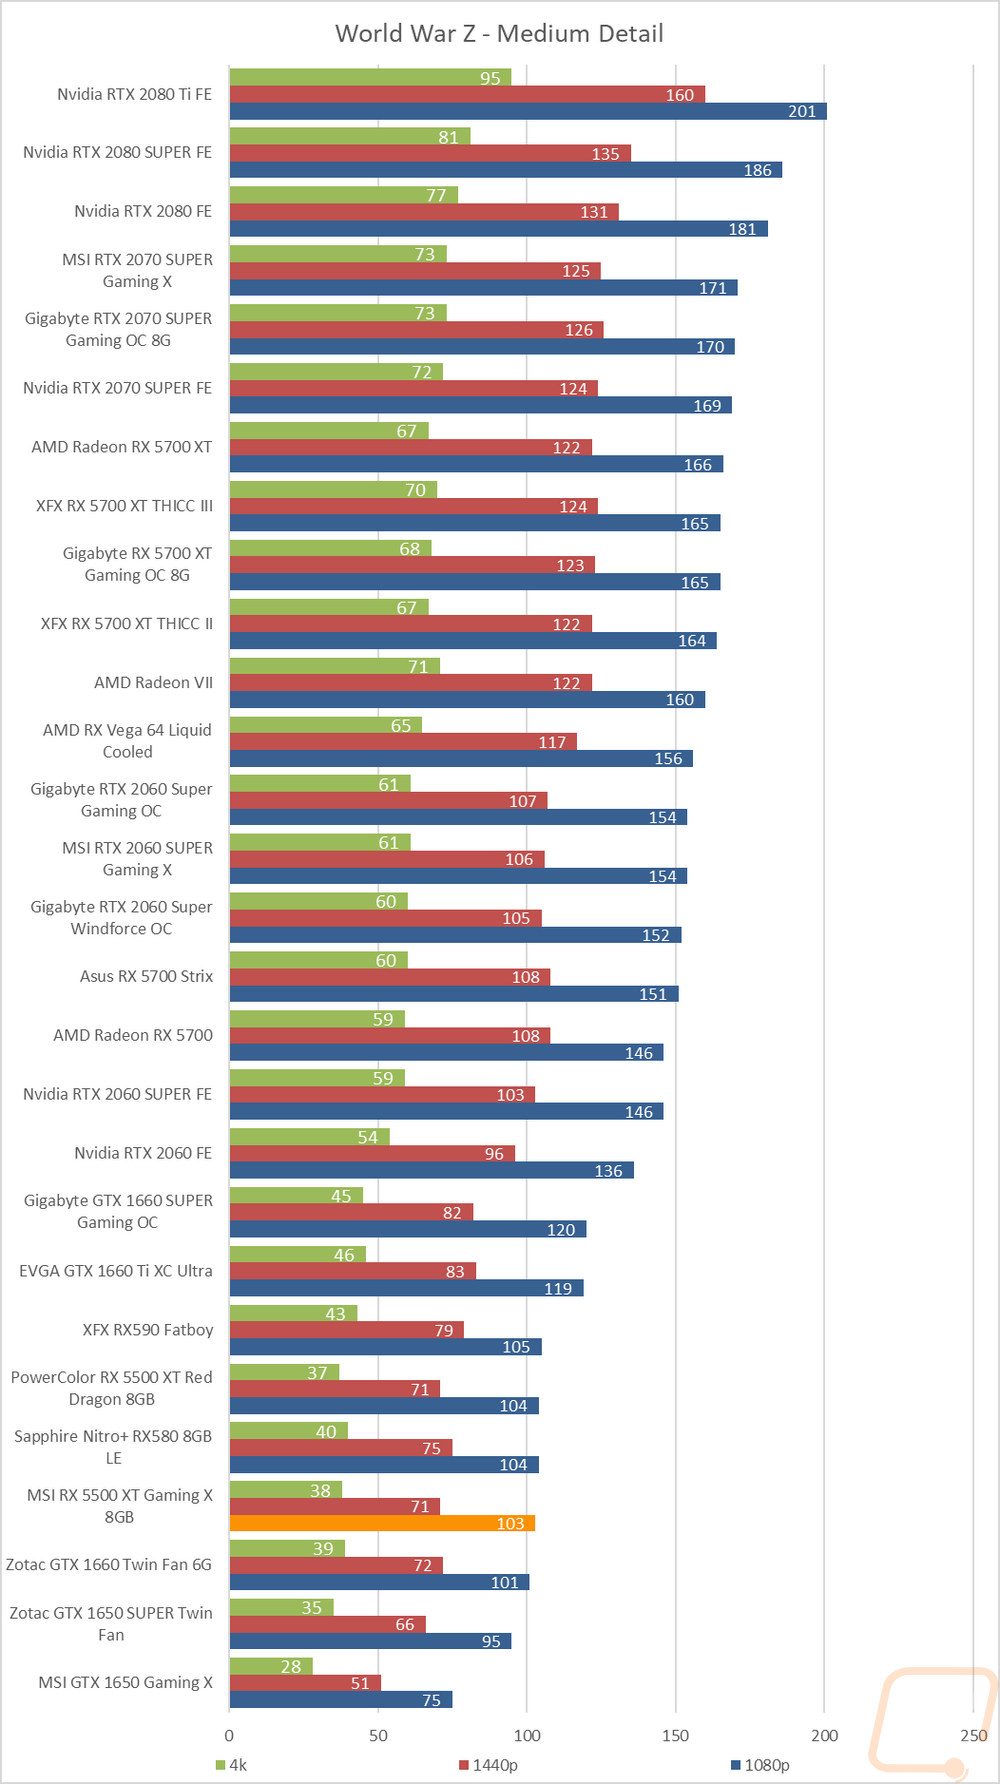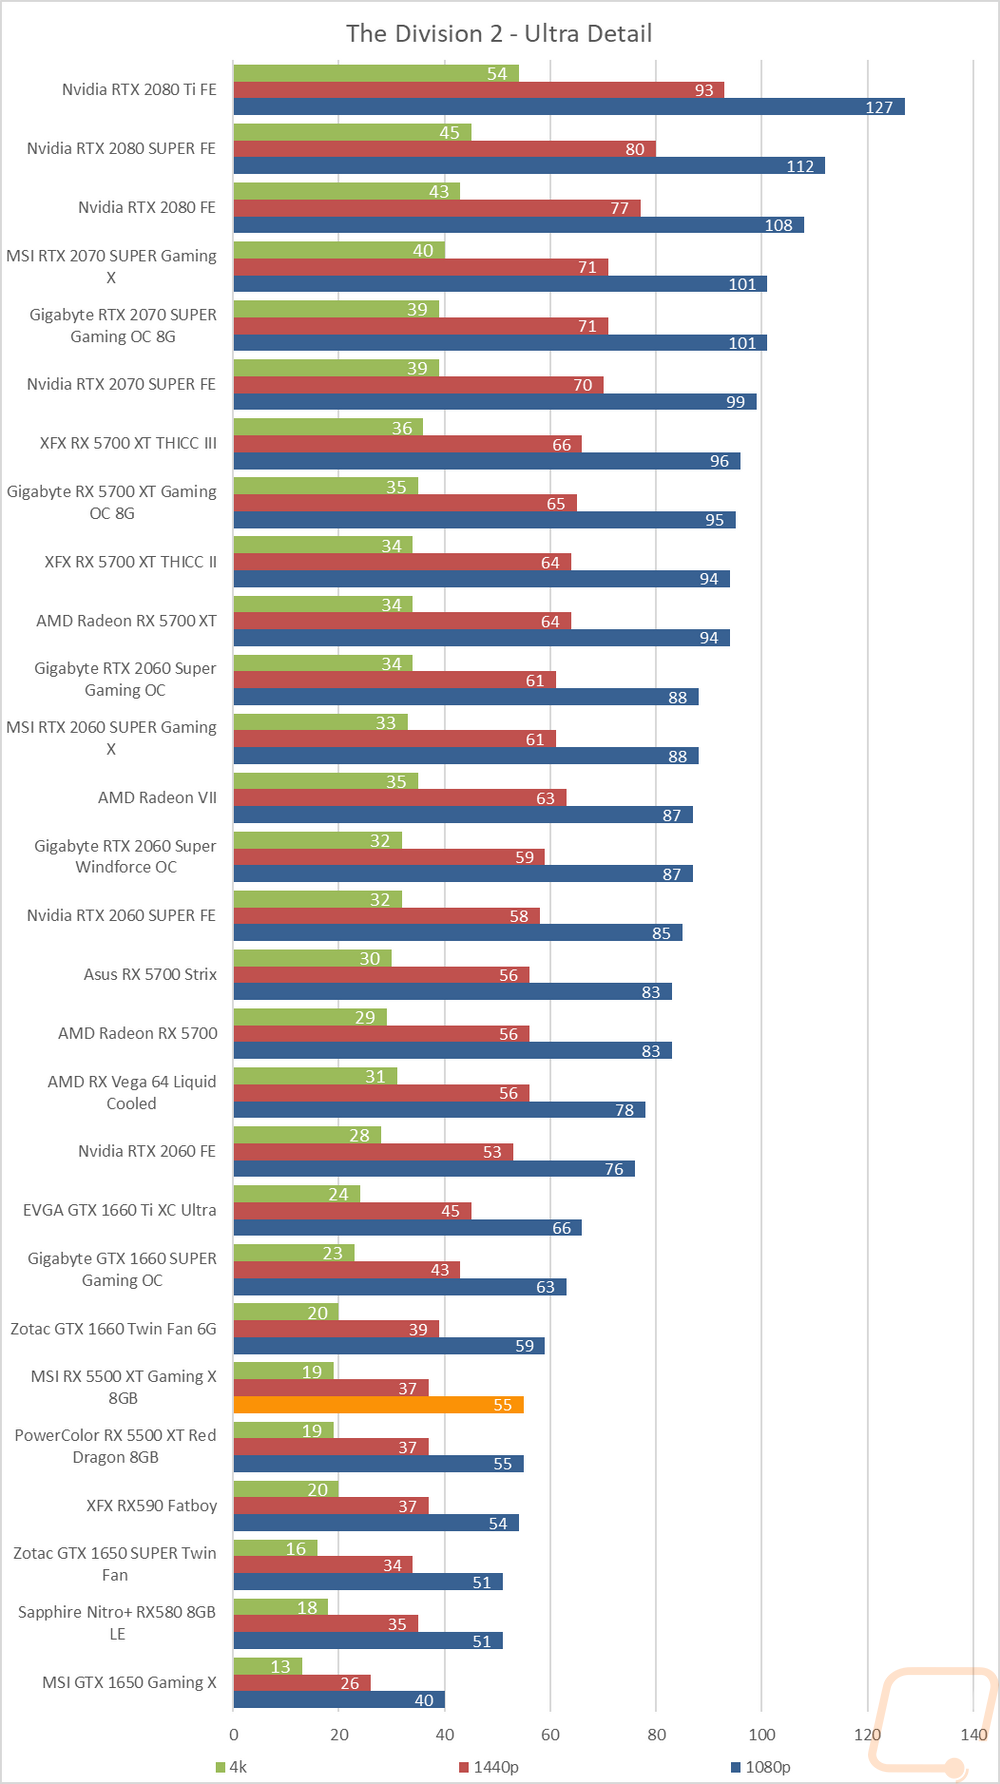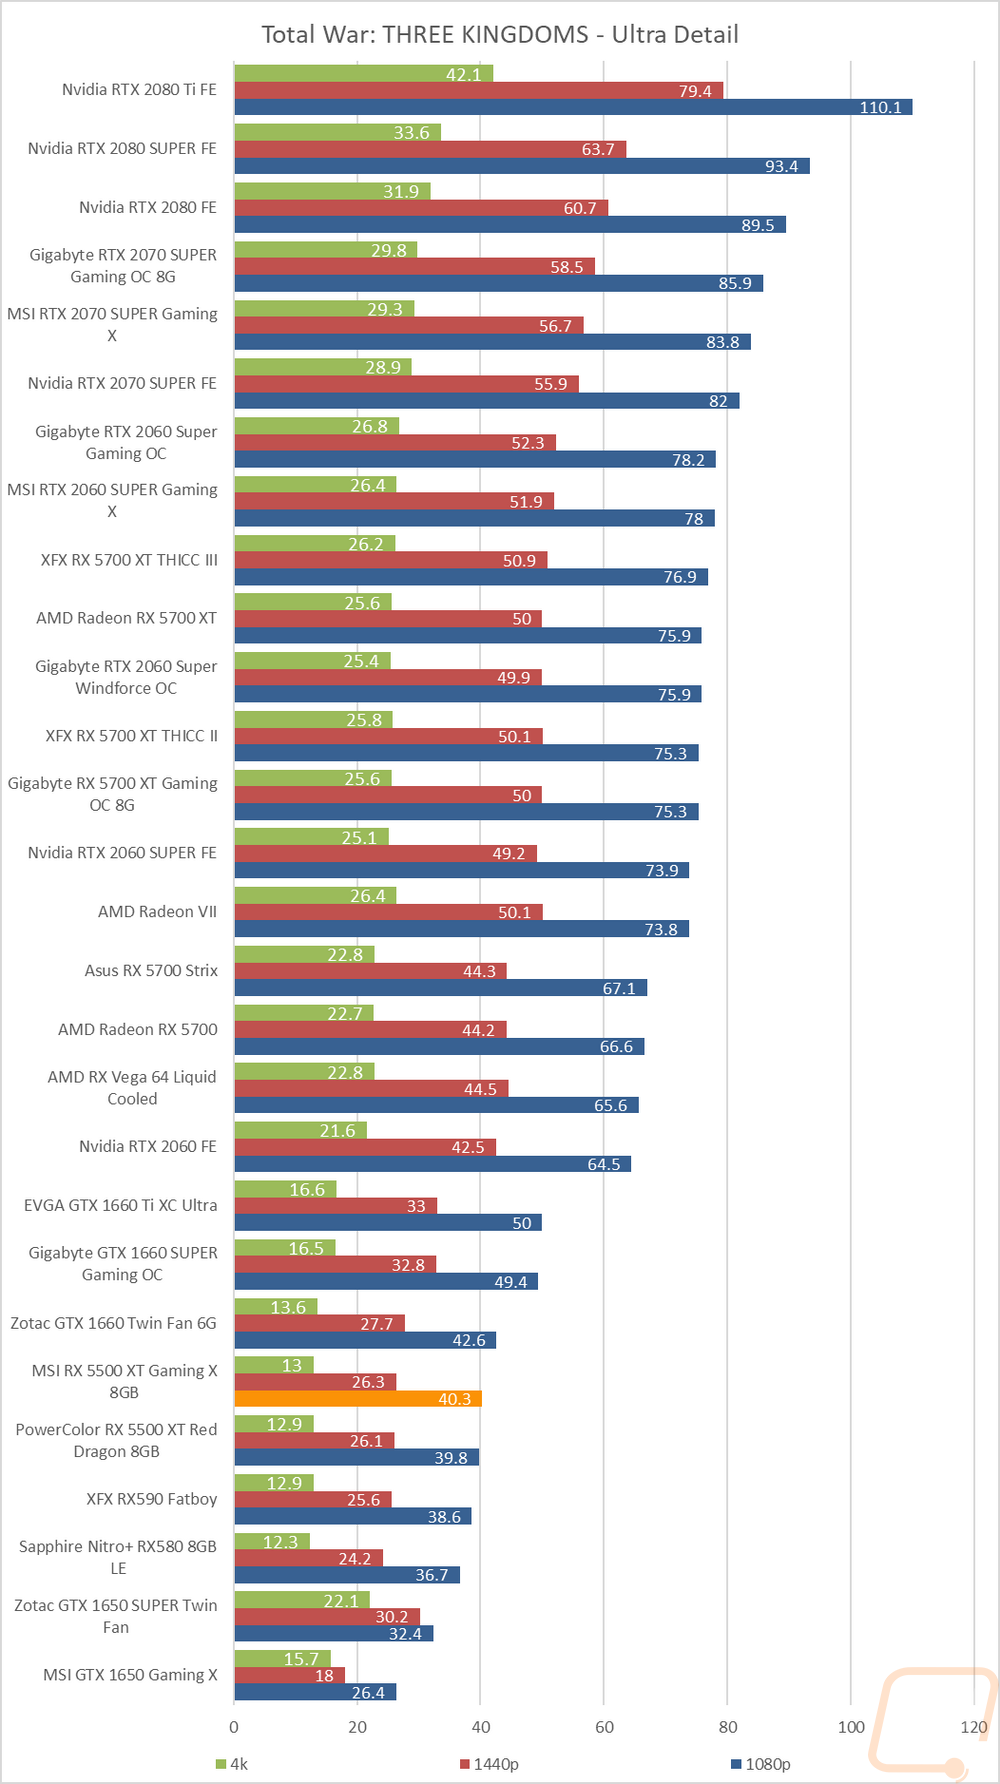
In-Game Benchmarks
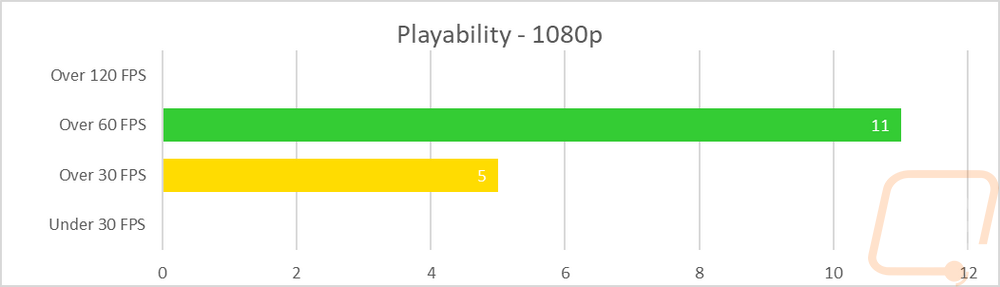
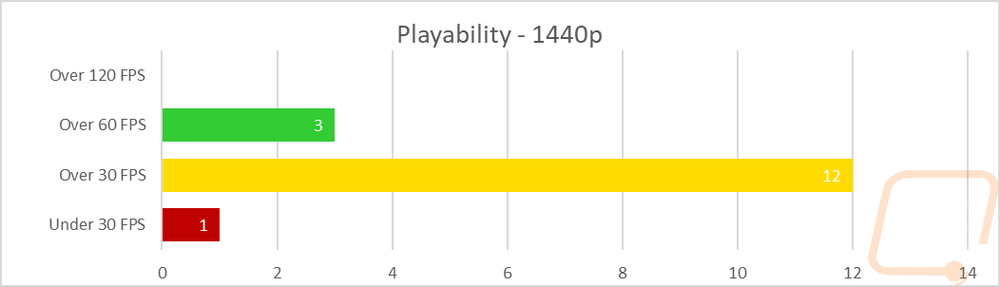
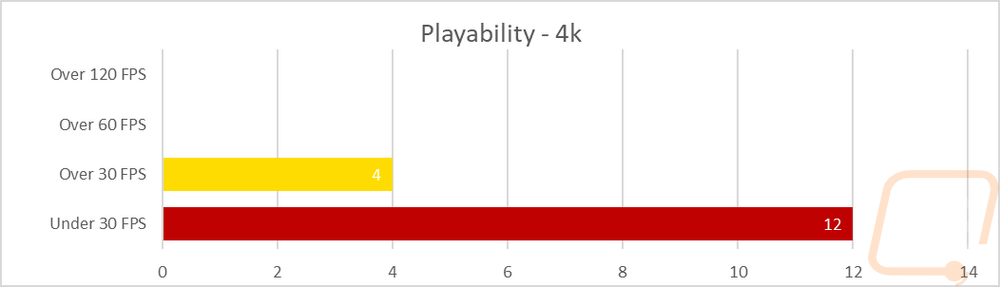
Now we finally get into the in game performance and that is the main reason people pick up a new video card. To test things out I ran through our new benchmark suite that tests 9 games at three different resolutions (1080p, 1440p, and 4k). Most of the games tested have been run at the highest detail setting and a mid-range detail setting to get a look at how turning things up hurts performance and to give an idea of if turning detail down from max will be beneficial for frame rates. In total, each video card is tested 48 times and that makes for a huge mess of results when you put them all together. To help with that I like to start off with these overall playability graphs that take all of the results and give an easier to read the result. I have one for each of the three resolutions and each is broken up into four FPS ranges. Under 30 FPS is considered unplayable, over 30 is playable but not ideal, over 60 is the sweet spot, and then over 120 FPS is for high refresh rate monitors.
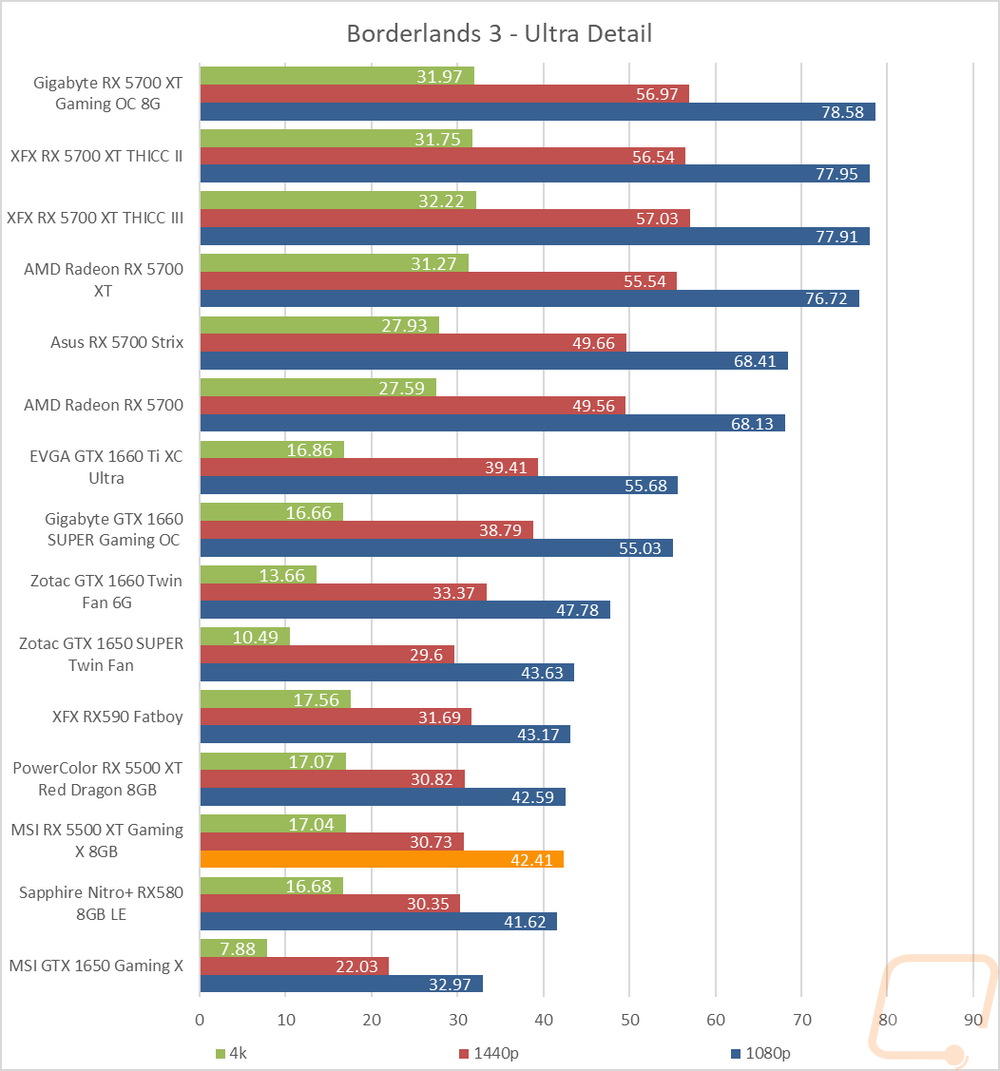
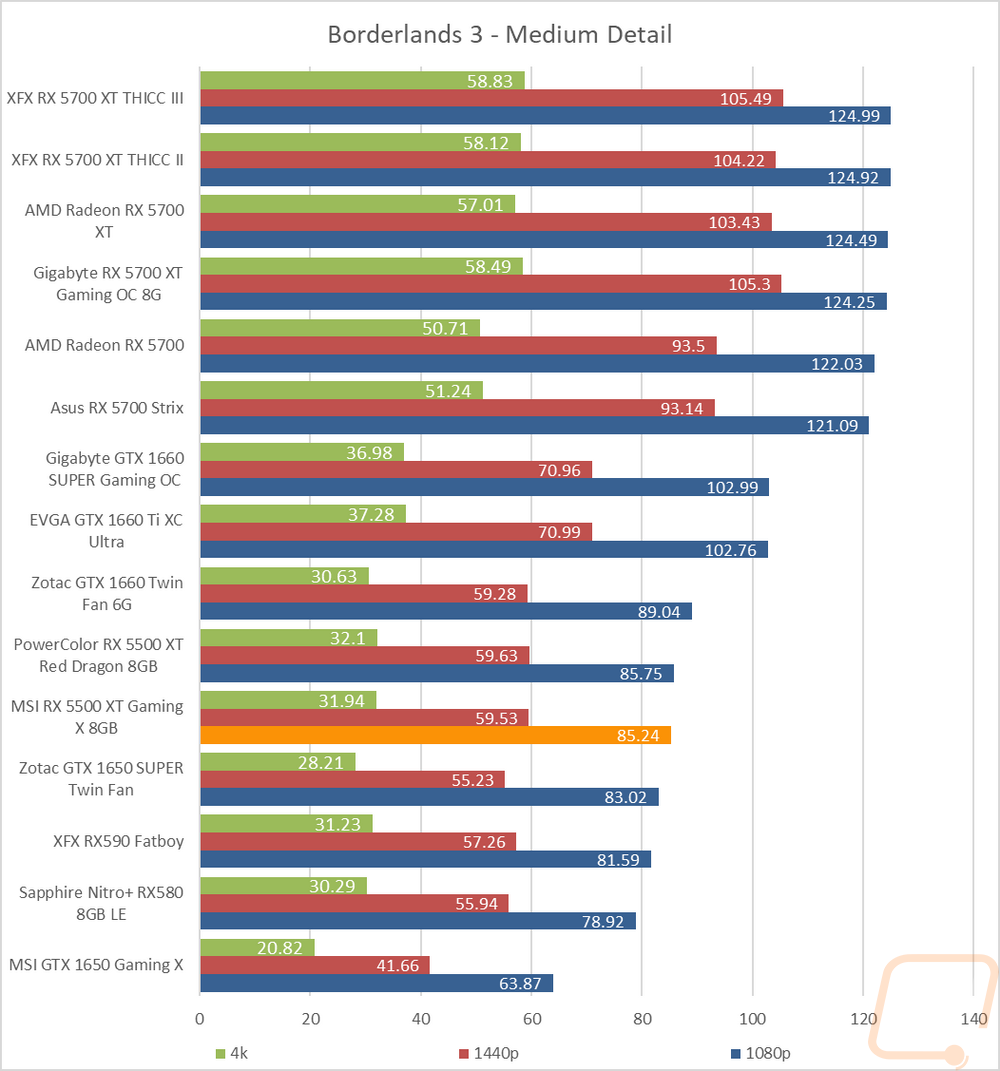
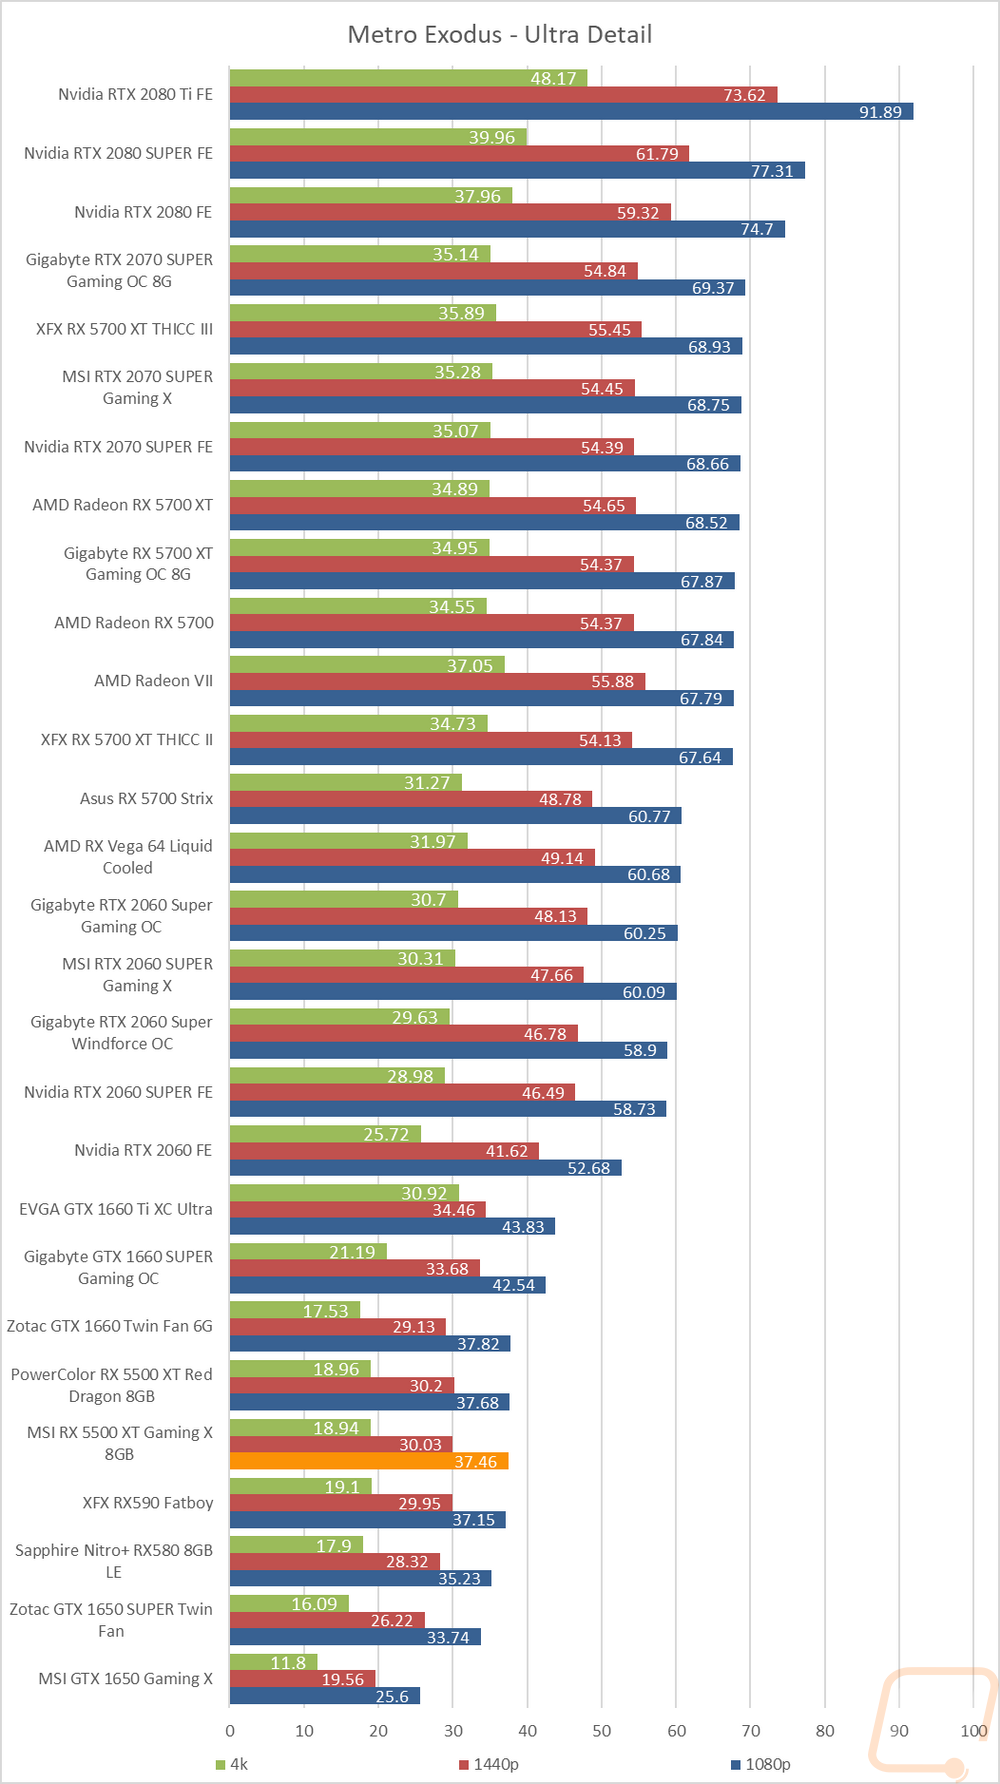
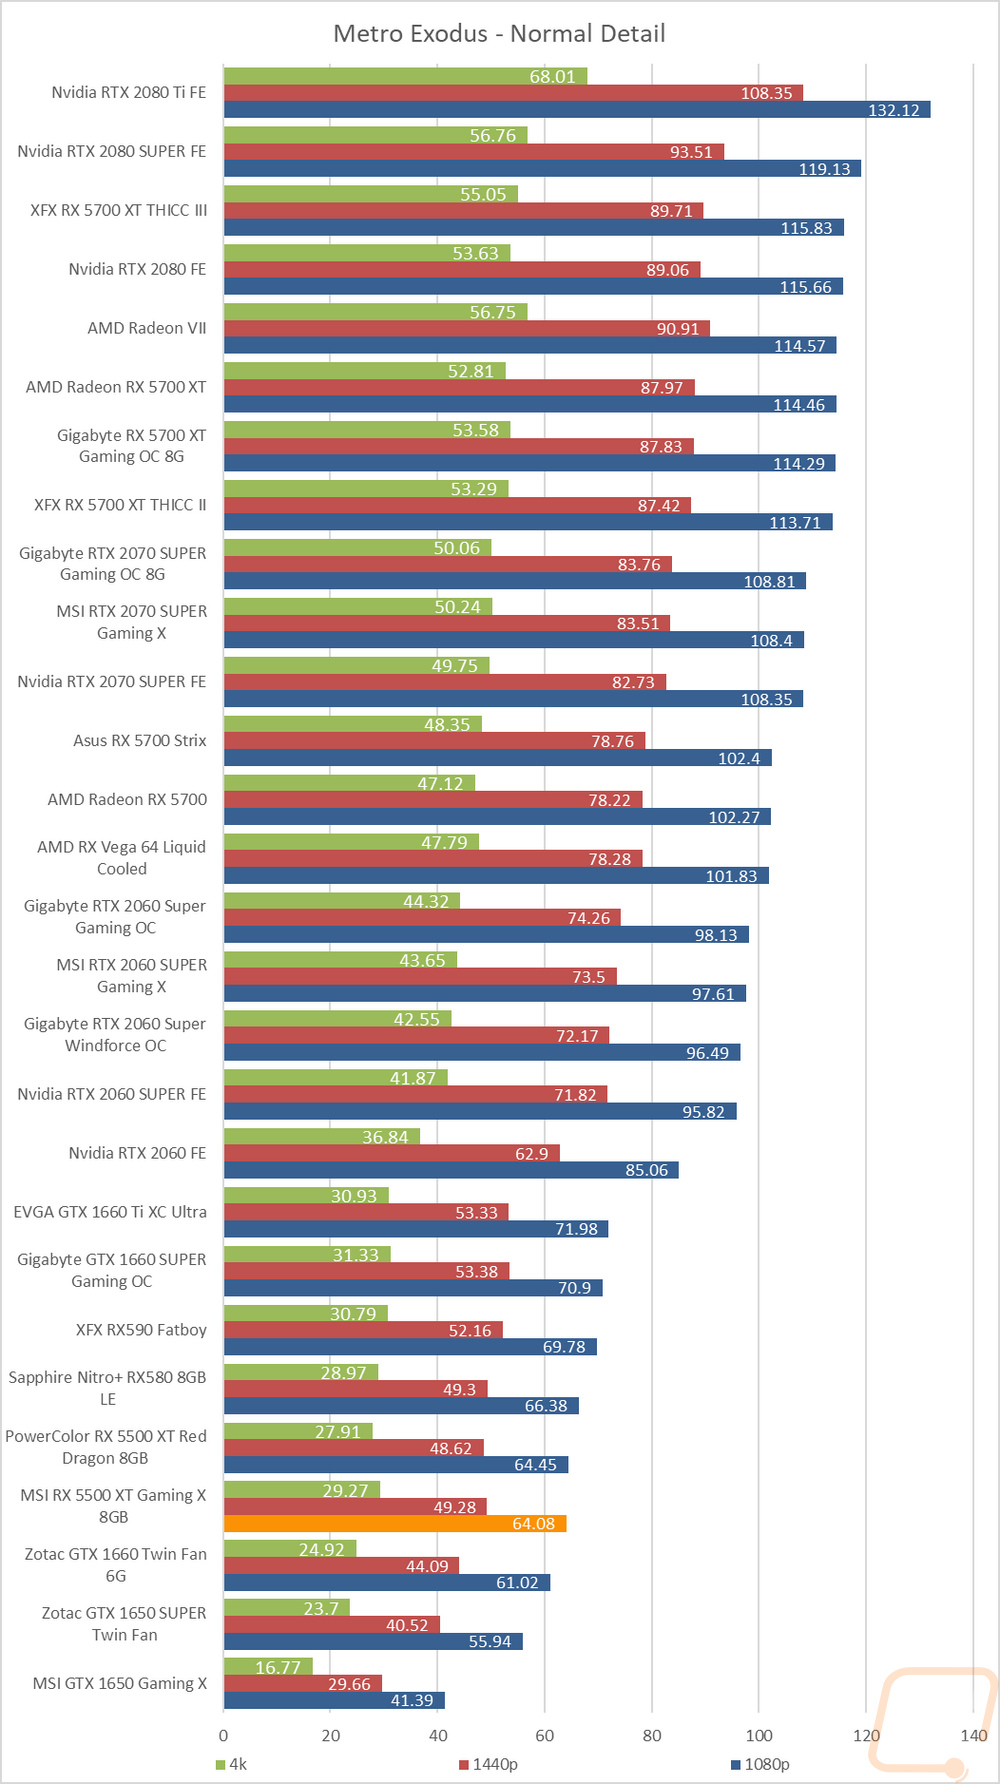
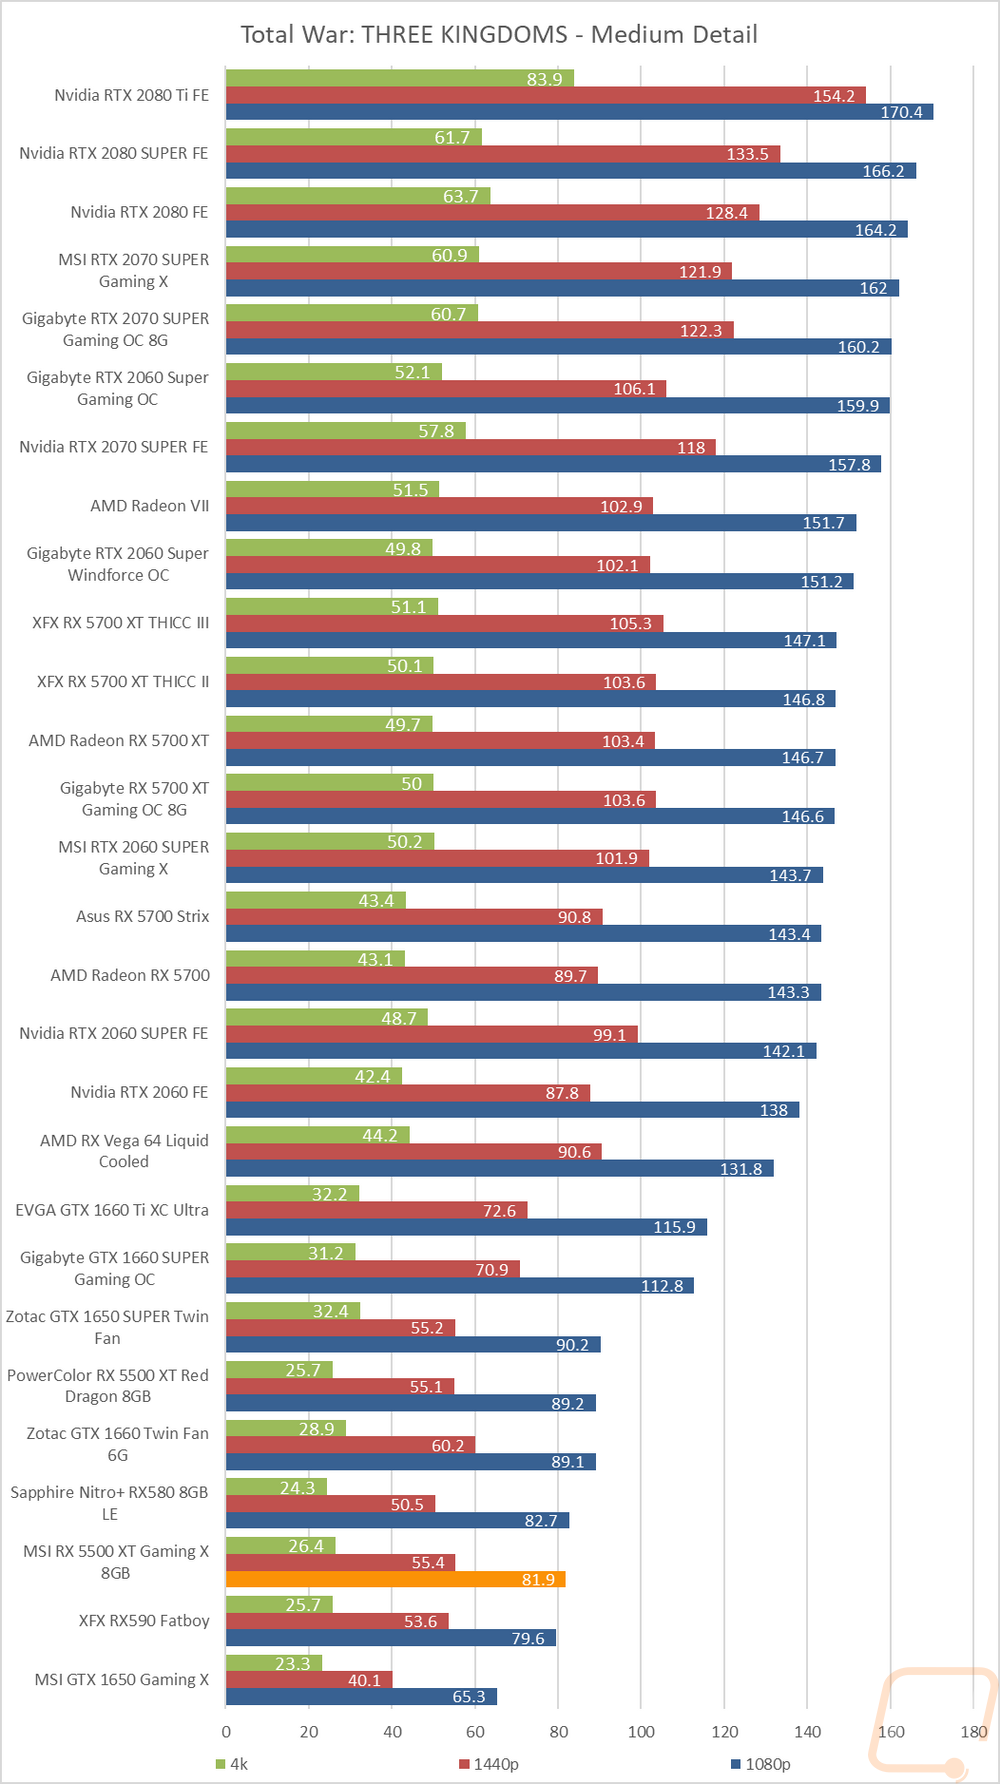
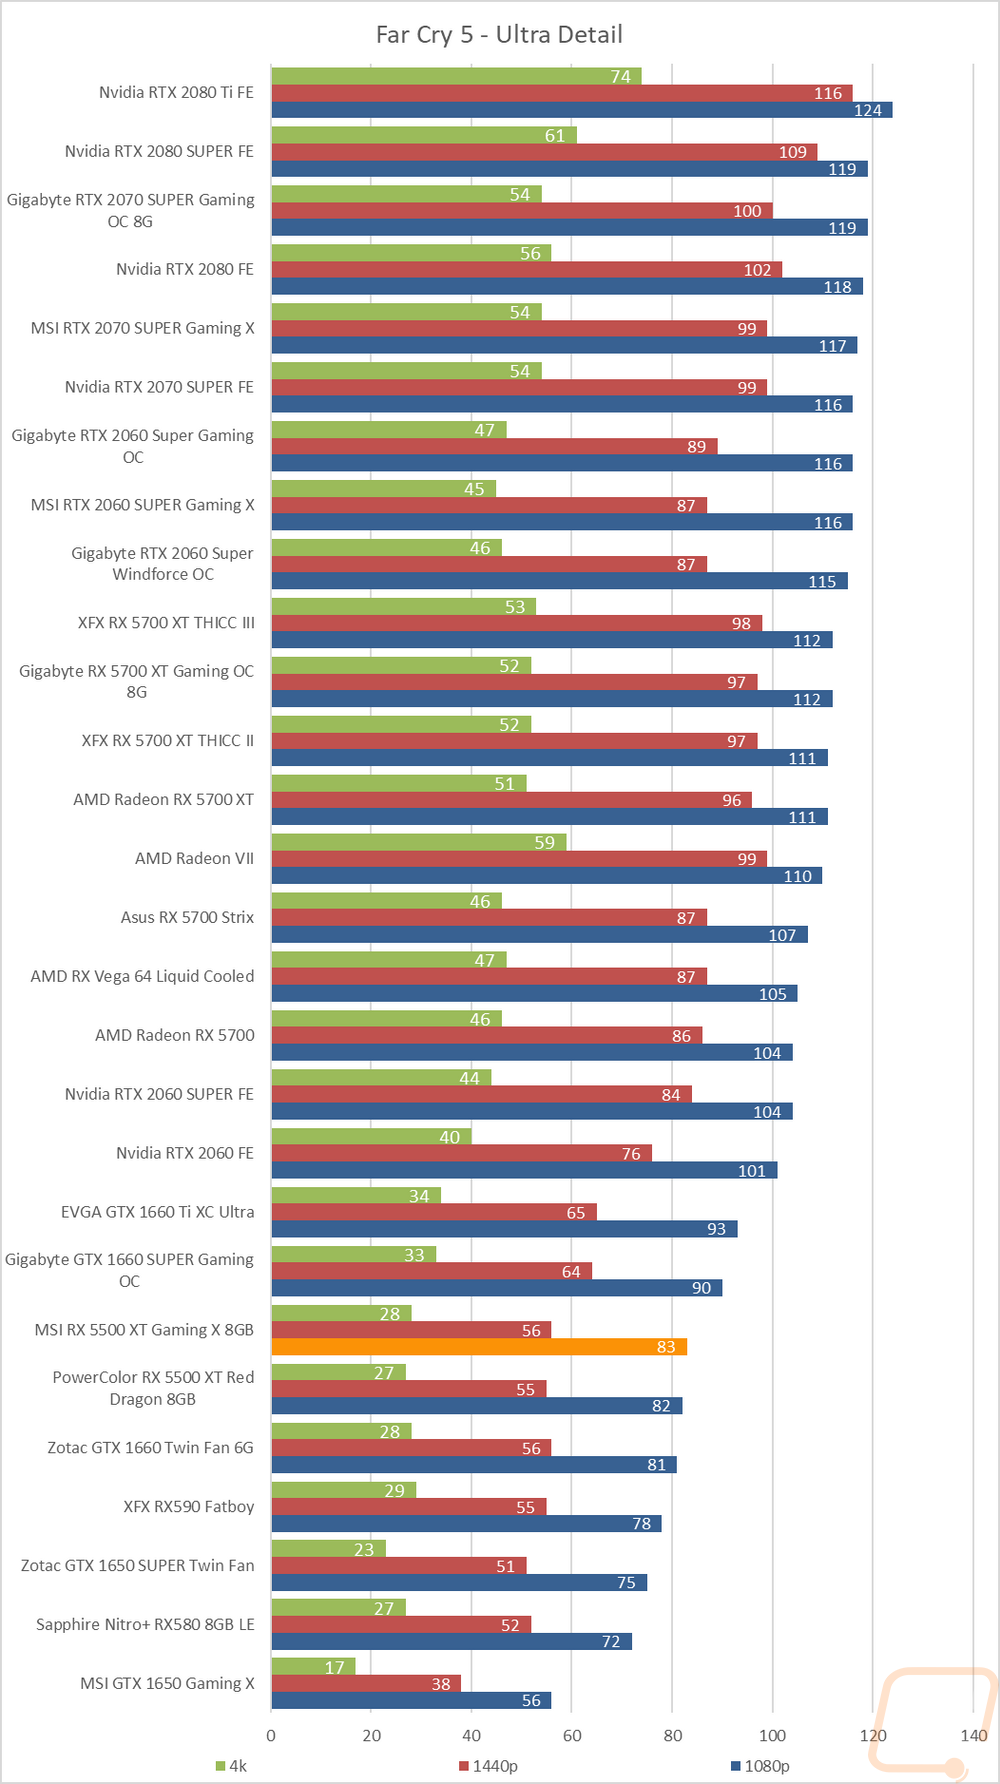
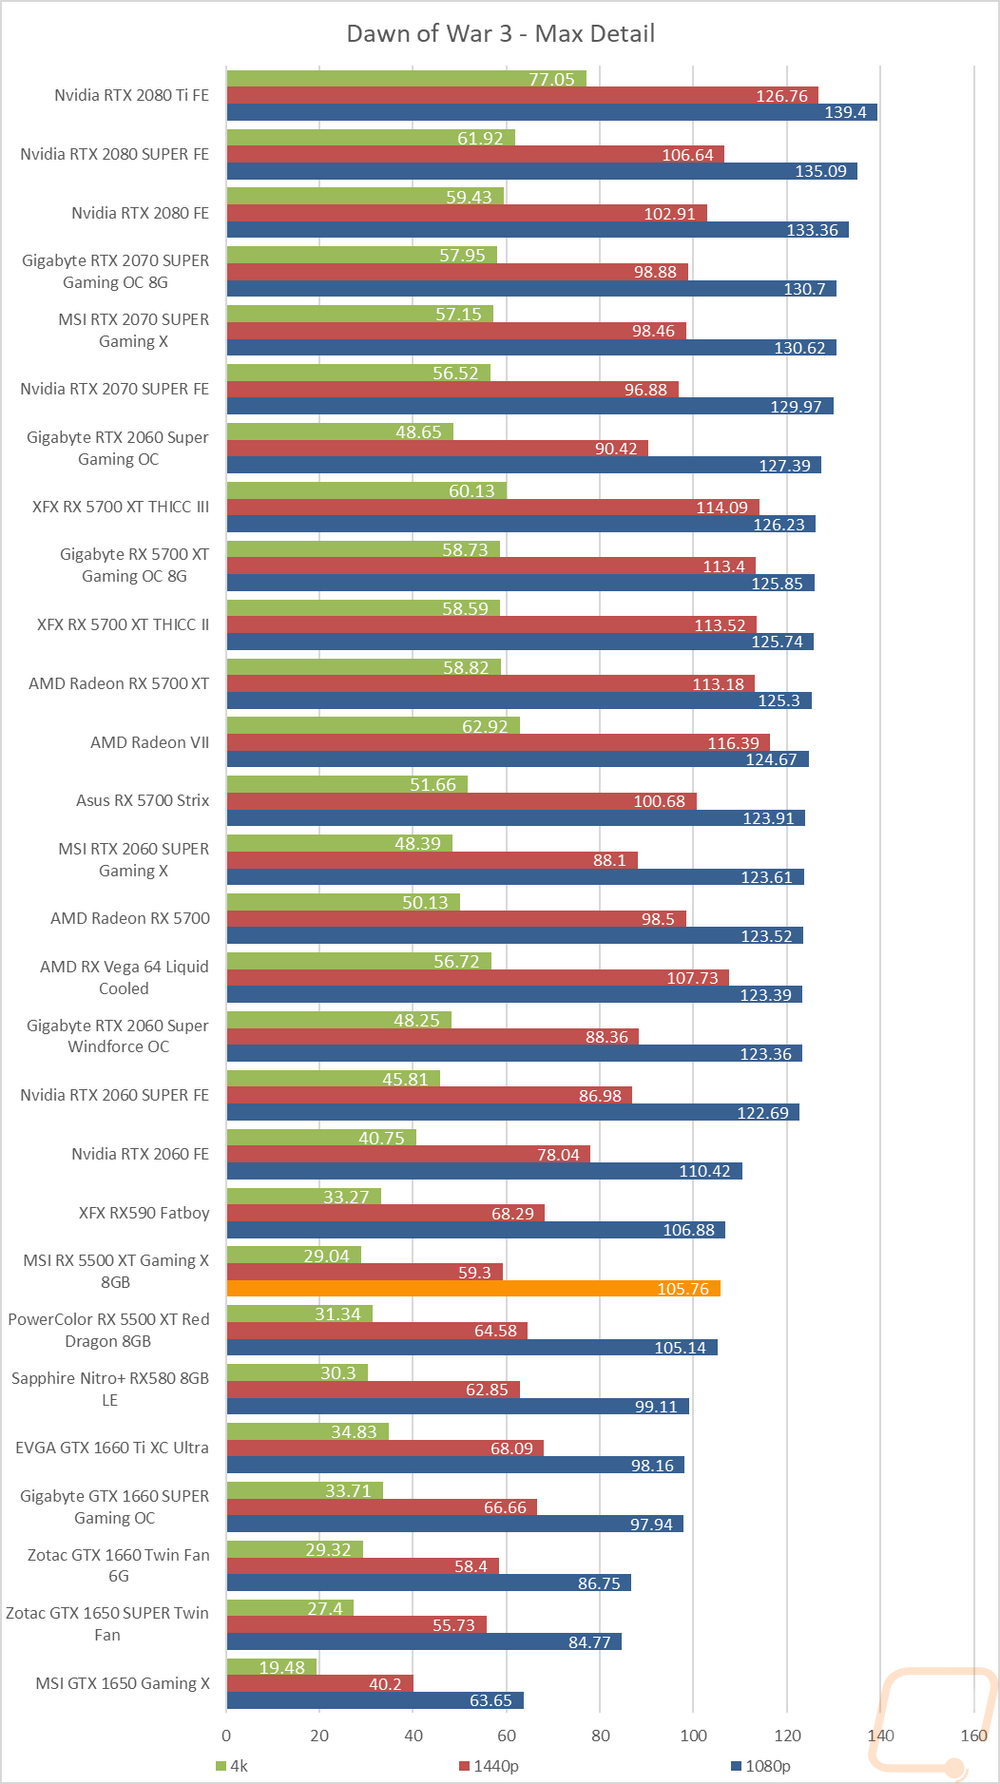
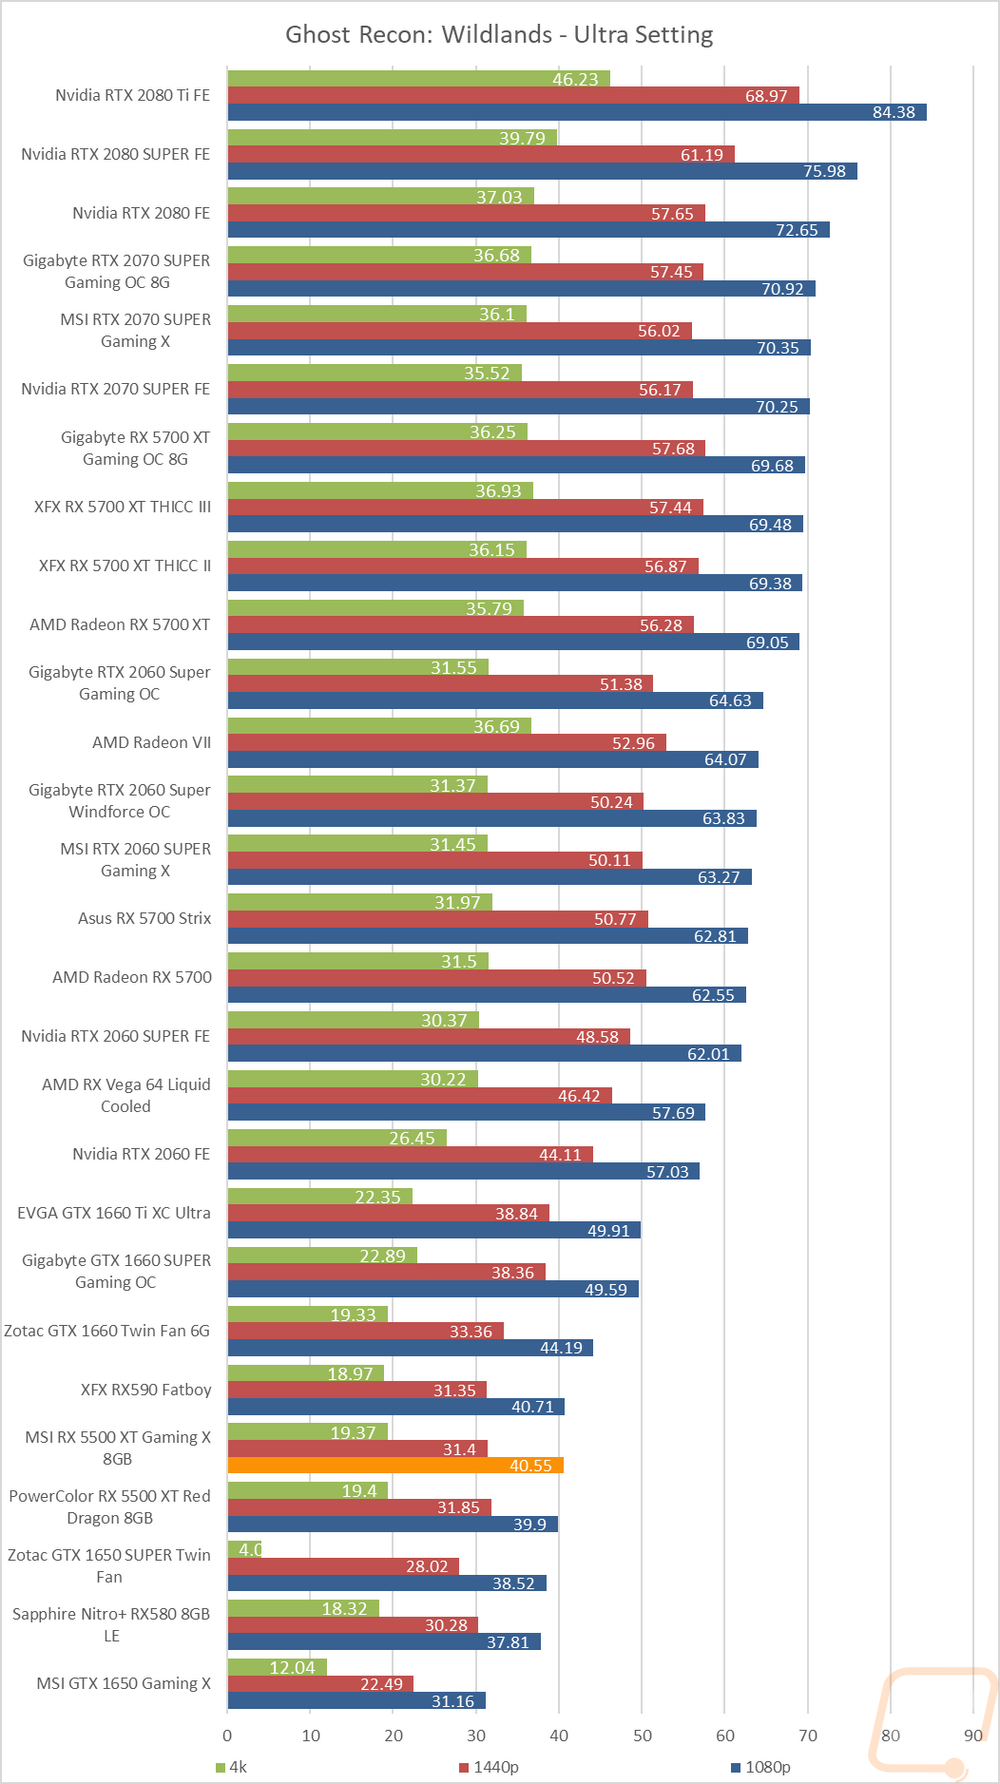
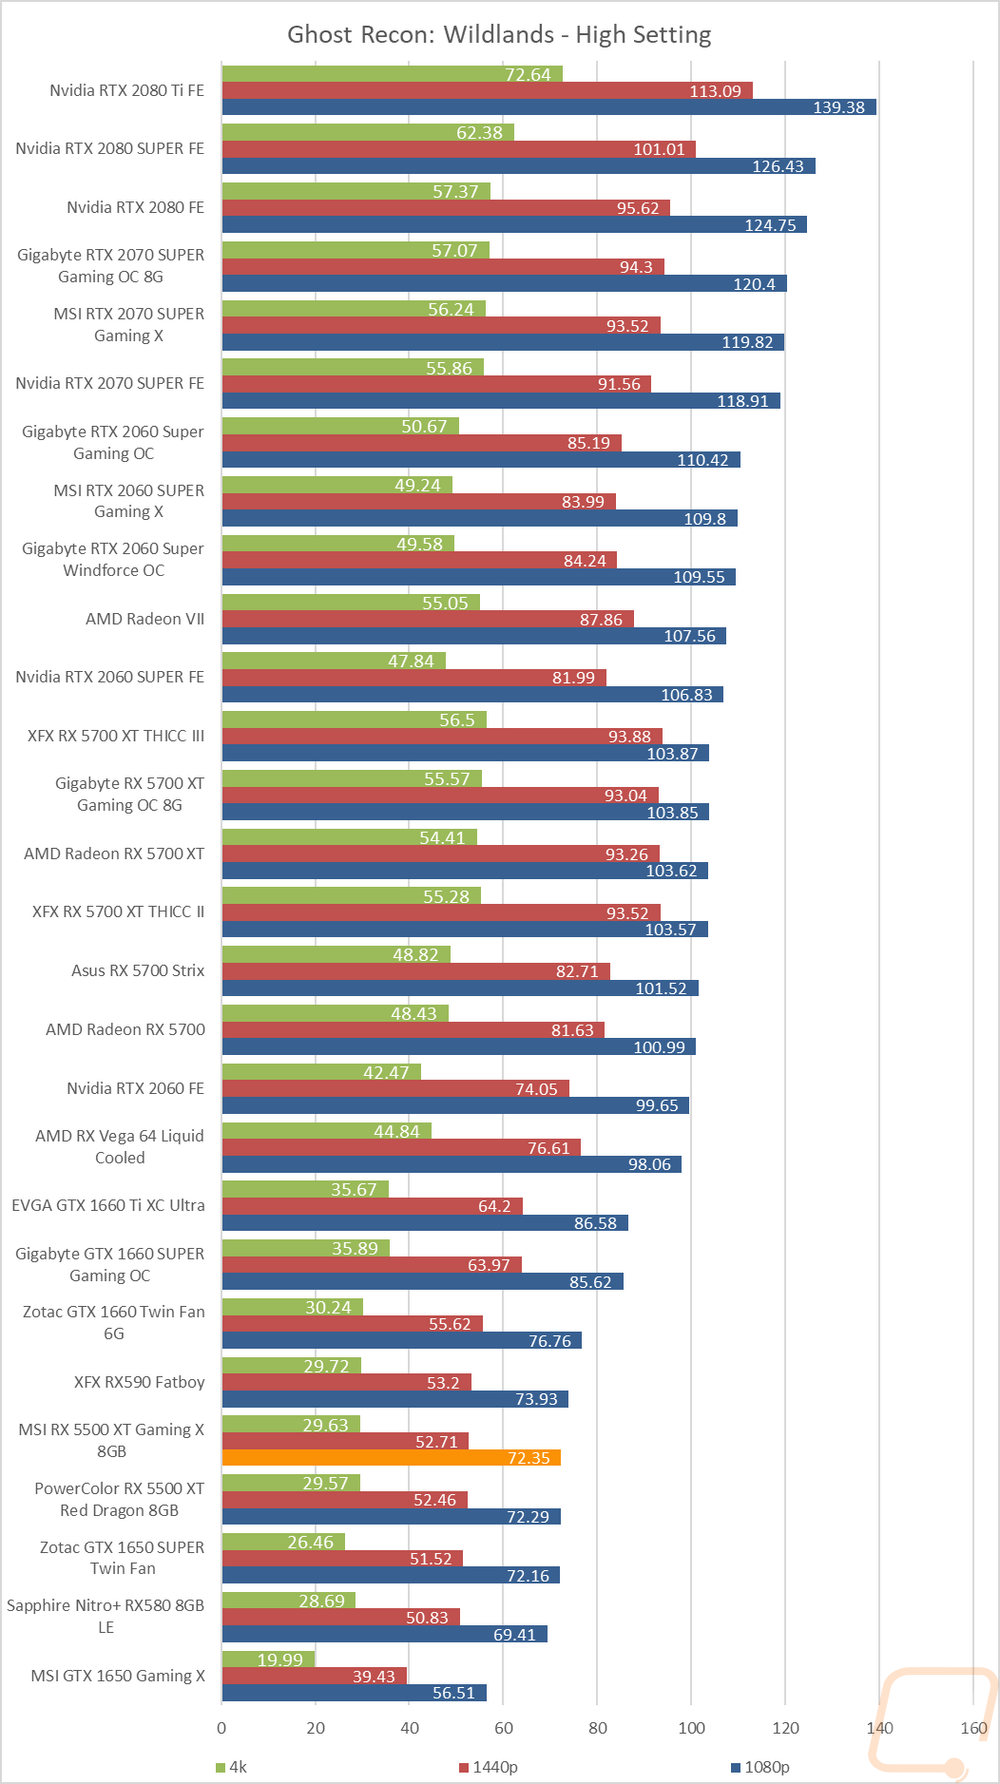
So how did the PowerColor RX 5500 XT Red Dragon perform? Well going into this, having already tested one RX 5500 XT I knew about what to expect in the overall numbers and I didn’t see any big surprises here. The RX 5500 XT is solidly planted as a mid-range 1080p card. This is obvious once you look at the performance at 4k and 1440p. At 4k only 4 of the tests were playable at over 30 FPS, the other 12 results were under 30 FPS and not what I would really consider playable. 1440p is better with 3 results even being in the 60+ FPS range and only one is completely unplayable. But with everything falling between 30 and 59 FPS it isn’t ideal. But it is good to know that if in the future you upgrade to a 1440p monitor you will at least be able to get by. Then at 1080p things improve significantly with 11 out of the 16 results being over 60 FPS leaving 5 in the 30 – 59 FPS range. Most of those are on the edge, close to 60 but we have to draw a line somewhere. This is why I would consider it a mid-range 1080p card as well, there are other options that will start to get some results up over 120 FPS and wouldn’t have as many under 60.
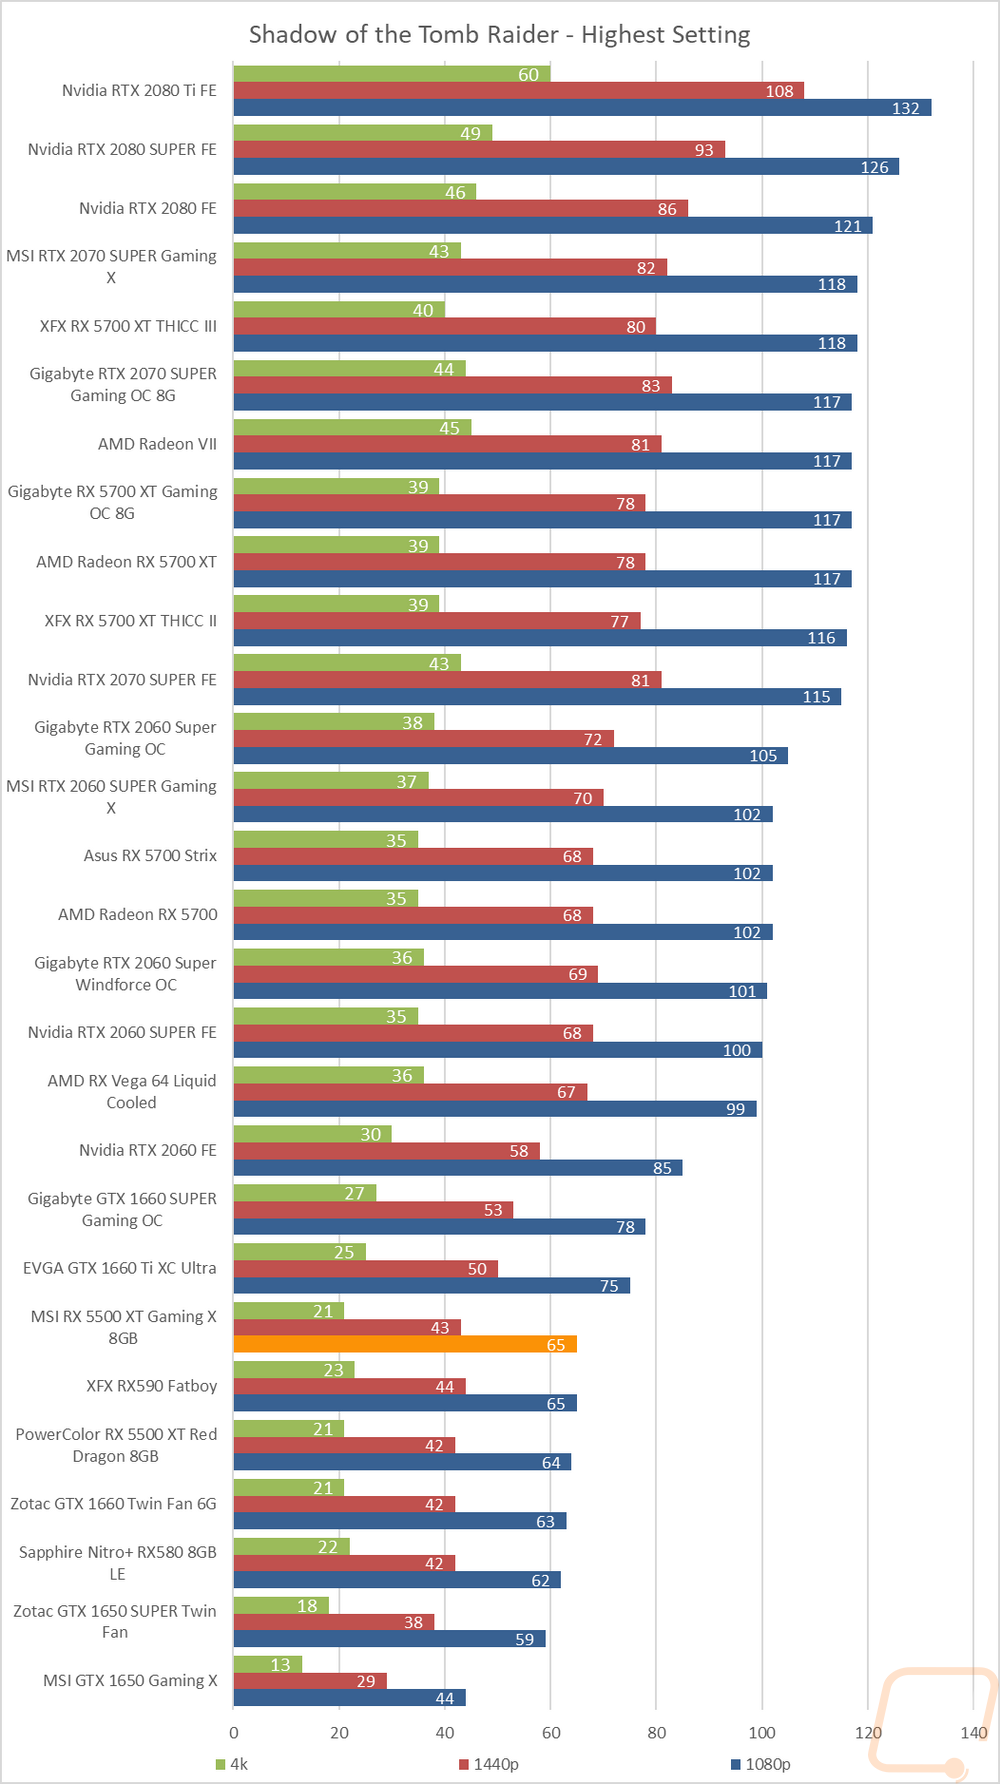
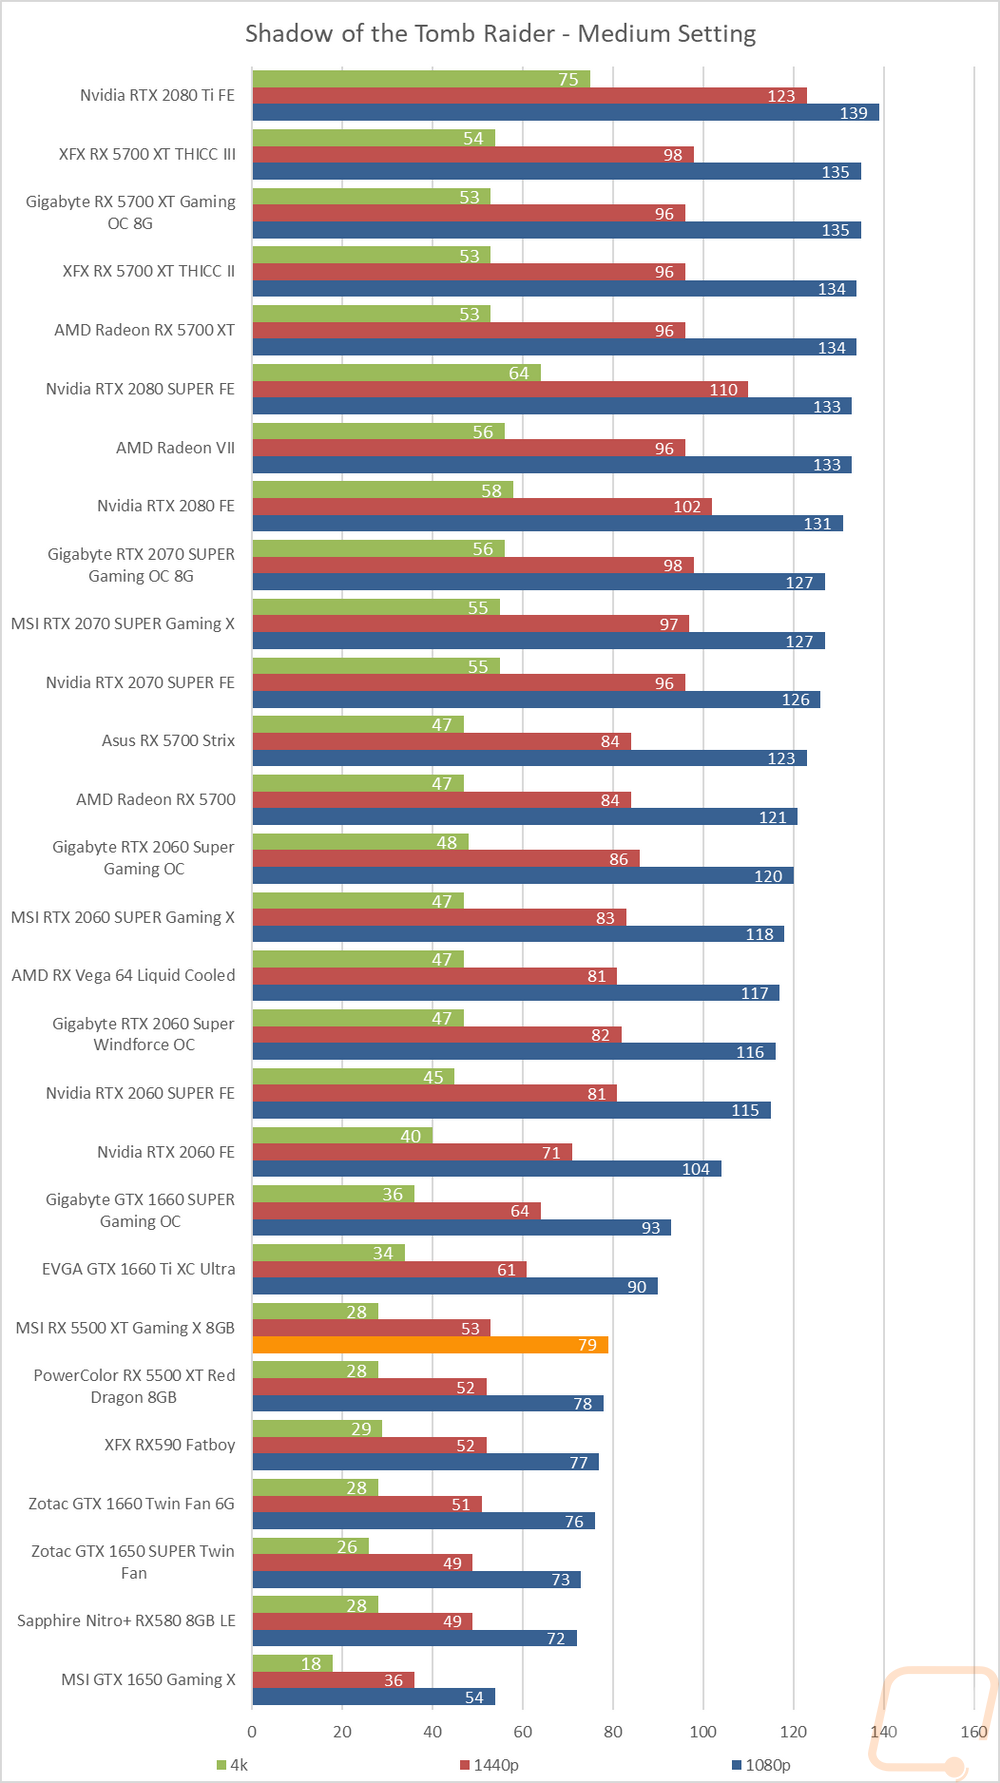
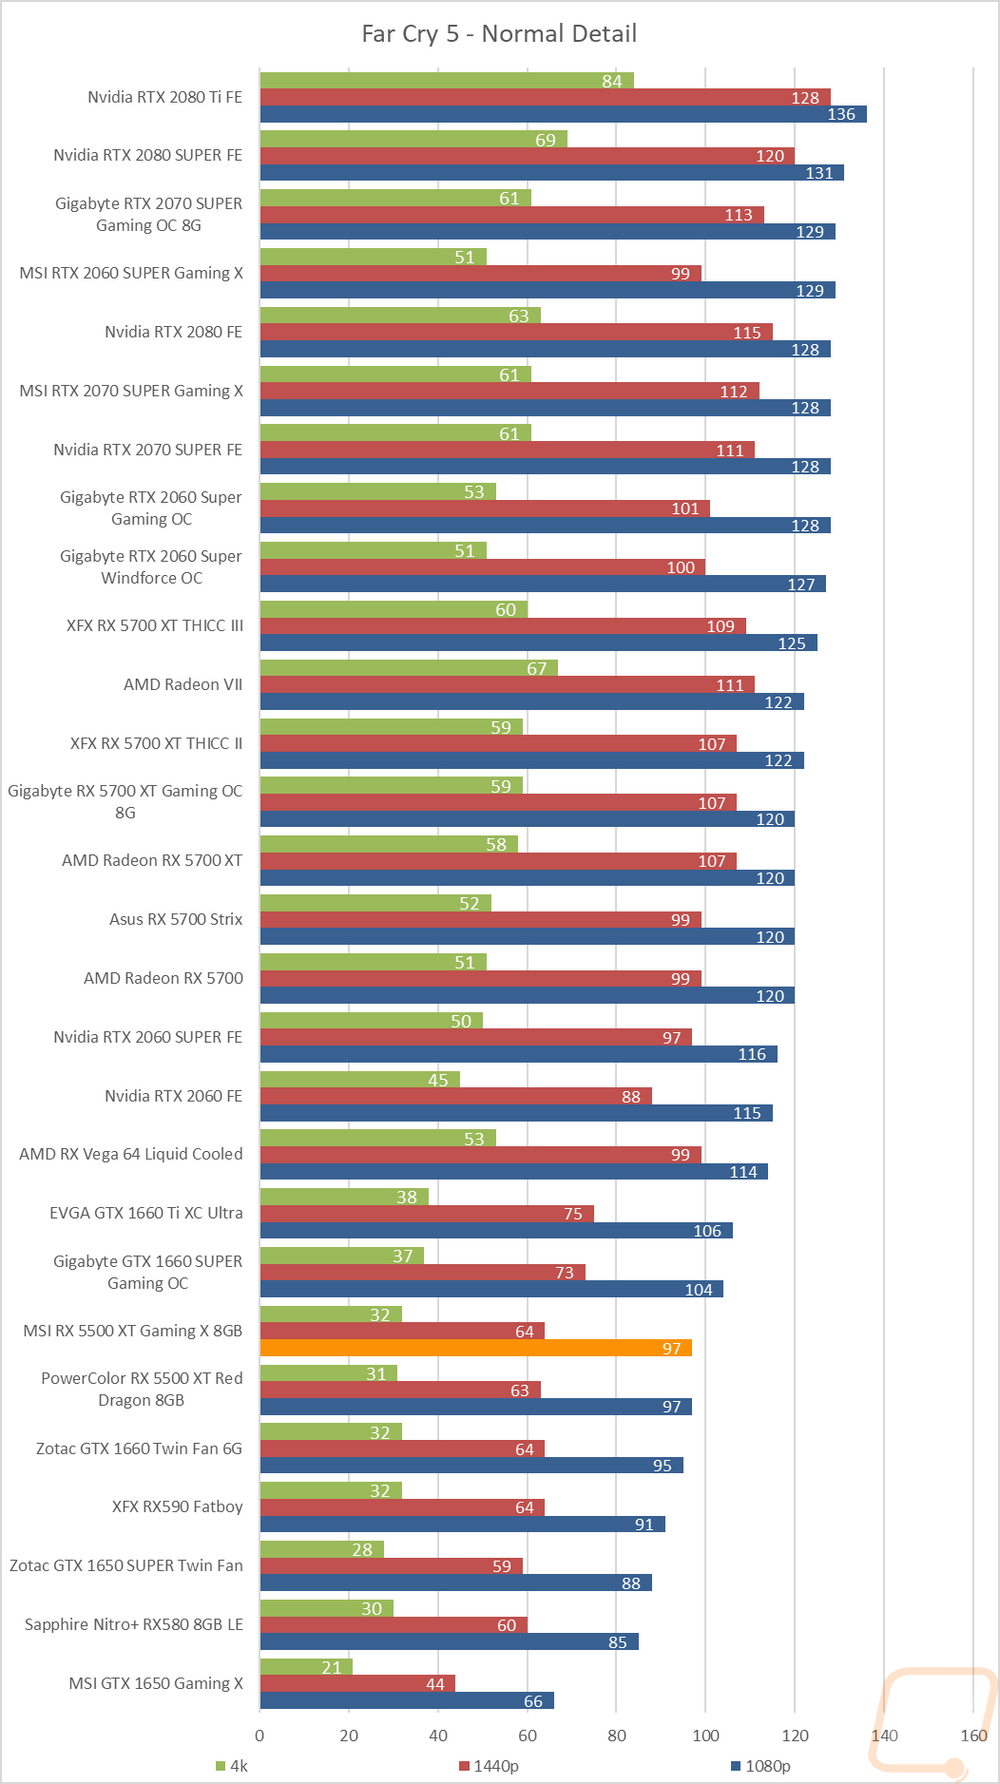
As always I don’t just include our compilation results and leave it at that. I do have each of the full graphs with results across 28 different cards. I just leave them down here because for some people it is just too much information. So for comparisons between the Gaming X and the Red Dragon, in almost every test they really ran right together within fractions of an FPS. There were a few weird results like Total War where the Red Dragon came out ahead a lot more than it should but overall the Gaming X is ahead of the Red Dragon in more of the results. I should also point out that I did retest both cards with the same driver, retesting those oddities multiple times as well. They were consistent but confusing. With them being so close together its not a surprise that they trade blows with the GTX 1660, with the Gaming X ahead of the GTX 1660 in exactly half of the test results.