In-Game Benchmarks
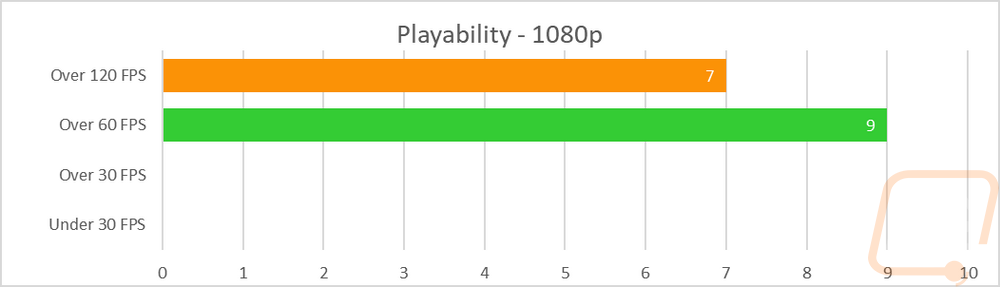
Now we finally get into the in game performance and that is the main reason people pick up a new video card. To test things out I ran through our new benchmark suite that tests 9 games at three different resolutions (1080p, 1440p, and 4k). Most of the games tested have been run at the highest detail setting and a mid-range detail setting to get a look at how turning things up hurts performance and to give an idea of if turning detail down from max will be beneficial for frame rates. In total, each video card is tested 48 times and that makes for a huge mess of results when you put them all together. To help with that I like to start off with these overall playability graphs that take all of the results and give an easier to read the result. I have one for each of the three resolutions and each is broken up into four FPS ranges. Under 30 FPS is considered unplayable, over 30 is playable but not ideal, over 60 is the sweet spot, and then over 120 FPS is for high refresh rate monitors.
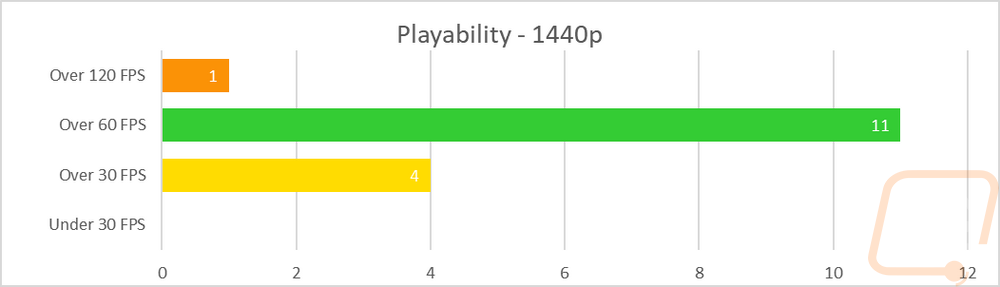
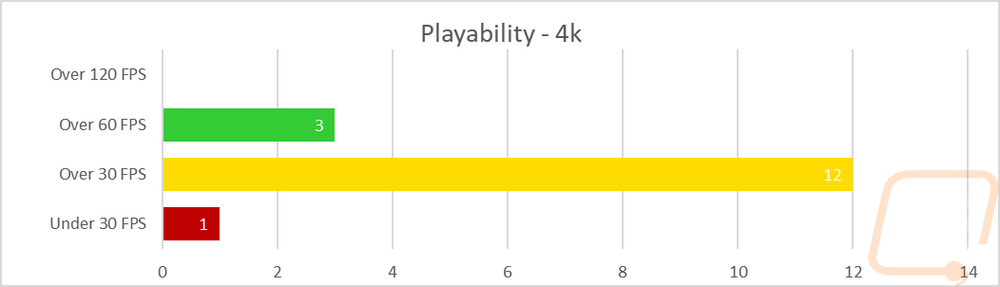
So how did the XFX RX 5700 XT Thicc III Ultra perform? Well like all of the other RX 5700 XT’s it dominated at 1080p and performs well at 1440p. In fact, the Gaming OC and the Thicc III look exactly the same on these charts. Like with the Gaming OC, if you start looking at the detail numbers you will find a lot of the results are extremely close to bumping up to the next step. But even with the lines drawn this way 7 results over 120 FPS and the other 9 over 60 FPS is good at 1080p. That should be good for high refresh rate monitor gaming at all but the highest detail settings in the most demanding games. 1440p does have 4 results down below 60 FPS, most were around 55-59 FPS, but if you want smooth 60+ FPS gaming you might have to make a few adjustments. But a majority of the results were still over with 11 over 60 FPS and 1 over 120 FPS still. Were the Thicc III did excel was the 4k results. The Gigabyte Gaming OC went 1 60 FPS, 14 30 FPS, and 1 under 30 FPS and the Thicc III did 3/12/1. I still wouldn’t consider it a great 4k card, but the overclock was enough to bump a few results up into the green at least.
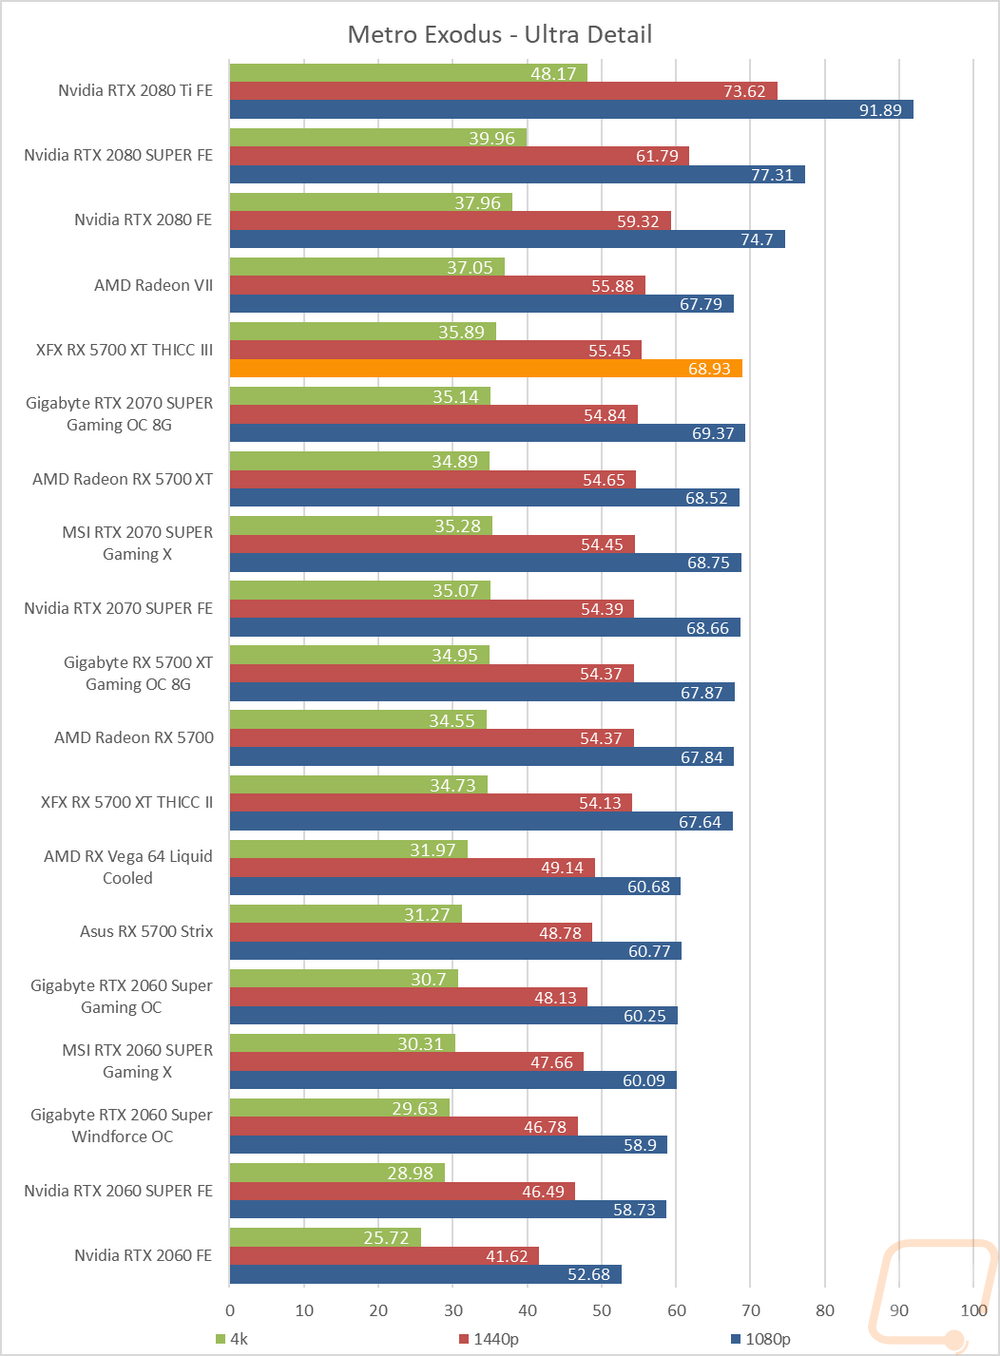
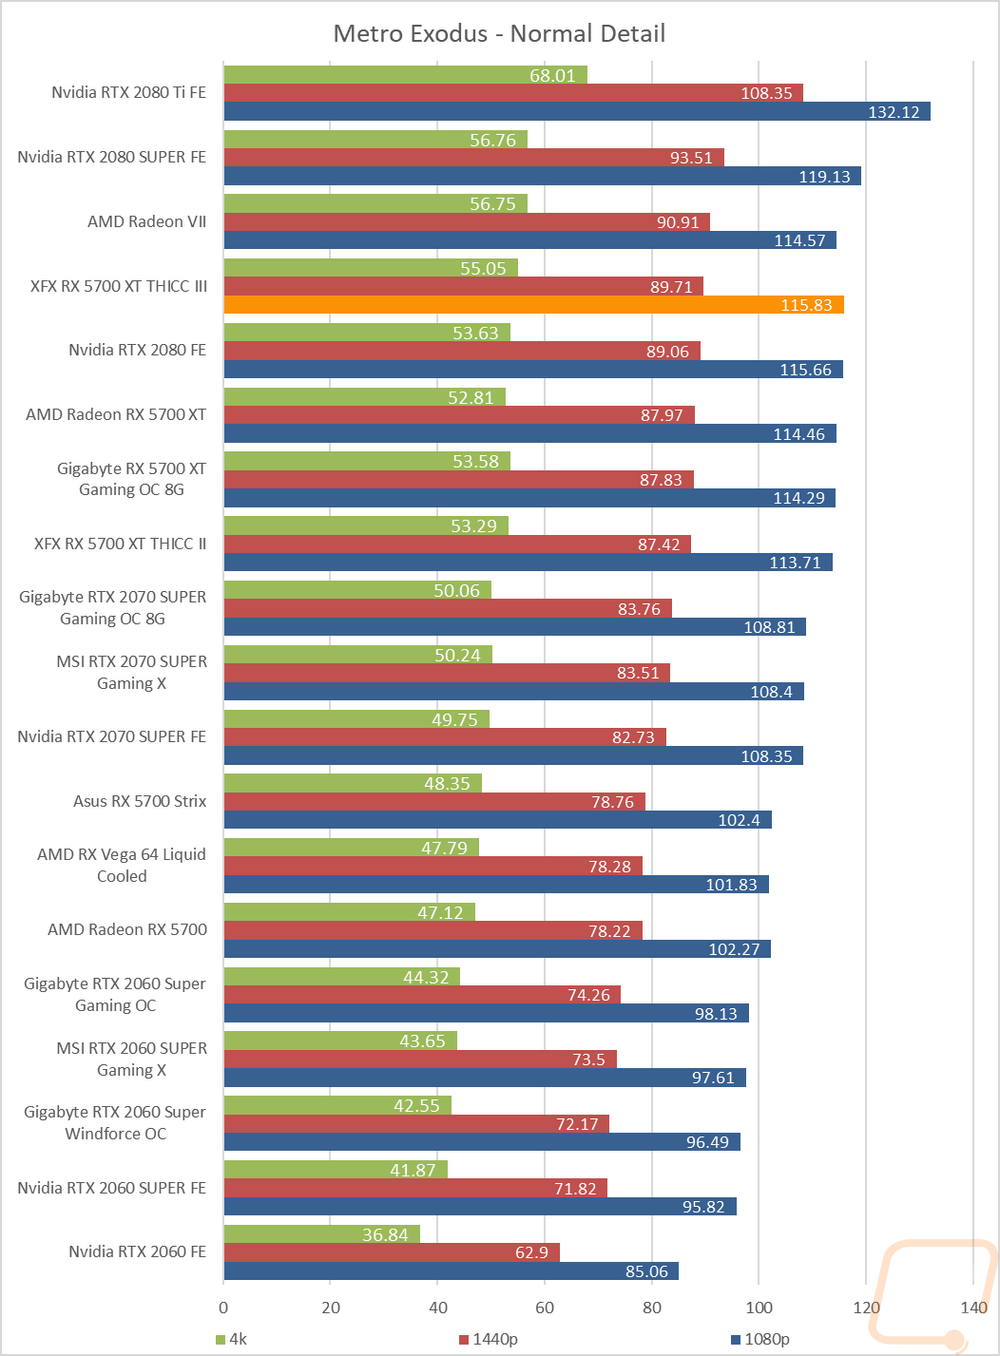
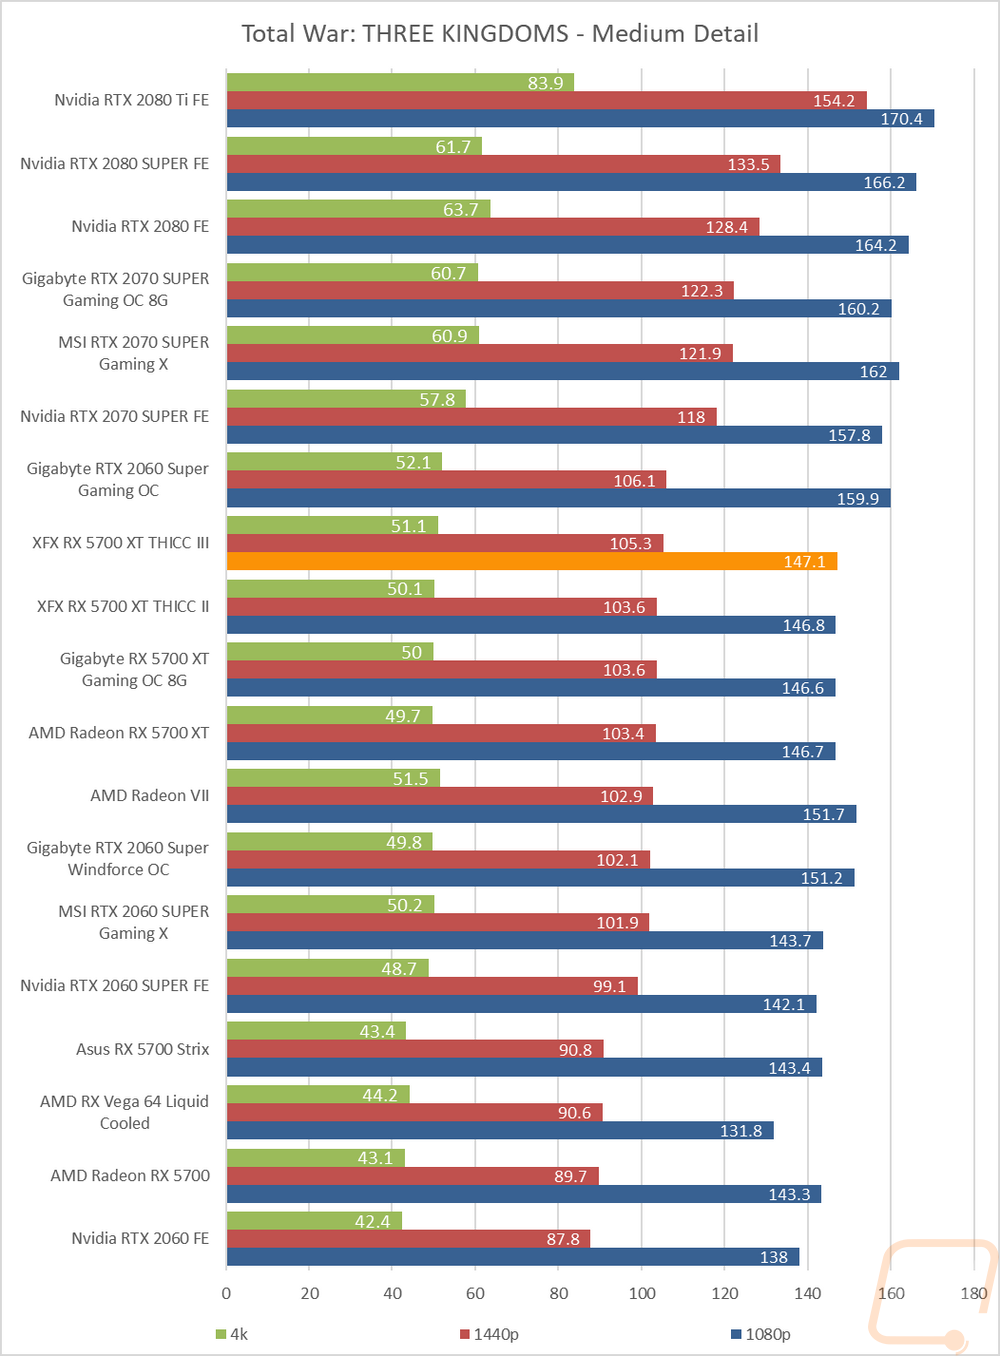
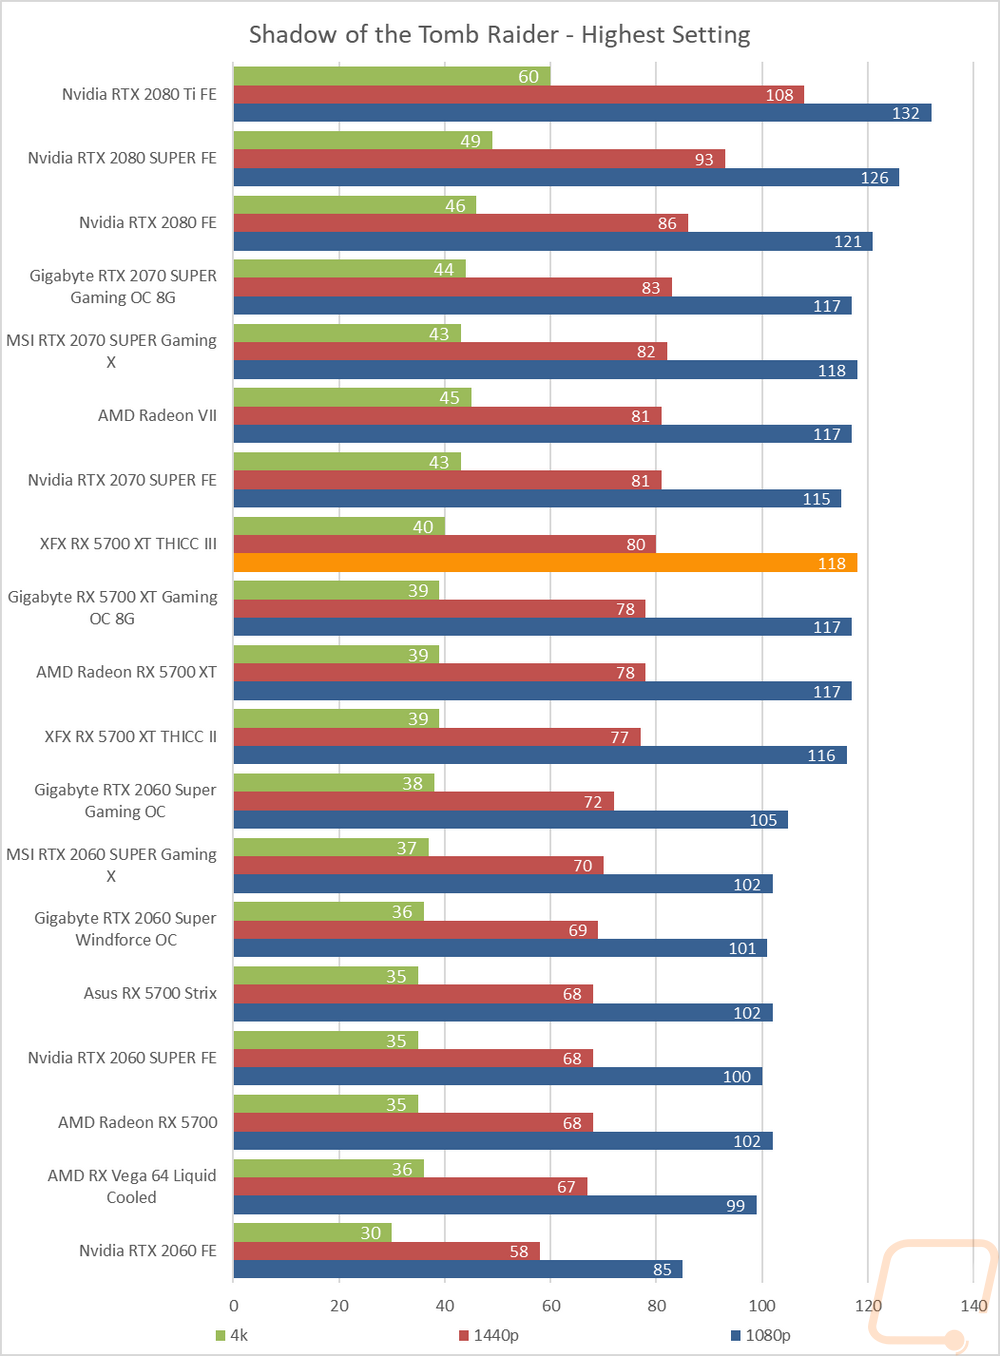
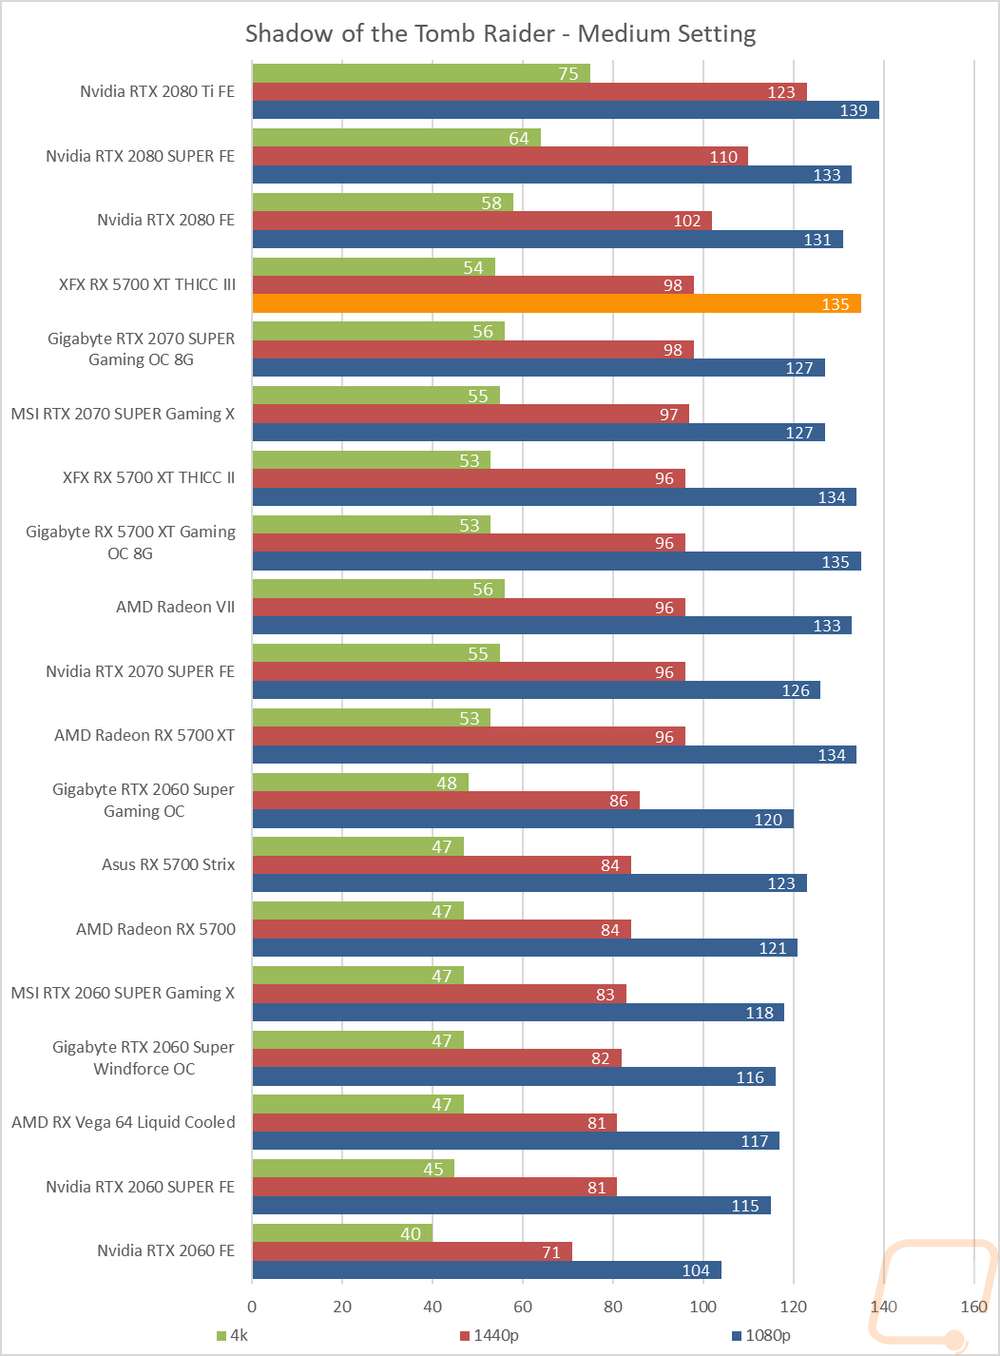
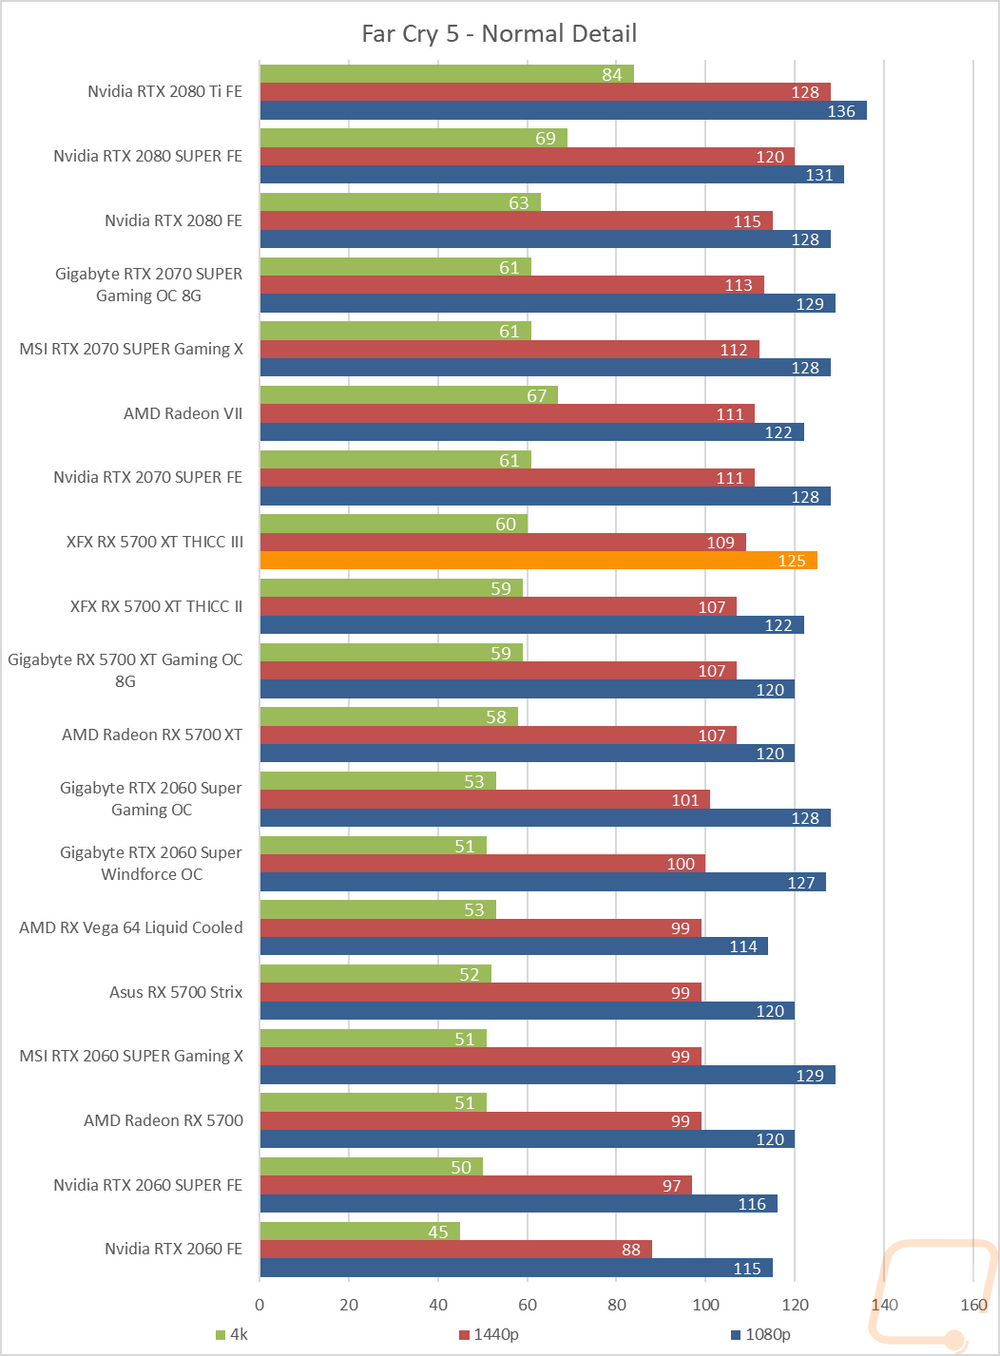
Now the actual results from all of that testing is where you will find a lot more information. You just have to be crazy enough to dig through it all. When looking at these results, I was, of course, curious to see if the Thicc III performed out ahead of all of the other RX 5700 XT’s like it did in the synthetic benchmarks. But on top of that, I wanted to see how the overclock effected where it stands in between the RTX 2070s and the RTX 2060 SUPER. For all of these results, I sorted everything by 1440p performance, because that is the sweet spot for this card, that means there are a few situations were 1080p performance for cards lower in the chart will be better and I know there are a lot of times that at 4k that happens as well.
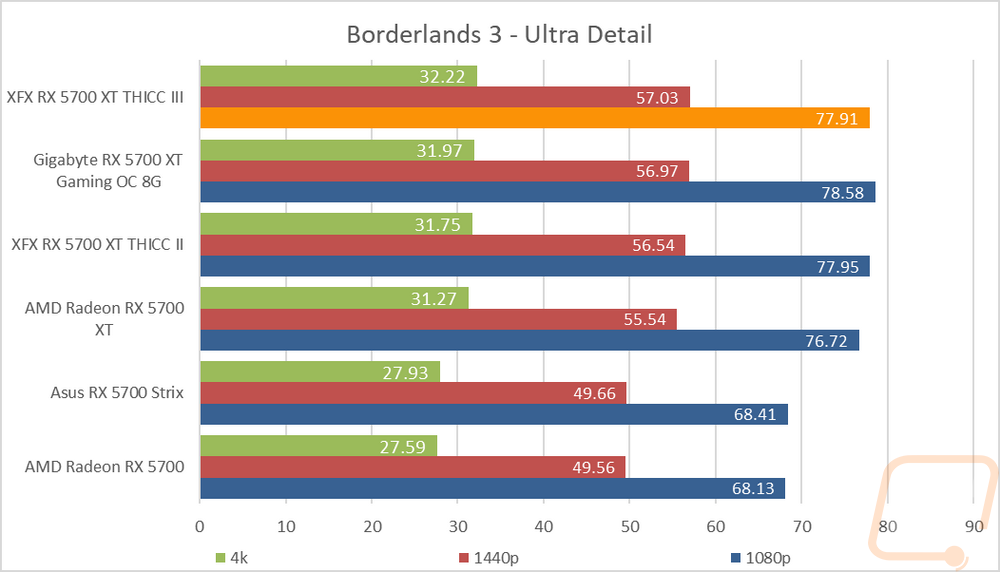
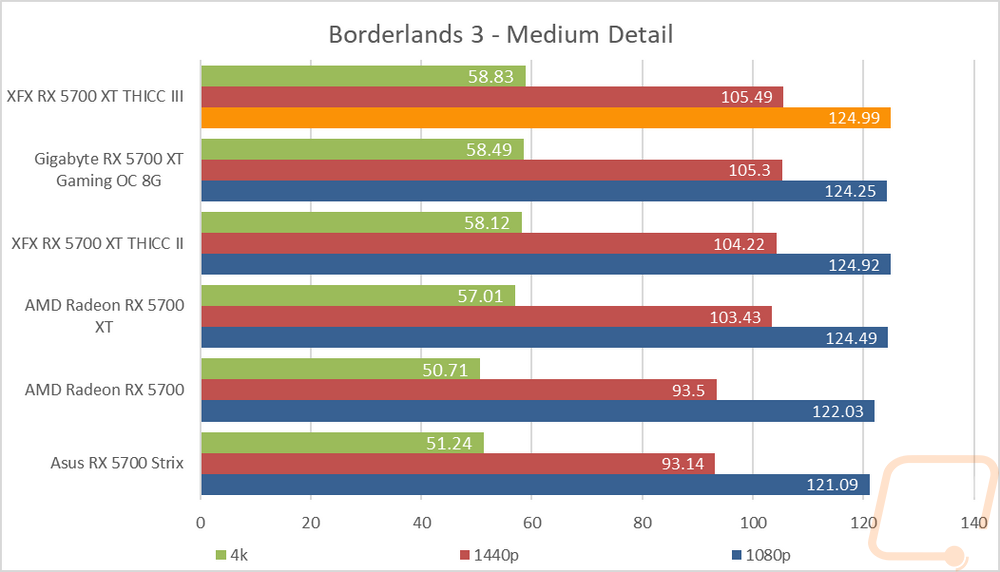
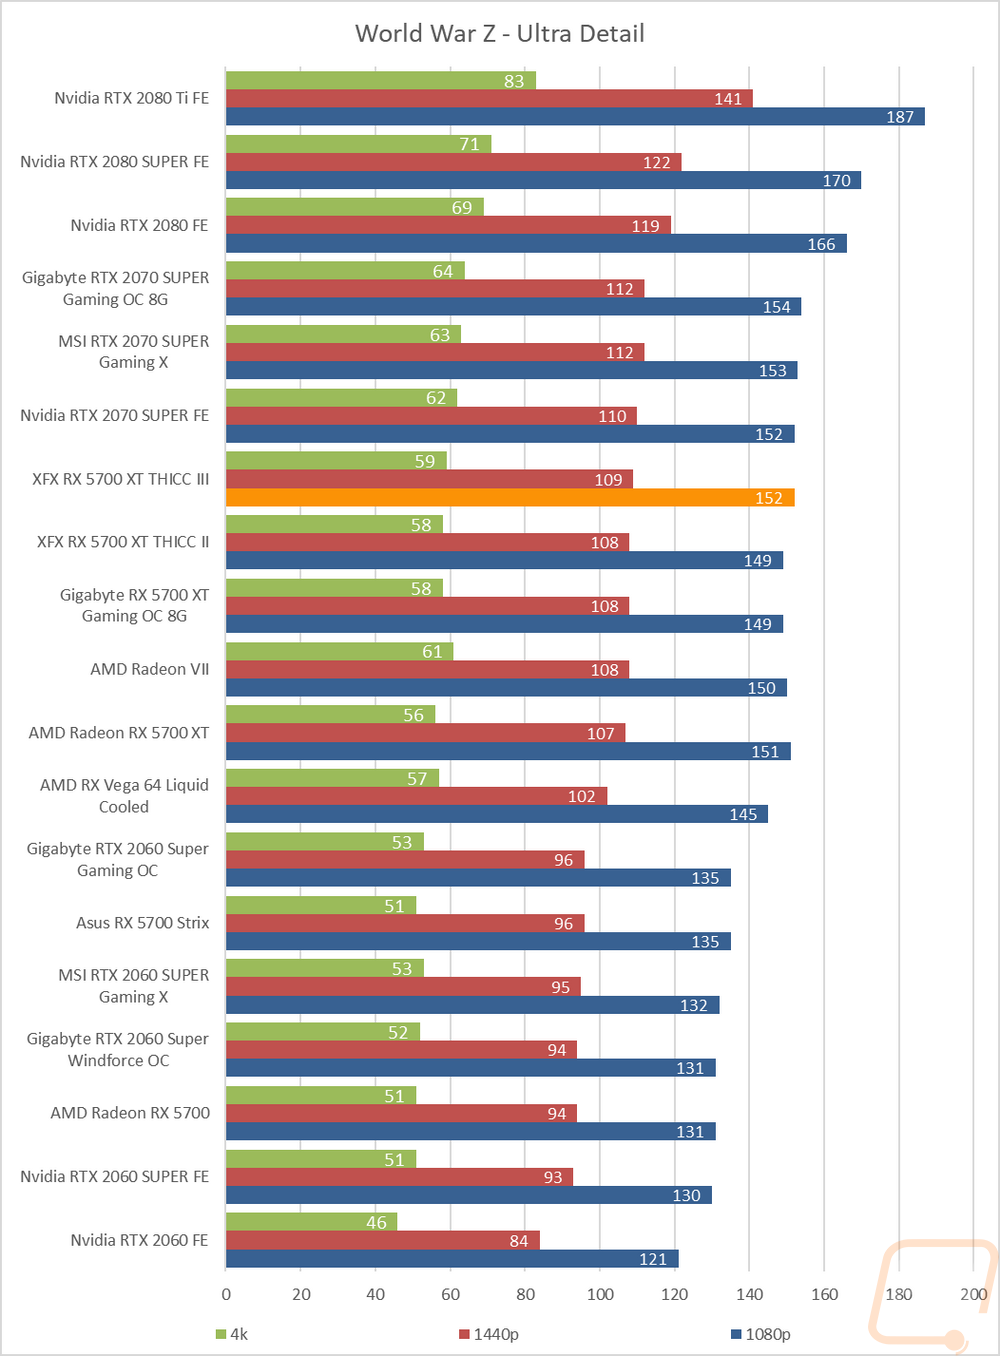
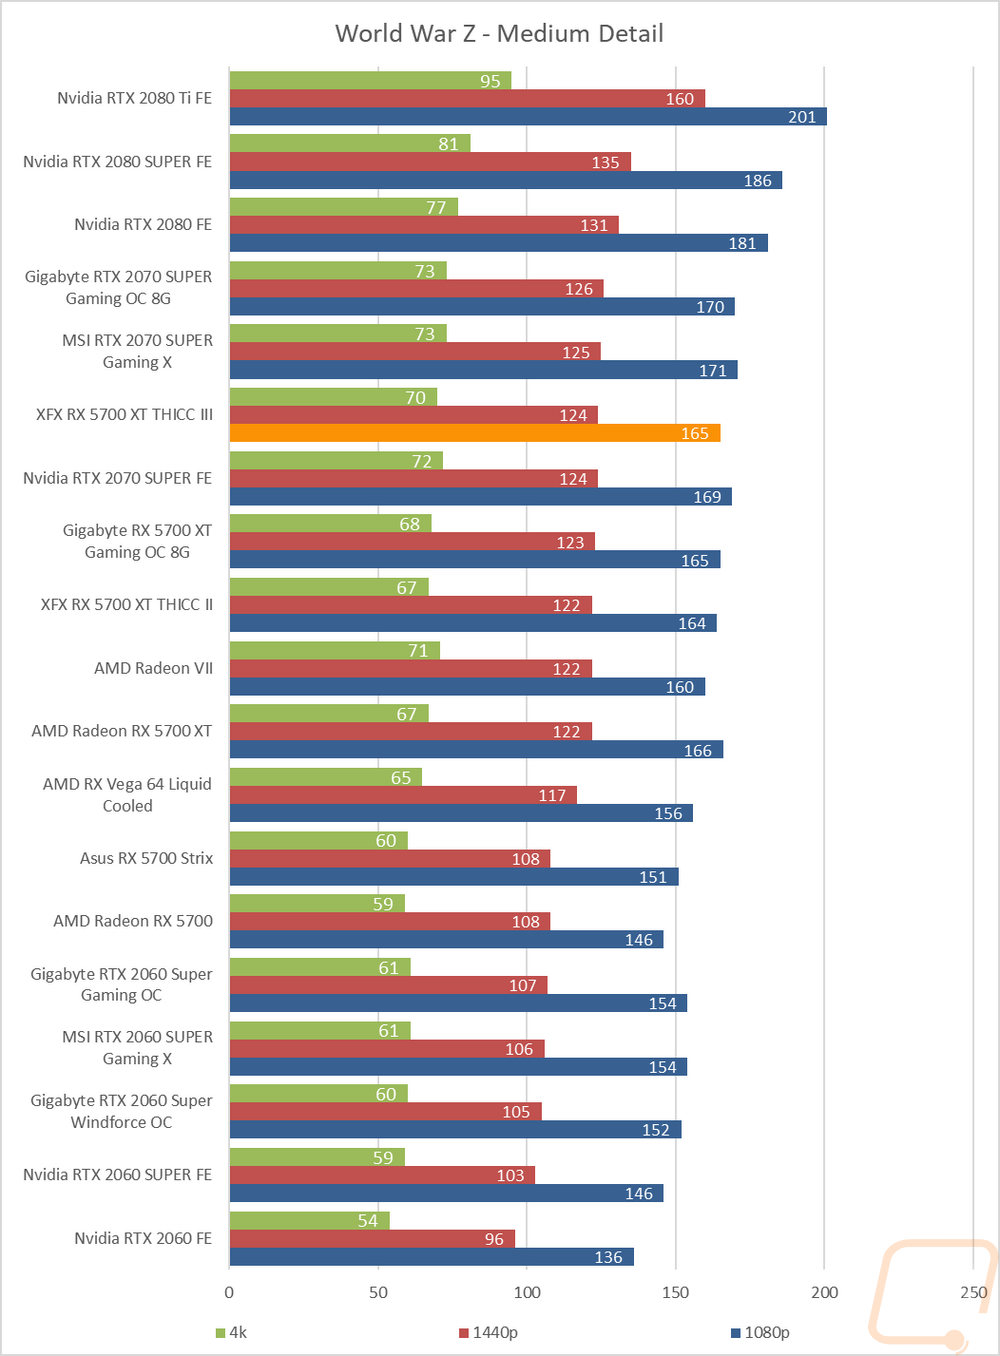
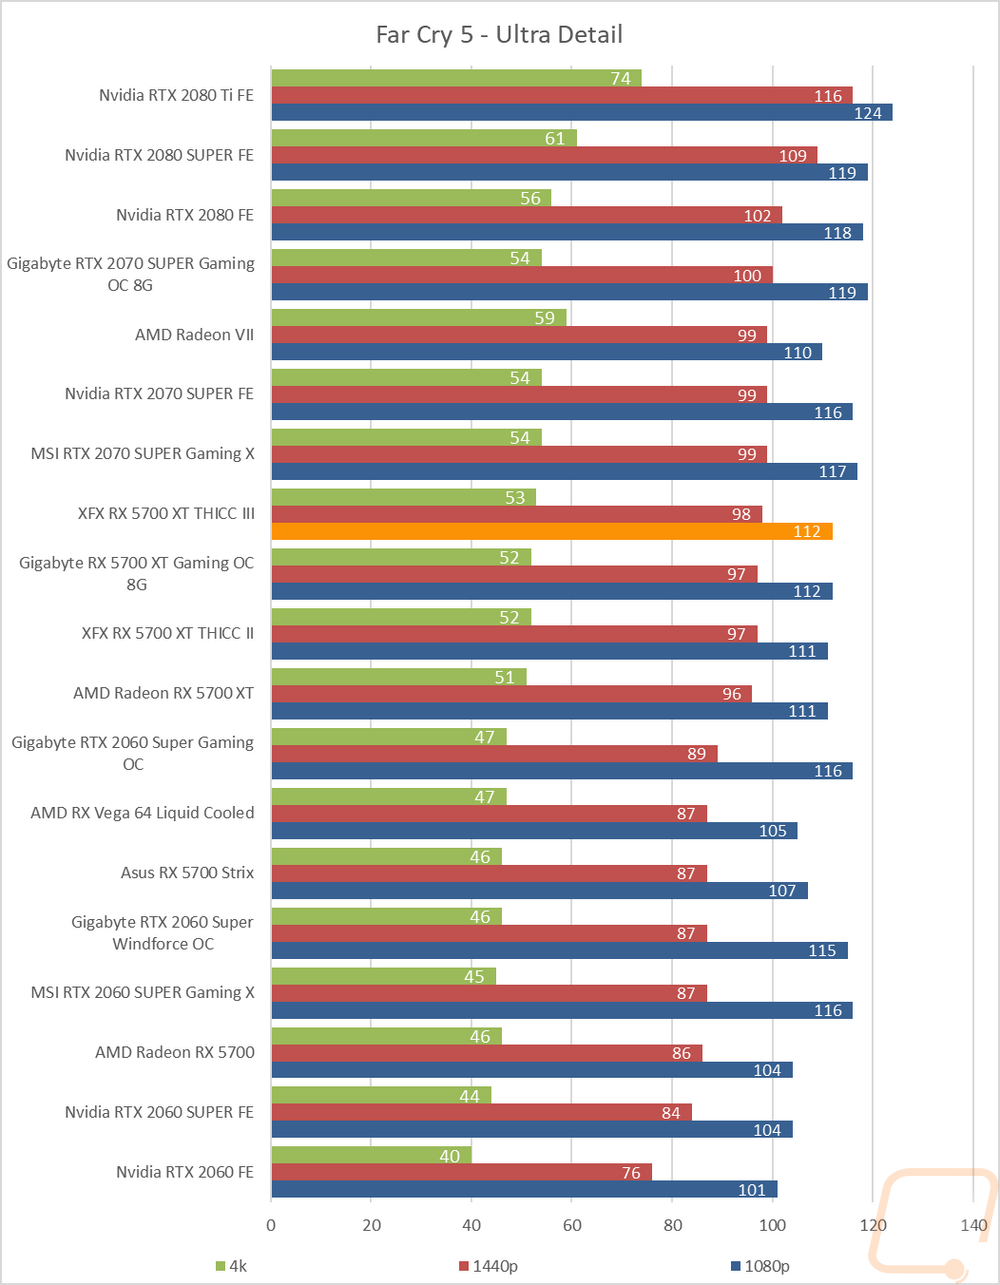
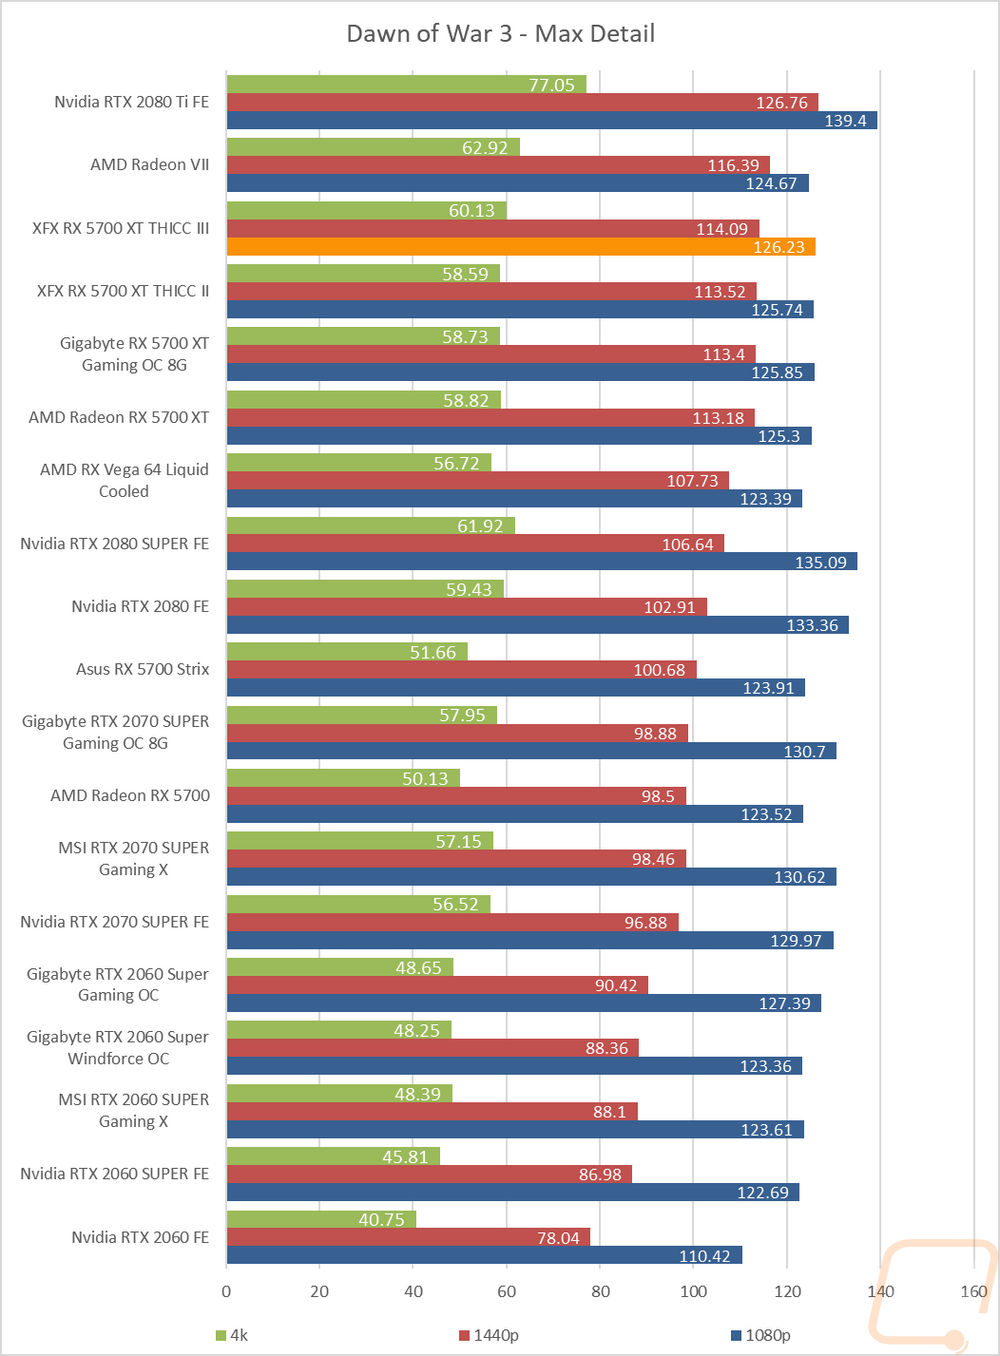
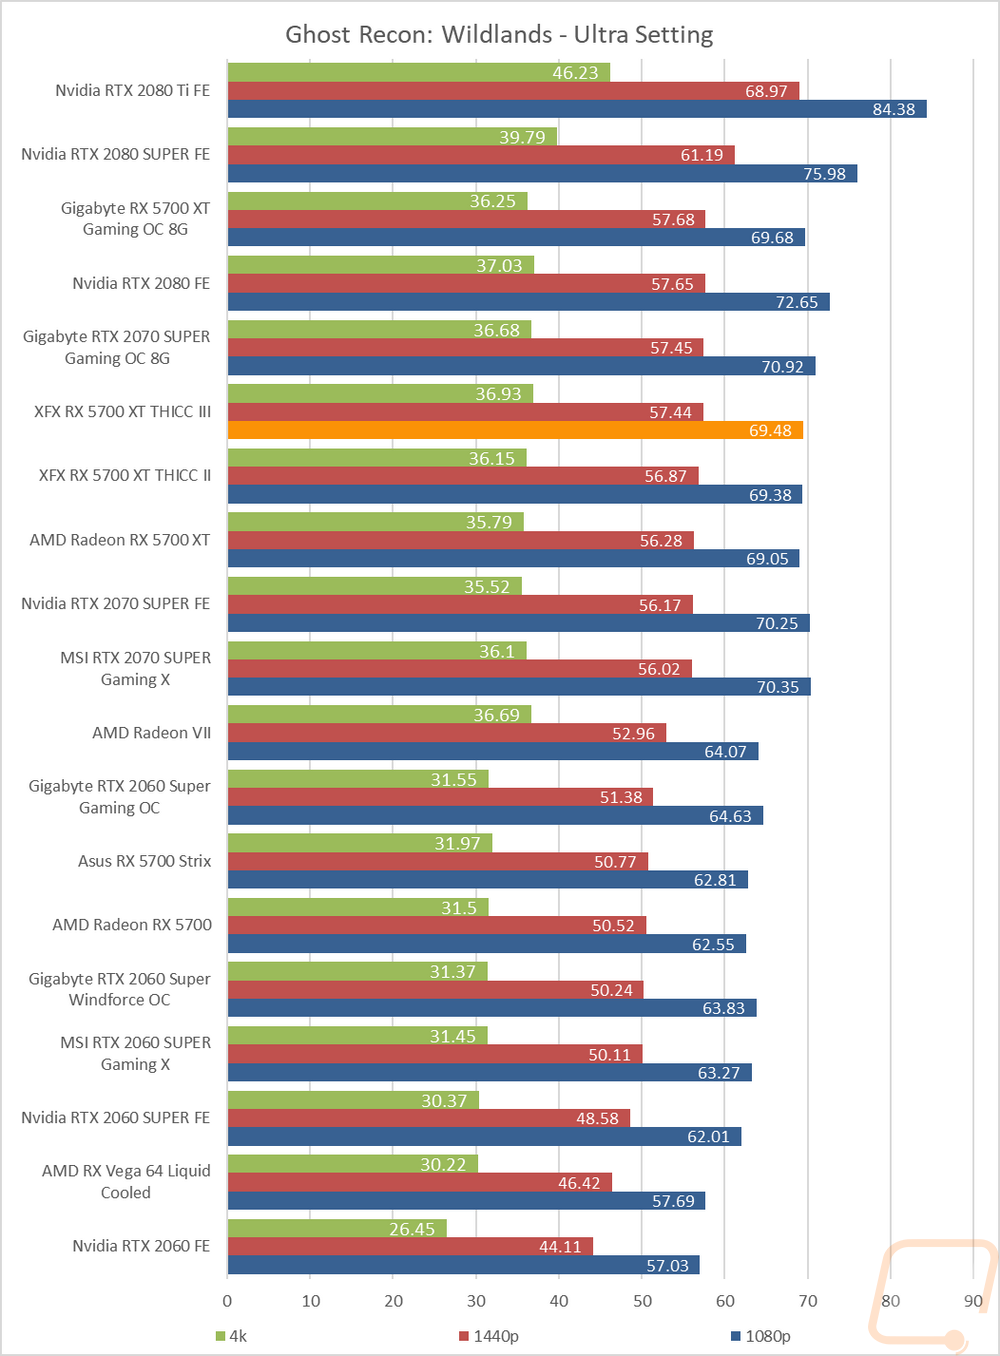
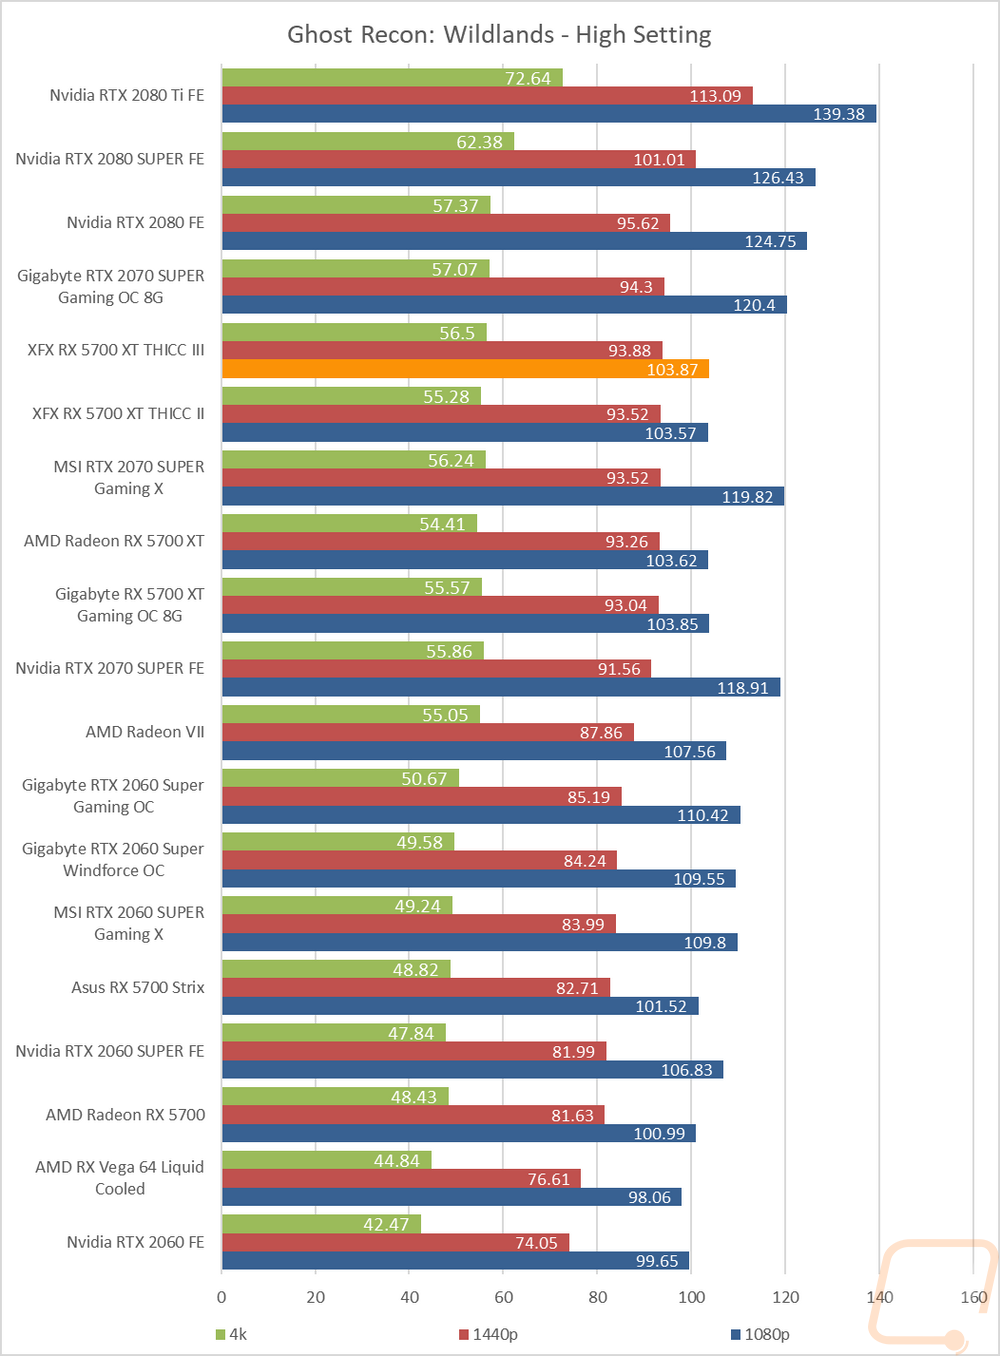
So how did the XFX Thicc III do? Well as the Borderlands 3 results that were just added and only tested on the RX 5700’s show this is the fastest 5700 XT of the four cards that I have tested. Though at 1080p there are times were the gap is very small or even some of the other XT’s are a touch faster. What I was more impressed with though were a lot of the situations where the other RX 5700 XT’s were running close to the RTX 2070 SUPER, the overclock helped bring them even closer or in the case of World War Z match performance at the ultra detail and be even faster at the normal detail. Overall the Thicc III gets 2-3 FPS over the other 5700 XT’s were the Thicc II struggled to stand out against the other cards at all in most tests.