Cooling, Noise, and Power
Once you decide which GPU you want to go with, you have to decide between all of the different models available. Clock speeds play a part as do pricing and aesthetics. But there are a couple of other areas that you should consider that are card specific. Power is one but it is in some ways tied with the overclock or at least how the overclock is done. There is also cooling performance and noise performance which both have to do with the cooler design. In this case, I’m curious how the Gaming X with its dual axial fan cooler design and much larger heatsink overall compares with Nvidia’s Founders Edition.
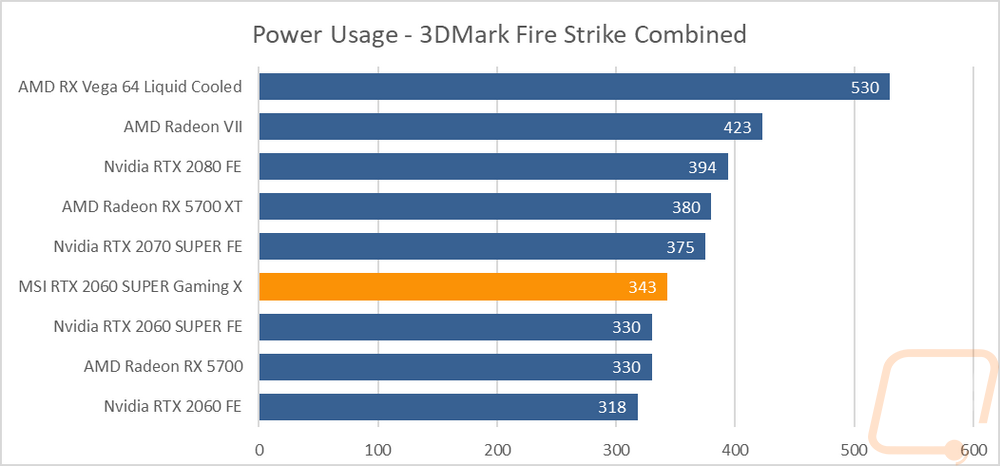
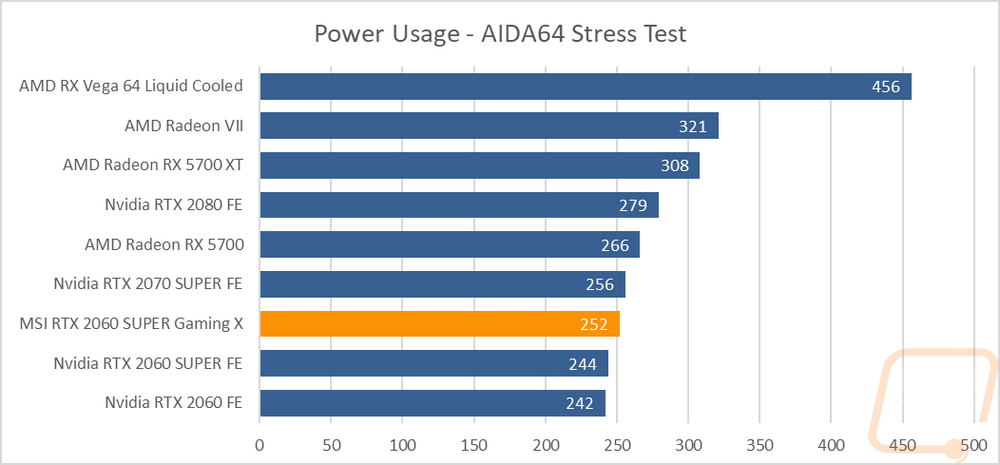
So to start things off let's check out power usage. For this I use a Kill-A-Watt and measure the total power of our test system, so keep in mind these numbers do include CPU motherboard power. The first test I use 3DMark’s Fire Strike benchmark to put the entire system under a gaming like load. The combined benchmark test loads both the CPU and GPU and I record the peak wattage pulled which was 343 watts. This is 13 watts over the original RTX 2060 Super Founders Edition, not too bad of an increase considering the overclock. The second test is similar but I use AIDA64’s stress test set to stress just the GPU to focus only on the GPU. Here the Gaming X pulled 252 watts where the Founders Edition pulled 244. This is still well under the wattage pulled by the RX 5700 but in the second test, it is a lot closer to what the RTX 2070 Super FE pulled.
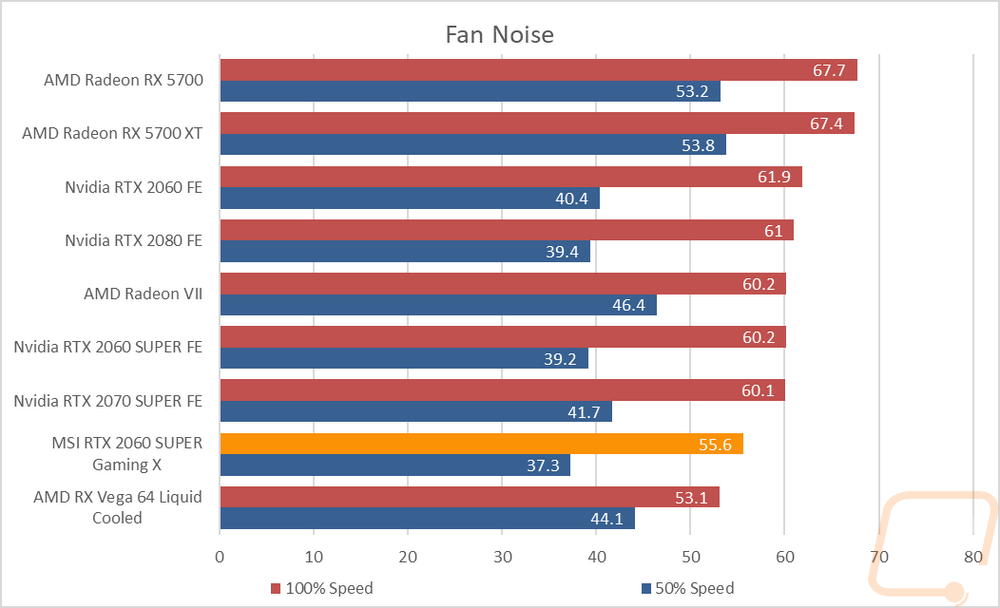
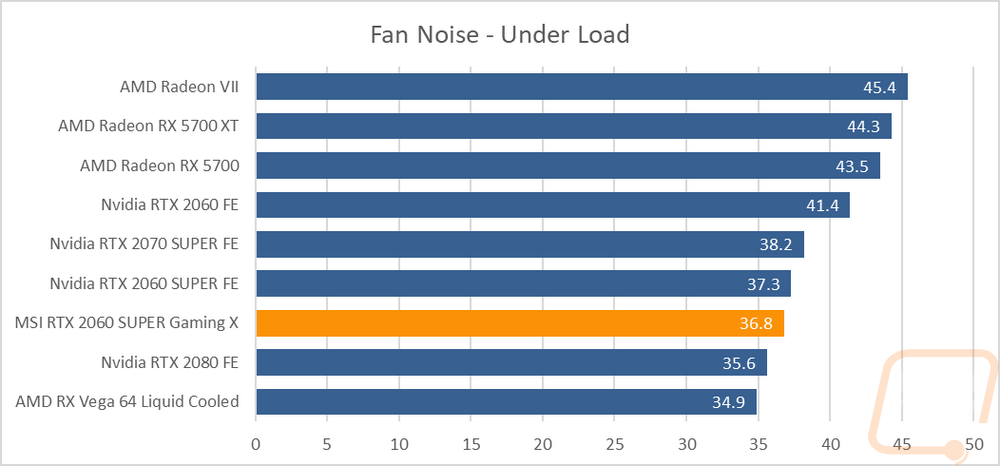
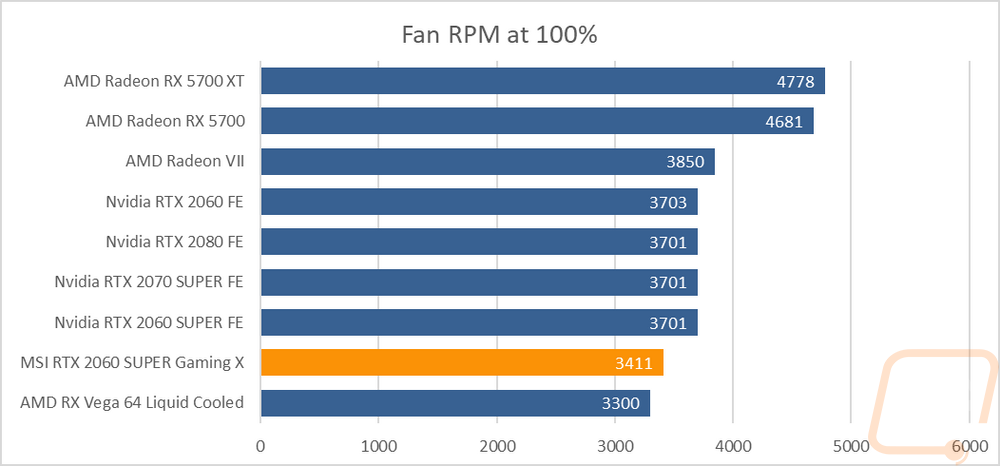
Next, I want to check out how noisy the fans are. The Founders Edition RTX 2060 Super was really quiet making it a little harder on MSI but their Twin Frozr coolers do extremely well for noise. This ended up being the quietest card tested at 50% fan speed and was only second to the Vega 64 liquid cooled with its AIO water cooler at 100% fan speed. For under load testing I check the noise levels while the card is stressed in AIDA64’s stress test after a half hour. In that test the gap between the Gaming X and the Founders Edition was much smaller which was surprising.
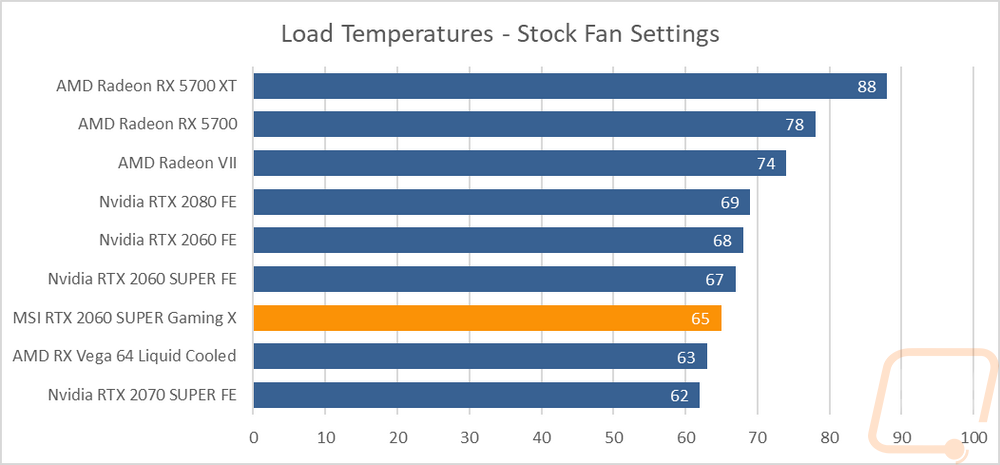
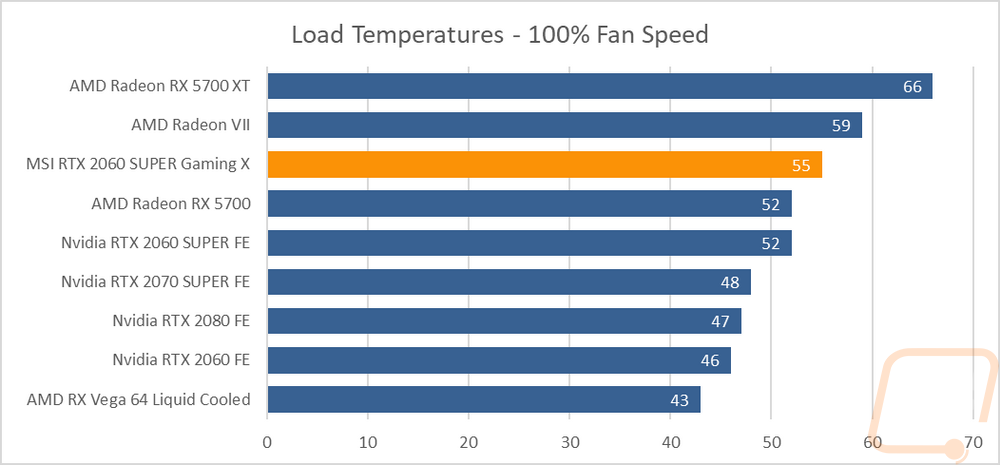
 The last round of testing was to take a look at the thermal performance of the cooler. For this, I use AIDA64’s stress test and let it run for a half hour or longer depending on how long it takes for the temperature reading to level off. I do this twice, once with the factory fan profile and a second time with the fan at 100%. The idea being that we can see what you will get out of the box and then testing what the best possible temperature would be, a big delta between those two shows there is extra overclocking room left. So the Gaming X ended up peaking at 65 degrees with the stock fan profile which was just two degrees less than the Founders Edition but still on the lower end of the charts. Now for max fan speeds, I was surprised to find that the Gaming X didn’t do as well here, actually coming in three degrees higher than the Founders Edition cooler. It does have a lower RPM overall which doesn’t help but the extra heat from the overclock also seems to be heating things up a lot more here.
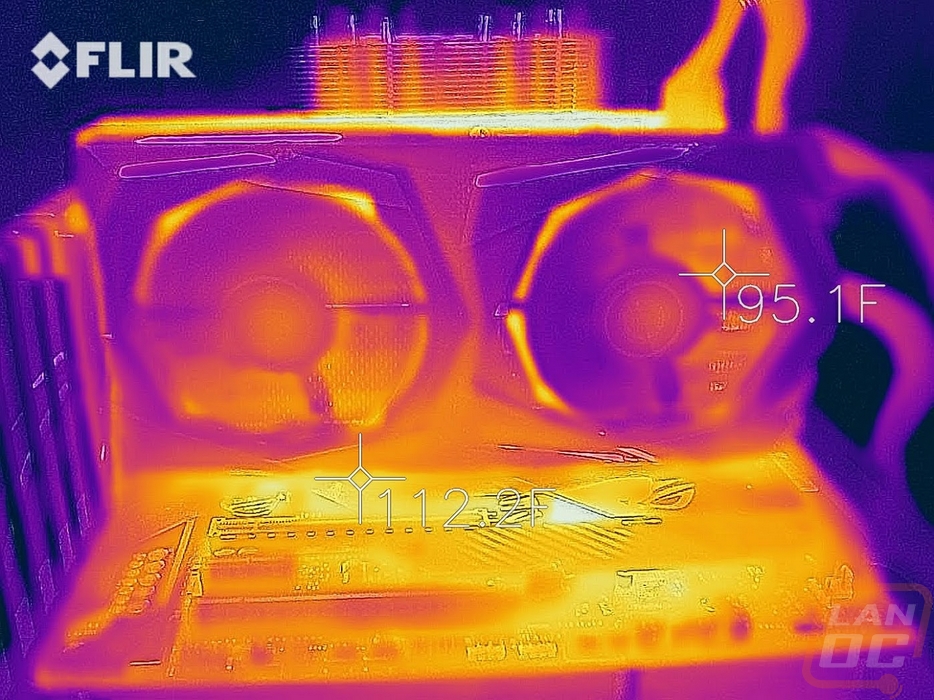
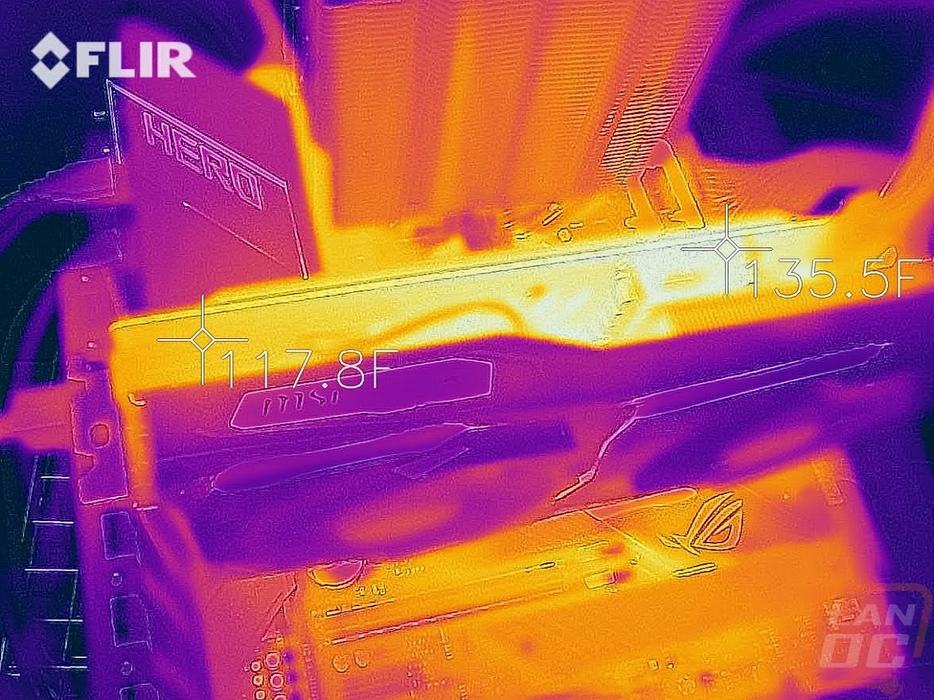
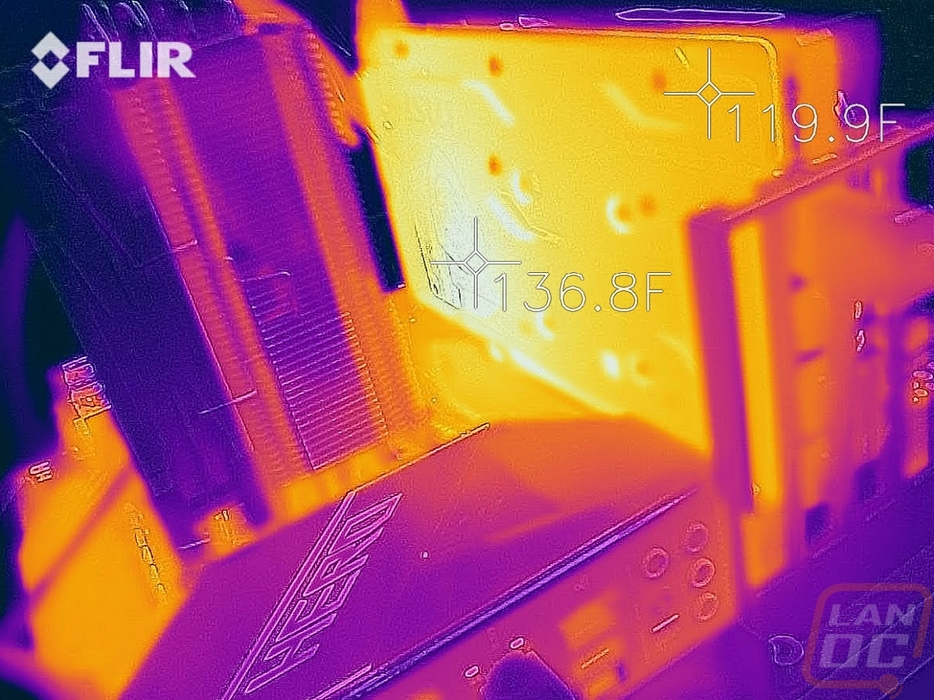
While doing thermal testing with the stock fan profile I also took the chance to get a few thermal images of the Gaming X to get an idea of where it is running cool and where it runs hot. On the fan side, you can see hot areas on the heatsink on the right side of the right fan and in the bottom right corner on the left fan but overall you can see clearly where the fans are keeping the heatsink cool and with heat coming out the bottom and top. That is especially visible from the top view but that runs warmer on the VRM side of the card by far. The back view shows this as well with behind the GPU actually not that hot at all, all of the heat is to the left where the VRMs are, especially the VRMs on the bottom.