Cooling, Noise, and Power
My last round of testing is also some of the most important once you have decided on which GPU model you want. That is because most cards with the RTX 2060 SUPER GPU are going to be close in performance give or take on the overclock, but cooling, noise, and power are all things that change from card to card and company to company. They also get even more important when you get into smaller form factor builds, huge builds heat and power isn’t a big deal. I’m curious how the 2060 SUPER FE will compare to the RTX 2060 FE given they have the same cooler design. It should be a good way to see what the extra SMs, memory, and different clock speeds changed.
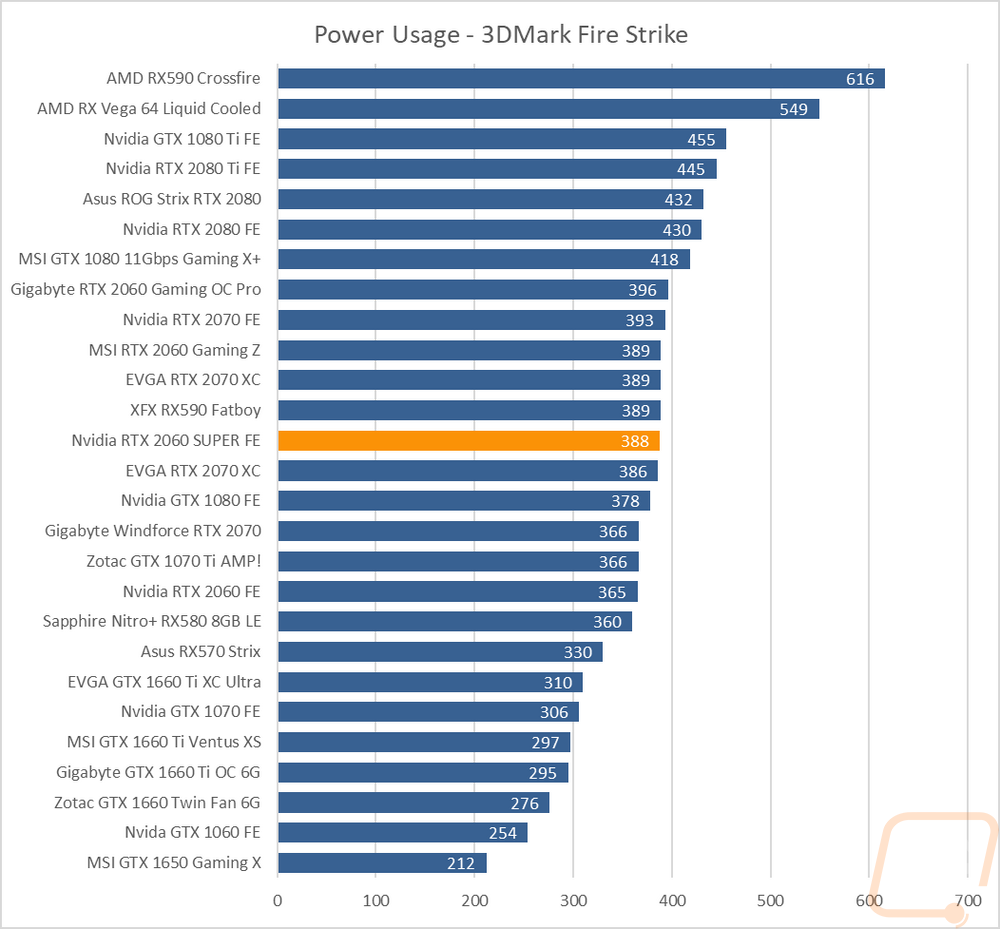
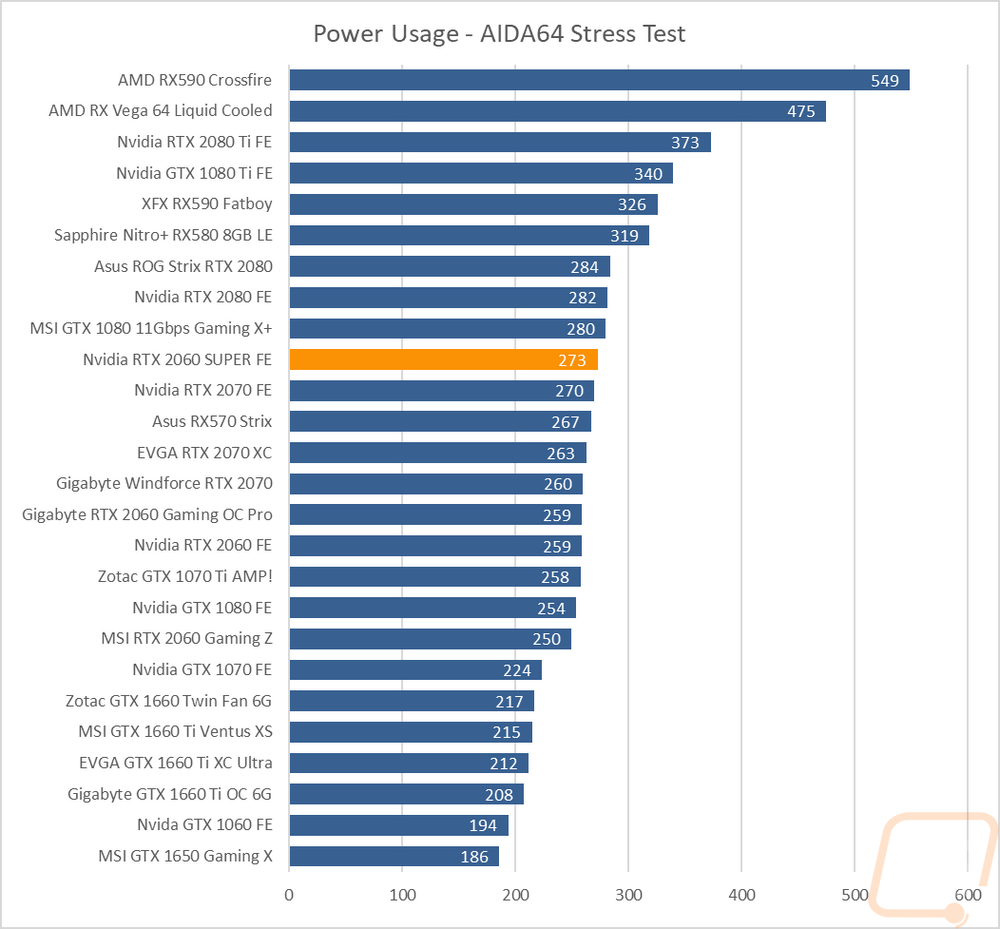
For the first tests, I wanted to check out power usage. For this, I used out Kill-A-Watt and monitored the total wattage pulled from our entire test system. I ran two tests with two different load types. I used the 3DMark Fire Strike benchmark in the combined test which loads up the video card and CPU in a similar way to most games. In that test, our system pulled 388 watts at peak which was surprise surprise very close to the RTX 2070 and 22 watts higher than the RTX 2060 FE but this was about right compared to the increase in TGP from the original 2060 to the SUPER. The second test was using AIDA64’s stress test just loading the GPU. This wattage is lower because it isn’t putting any load on the CPU or other components but it puts a more solid load on the video card itself. The difference here was 14 watts. Keep in mind however that neither of these is loading up the Tensor or RT cores so with all of the RTX cards you could see more power draw using those specific workloads. Overall the 2060 SUPER does get a jump in power draw, but not any more than expected.
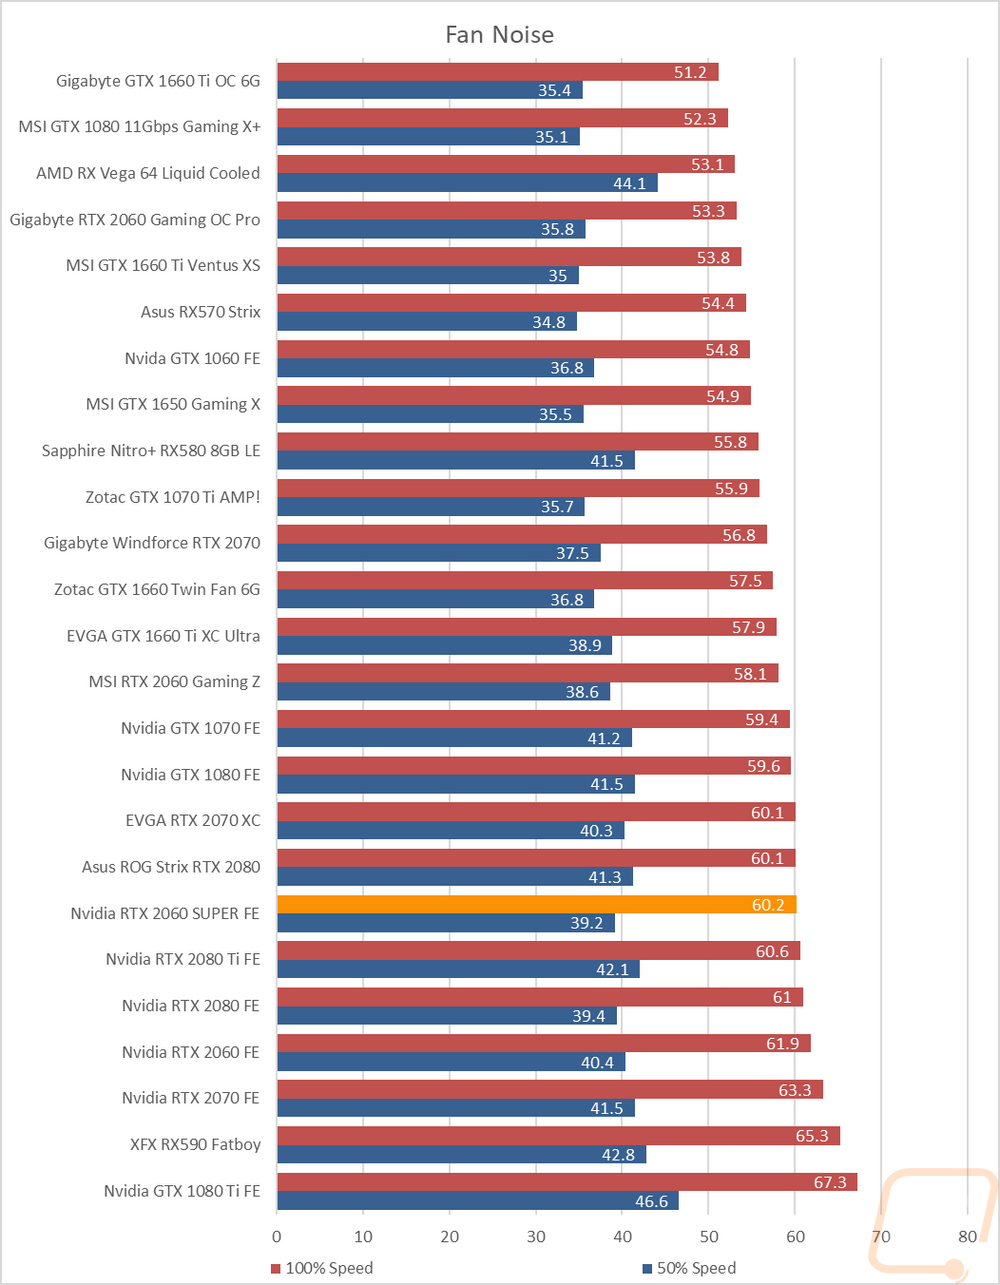
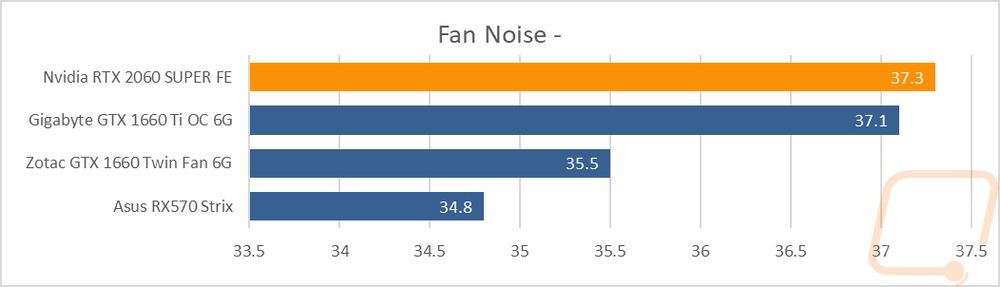
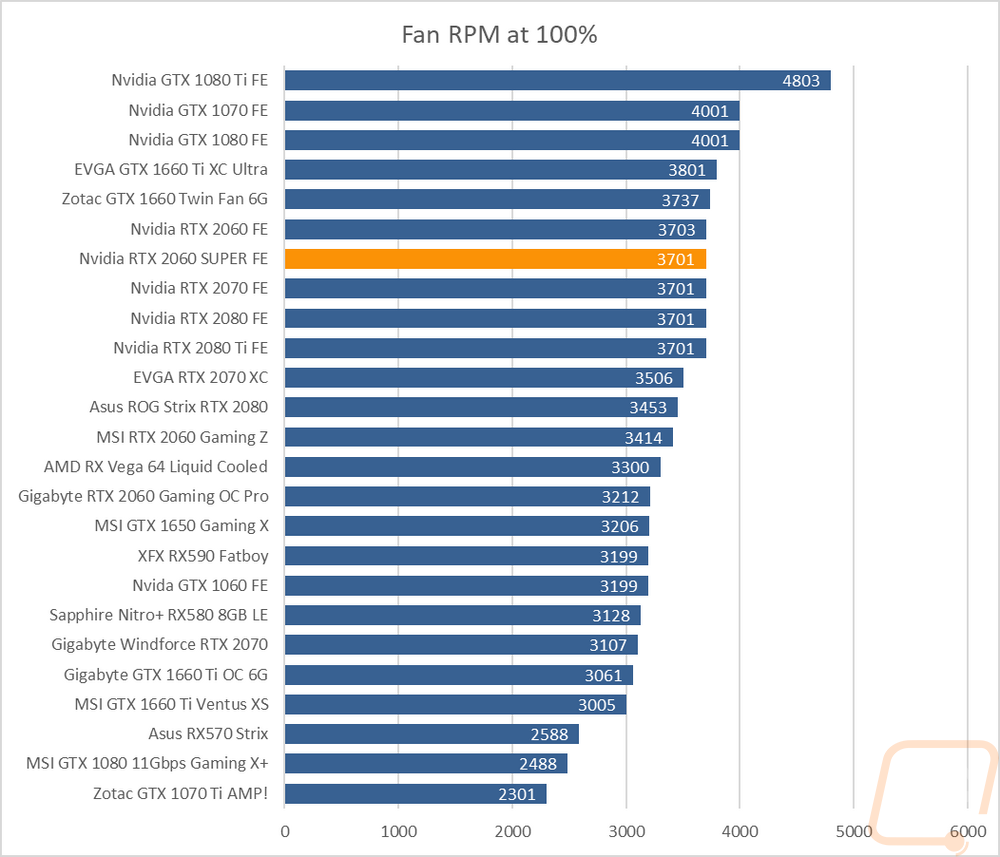
Next, I wanted to check out the noise levels of the dual fan cooler on the Founders Edition. To do this I ran three tests. One at 100% fan speed, one at 50% fan speed, and a third testing the noise level when doing our thermal tests which show the loudest the fan should get in normal usage. At 100% fan speed, the 2060 SUPER was right with all of the RTX Founders Edition cards which were quieter than the old blower on the 1080 Ti but louder than the blower fans on the mid-range GTX FE cards. 50% fan speed, on the other hand, was a little better, once not really cranked up the dual fans aren’t too bad. Of course, when compared to aftermarket cards there is still room to improve. This was especially obvious in the third test where I monitored noise levels with the card under a 30+ minute solid load.
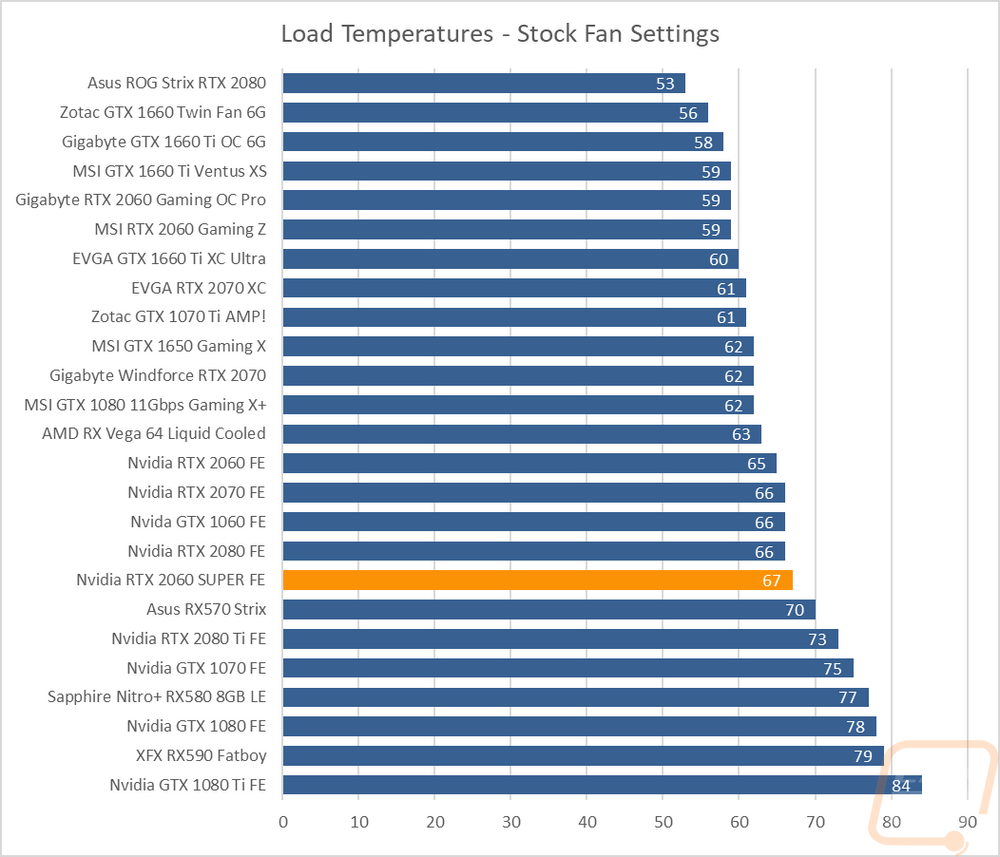
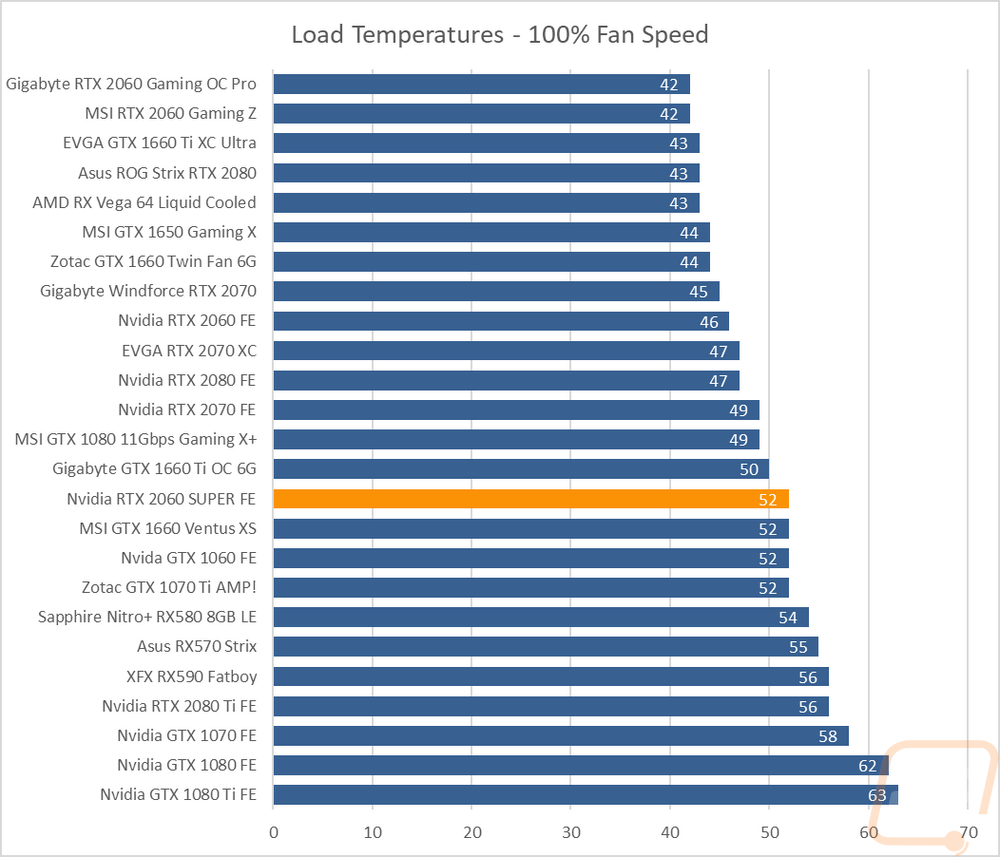
My last round of testing was thermal tests. For this I did two different tests, one with the stock fan profile putting the card under load again using AIDA64’s stress test and then a second time with the fan turned up to 100%. The idea is to see what the fan profile is set to let the card run for temperature and then see if noise wasn’t a concern how cool it would run in the same test with the fans up. The delta between those lets us also see how much more room is left for cooling should you want to overclock or make your own fan profile. Now with the stock fan settings, our 2060 SUPER did run two degrees higher than the original 2060 FE and this was just above all of the original RTX cards but still well below the much higher temperatures than the older Founders Edition cards ran. Turning the fan up dropped temps from 66 down to 52 which wasn’t really a lot. This is where you can see how the nearly RTX 2070 GPU configuration running on the 2060 cooler changes things with the older 2060 FE being 6 degrees cooler.
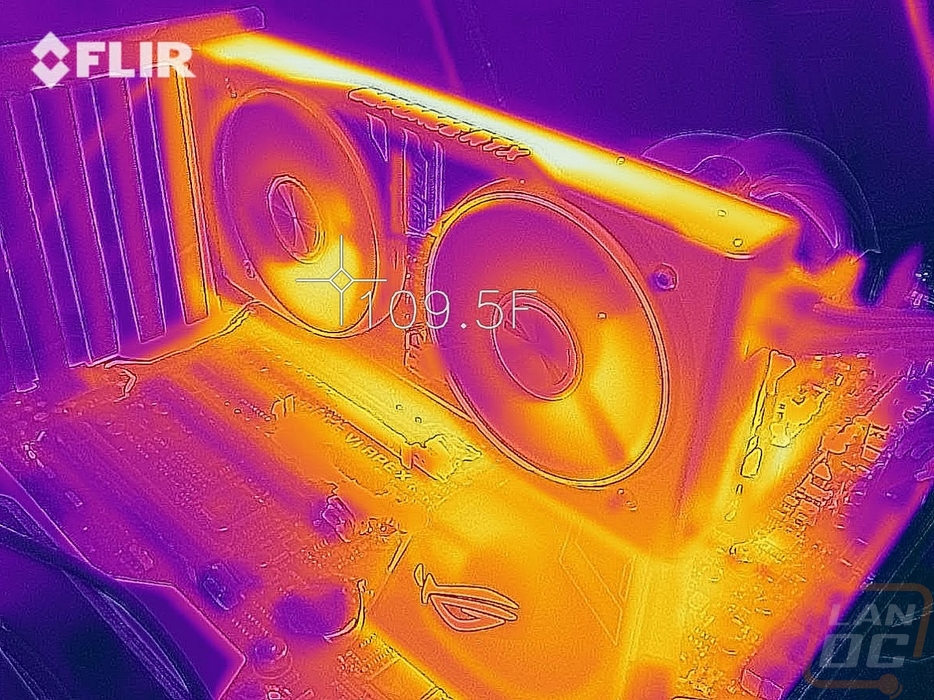
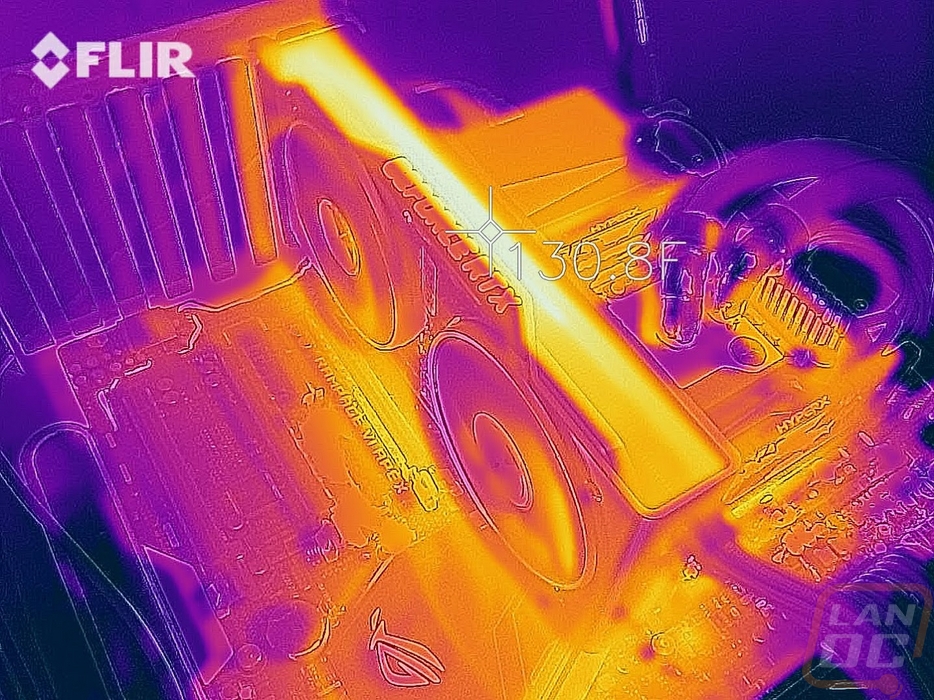
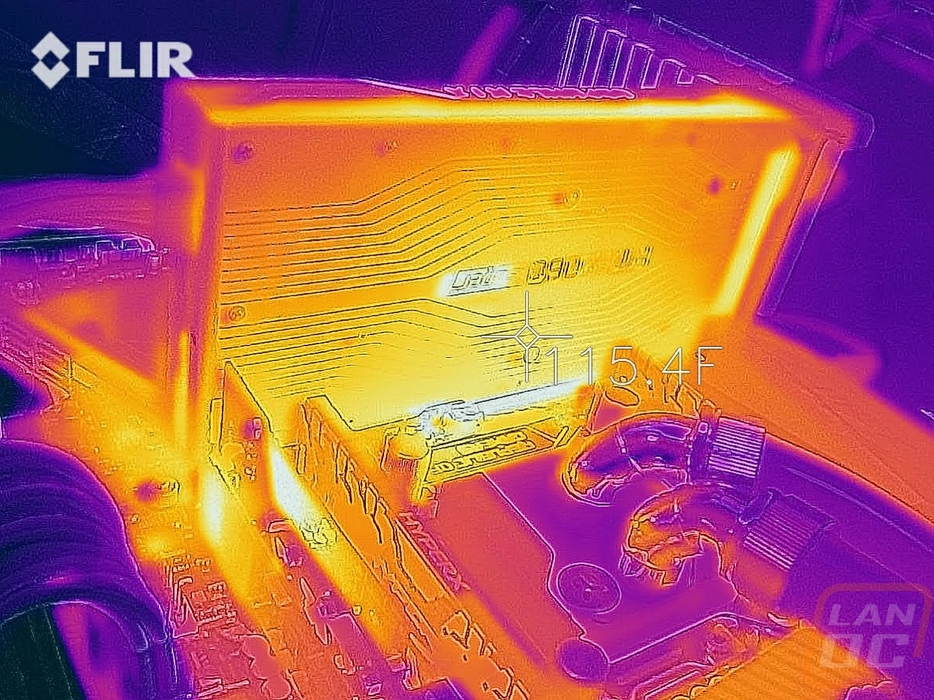
While doing stock fan profile testing and after I had the card nice and warmed up I did also get a few thermal images as well. I just wanted to look for any hot spots and to see how hot the outside of the card is running after the all metal fan shroud warms up. On the backplate, you can see a warmer area near the middle of the card where the GPU is but you can also see how the backplate is pulling that heat out away from there. The top view gives a good look at where the warmed air is blowing out the top and bottom edge. But I think it’s the fan view that is the most interesting with noticeable hot spots on the bottom right of the fans compared to the other ¾ of the fan. I don’t know if maybe airflow on the top portion is a little easier. It wasn’t a concerning temperature difference, just interesting enough to point out.