In-Gaming Benchmarks
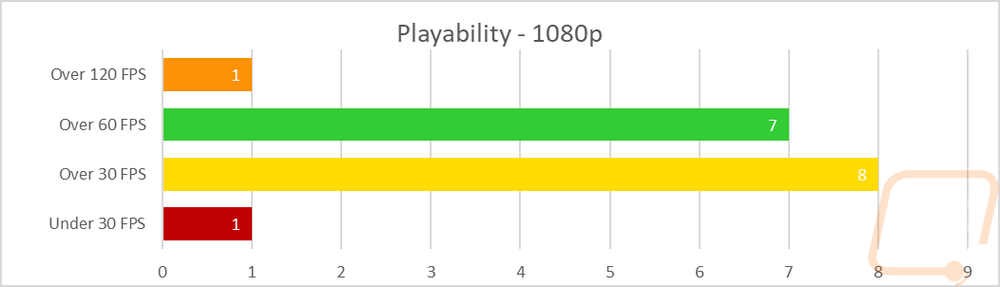
Now we finally get into the in game performance and that is the main reason people pick up a new video card. To test things out I ran through our new benchmark suite that tests 12 games at three different resolutions (1080p, 1440p, and 4k). I also slipped in a few variations on the same games for comparisons like DX11 to DX12, OpenGL to Vulkan, and a couple of games are just tested at their highest setting and lower but still high detail options to show the performance difference when things are turned down slightly. In total, each video card is tested 54 times and that makes for a huge mess of graphs when you put them all together. To help with that I like to start off with these overall playability graphs that take all of the results and give an easier to read the result. I have one for each of the three resolutions and each is broken up into four FPS ranges. Under 30 FPS is considered unplayable, over 30 is playable but not ideal, over 60 is the sweet spot, and then over 120 FPS is for high refresh rate monitors. This covers all of the games tested except Final Fantasy XV that we have a score rather than an FPS because they like to be different.
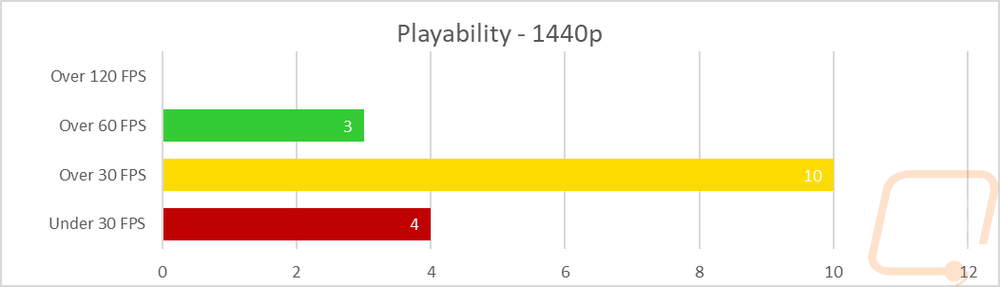
So how did the MSI GTX 1650 Gaming X perform? Well, you can toss 4k out the window right away, only four out of 17 tests came in over 30 FPS. That isn’t a surprise at all given the 4GB of VRAM and 128-bit memory interface. 1440p was a little better with a majority of games being at least somewhat playable, but I wouldn’t be looking at the GTX 1650 for 1440p. So 1080p was my main focus and with just one test as an exception, all of the games were playable. Just one was in over 120 FPS with most in the middle with 8 in the 30-60 range and 7 over 60. All of our games are higher end games running at their highest settings, so at 1080p the GTX 1650 is going to be able to play just about anything. A lot of the higher end games are going to require turning the detail down. “esports” titles like League of Legends, CS:GO, DOTA2, and Fortnite, however, are all going to play perfectly.

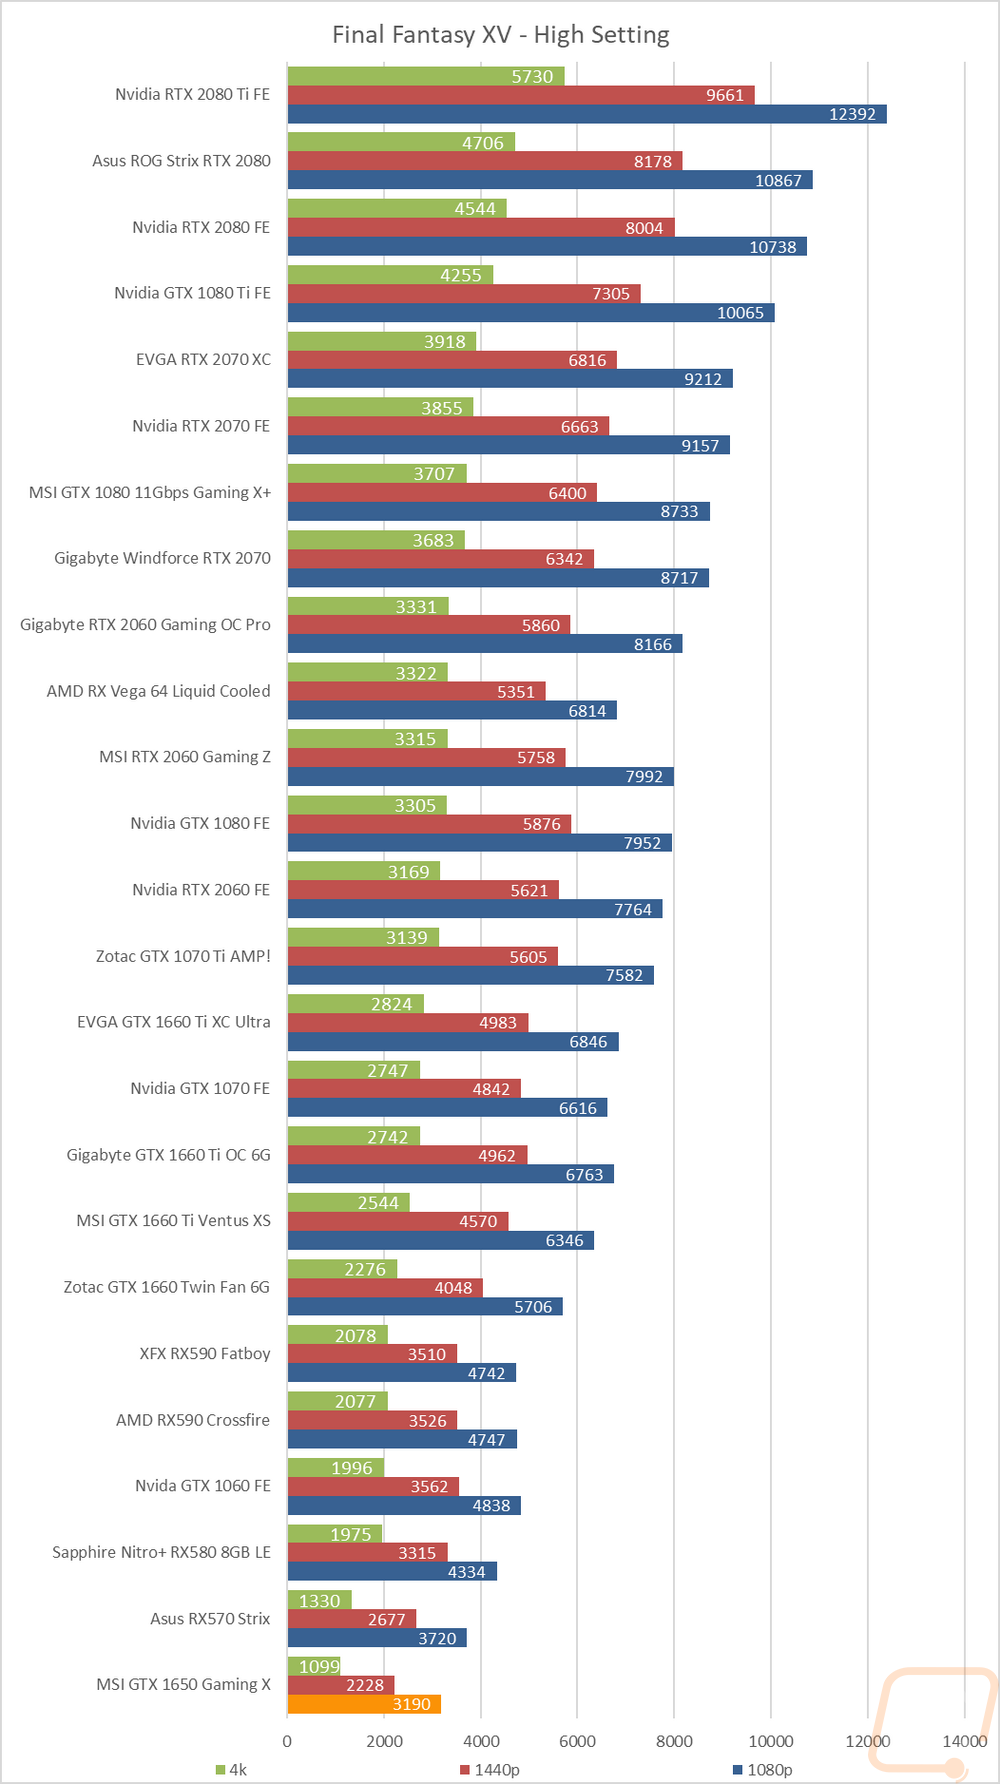
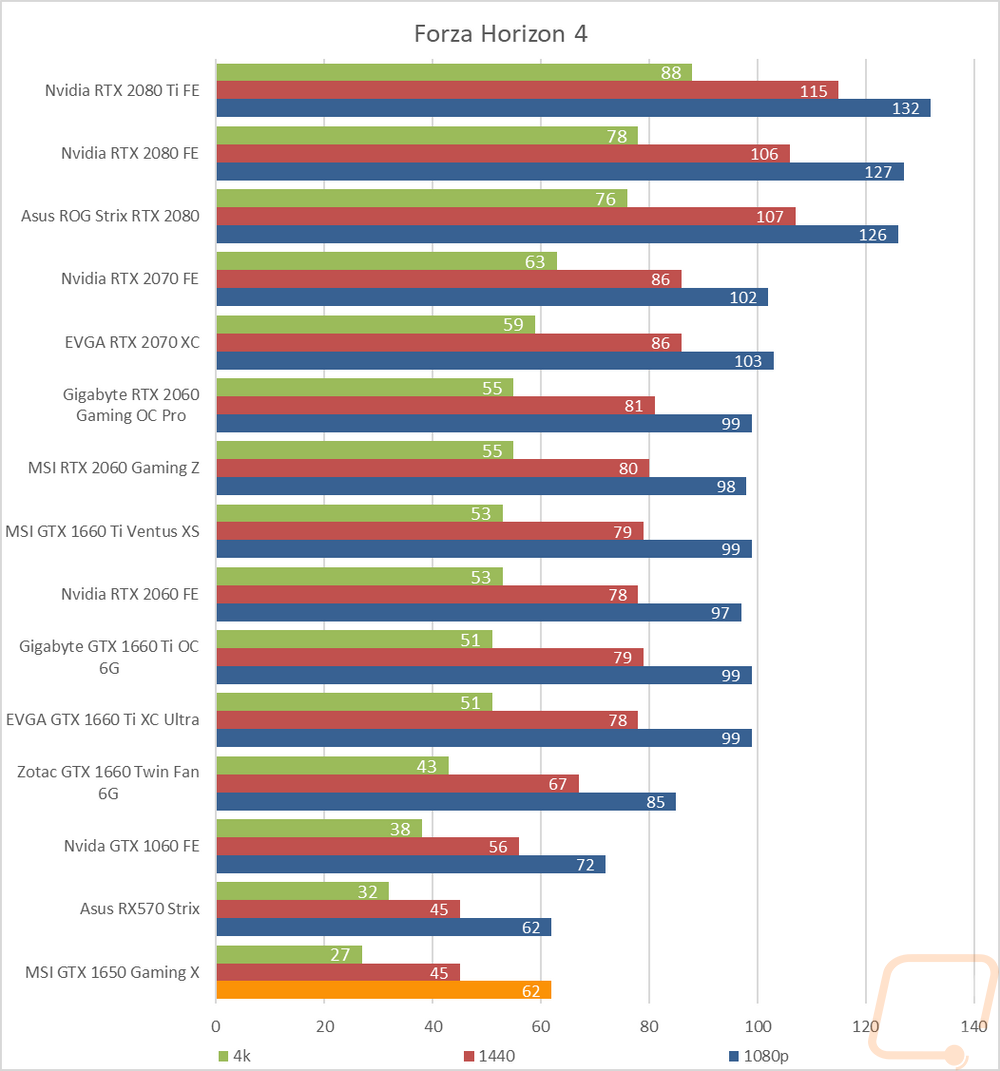
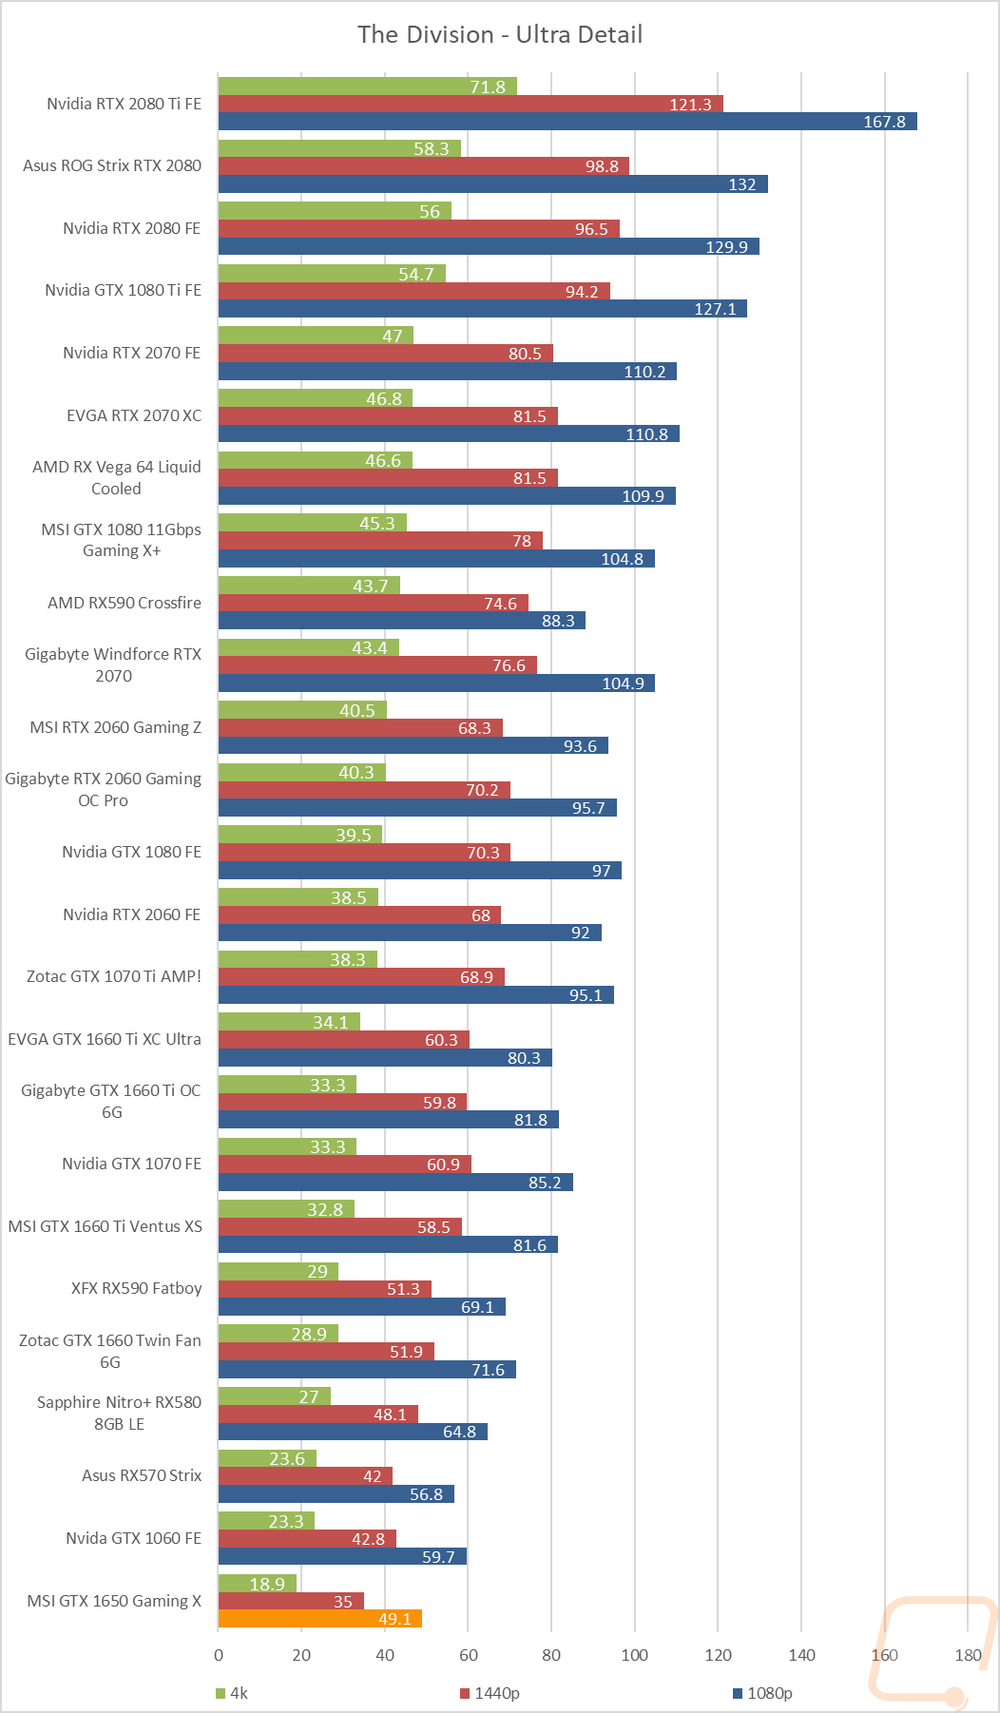
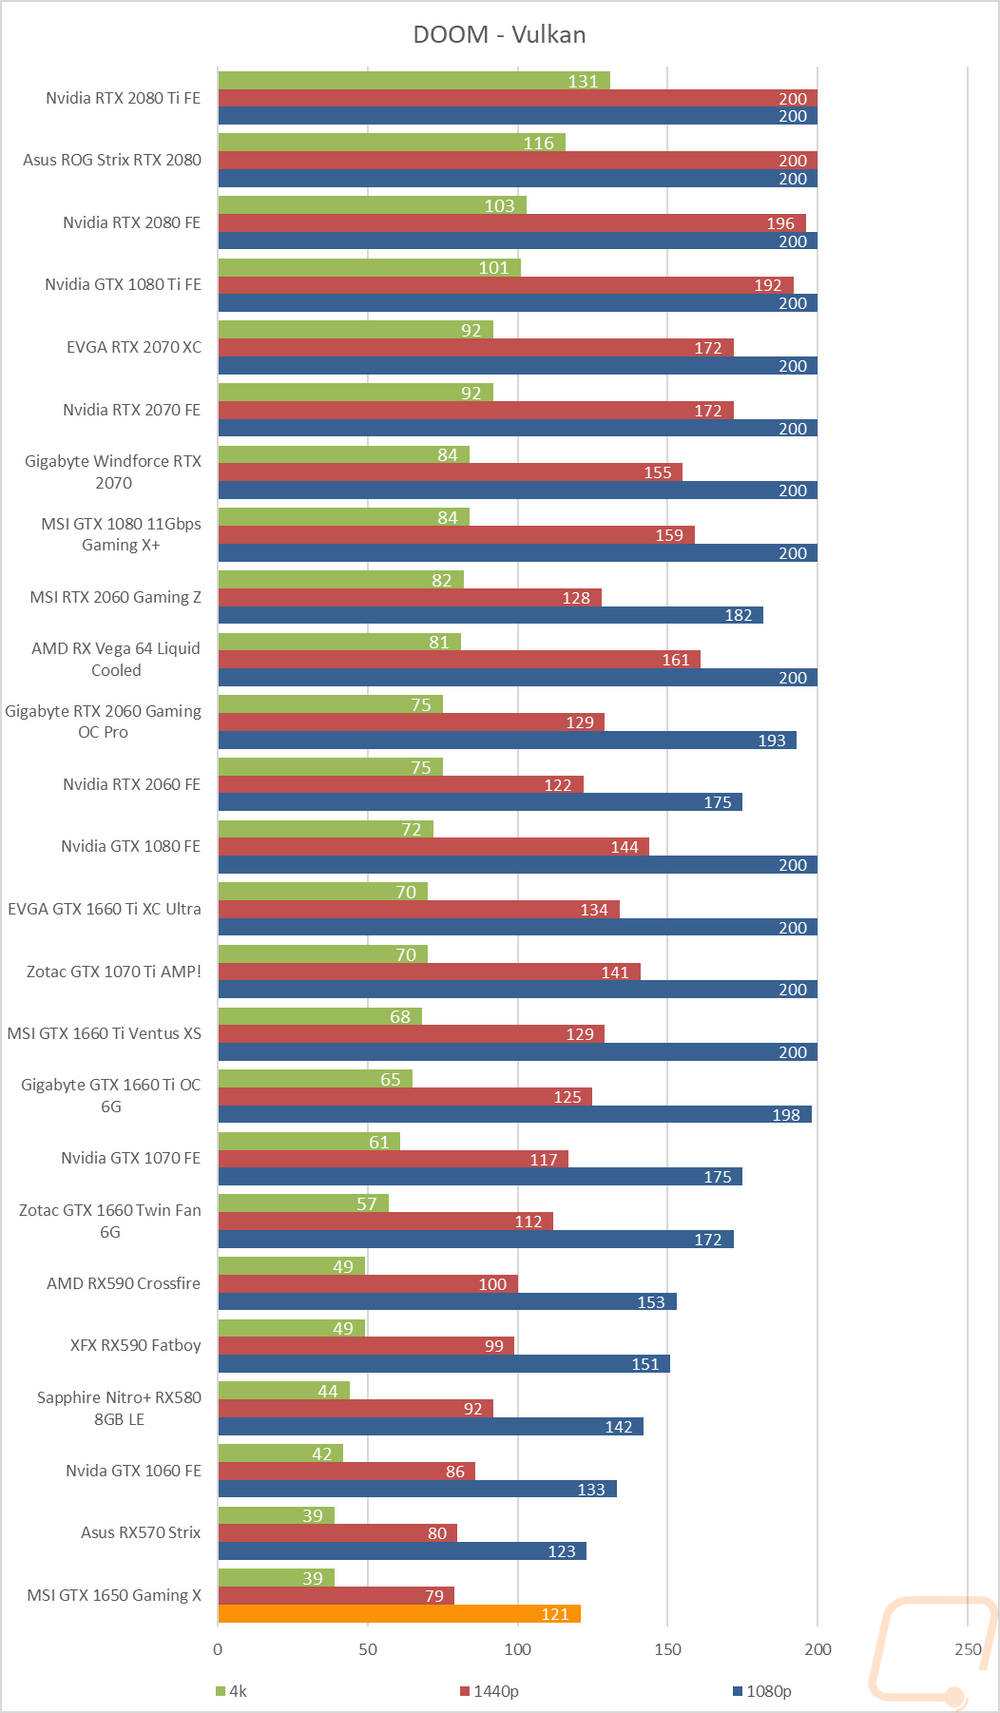
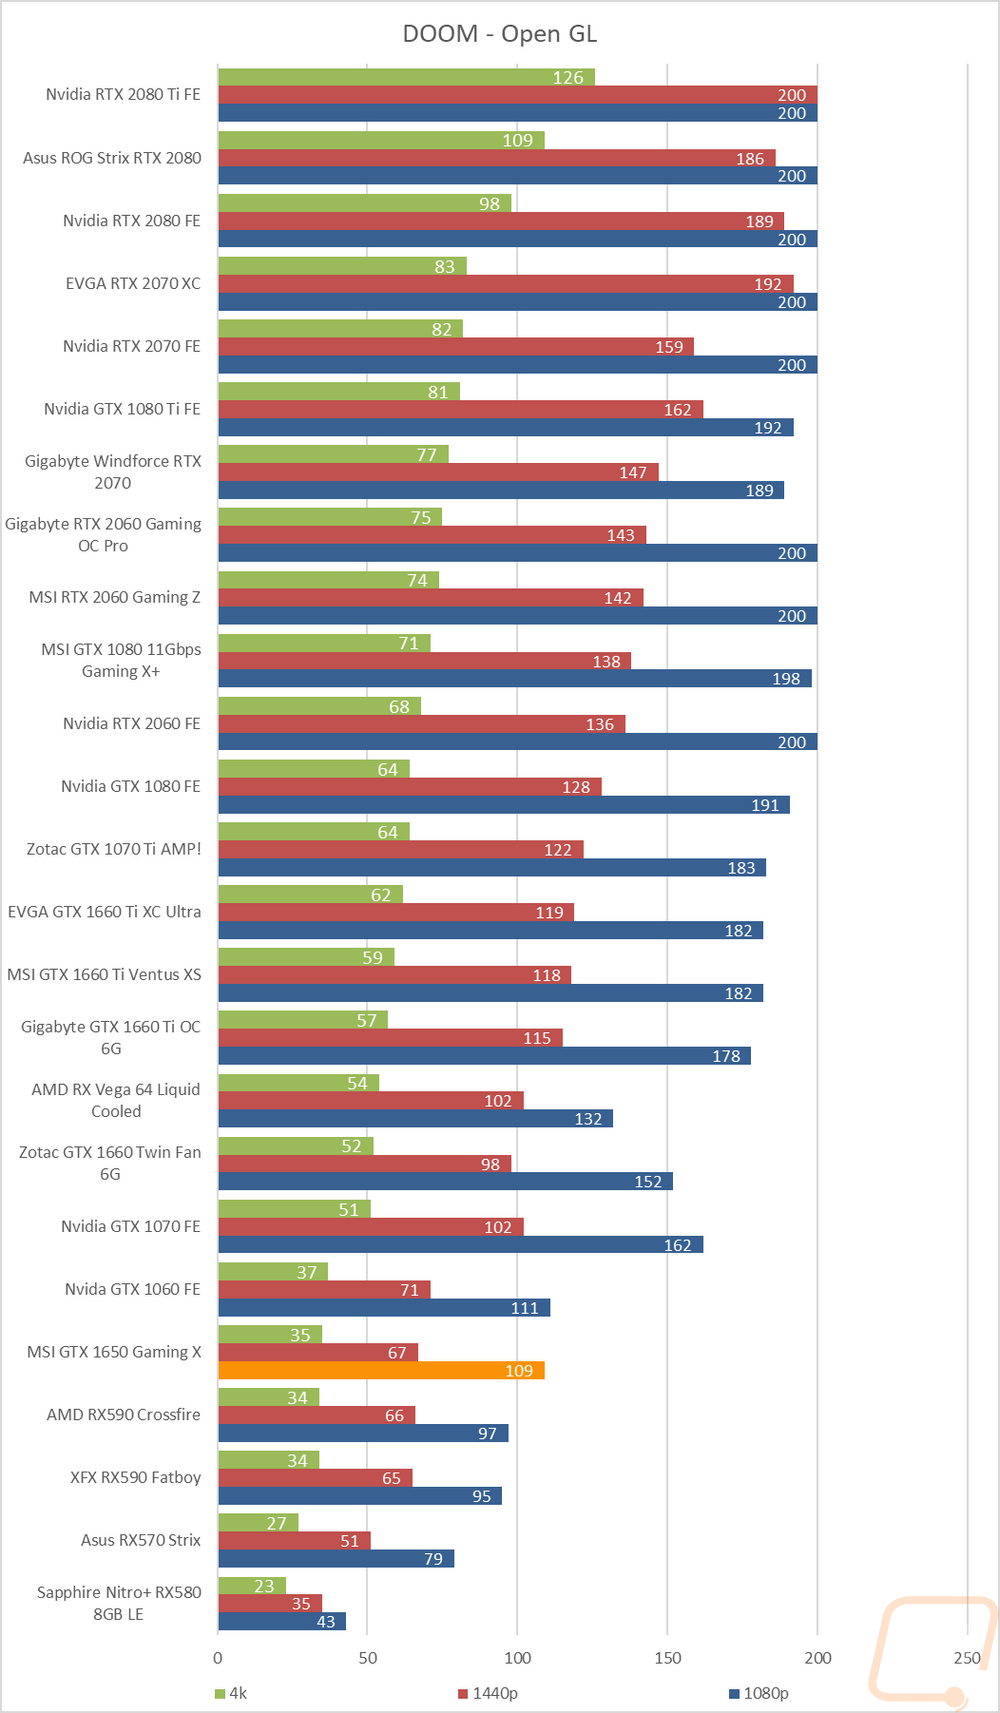
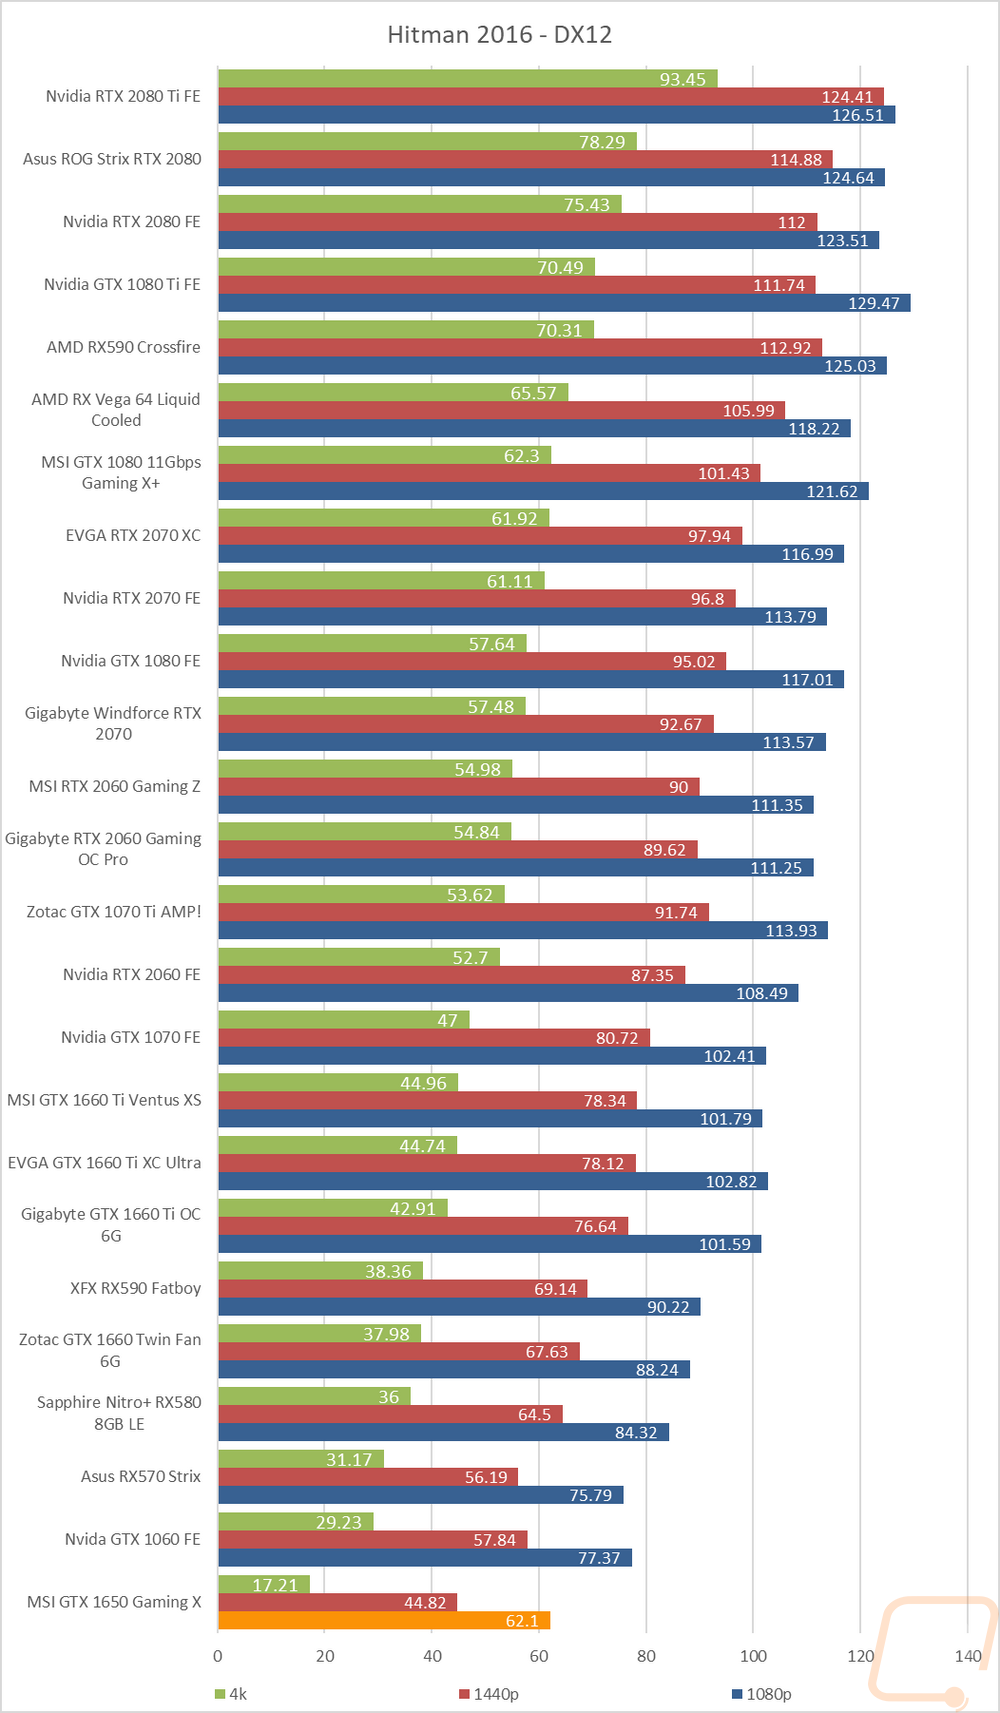
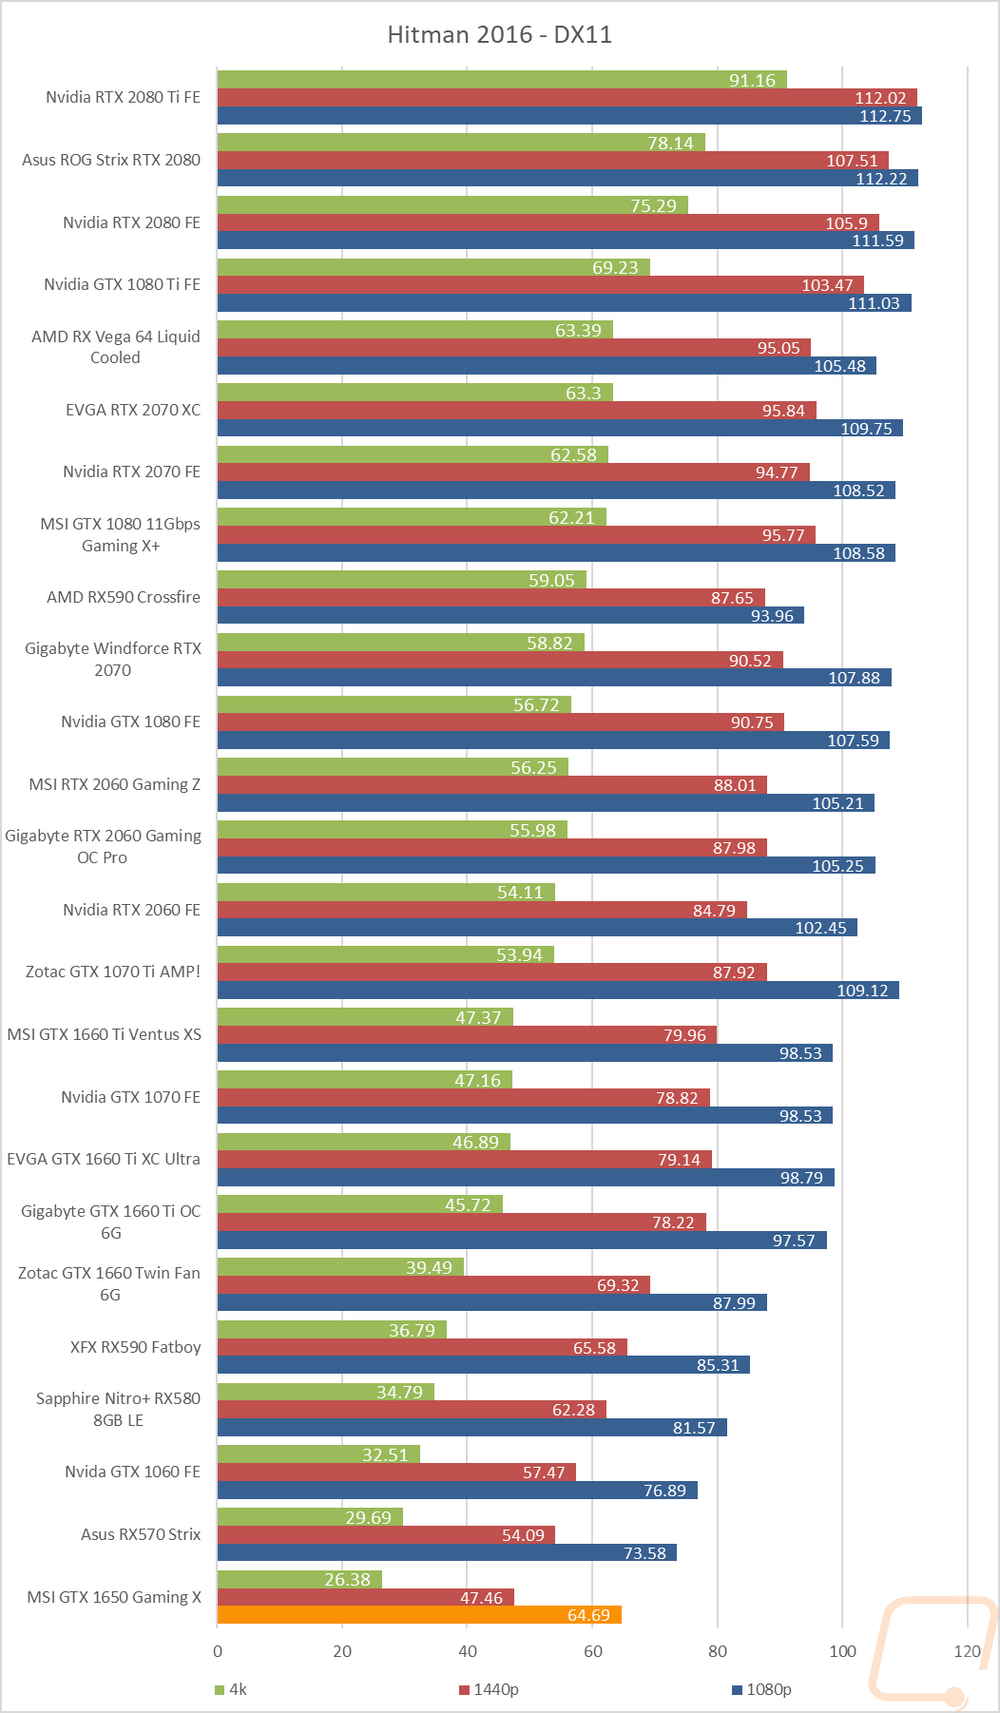
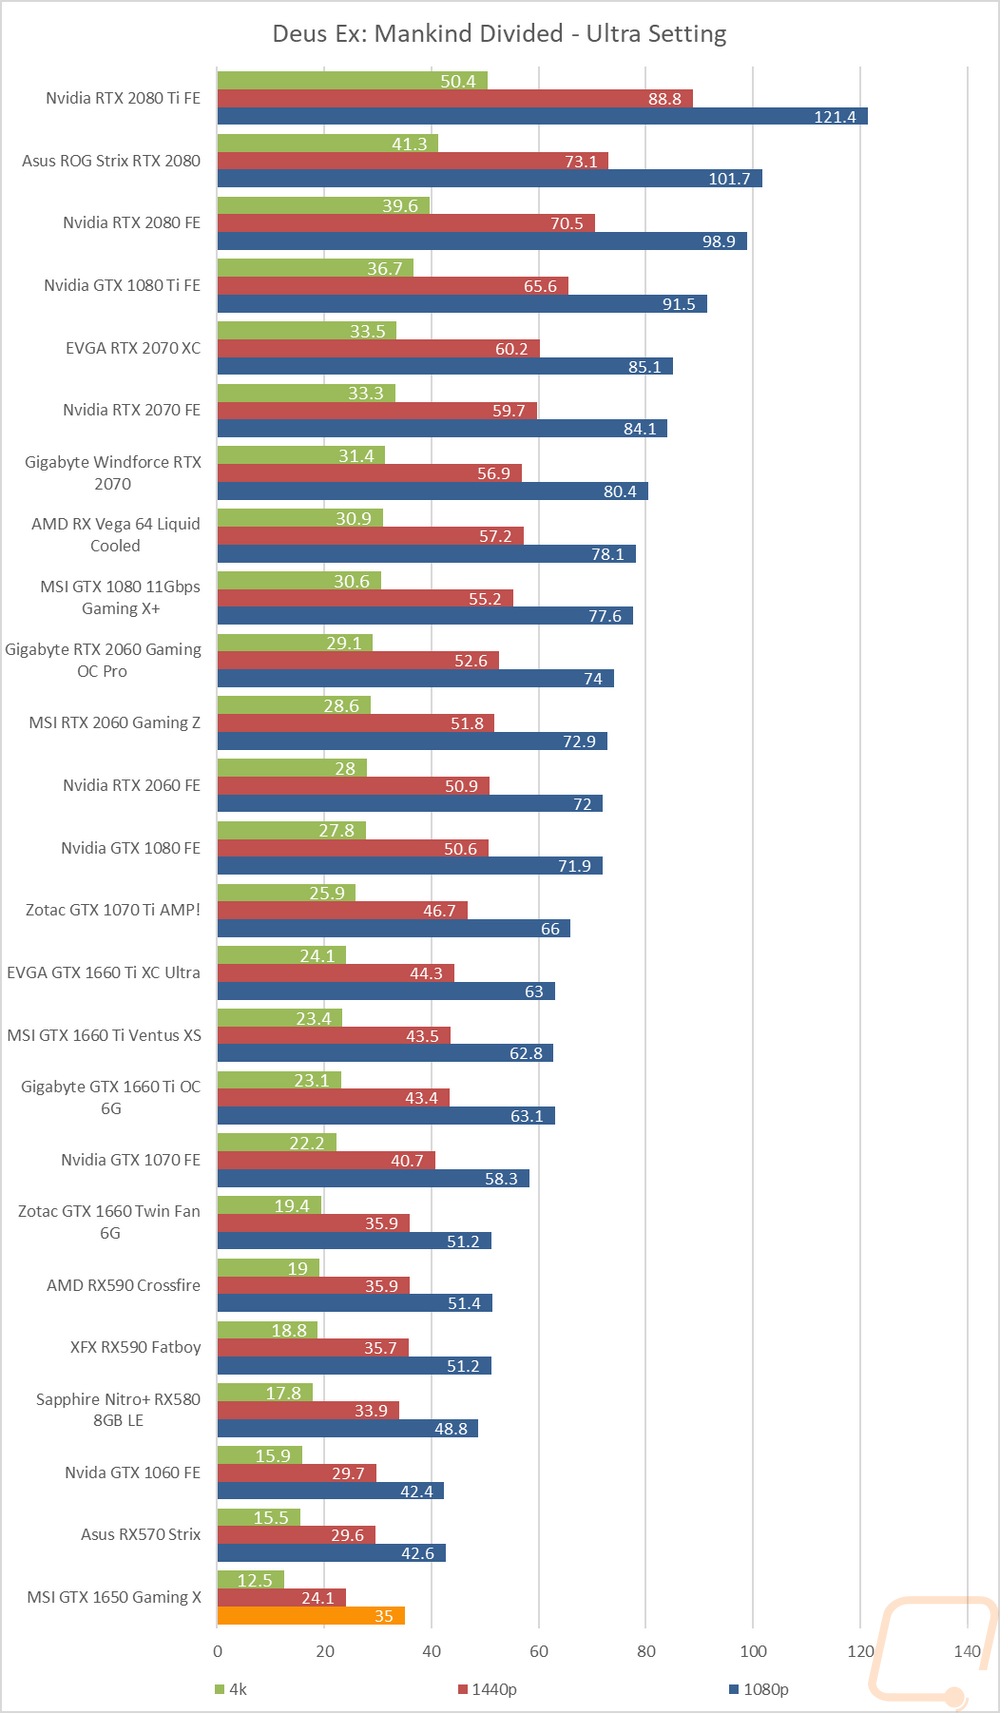
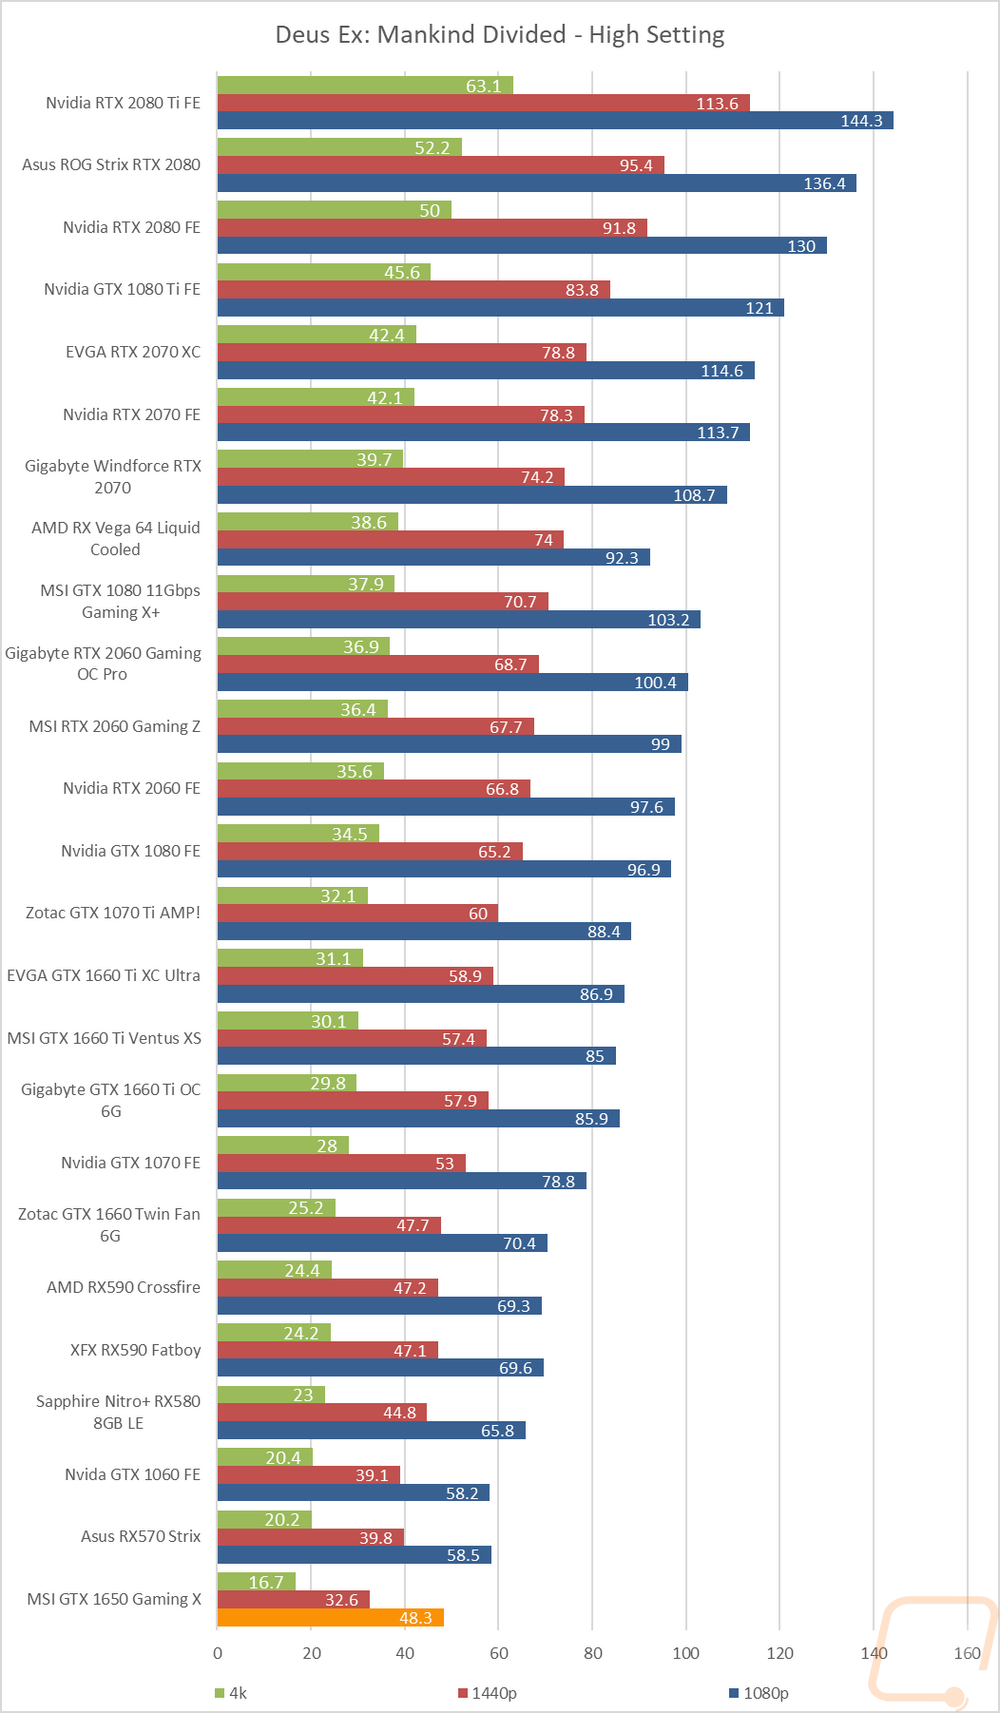
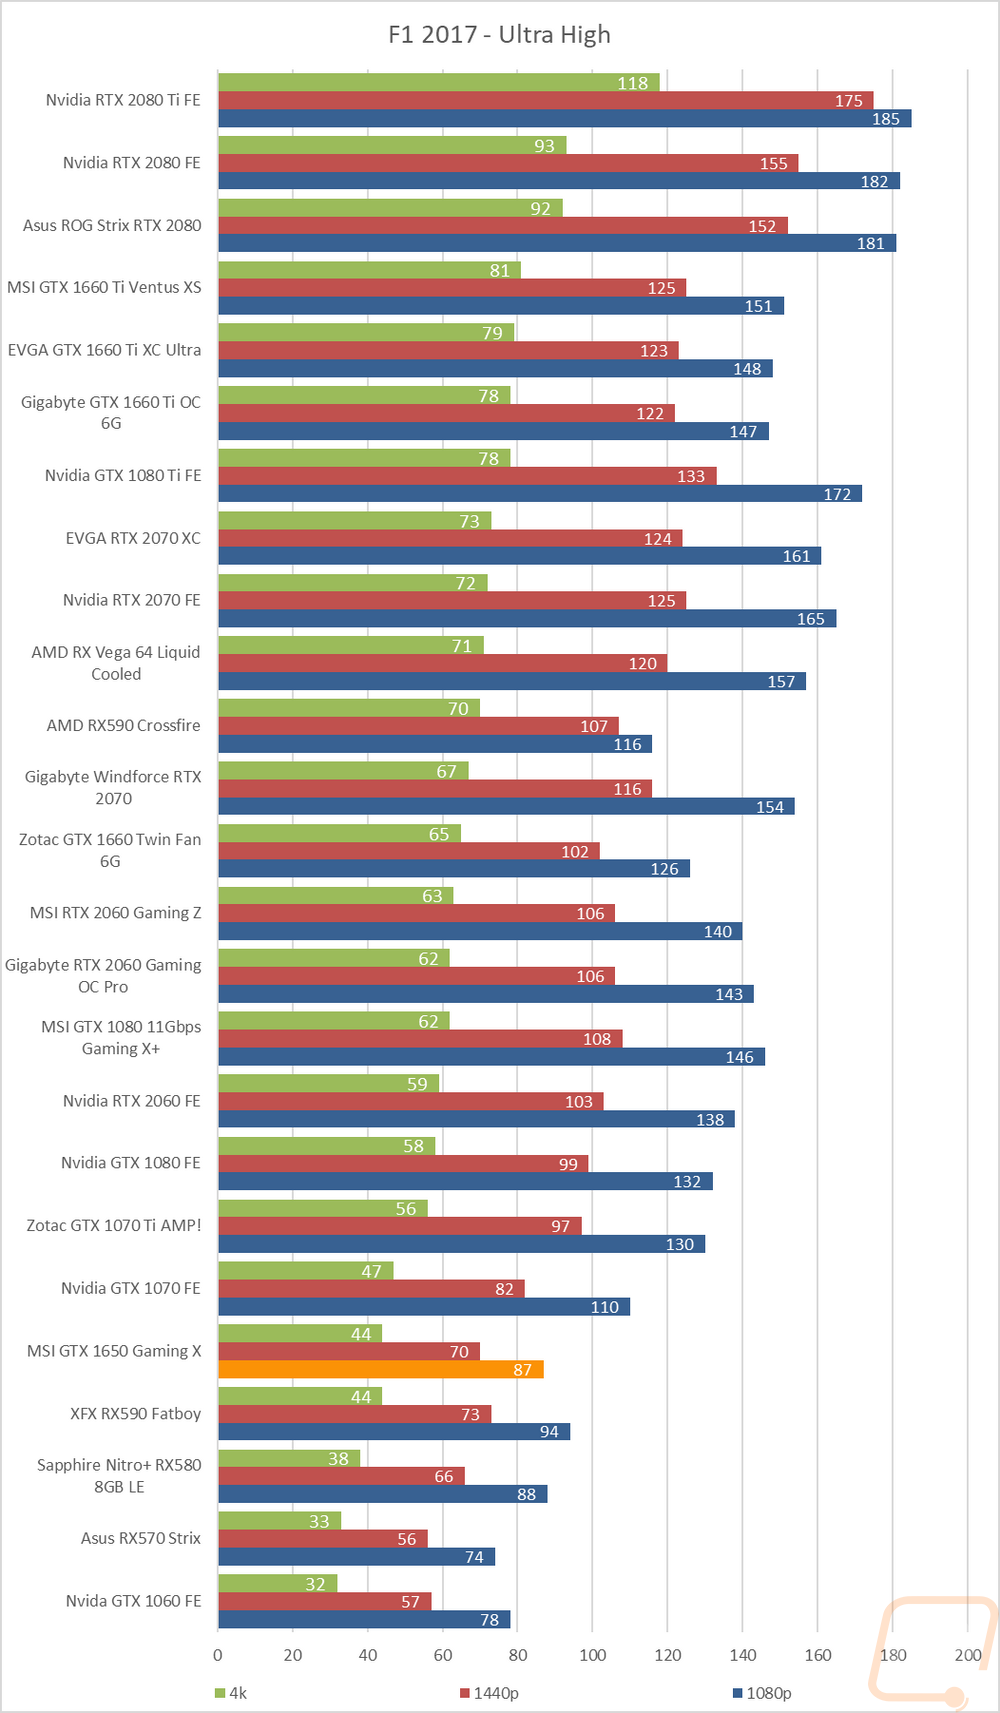
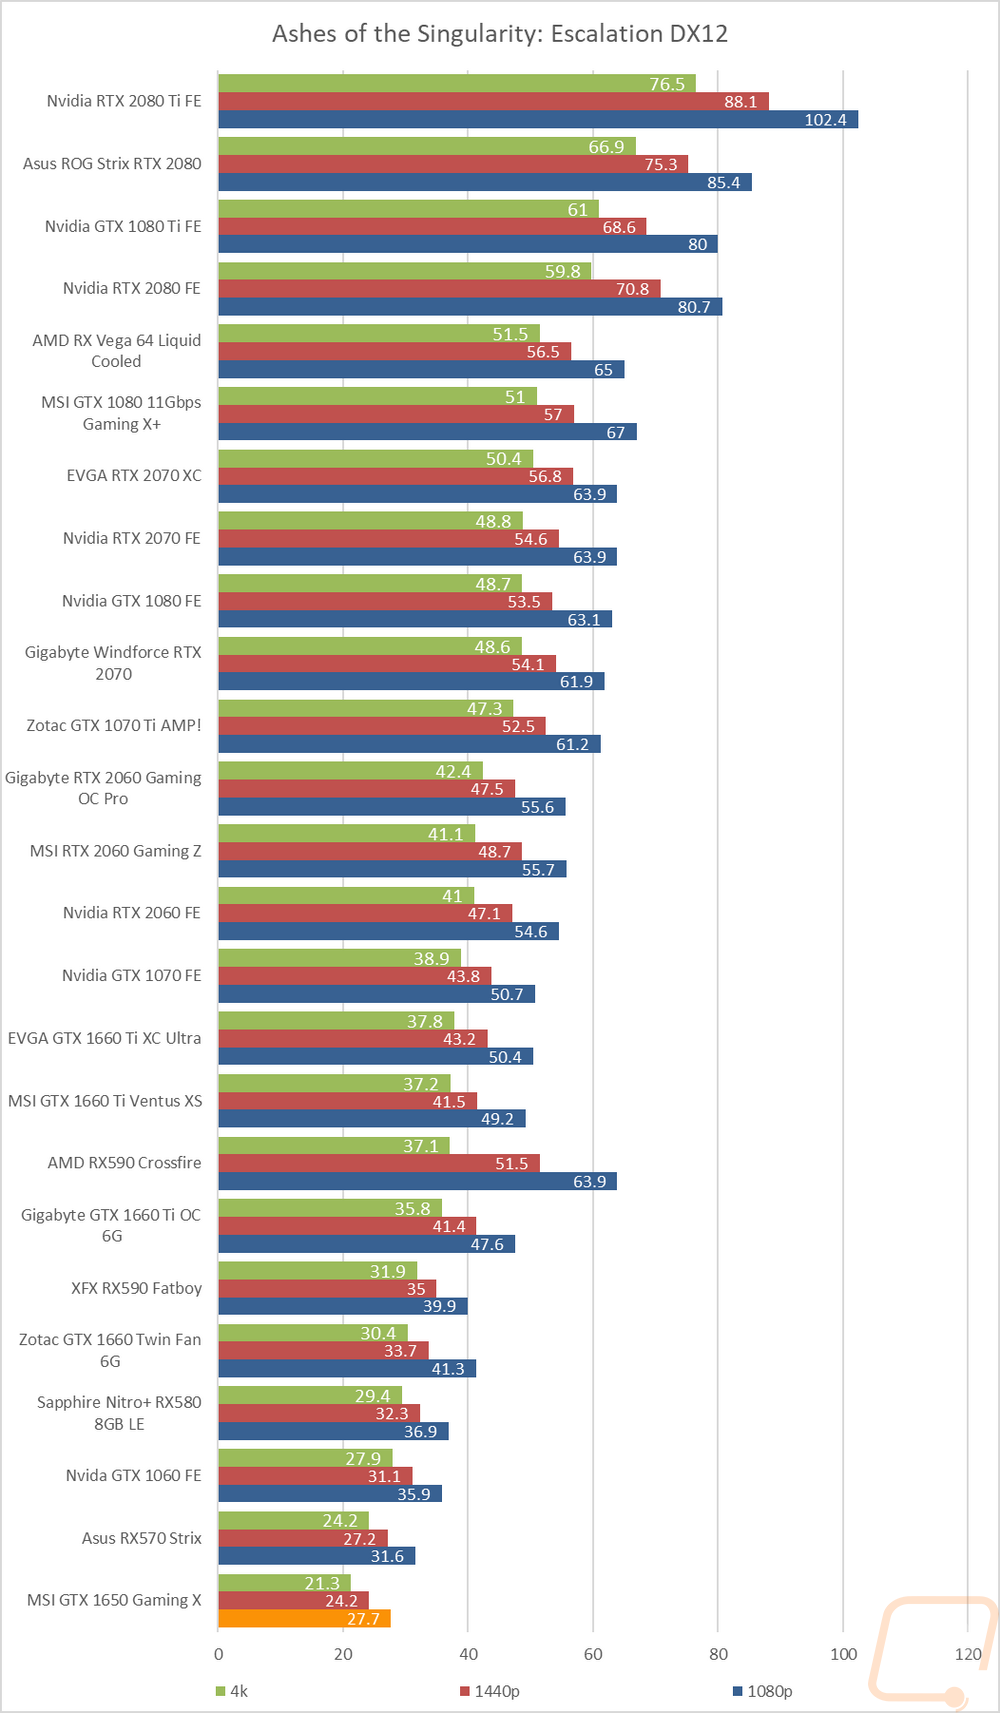
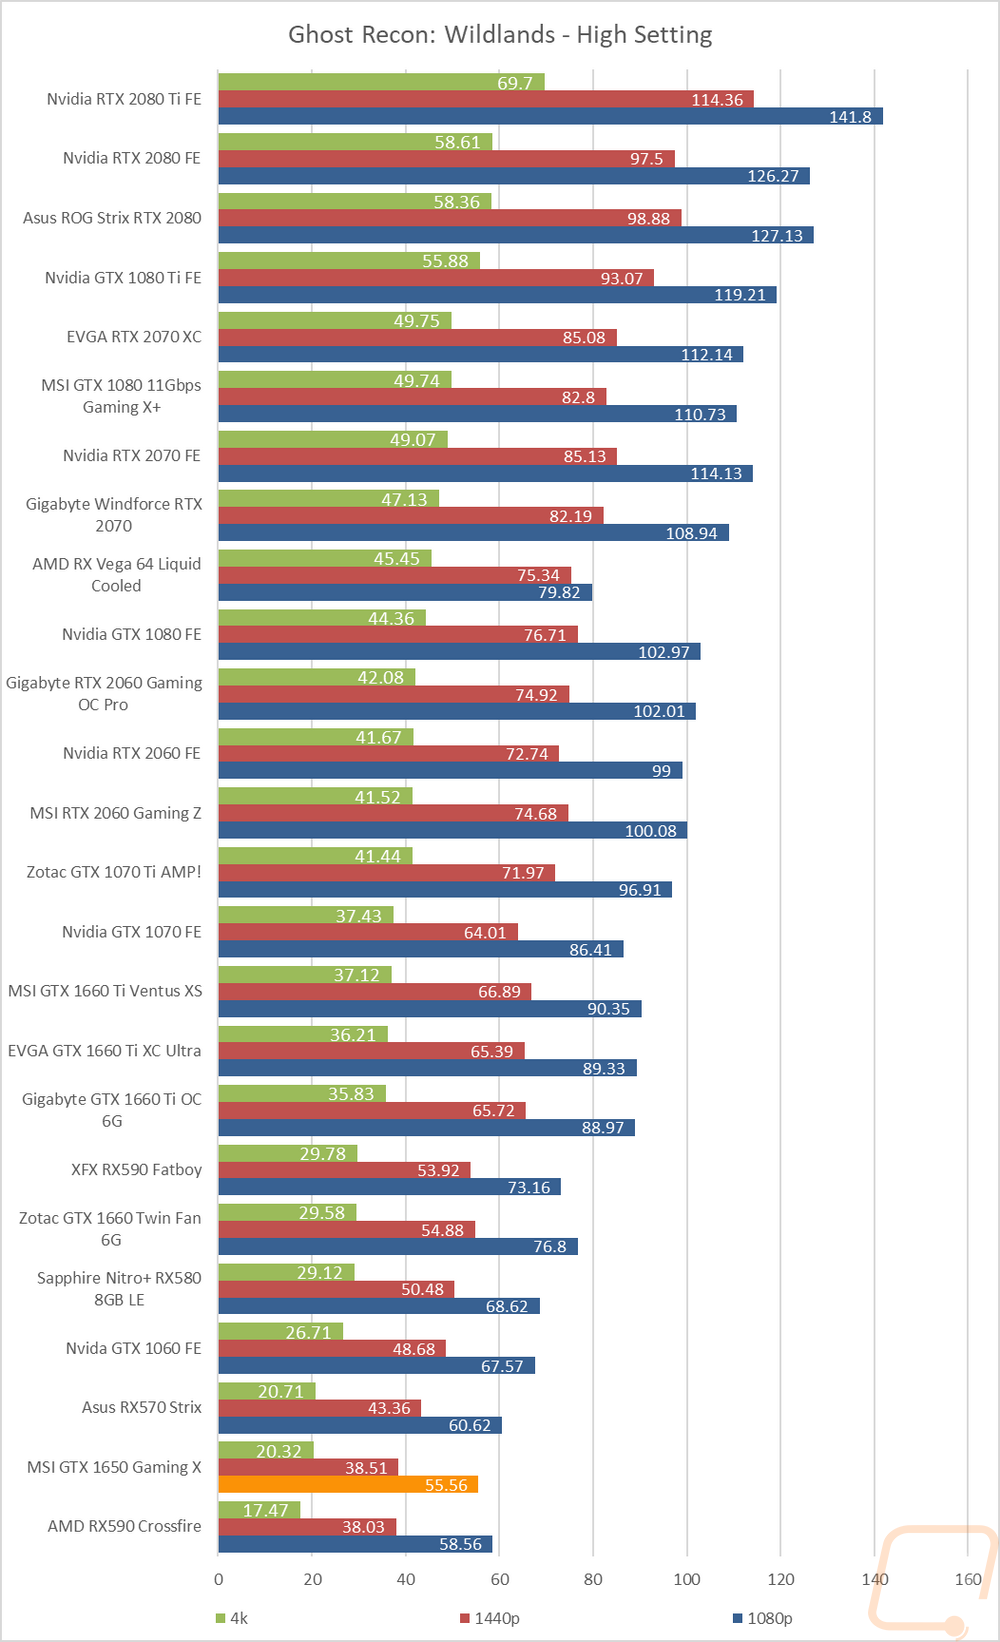
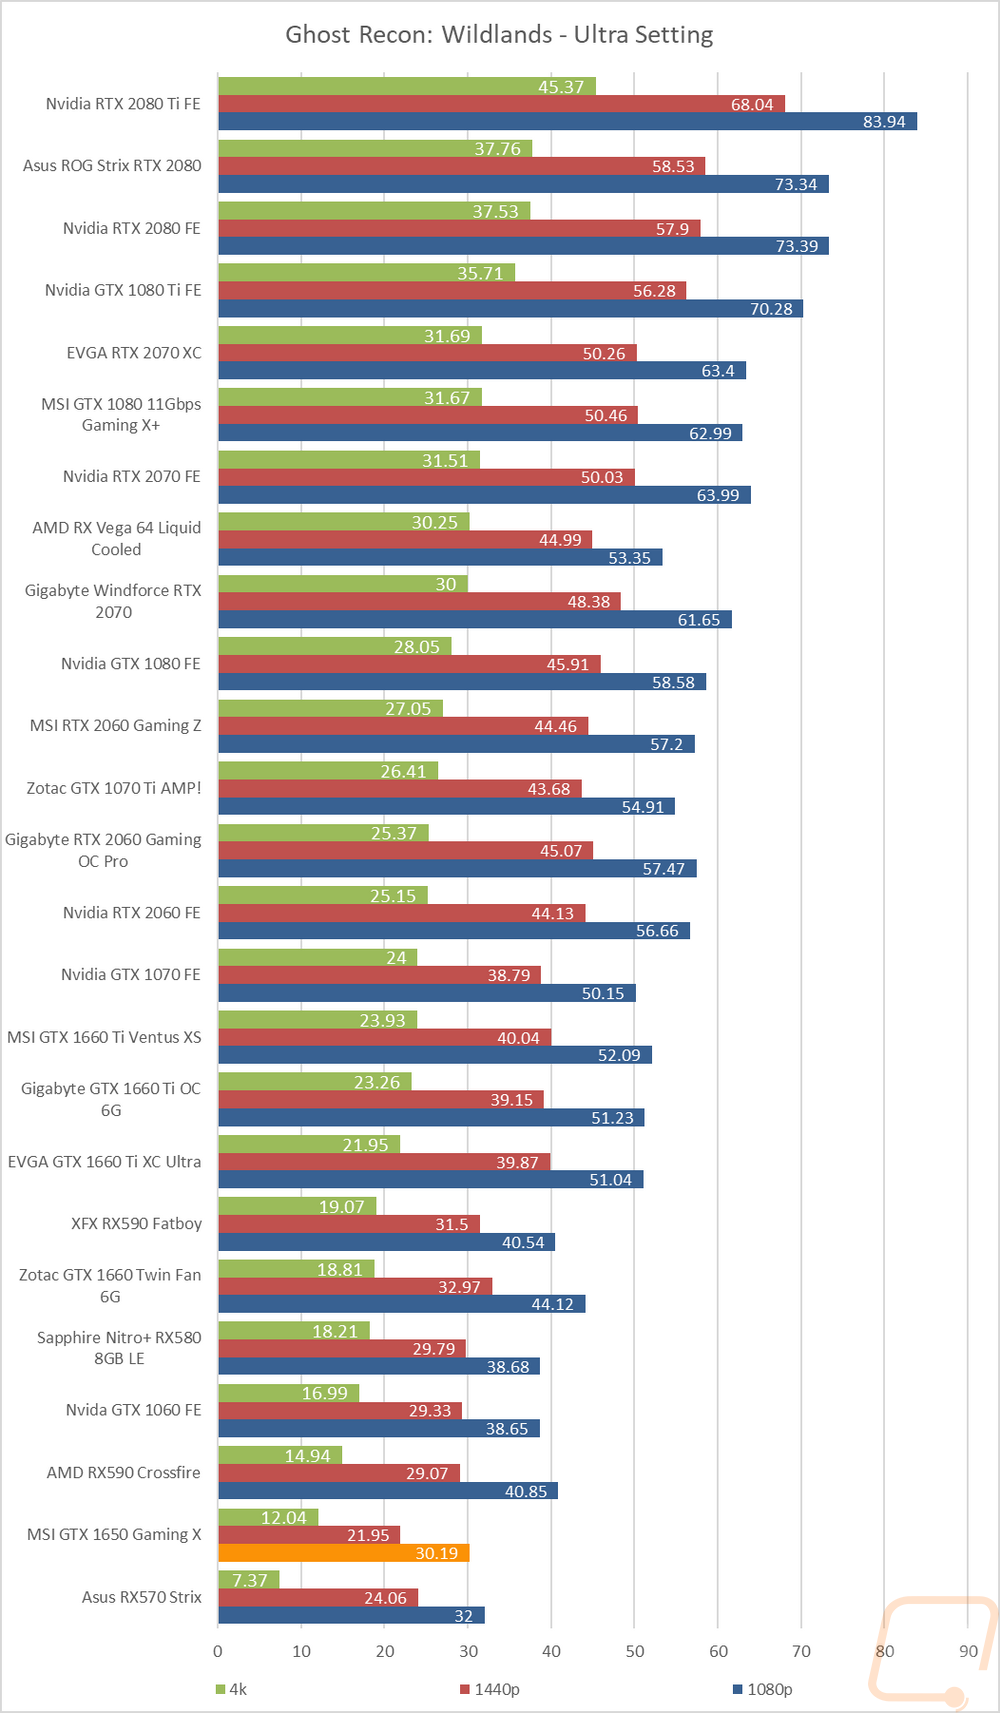
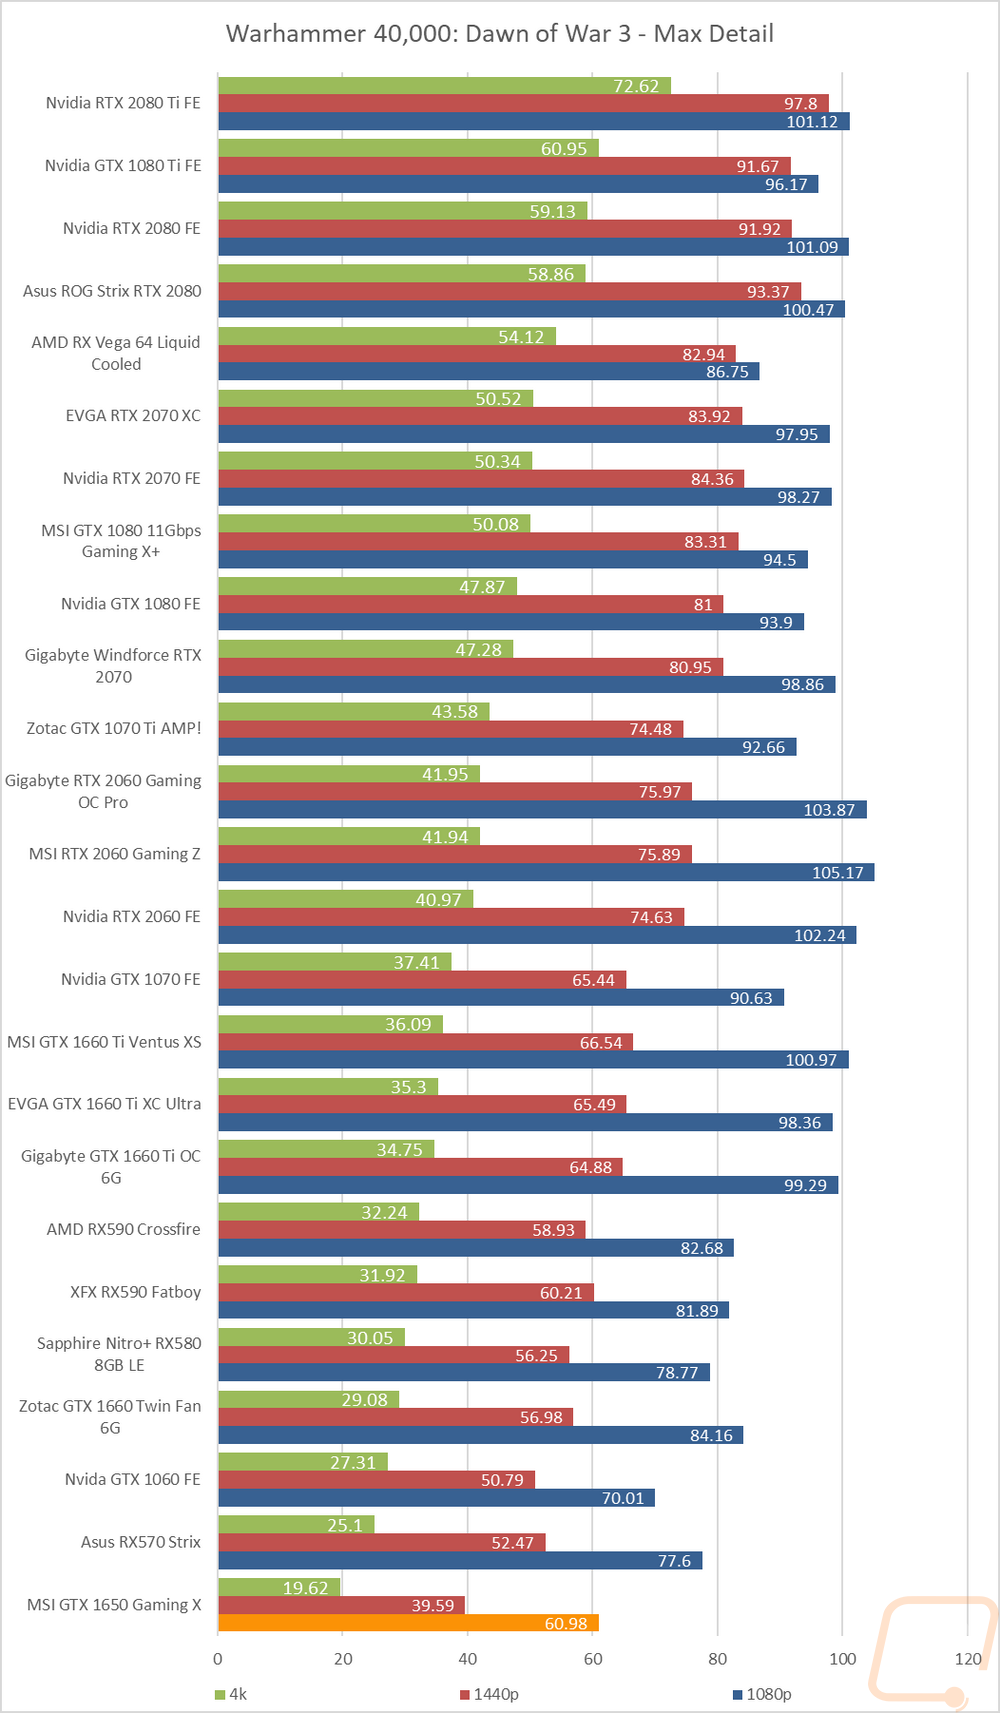
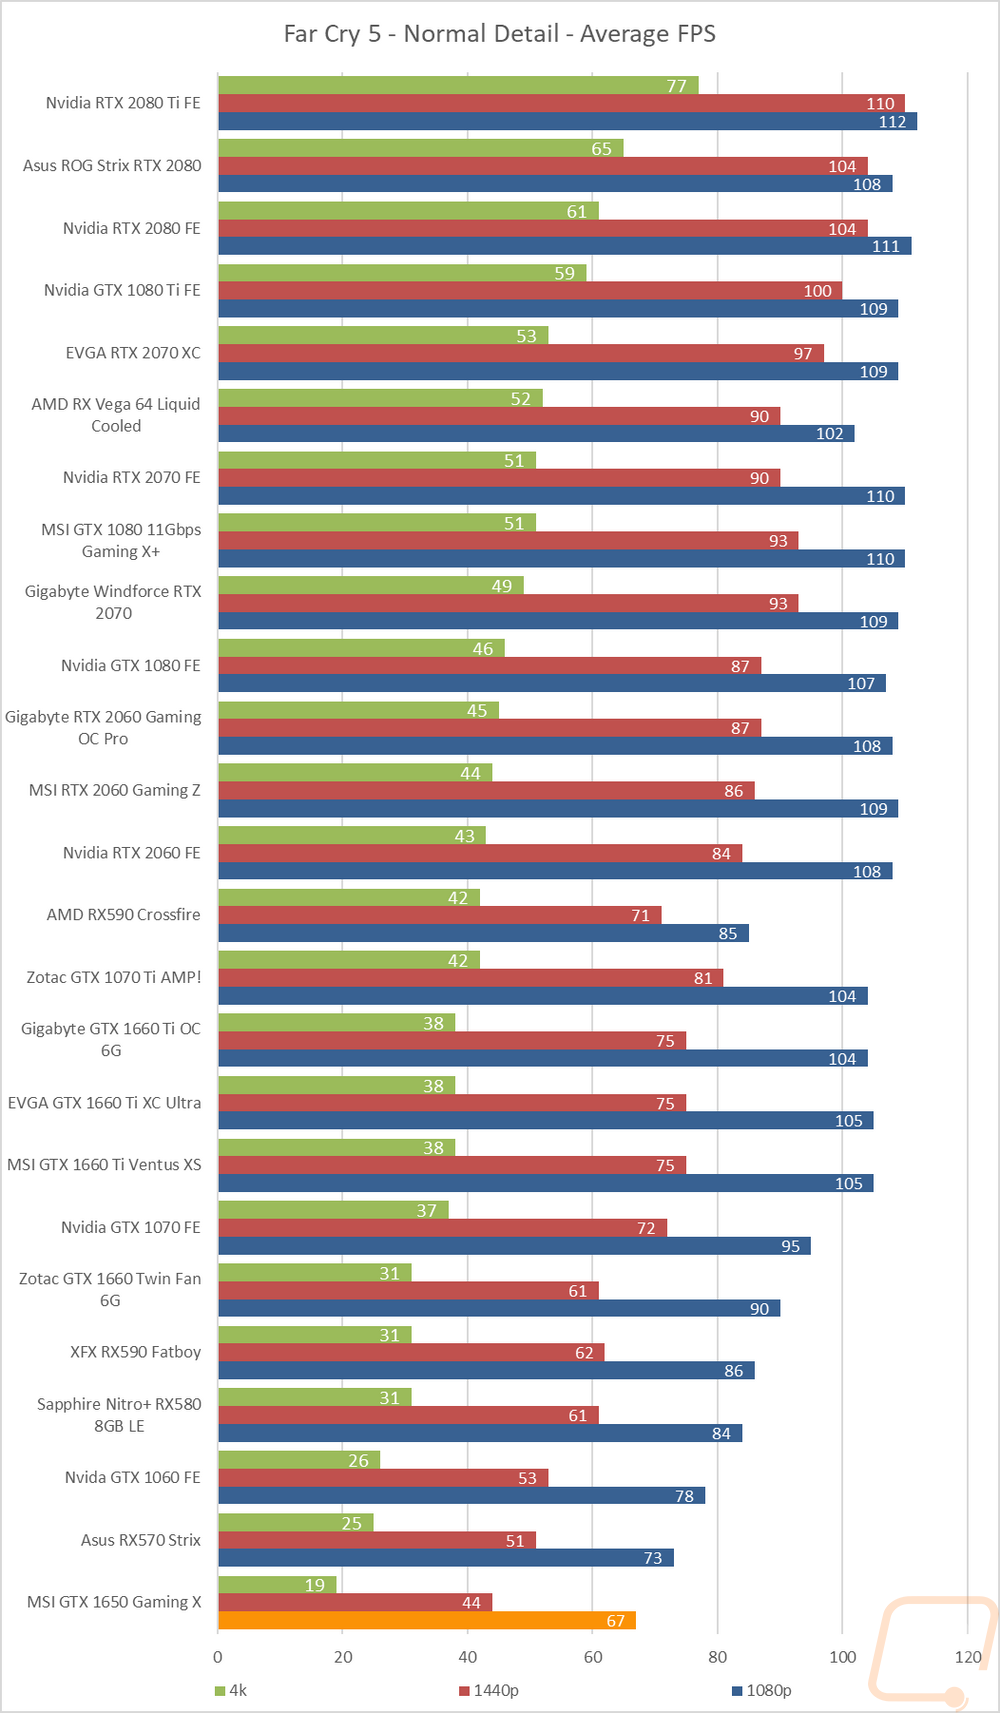
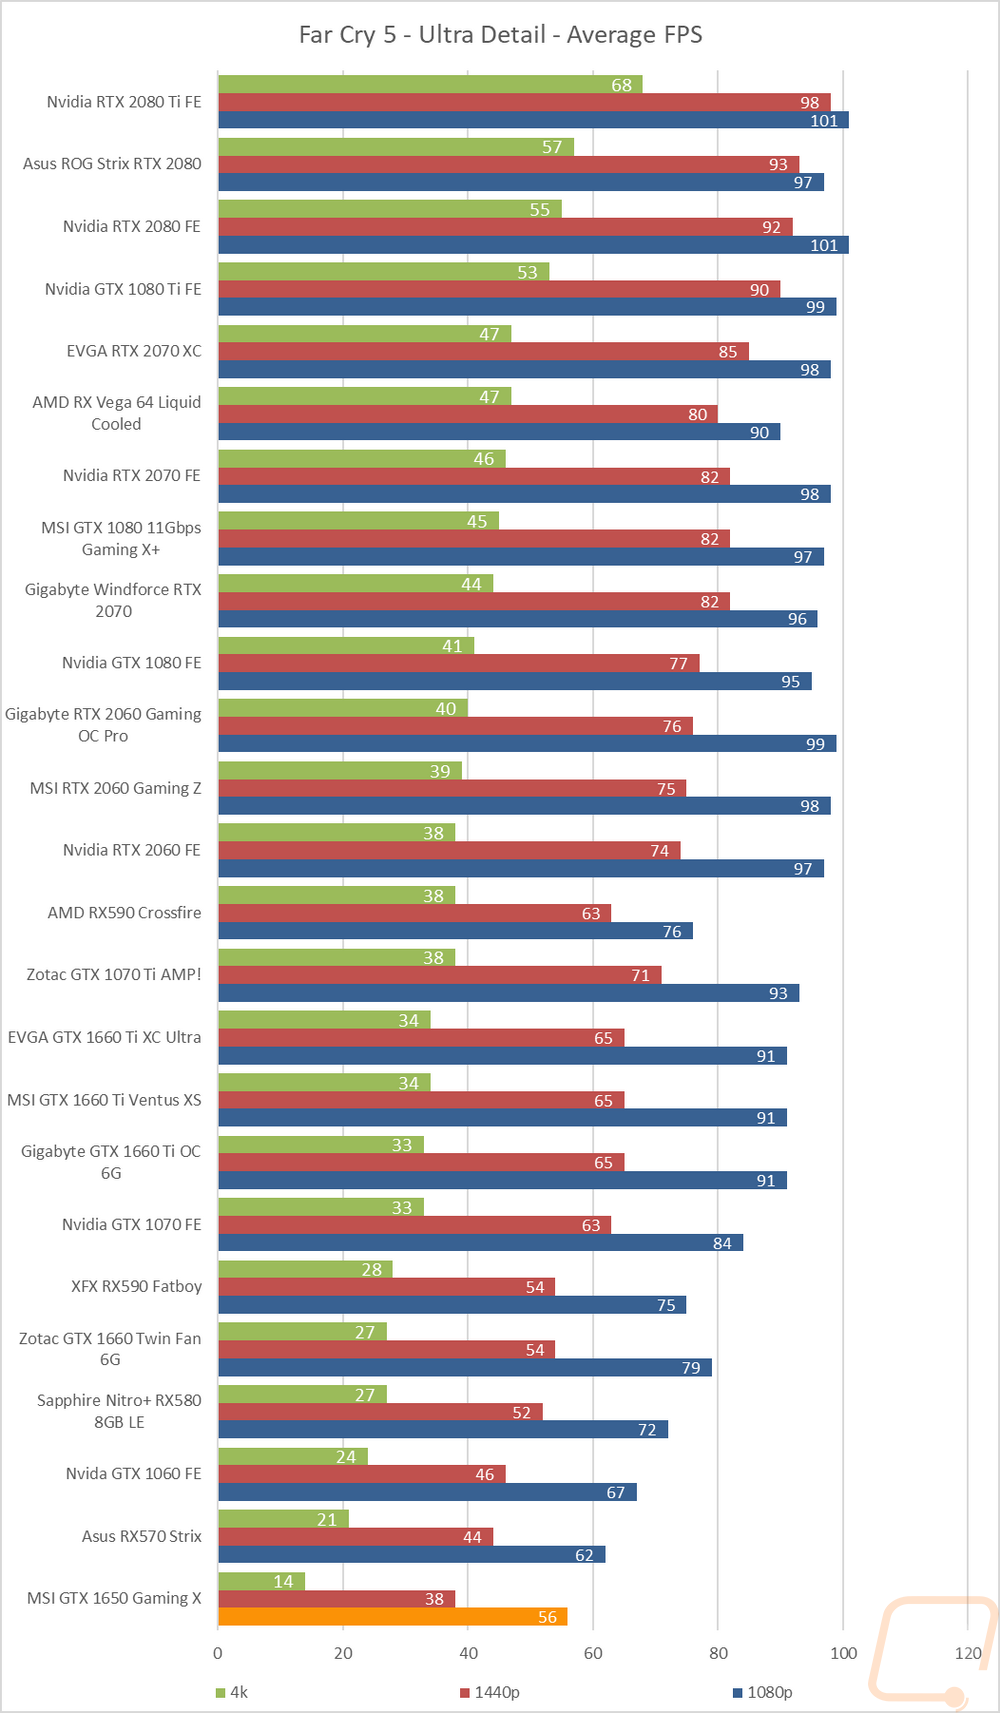
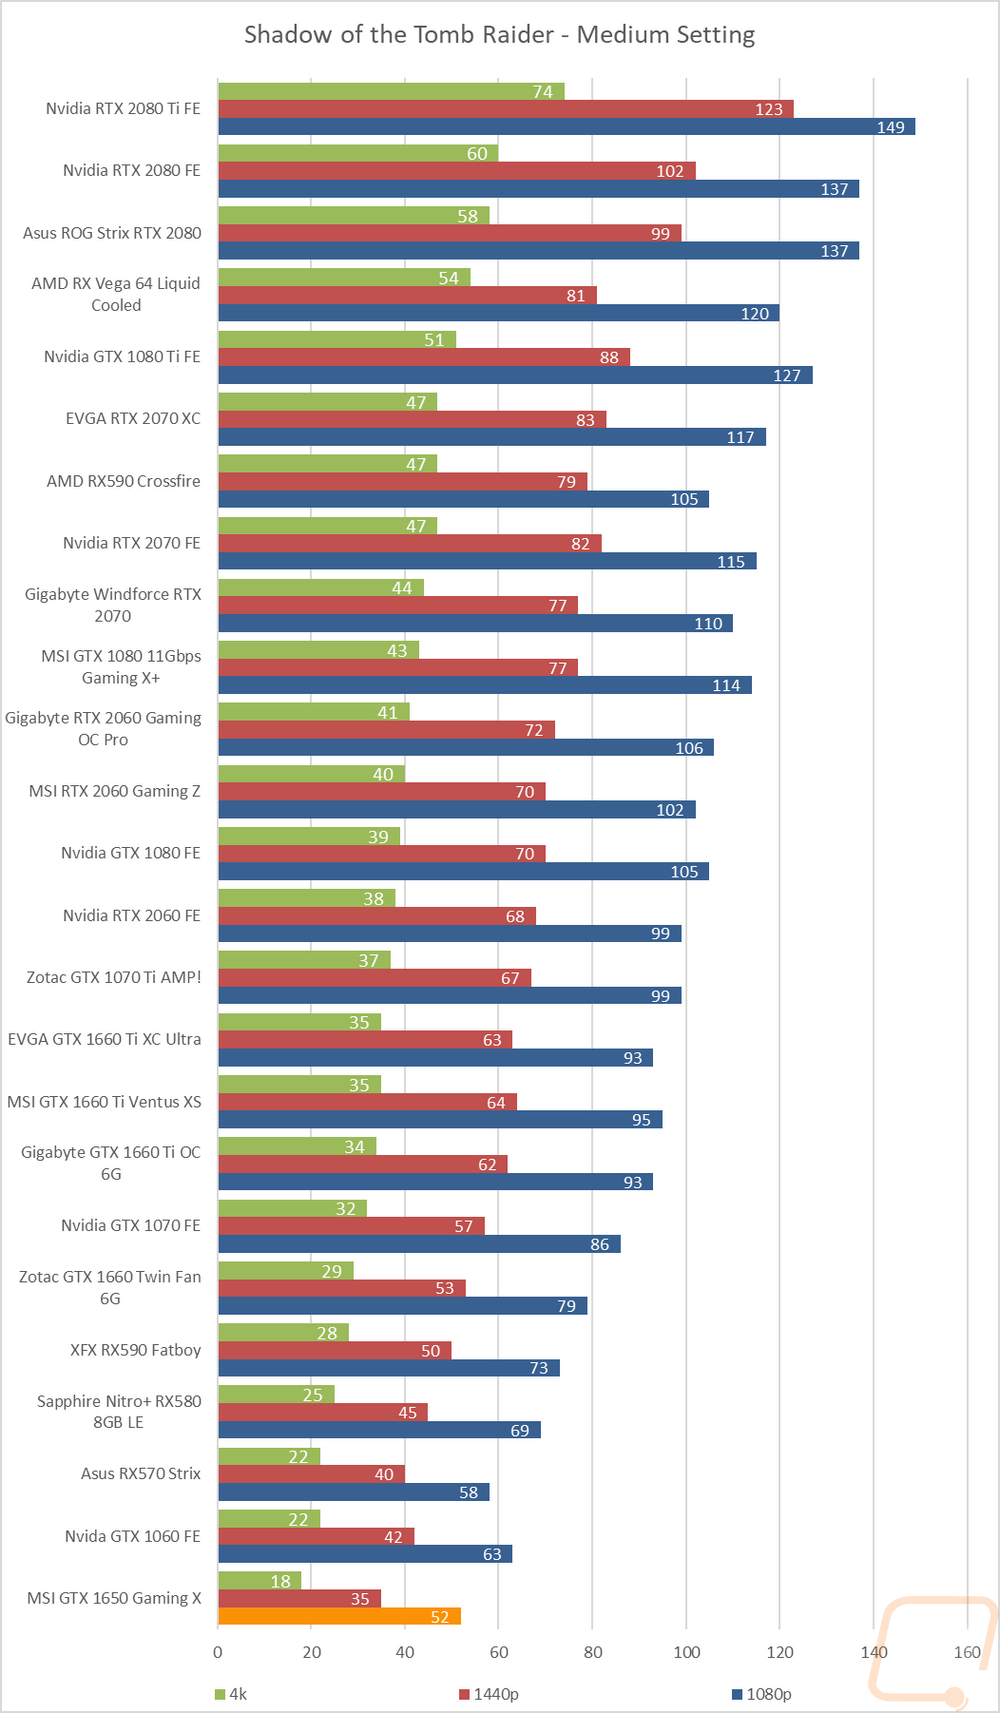
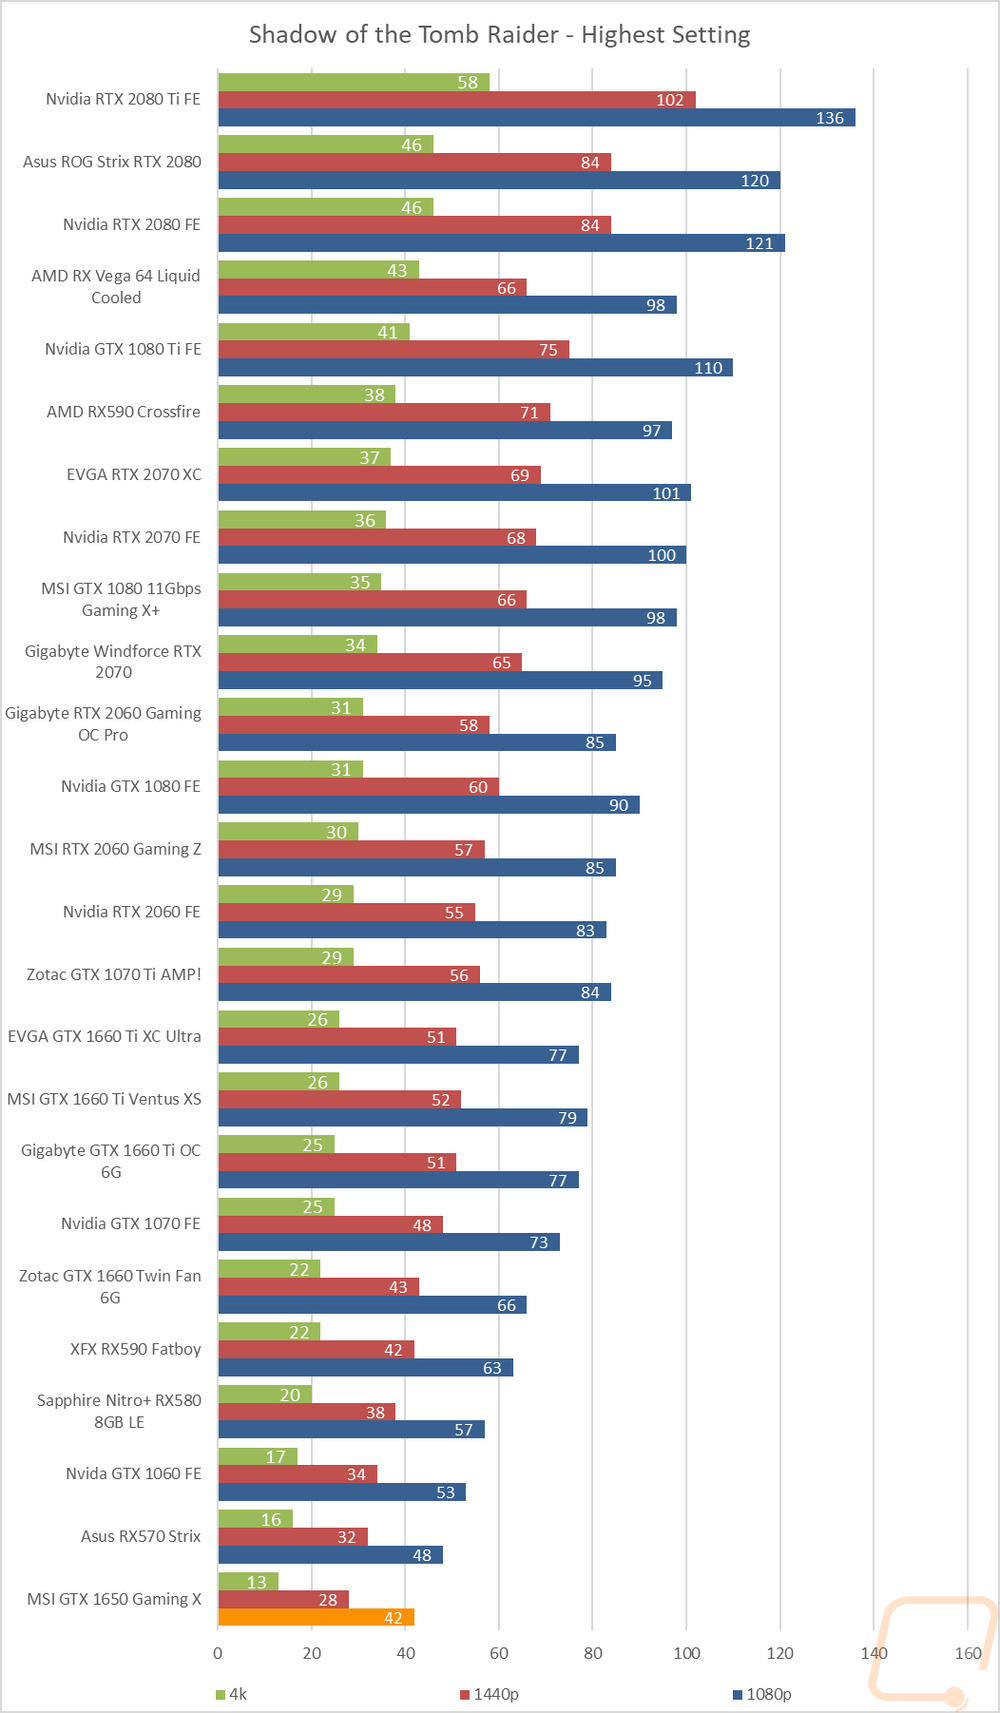
Of course, I have all of our actual results as well, but with so many cards tested across so many tests at three different resolutions, it is a LOT of data to take in. But assuming you are as crazy as I am it is all below. The Final Fantasy XV results are up on top because they aren’t included in the above graphs because they don’t include FPS results. The GTX 1650 was at the bottom of the charts there with the next card being the RX570. Overall the GTX 1650 didn’t perform that amazing with it being at the bottom of the charts in 13 of 17 of the tests. Of the four that it wasn’t on the bottom Doom with Open GL was one, but using Vulkan the AMD cards catch back up. Wildlands and F1 2017 were the other games that the GTX 1650 pulled ahead on. Looking at the RX570 and the GTX 1650 directly through all of the games at 1080p which is really the only resolution that you should be gaming at with either card here is the breakdown.
RX570 64 FPS
GTX 1650 60.5 FPS
Not to bad of a difference when averaged out honestly. The large gaps in DOOM with Open GL (30 FPS) and F1 2017 (13 FPS) swayed the average. A 60 FPS average at 1080p isn’t bad at all, but the RX570 being faster does raise some obvious concerns that we will talk more about at the end of the review.