Synthetic Benchmarks
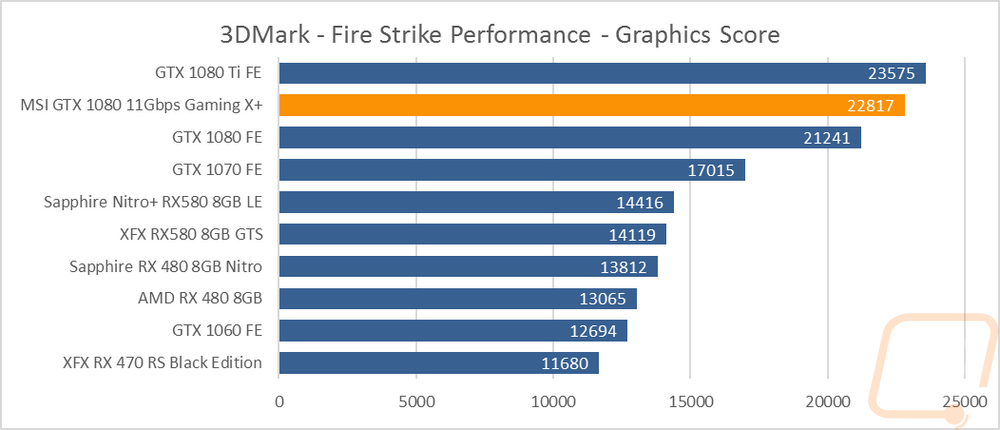
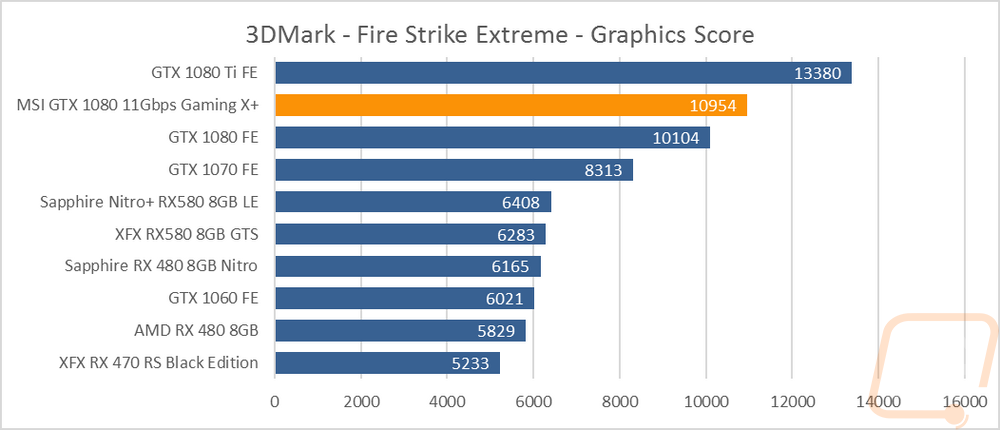
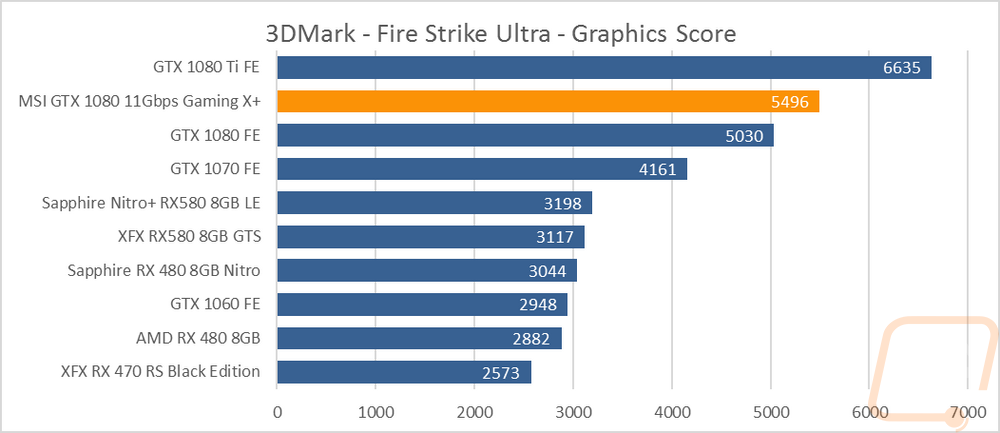
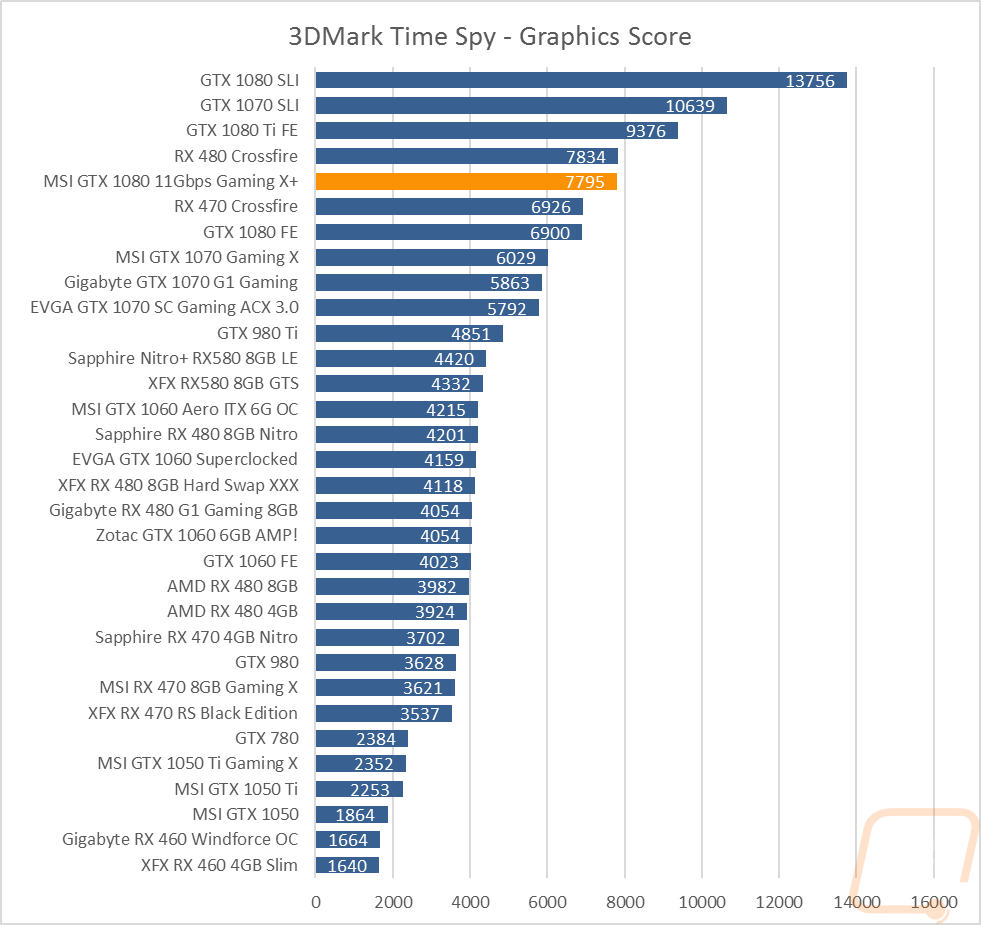
To start off my performance testing I ran through a few synthetic benchmarks. While they don’t give us a direct answer to how good the 1080 Gaming X+ will perform in game. They do offer a consistent way to compare performance between cards and this is a perfect chance to check out how this card compares to both the GTX 1080 Founders Edition and the GTX 1080 Ti Founders Edition that were both also tested. So to start things off I tested using 3DMark. I tested using the Fire Strike benchmark for DX11 performance and Time Spy for DX12 and in Fire Strike, I also tested across 1080p, 1440p, and 4k resolutions. In Fire Strike in the performance setting (1080p) I was extremely surprised at how the Gaming X+ actually came in closer to the Ti than the original GTX 1080. In the two other settings though the TI pulled ahead by a big margin. In Time Spy where we have some of our legacy SLI and Crossfire results in the mix as well, it gets more interesting. The Gaming X+ came in well ahead of the 1080 FE and on par with the RX480’s in crossfire.
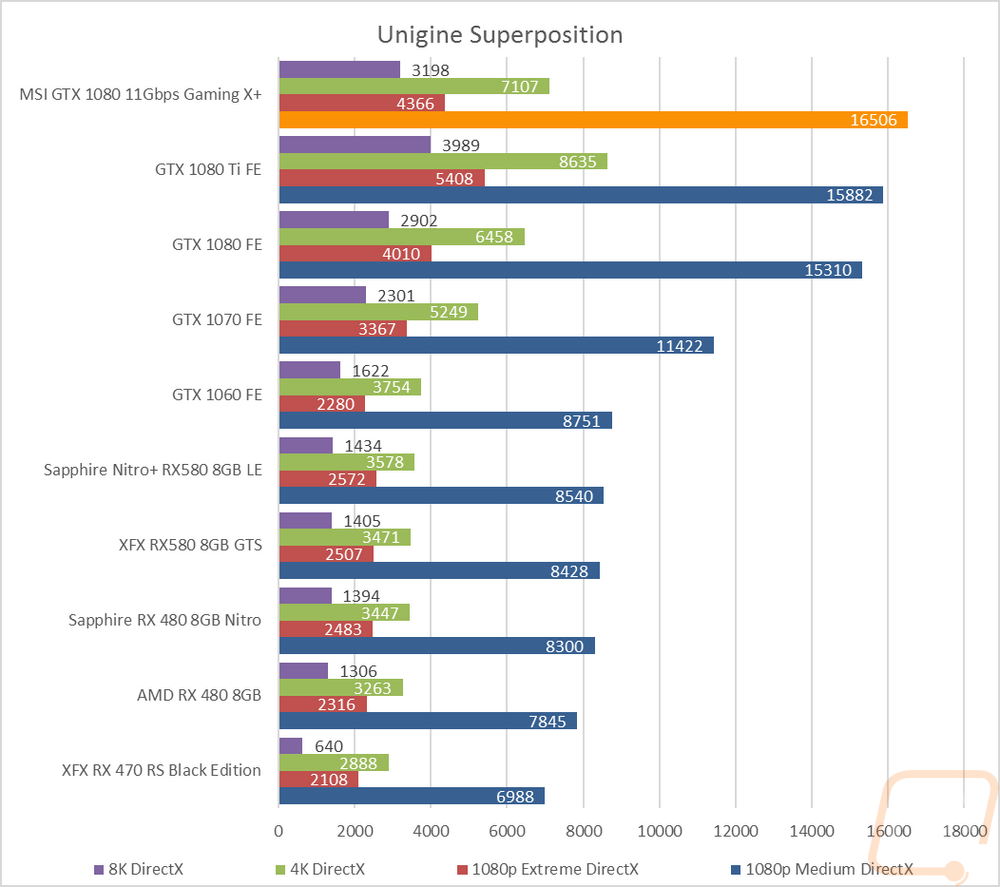
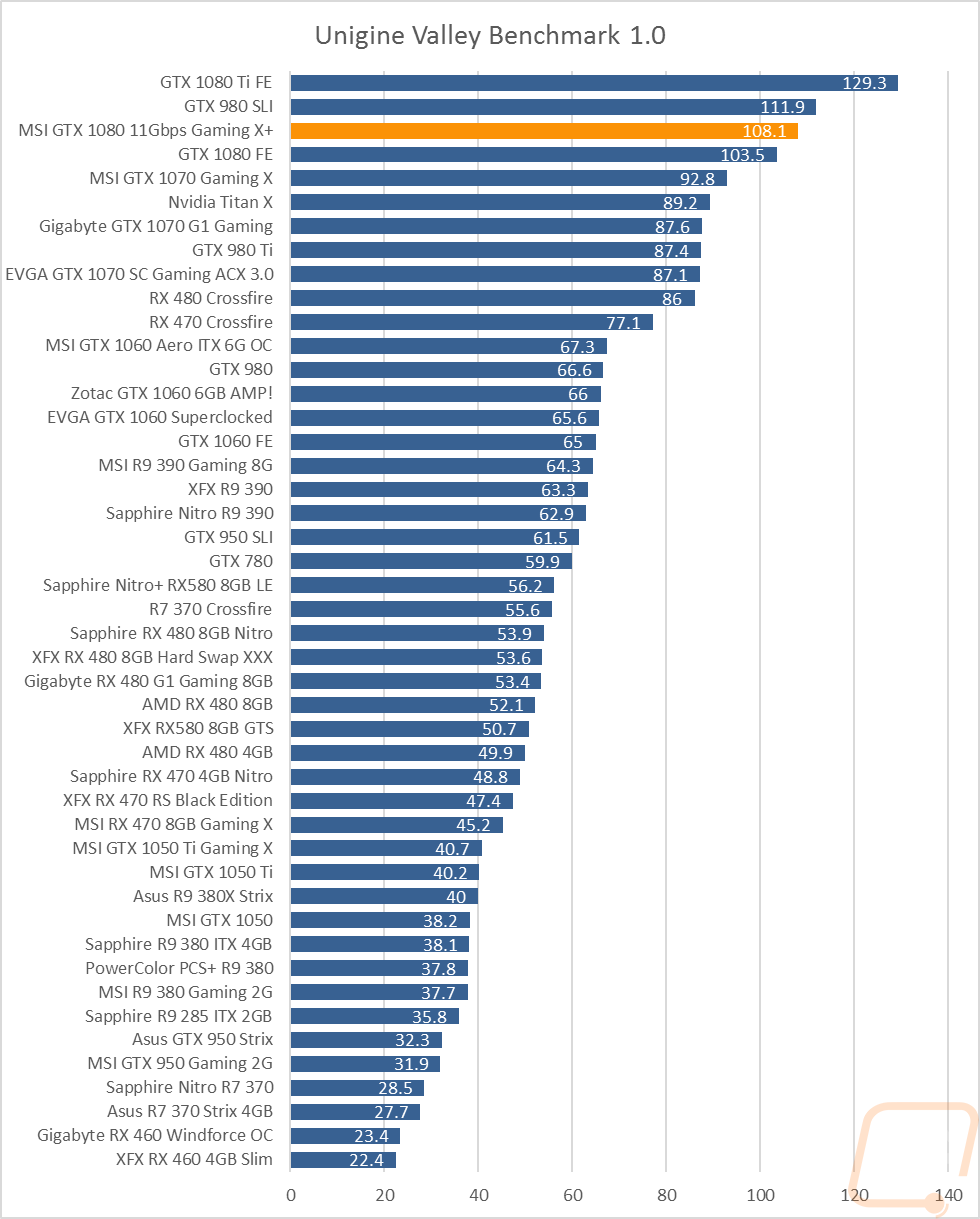
Moving on to the Unigine benchmarks the Gaming X+ came in about where you would expect it in the Valley Benchmark but in the new Superposition the 1080p medium setting results actually had it at the top of the charts. Of course, if you look at all of the other results you will see the TI outperformed in the rest but nonetheless impressive numbers.
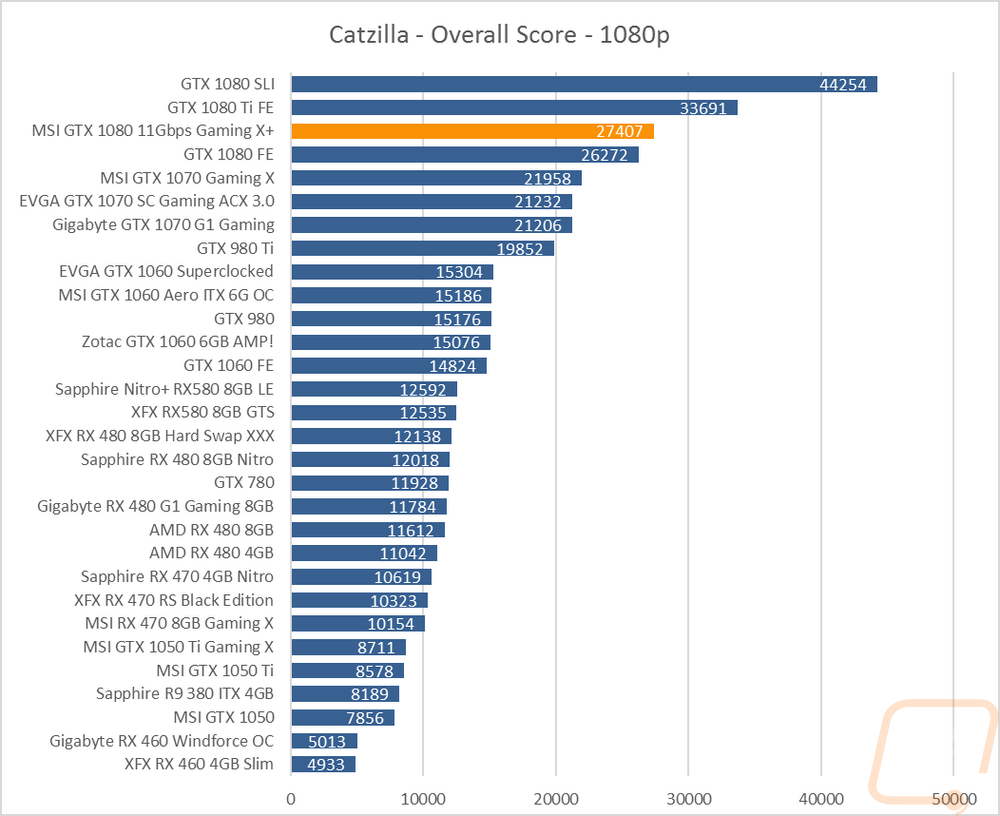
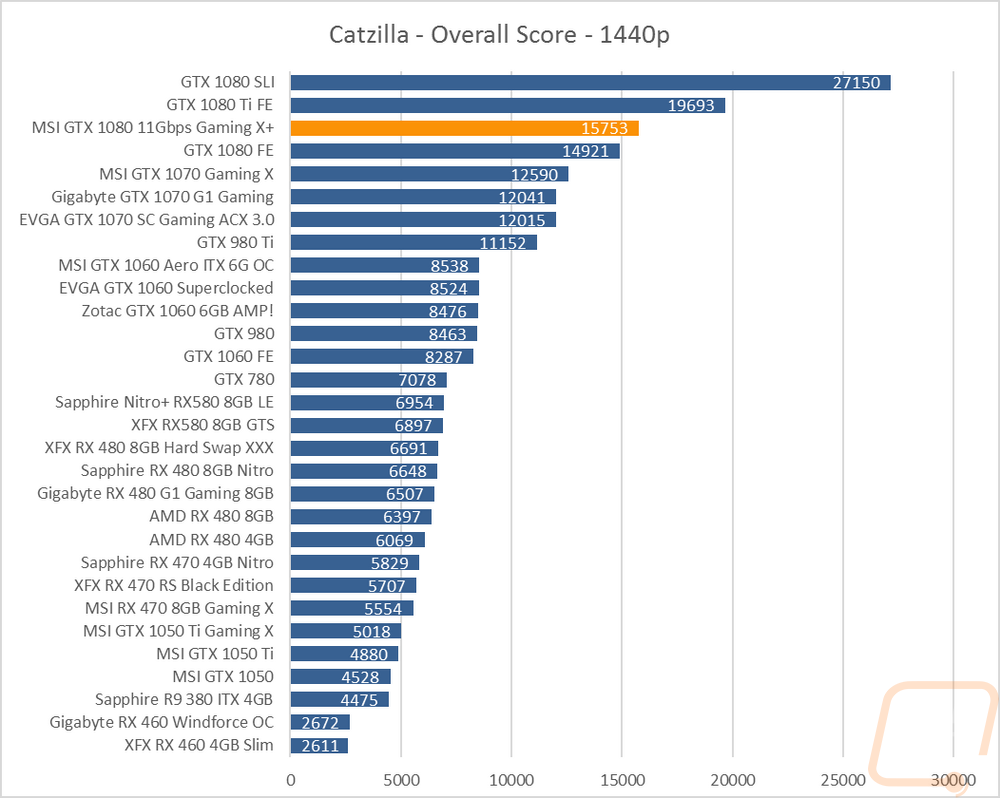
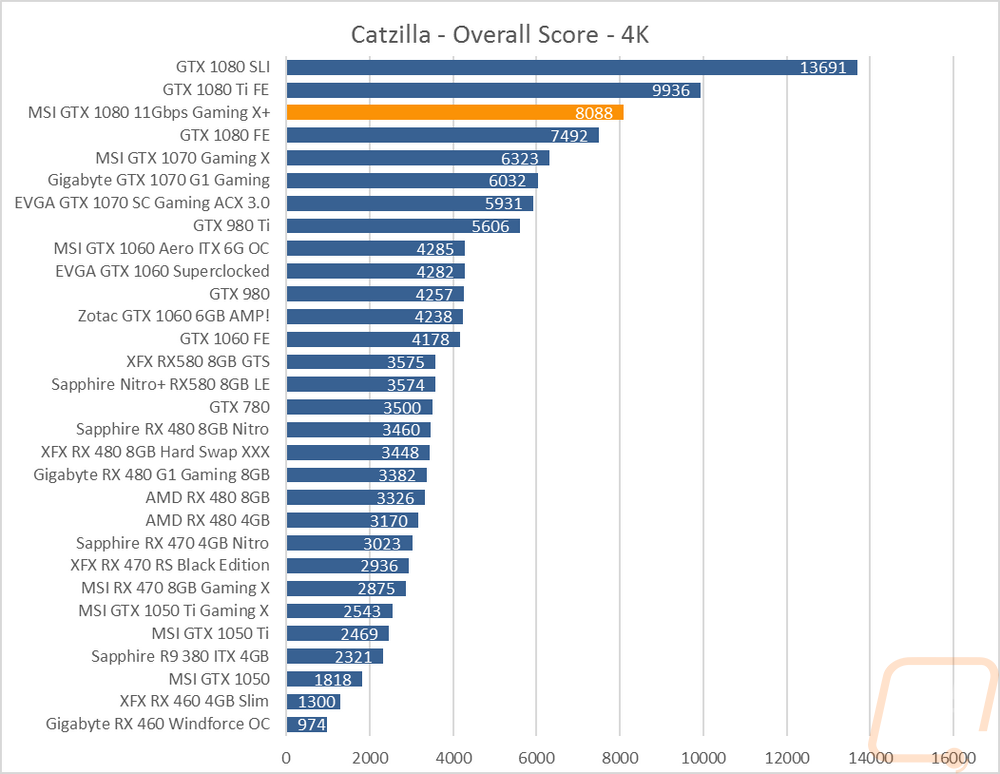
All three tests in Catzilla had a similar outcome as well with the 1080 Ti FE out ahead by a big margin and with the Gaming X+ ahead of the stock GTX 1080 by a decent amount.