Synthetic Benchmarks
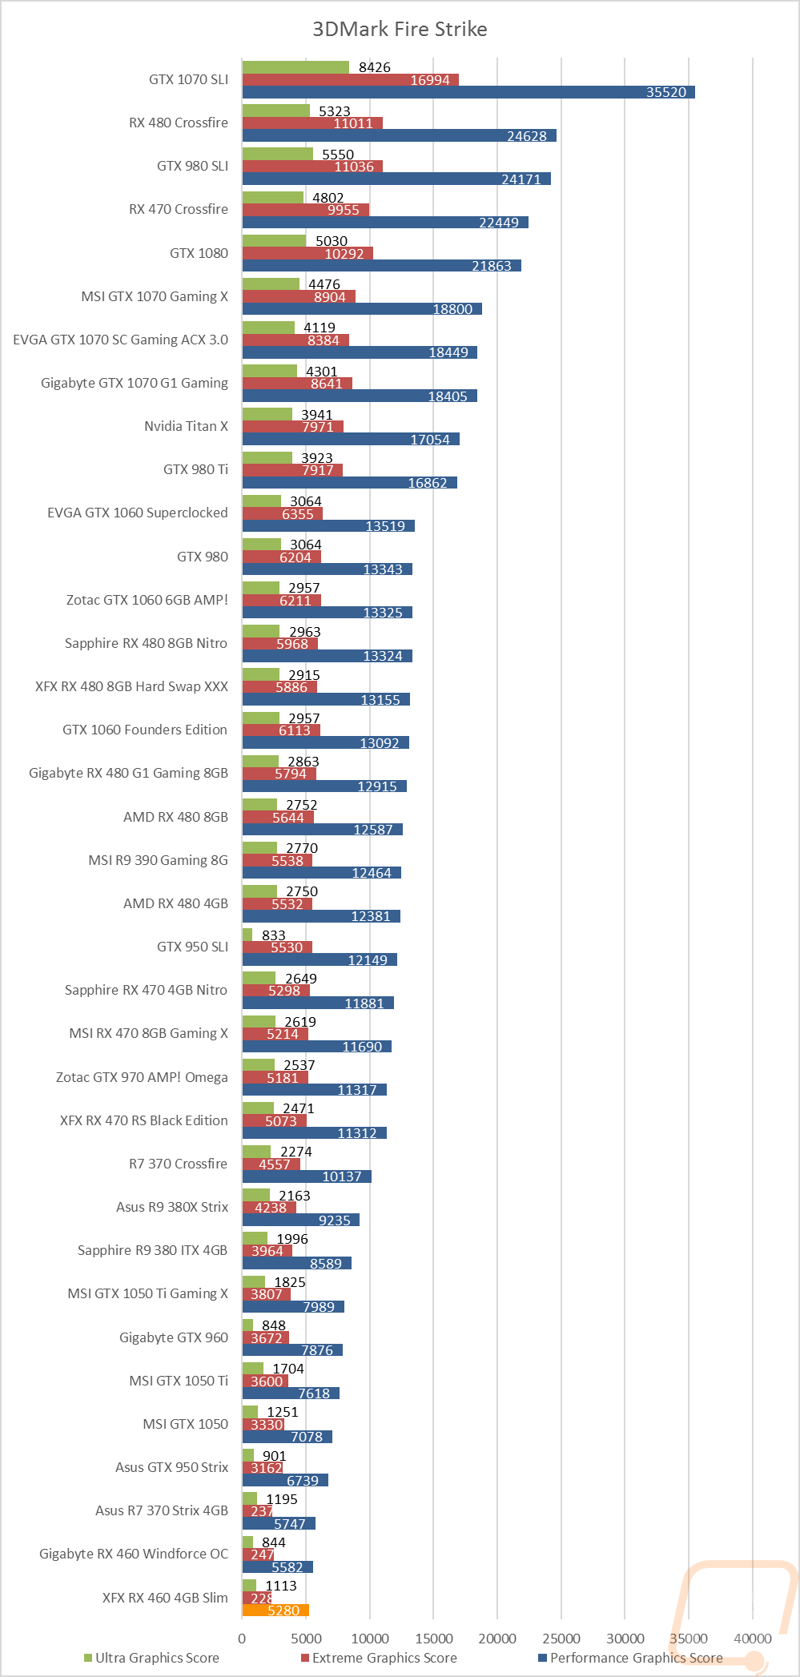
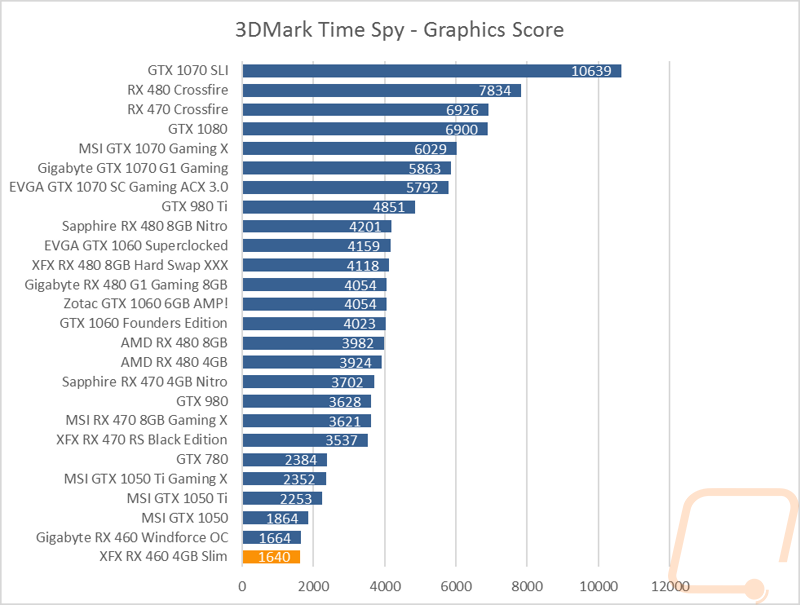
As always to start off my testing I put the XFX 460 Slim through a few synthetic benchmarks. These give me a reliable way to compare directly between cards. In the case of the RX 460 Slim, I’m especially focused on how it compares to other RX 460’s. I started off with 3DMark Fire Strike benchmarks at 1080p, 1440p, and 4k as well as the new Tim Spy benchmark. Well, the Slim ended up at the bottom of our charts, but that not too big of a surprise. This puts it right with the RX 460 from Gigabyte that I also tested. With a GPU score of 5280 on the performance setting, this is still well above what you can expect from any integrated solution. The Time Spy result was similar, with the two 460’s being just 24 points apart.
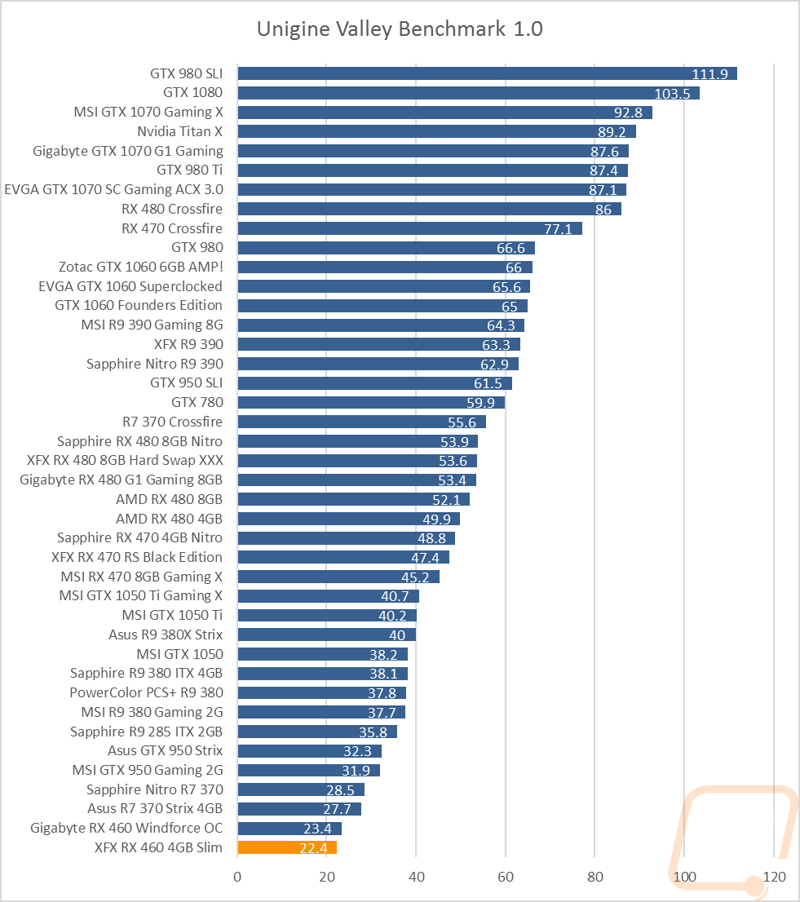
Once again the Slim was down at the boom of the chart in the Valley Benchmark along with the Gigabyte card. The gap was a full FPS, given the XFX card has more vRAM and is a touch higher on the clock speeds, I am curious if the single slot cooler was causing throttling, but I will find that out later on when we get into cooling.
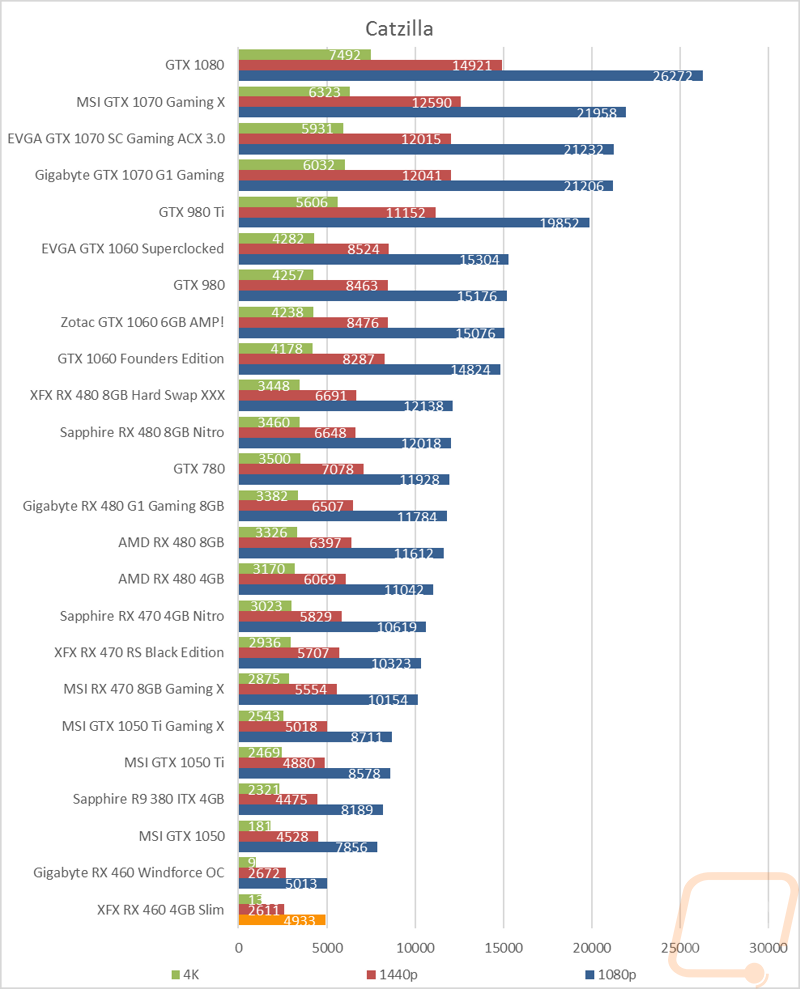
In Catzilla, the results were the same as the last few benchmarks. Interesting enough the 4GB of vRAM did help the 4k results, but they are still so bad that the graph bar isn’t big enough to fit the number. The 460 is a 1080p eSports gaming card meaning it really is only designed to handle the lighter and more popular games and it really shows here.
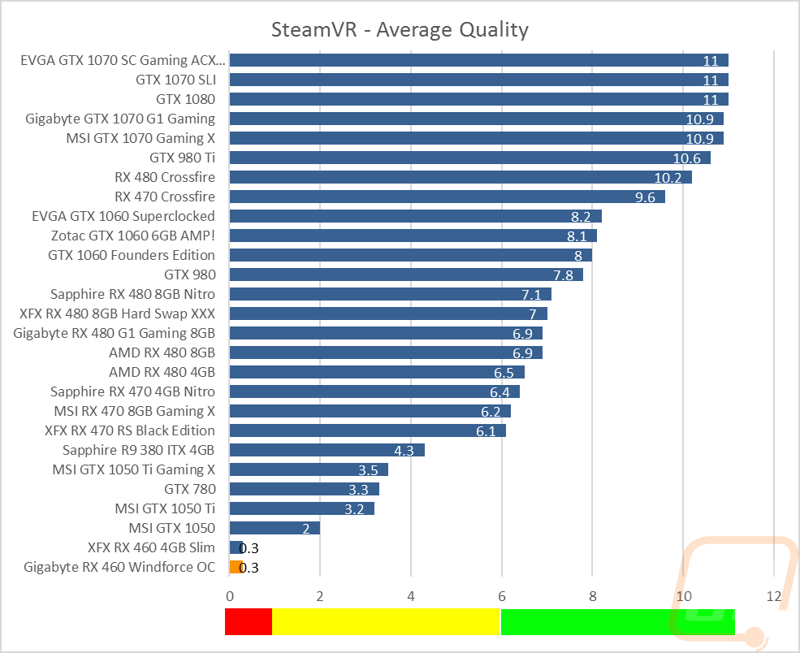
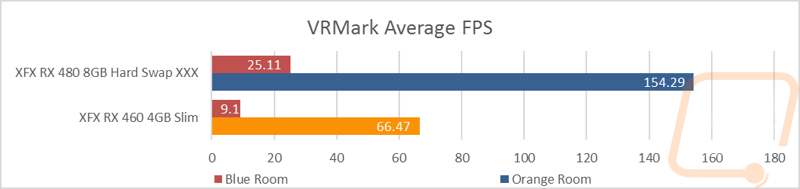
For kicks, I also included VR testing knowing full well that the card was never designed for it. Steam’s VR benchmark came out with an impressive 0.3 for the score but the VRMark Orange Room results were at least better at 66.47 FPS. It is still well below what you need for VR, but it at least shows the card does have some power behind it.